Article

Occurrence and Fate of Heavy Metals in Municipal Wastewater in Heilongjiang Province, China: A Monthly Reconnaissance from 2015 to 2017

1
Beijing Key Laboratory of Urban Hydrological Cycle and Sponge City Technology, College of Water Sciences, Beijing Normal University, Beijing 100875, China
2
Longjiang Environmental Protection Group CO., Ltd., Harbin 150 000, Heilongjiang, China
3
Laboratory of Earth Surface Processes, College of Urban and Environmental Sciences, Peking University, Beijing 100871, China
4
College of Oceanography, Hohai University, Nanjing 210098, Jiangsu, China
5
State Key Laboratory of Environmental Geochemistry, Institute of Geochemistry, Chinese Academy of Sciences, Guiyang 550081, China
6
Heilongjiang Kerui Testing Technology Co., Ltd., Harbin 150 000, Heilongjiang, China
*
Authors to whom correspondence should be addressed.
Water 2020, 12(3), 728; https://doi.org/10.3390/w12030728
Submission received: 7 January 2020 / Revised: 24 February 2020 / Accepted: 4 March 2020 / Published: 6 March 2020
(This article belongs to the Section Wastewater Treatment and Reuse)

Abstract

:
As one of the major sources of pollutions in the environments, effluents from municipal wastewater recently became a hot topic. This study quantified monthly county-level releases of five heavy metals, i.e., lead (Pb), cadmium (Cd), chromium (Cr), arsenic (As), and mercury (Hg), from municipal wastewater into the environment in the Heilongjiang Province of China, based on sampling, measurement, and modeling tools. Wastewater samples were collected from 27 municipal wastewater treatment plants (MWTPs) in 15 county-level cities of Heilongjiang every month from 2015 to 2017. The concentrations of five heavy metals were analyzed in both influents (Pb: 160 ± 100 μg/L; Cd: 15 ± 9.0 μg/L; Cr: 170 ± 64 μg/L; Hg: 0.67 ± 1.5 μg/L; As: 6.2 ± 4.8 μg/L) and effluents (Pb: 45 ± 15 μg/L; Cd: 5.2 ± 5.1 μg/L; Cr: 57 ± 13 μg/L; Hg: 0.28 ± 0.12 μg/L; As: 2.6 ± 1.4 μg/L). The removal ratios of the five heavy metals ranged from 50% to 67%. Inflow fluxes of Pb, Cr, and Cd displayed increasing trends first then decreased after reaching a maximum value, whereas those of Hg and Pb remained stable. Material flow analysis reveals that constructions of MWTPs are conducive to significantly reduce the releases of heavy metals from urban areas into the aquatic environment in the study area. Additionally, municipal wastewater sludge (used as fertilizer or spread on the land) could be a significant source of heavy metals in the land.

1. Introduction

Excessive heavy metals accumulation perturbs the environment and causes serious adverse health effects to organisms, including humans [1]. Arsenic (As), cadmium (Cd), and their compounds are classified as human carcinogens by several regulatory agencies [2,3,4]. The adverse effects of lead (Pb) and mercury (Hg) in humans are shown in mental development, causing neurological and cardiovascular diseases, especially in children [5,6]. Although a low dose of chromium (Cr) is essential to mammals, a high dose of Cr could induce significant renal damage, DNA strand breaks in peripheral lymphocytes, and respiratory cancers [7,8]. Human activities (industrial, domestic, agricultural, medical, etc.) significantly accelerate release of the naturally existing heavy metals into the environment [9]. For instance, human activities directly emitted 2500 tons/year of Hg into the atmosphere in recent years, accounting for 31% of the total emissions (including natural background and legacy sources) [10]. Dramatically, a total of 28,600 tons of As is emitted into the atmosphere annually, 14-times greater than emissions from natural sources [11]. Contamination by heavy metals has spread globally, including to all environment matrixes, such as the atmosphere, soil, sediment, fresh water, sea water, etc. [12]. Thus, an exact estimation of the amounts of heavy metals released into environmental systems and their fate is crucial for health risk assessment and policymaking.
While researchers have quantified the release of heavy metals from different sources, most previous studies focused on the atmospheric emission of heavy metals. For instance, Kristensen quantified the atmospheric Pb emission from leaded petrol consumption in Australia from 1933 to 2002, and the total emission was around 240,510 tons [13]. Wang et al. assessed the emission and mass balance of Hg in China’s coal-fired power plants [14]. Han et al. explained the effects of reaction conditions on the emission behaviors of heavy metals during wastewater sludge pyrolysis [15]. Some studies have quantified the flux of heavy metals into other environmental systems on a large scale [12,16,17]. However, due to the relatively scarce observation data, these processes have been rarely updated or refined in the past several decades. Additionally, information on the contributions from other sources is relatively lacking.
Municipal wastewater, a complex mixture including a large variety of pollutants from both domestic and industrial sources, has become an important anthropogenic source of pollution in aquatic environments [18,19,20]. Previous studies have focused on the release of some pollutants associated with municipal wastewater to aquatic environments (such as illicit drugs, phthalate esters, photoinitiators, chlorinated paraffins, polycyclic aromatic hydrocarbons, antibiotics, etc.) [21,22,23]. Liu et al. performed the first estimation of total Hg (including all forms of Hg) and methylmercury (MeHg) releases from municipal wastewater into the environment and found that municipal wastewater could be a significant source based on analyses of total Hg and MeHg in both influents and effluents of sewage across China [24]. A snapshot picture of the release of Hg from municipal wastewater in China was obtained: 160,000 kg of total Hg and 280 kg of MeHg to different environmental systems, respectively. While the study yielded useful insights into Hg release, it did not provide information on temporal variations, and the release of other heavy metals from municipal wastewater in China is still unknown.
The aim of this study was to quantify, for the first time, the monthly county-level release of heavy metals from municipal wastewater into the environment in a particular Province in China. The research was conducted in Heilongjiang Province, China, from 2015 to 2017. Each month, municipal wastewater samples of influent and effluent were collected at 27 municipal wastewater treatment plants (MWTPs) in 15 prefectural and county-level cities that cover all the geographic regions of the province. The concentrations of Pb, Cd, Cr, Hg, and As in the wastewater samples were analyzed to examine the temporal variations in flux and removal. Material flow analysis was applied to provide a comprehensive understanding of the release of target heavy metals from municipal wastewater into various sinks. This study is motivated by our recognition of the contribution of municipal wastewater to heavy metal contamination in the environment, and it is intended to support a further nationwide estimation and policymaking in China.

2. Materials and Methods

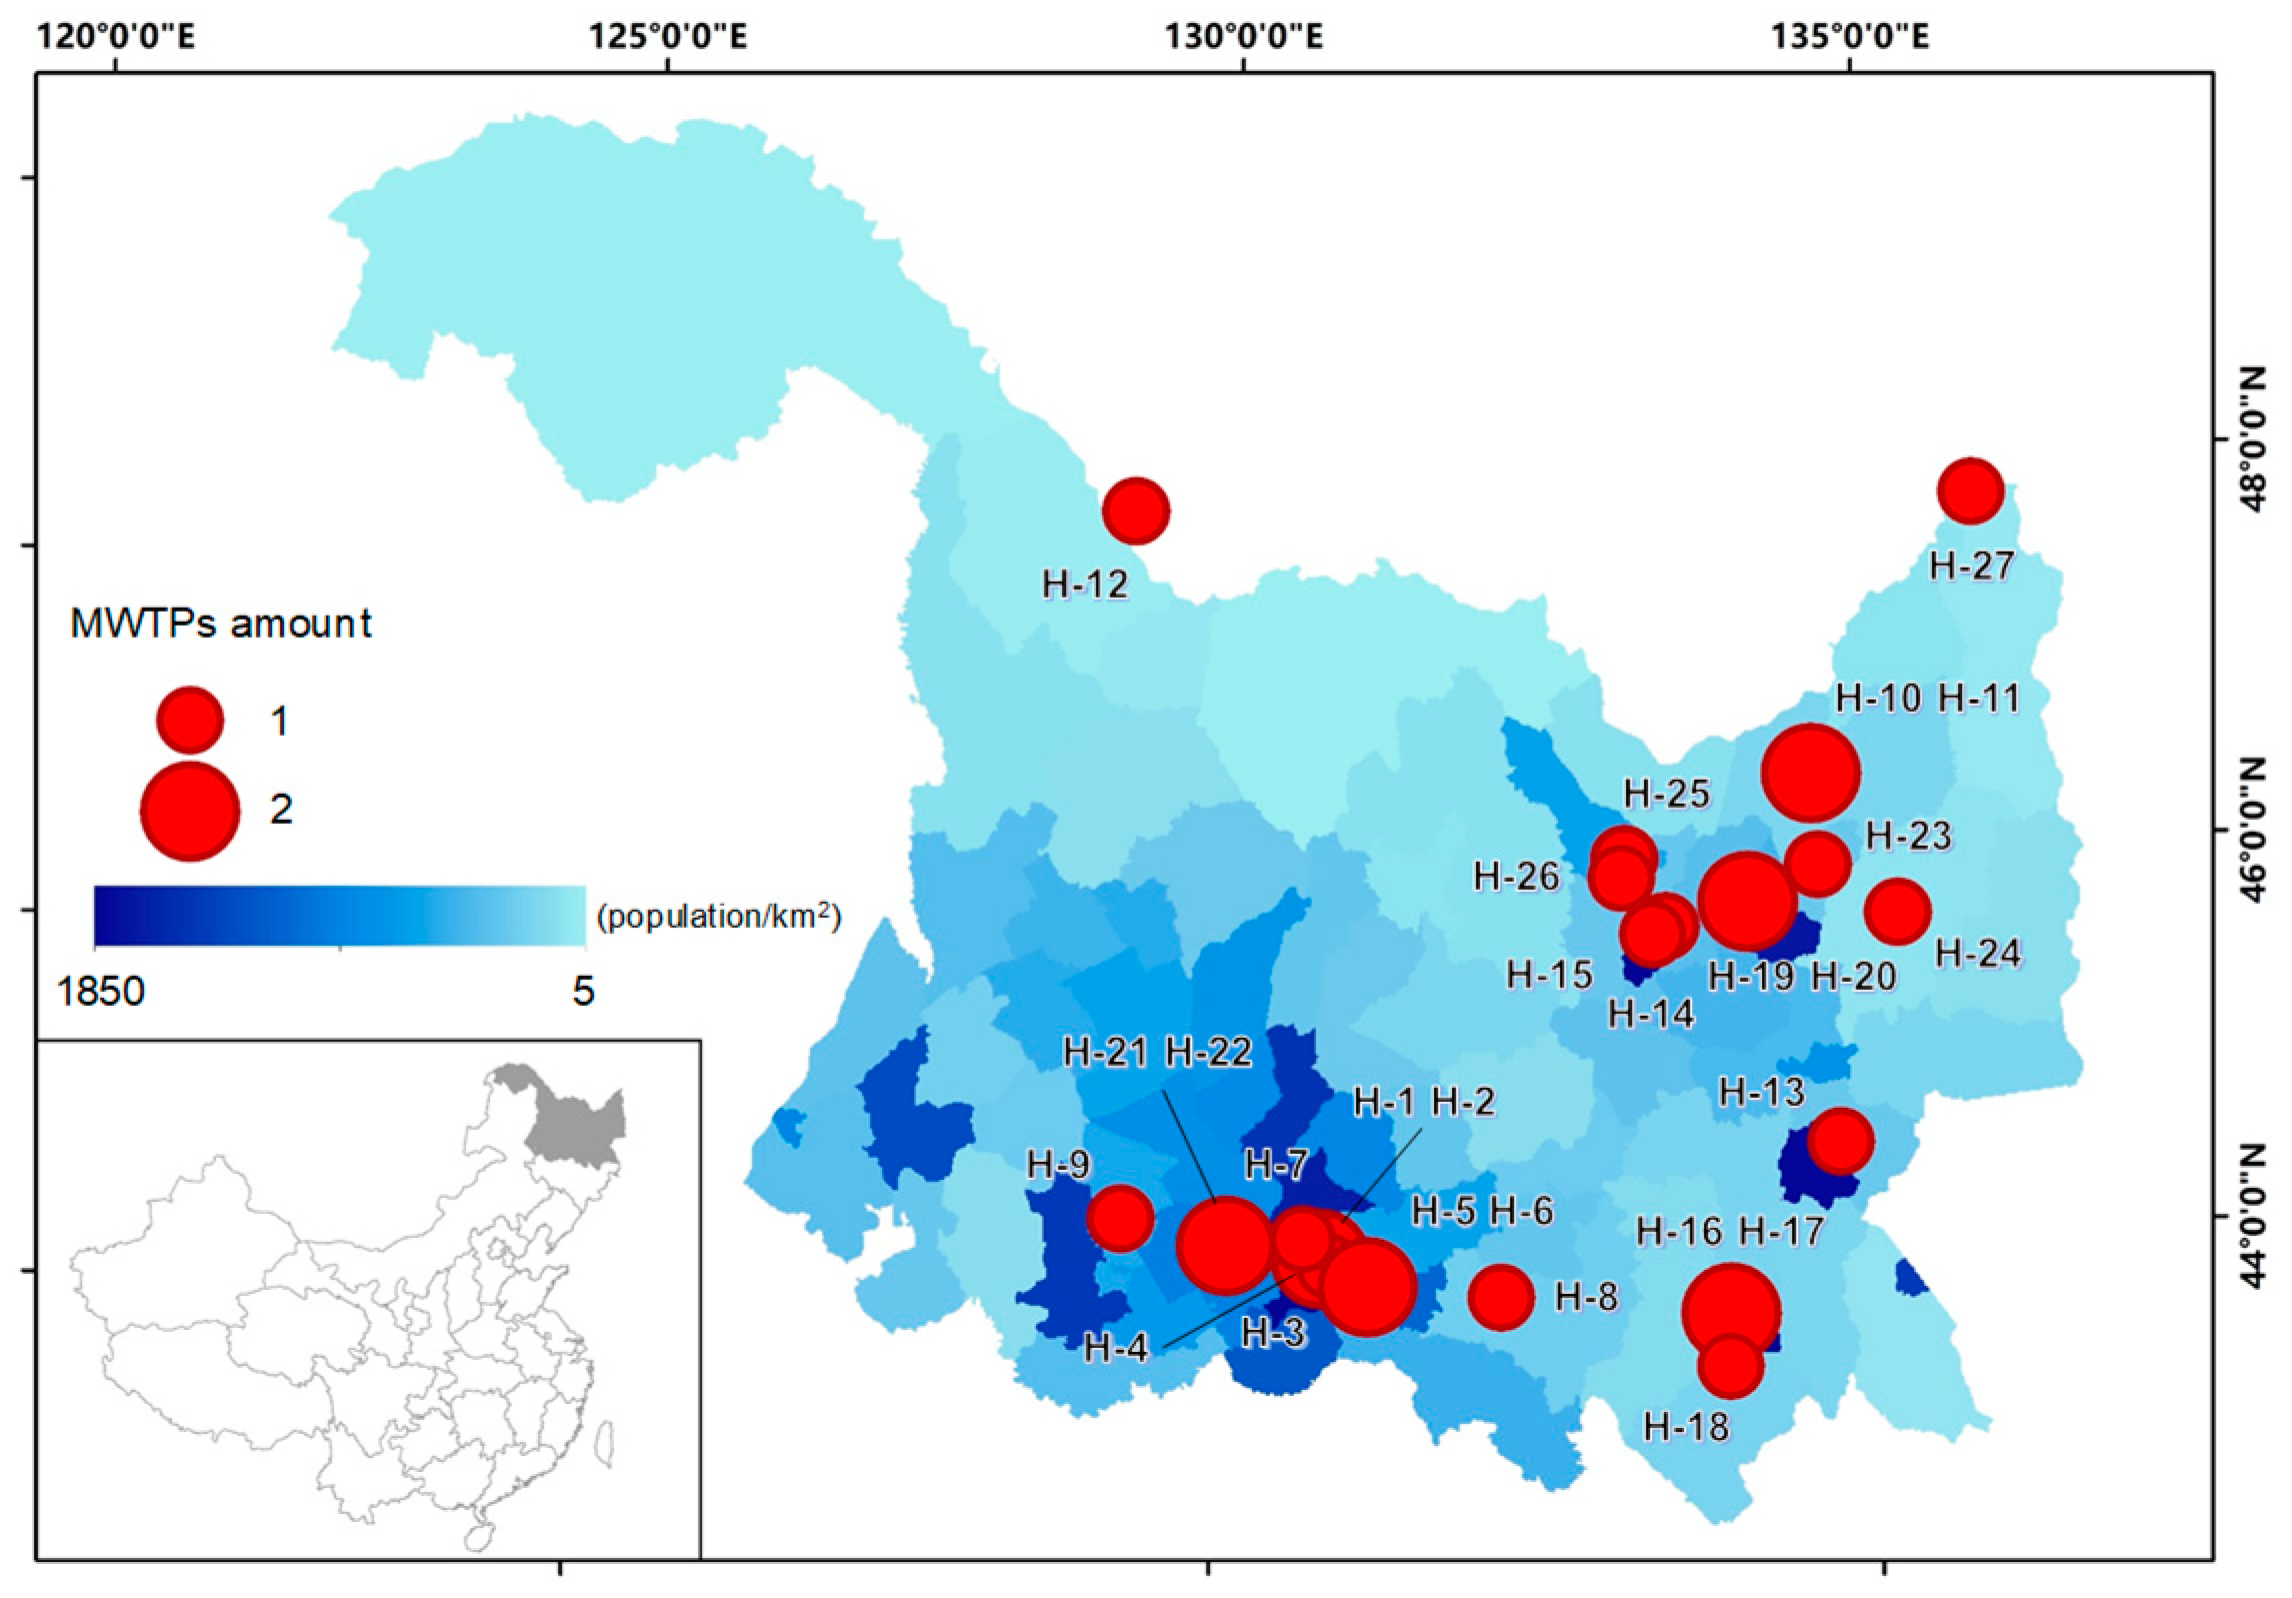
2.1. Sample Collection

Wastewater samples were collected from 27 MWTPs in 15 prefectural and county-level cities of Heilongjiang Province, China. In each of these cities, one or two MWTPs were selected for wastewater sample collection, based on the population distribution in Heilongjiang Province (Figure 1). For some major cities in the province with large populations, such as Harbin (9.6 million inhabitants in 2017) [25], wastewater samples were collected from four MWTPs. According to a recent census, the total population of all the selected cities was more than 25 million in the year 2017 [25], representing about 70% of the entire population of Heilongjiang Province. The methods of sample collection and preservation were according to a previous publication [26] and MEE (Ministry of Ecology and Environment of China) methods (HJ/T 91-2002). Time-proportional composite influent and effluent wastewater samples were collected every month from January to December of 2015 to 2017. Days that experienced heavy precipitation were avoided for sampling purposes to minimize the dilution. All samples were carried back to the laboratory and stored at 4 °C for less than 7 days until analysis. Details of the MWTPs and sampling information are listed in the Supplementary Materials (Table S1).

2.2. Analytical Methodology

Standard solutions of Pb, Cr, Cd, Hg, and As were obtained from the Institute for Environmental Reference Materials of Ministry of Environmental Protection (Beijing, China). Hydrochloric acid (HCl), perchloric acid (HClO4), and hydrogen peroxide (H2O2) were purchased from Kemiou Chemical Reagent Co. (Tianjin, China), and nitric acid (HNO3) was purchased from Jingrui Chemical Co., LTD. (Suzhou, China). Ultrapure water was prepared using a Milli-Q ultrapure system (Millipore, MA, USA).
Determination of the heavy metals in wastewater samples was performed based on methods that were commonly used in previous research and on MEE (Ministry of Ecology and Environment of China) methods (HJ 694-2014, HJ 757-2015, and GB/T 7475-1987) with minor modifications [27,28]. Sample pretreatment and determination were performed at the Heilongjiang Kerui Testing Technology Co., LTD (Harbin, China). For As, heating digestion of samples was conducted using nitric–perchloric acid (5 mL, 1:1, v/v) and hydrochloric acid solution (5 mL, 1:1, v/v), then samples were analyzed using an AFS-8220 atomic fluorescence spectrometer (Beijing Titian Instruments Co., LTD, Beijing, China). For Hg, water bath heating (100 °C) digestion (1 h) of samples was conducted using hydrochloric–nitric acid solution (1 mL, 3:1:4, v/v/v), then samples were analyzed via an AFS-8220 atomic fluorescence spectrometer. For Pb and Cd, nitric acid (5 mL) and hydrogen peroxide (10 mL) were employed for sample heating digestion, palladium nitrate (10 mL) was added, then samples were analyzed using a GF-AAS (ASC-990, Beijing Purkinje General Instrument Co., LTD., Beijing, China). For Cr, nitric acid (5 mL) and hydrogen peroxide (3 mL) were employed for sample heating digestion (180/95 °C), ammonium chloride (5 mL) and hydrochloric acid were added, then samples were analyzed using a TAS-990F atomic absorption spectrophotometer (Beijing Purkinje General Instrument Co., LTD., Beijing, China). Influent and effluent wastewater samples were taken in triplicate for analysis. The limits of detection (LOD) for As, Hg, Pb, Cd, and Cr were 1.0 μg/L, 0.10 μg/L, 5.0 μg/L, 0.50 μg/L, and 15 μg/L, respectively. The spike recoveries of the standards of As ranged from 92% to 109%, Hg ranged from 92% to 104%, Pb ranged from 92% to 107%, Cd ranged from 83% to 105%, and Cr ranged from 95% to 107%. All the measurement results were adjusted by individual internal standard spike recoveries.

2.3. Material Flow Analysis

Material flow analysis is widely used as a tool to provide a system-oriented view of the sources, sinks, and relative processes of contaminant transport, such as carbon, nutrients, organic pollutants, and trace elements, in both natural and industrial systems [29,30,31,32]. In the present study, we specifically used this effective tool to quantitatively understand the transport and fate of Pb, Cd, Cr, Hg, and As embodied in municipal wastewater in Heilongjiang province. Estimates of material flows for all the metals considered direct releases into the environments, influent and effluent wastewater of MWTPs, accumulation in wastewater sludge, and a final step of release into the terrestrial ecosystem and landfill [24]. Calculations performed in the analysis were made based on the mass balance of each heavy metal to ensure that the amount of each heavy metal in the source was equal to the amount in the sinks as below:
S o u r c e i j = U n t r e a t e d i + I n f l u e n t i j   ,
where S o u r c e i j is the amount of source of heavy metal i (kg/month) in the service area of municipal treatment plant j; U n t r e a t e d i and I n f l u e n t i j are the amounts of heavy metal i (kg/month) discharged into the aquatic environment and into the treatment plant j, respectively. In Equation (1), U n t r e a t e d i and I n f l u e n t i j could be further calculated as follows:
U n t r e a t e d i = C u n t r e a t e d ,   i × V u n t r e a t e d × K ,
I n f l u e n t i j = C i n f l u e n t ,   i j × V i n f l u e n t , j × K   ,
where C i n f l u e n t ,   i is the concentration of heavy metal i (μg/L) in the untreated wastewater; V u n t r e a t e d is the volume of municipal wastewater (m3/month) directly discharged to the aquatic environment; C i n f l u e n t ,   i j is the concentration of heavy metal i (μg/L) in the influent wastewater of municipal treatment plant j that is measured in the present study; V u n t r e a t e d , j is the volume of municipal wastewater (m3/month) discharged into the aquatic environment in the service area in municipal treatment plant j; V i n f l u e n t , j is the volume of municipal wastewater (m3/month) discharged into the municipal treatment plant j; and K in Equations (1) and (2) is a unit conversion coefficient. Similarly, the amount of heavy metal i released from municipal treatment plant j can be calculated as follows:
E f f l u e n t i j = C e f f l u e n t ,   i j × V e f f l u e n t , j × K ,
where E f f l u e n t i j is the amount of heavy metal i (kg/month) released from municipal treatment plant j into the aquatic environment; C e f f l u e n t ,   i j is the concentration of heavy metal i (μg/L) in the effluent wastewater of municipal treatment plant j that is measured in the present study; V e f f l u e n t , j is the volume of municipal wastewater (m3/month) discharged from the municipal treatment plant j into the aquatic environment in the service area.
Substantial amounts of heavy metal that are discharged into MWTPs might potentially be stored in wastewater sludge during the treatment process. Following the published literature [24], the amounts of heavy metals that are accumulated in the wastewater sludge of municipal treatment plants were estimated as follows:
S l u d g e i j = I n f l u e n t i j E f f l u e n t i j   ,
where S l u d g e i j represents the amount of heavy metal i (kg/month) accumulated in the wastewater sludge of municipal treatment plant j. In the present study, the fate of wastewater sludge from MWTPs in Heilongjiang province was investigated, and landfill, cropland, and incineration plants were identified. Based on our investigation in the study area, the fate of the heavy metals in wastewater sludge can be further described as follows:
S l u d g e i j = L a n d f i l l i j + C r o p l a n d i j + I n c i n e r a t i o n i j   ,
where L a n d f i l l i j is the amount of heavy metal i released from municipal treatment plant j that is stored in a landfill (kg/month); C r o p l a n d i j is the amount of heavy metal i from municipal treatment plant j that is transported to cropland as a fertilizer (kg/month); and I n c i n e r a t i o n i j is the amount of heavy metal i from municipal treatment plant j that is transported to incineration plants (kg/month). According to our investigation, there is no other application of wastewater sludge in the study area.
Finally, the amounts of heavy metal transported into sinks are equal to the amounts from their sources were ensured, which can be further described by the following equation:
S i n k i j = L a n d f i l l i j + C r o p l a n d i j + I n c i n e r a t i o n i j + E f f l u e n t i j + U n t r e a t e d i j ,
Large or minor amounts of heavy metals might be emitted into the air from the incineration of municipal wastewater sludge. The amounts of metal emissions from incineration were further estimated. According to previous studies, 1%–20%, 40%–60%, <1%, 2%–40%, and 48% of Pb, Cd, Cr, As, and Hg, respectively, might be emitted into the atmosphere during the incineration process [24,33,34].
In the present study, the standard deviation (95% confidence interval) of fluxes of each heavy metal in the material flow analysis was calculated to characterize the uncertainty of the results. The variation of the measured concentration of each heavy metal was considered in the uncertainty analysis. Uniform distribution with a fixed coefficient of deviation (5%) was assumed for the statistical data of the volume of municipal wastewater generation, based on the published literature [24,35].

2.4. Data Sources

Census and incineration data were collected from Heilongjiang Bureau of Statistics [25]. The respective data of influent/effluent flows, power consumption, and produced and disposed sludge were provided by each MWTP.

2.5. Statistical Analysis

Statistical analysis was performed by SPSS 20 (IBM Co., Armonk, NY, USA), and significance levels were determined at p < 0.05 and p < 0.01. Pearson correlation analysis was used to assess the correlation between removal ratios of the five heavy metals and power consumption. Student’s t-test and One-NOVA were used to compare the differences in removal ratios and heavy metals flux in different years.

3. Results and Discussion

3.1. Occurrence of Heavy Metals in Municipal Wastewater
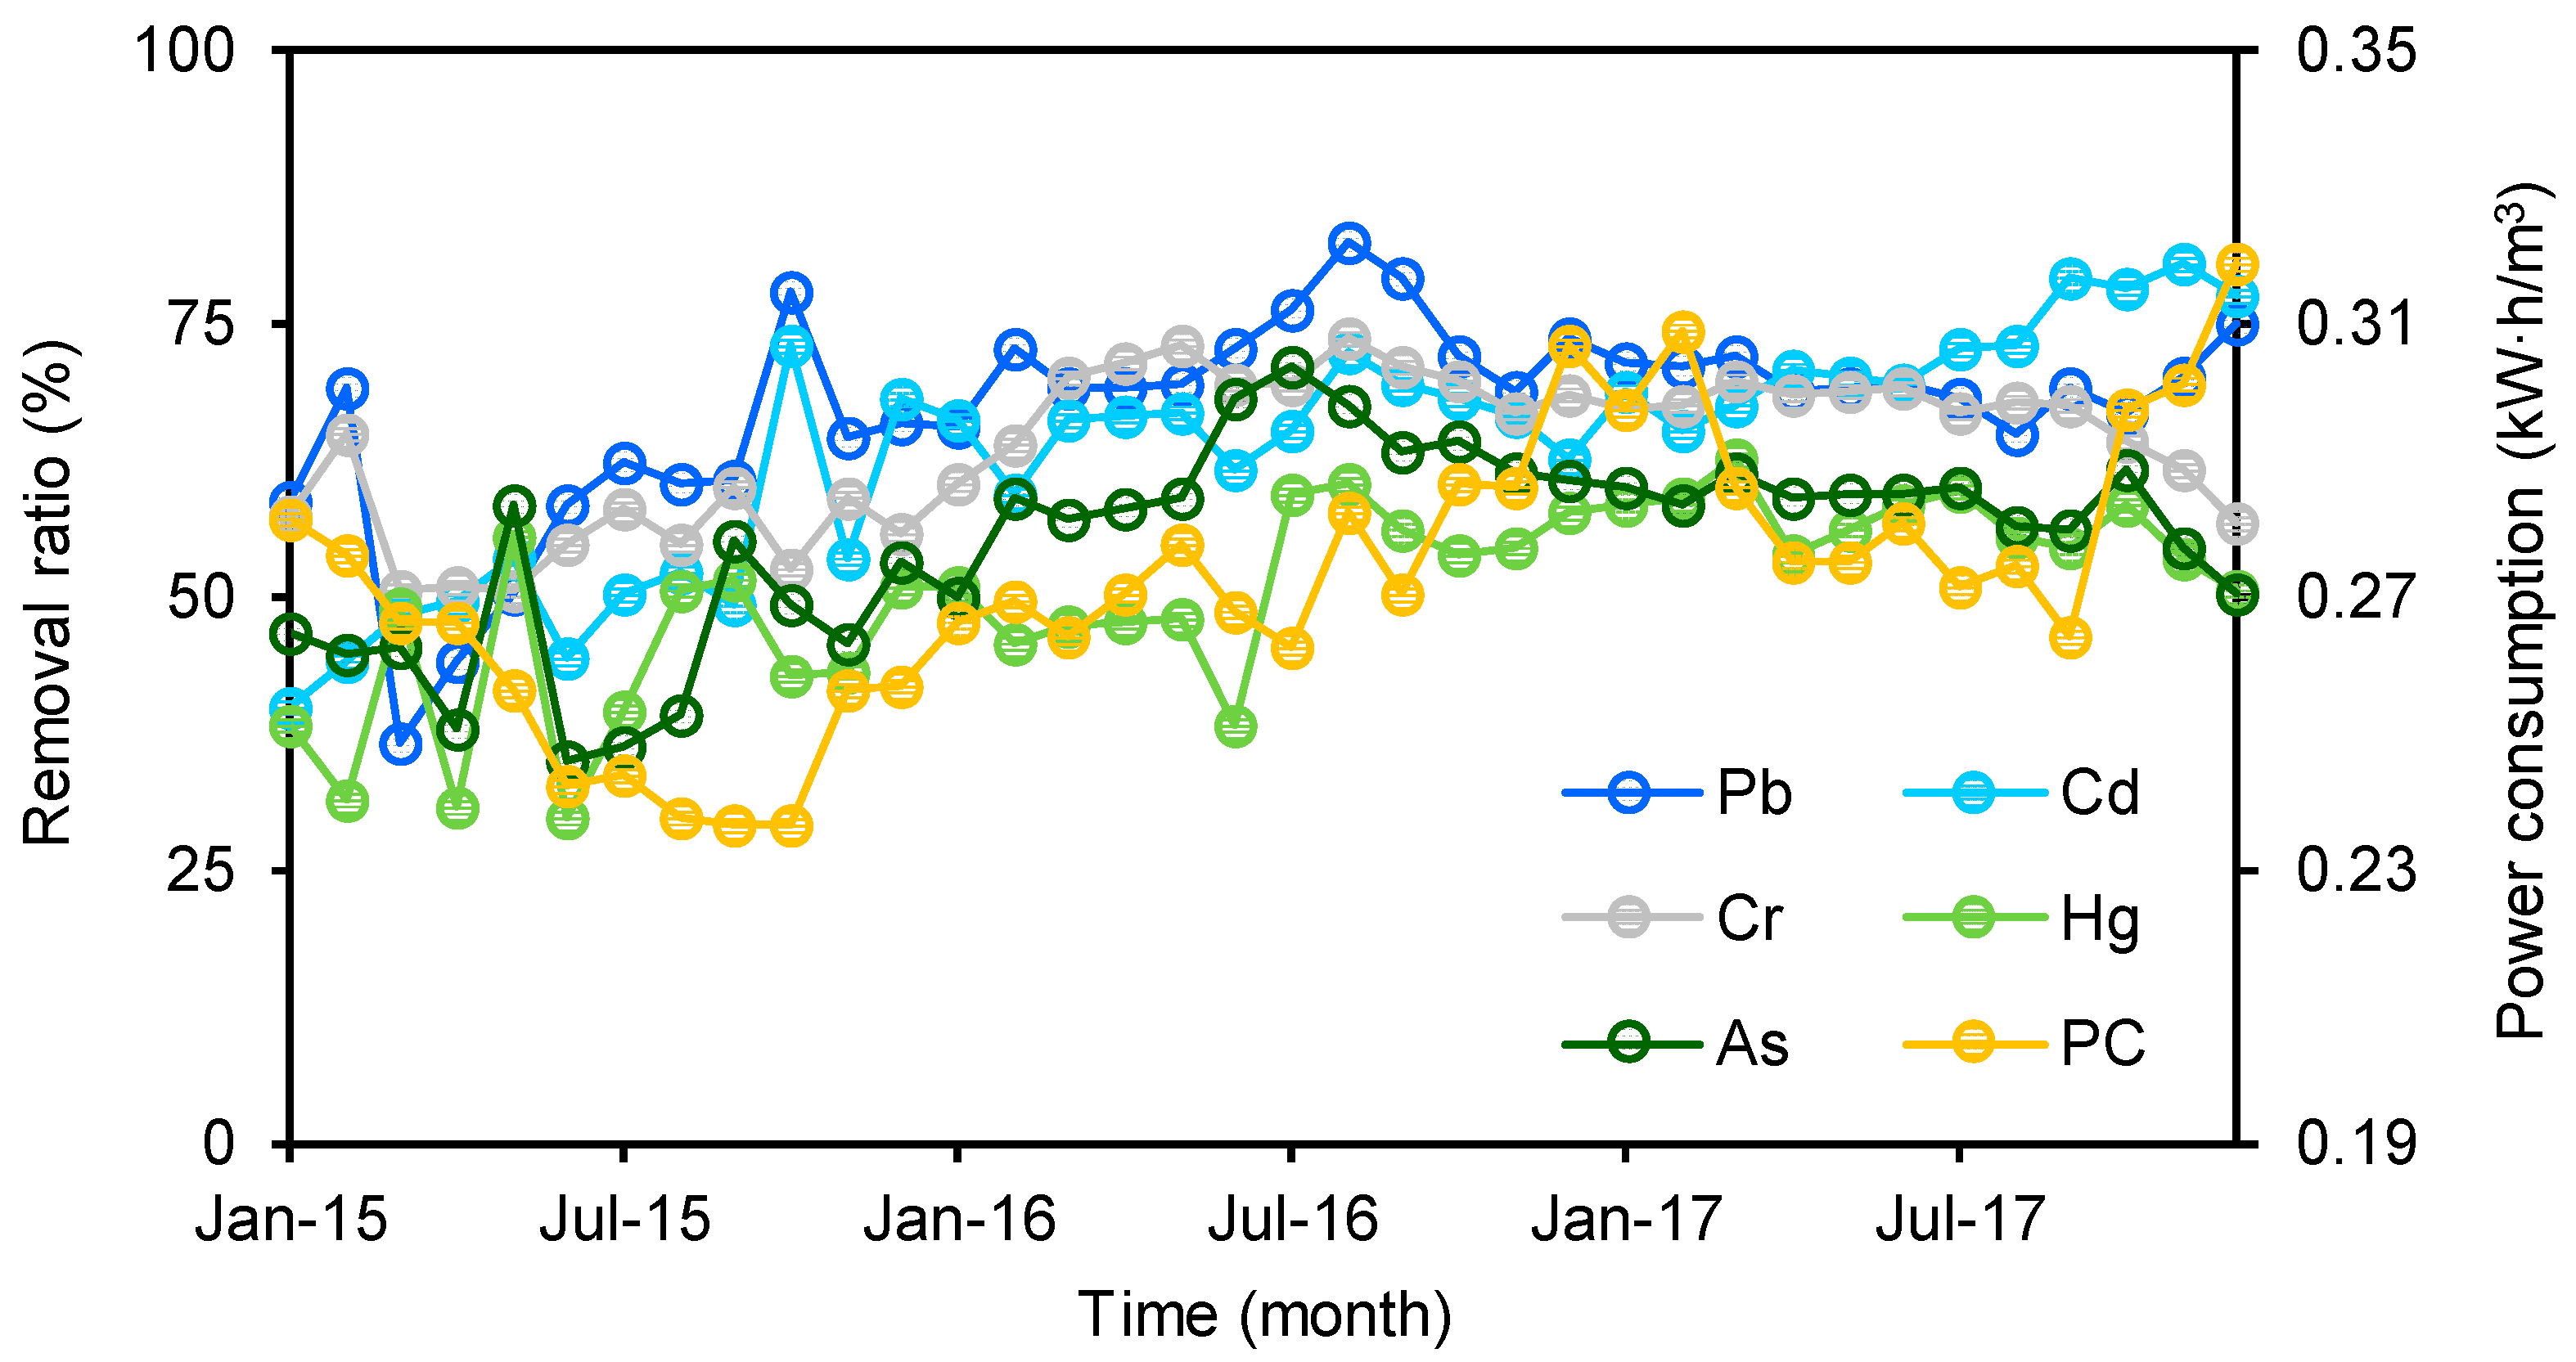
Pb, Cd, and Cr were detected in all the raw influent wastewater samples analyzed, with concentrations ranging from 44 μg/L to 940 μg/L (mean ± STD, 160 ± 100 μg/L), from 7.0 μg/L to 78 μg/L (mean ± STD, 15 ± 9.0 μg/L), and from 88 μg/L to 650 μg/L (mean ± STD, 170 ± 64 μg/L), respectively, in Heilongjiang from 2015 to 2017 (Table 1). Hg and As concentrations were below the LOD in only one and two raw influent wastewater samples, respectively, and above the LOD in the others. The maximum Hg and As concentrations in influent samples were 38 μg/L (mean ± STD, 0.67 ± 1.5 μg/L) and 95 μg/L (mean ± STD, 6.2 ± 4.8 μg/L), respectively (Table 1). The high detection frequencies of the mentioned targets in raw influents indicated that domestic releases are ubiquitous in Heilongjiang, which, in turn, indicated potentially high exposure levels to heavy metals for local inhabitants. Nevertheless, since the influent municipal wastewater in China may partly contain urban surface runoff and industrial wastewater discharge, it is not currently possible to use the heavy metals contained in influent water as an indicator of inhabitant exposure in the study area [24].
The five heavy metals were detected in most effluent samples, with detection frequencies of 99.5% (Pb), 99.5% (Cd), 99.7% (Cr), 99.5% (Hg), and 99.7% (As). Among the five analyzed heavy metals in effluents, Cr (57 ± 13 μg/L) had the highest mean concentration, followed by Pb (45 ± 15 μg/L). The average effluent concentrations of Cd, As, and Hg were all below 10 μg/L. The range, median, arithmetic mean concentrations, and standard deviations (STD) are presented in Table 1. The average influent and effluent concentrations of As, Cd, and Hg in this study were similar to those in other previous studies conducted in Italy, UK, Poland, Chungking, etc., but much lower than those in Spain. For Cr and Pb, the average influent and effluent concentrations were higher than those in most other countries and Chinese cities, but lower than those in Turkey for Cr and in the UK for Pb (Table 2). Compared with other countries (Table 2), the higher Pb concentration found in this study is consistent with the high blood Pb levels of Chinese citizens [36]. There is a relatively large variability in the concentrations of heavy metals in municipal wastewater in China. For instance, the average influent Pb concentrations in different cities in China were found to range from 4.1 to 480 μg/L [37,38,39,40]. The average influent Cd concentrations also ranged from 1.3 to 61 μg/L [37,38,39,40]. A similar situation was also found for the other three metals (Table 1). This reflects that MWTPs in different regions in China might receive heavy metals from different sources (for example, different types of industrial sources) [40]. Further investigation of the sources of heavy metals in municipal wastewater is needed.

3.2. Removal Ratios

The removal ratio was derived by dividing the difference between the influent and effluent concentrations at a MWTP by the influent concentrations. The average removal ratios of Pb (67 ± 9 %), Cd (64 ± 11%), and Cr (64 ± 7%) were higher than 60% in Heilongjiang, while Hg (50 ± 9%) and As (55 ± 9%) had lower removal ratios than the other three heavy metals. This means that more Hg and As compared to other target heavy metals entered receiving waters. The removal ratios of all five heavy metals in both 2016 and 2017 were significantly higher than those in 2015 (p < 0.05), and the lowest value of each target was found in 2015 (Figure 2). However, there was no significant difference in the removal ratio between 2016 and 2017 (p > 0.05). These results indicated that there were increasing trends in the removal ratios for all targets between 2015 and 2016; after 2016, they maintained a stable level (Figure 2). Additionally, the power consumption per ton of municipal wastewater in 2015 was significantly lower than those in 2016 and 2017 (p < 0.05), and no significant difference was found between the latter two years. This trend was similar to that of the removal ratios of the heavy metals. A significant positive correlation was found between the power consumption and removal ratios of all five heavy metals (Figure S1). In general, the removal ratio increases with power consumption. Thus, this correlation implies that the increasing trends of the removal ratios were potentially due to increases in treating efficiencies in these MWTPs. Due to the limitation of the sampling campaign (once a month), no several consecutive days of influent and effluent samples were obtained in a month, removal ratios of heavy metals in different treatment techniques subjected to large variation and cannot be compared in this study.
Compared with previous studies, the removal ratios of the five heavy metals in this study were at a moderate level. Overall, a large variation has been found in the removal ratios of the five heavy metals in different countries (Table 2). For instance, the average removal ratios range from 20% to 97% for As, 10% to 79% for Cd, 33% to 98% for Hg, 50% to 77% for Cr, and 30% to 96% for Pb. This is attributed to the fact that MWTPs are not designed for removing heavy metals, and the apparent removal in most of the cases is the result of the metals partitioning to the solid phase of the treatment systems [52]. Thus, the release of heavy metals from MWTPs into the environment should not be ignored.

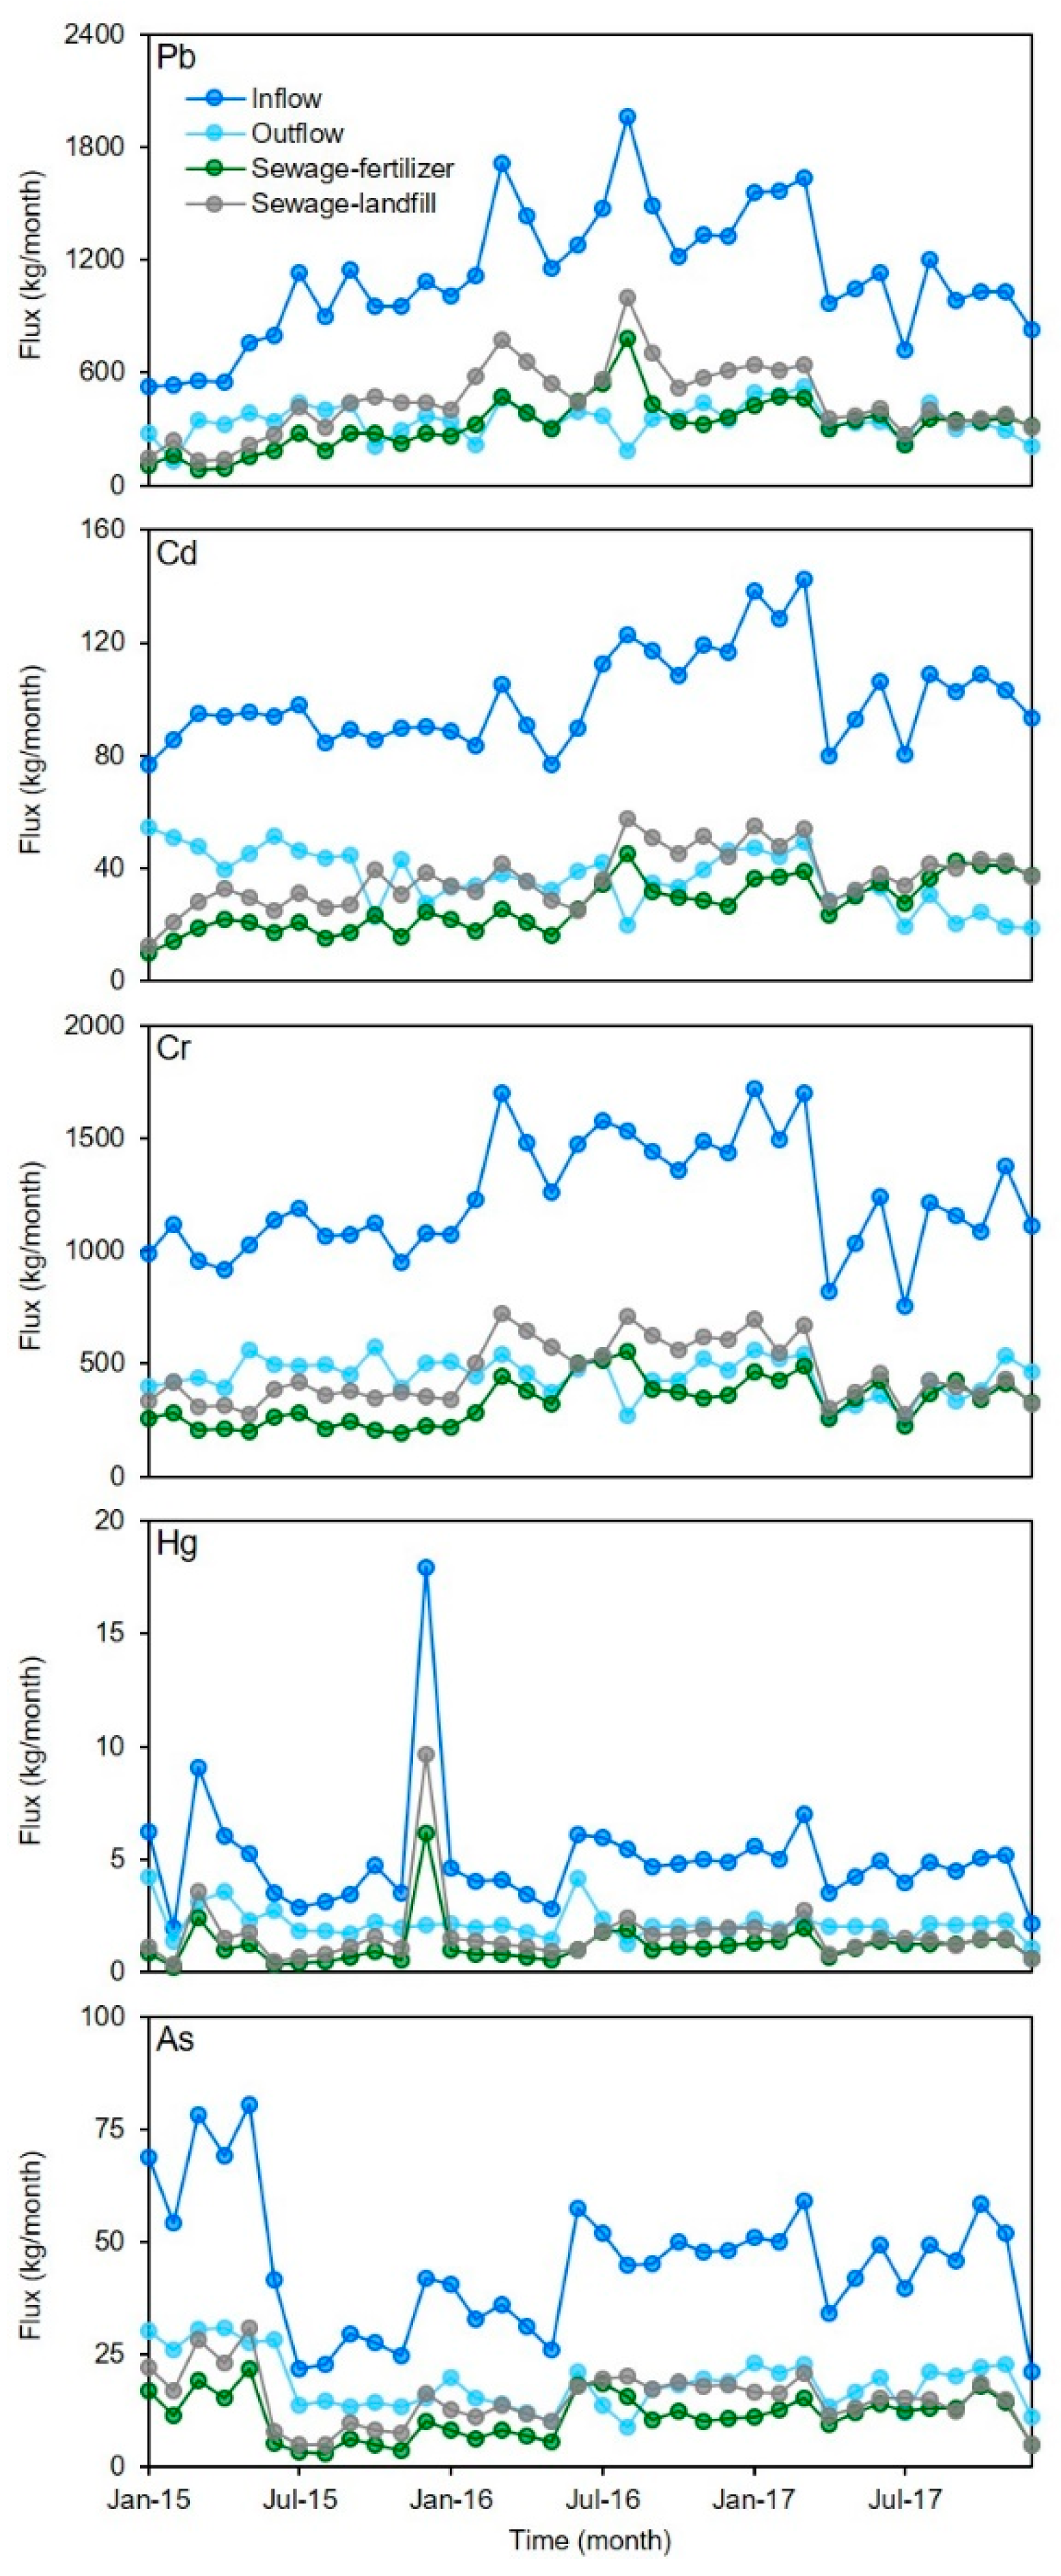
3.3. Variations of Heavy Metals Flux

The average inflow flux of Pb was 1100 ± 350 kg/month in the sampled MWTPs; the highest value was 2000 kg/month, occurring in August 2016, followed by 1700 kg/month (March 2016) and 1600 kg/month (March 2017), and the lowest value was 530/month kg (January 2015) (Figure 3). One-NOVA showed that there were no significant differences between Pb flux in different seasons (p > 0.05). Similar results were also found for Cd (average ± STD, 100 ± 17 kg/month), Cr (average ± STD, 1200 ± 250 kg/month), Hg (average ± STD, 5.0 ± 2.6 kg/month), and As flux (average ± STD, 45 ± 15 kg/month) (Figure 3). Although the temperature varies greatly in different seasons (average temperature ranged from −15 °C to 17 °C), there were no significant variations in the inflow flux of heavy metals in the study area. The total flux was 40,000 kg for Pb, 3600 kg for Cd, 44,000 kg for Cr, 180 kg for Hg, and 1600 kg for As from 2015 to 2017. For Pb, Cd, and Cr, the average flux in 2016 was significantly higher than those in 2015 and 2017 (p < 0.05) (Figure 3). The Pb, Cd, and Cr flux during the sampling period displayed an increasing trend initially, then decreased after a maximum value was reached. The flux variations of Hg and As were relatively stable compared with those of the other heavy metals between 2015 and 2017.
The average effluent fluxes of the five heavy metals ranged from 2.1 ± 0.69 kg/month (Hg) to 440 ± 86 kg/month (Cr) from 2015 to 2017 (Figure 3). The variations in effluent flux of the five heavy metals were more stable than those in influent flux due to the high removal ratios. The average Pb, Cd, Cr, Hg, and As fluxed for sludge-landfill were 320 ± 140 kg/month, 27 ± 9.4 kg/month, 330 ± 100 kg/month, 1.2 ± 0.98 kg/month, and 11 ± 5.0 kg/month from 2015 to 2017, respectively. The average fluxes for sludge-fertilizer were 450 ± 190 kg/month (Pb), 37 ± 10 kg/month (Cd), 460 ± 140 kg/month (Cr), 1.7 ± 1.5 kg/month (Hg), and 15 ± 6.0 kg/month (As) in the same period. In total, there were 2800 kg of Pb, 2300 kg of Cd, 28,000 kg of Cr, 100 kg of Hg, and 950 kg of As released from sludge from 2015 to 2017 in the study area. The variations in the five heavy metals’ fluxes in both landfill and fertilizer sludge were similar to those in influents. This means that most of the heavy metal was transferred to sludge during the municipal wastewater treatment process.
County-level inventories of Pb, Cd, Cr, Hg, and As released from municipal wastewater in Heilongjiang, China, in 2017, were constructed based on the fitting models (Figure 4). The results showed that the release of all five heavy metals was mainly concentrated in the cities and counties in the southwestern region of Heilongjiang Province. In this region, Harbin (the provincial capital) was the top contributor to the release of Pb, Cd, Cr, Hg, and As from municipal wastewater, followed by the cities Daqing and Qiqihar, and nearly one order of magnitude higher than other cities and counties. This was attributed to their higher population densities compared to other cities and counties. This result was similar to those of previous studies, which indicated that other anthropogenic emissions, such as black carbon, phosphorus, and antibiotics, are also high in Heilongjiang, China [35,53,54].

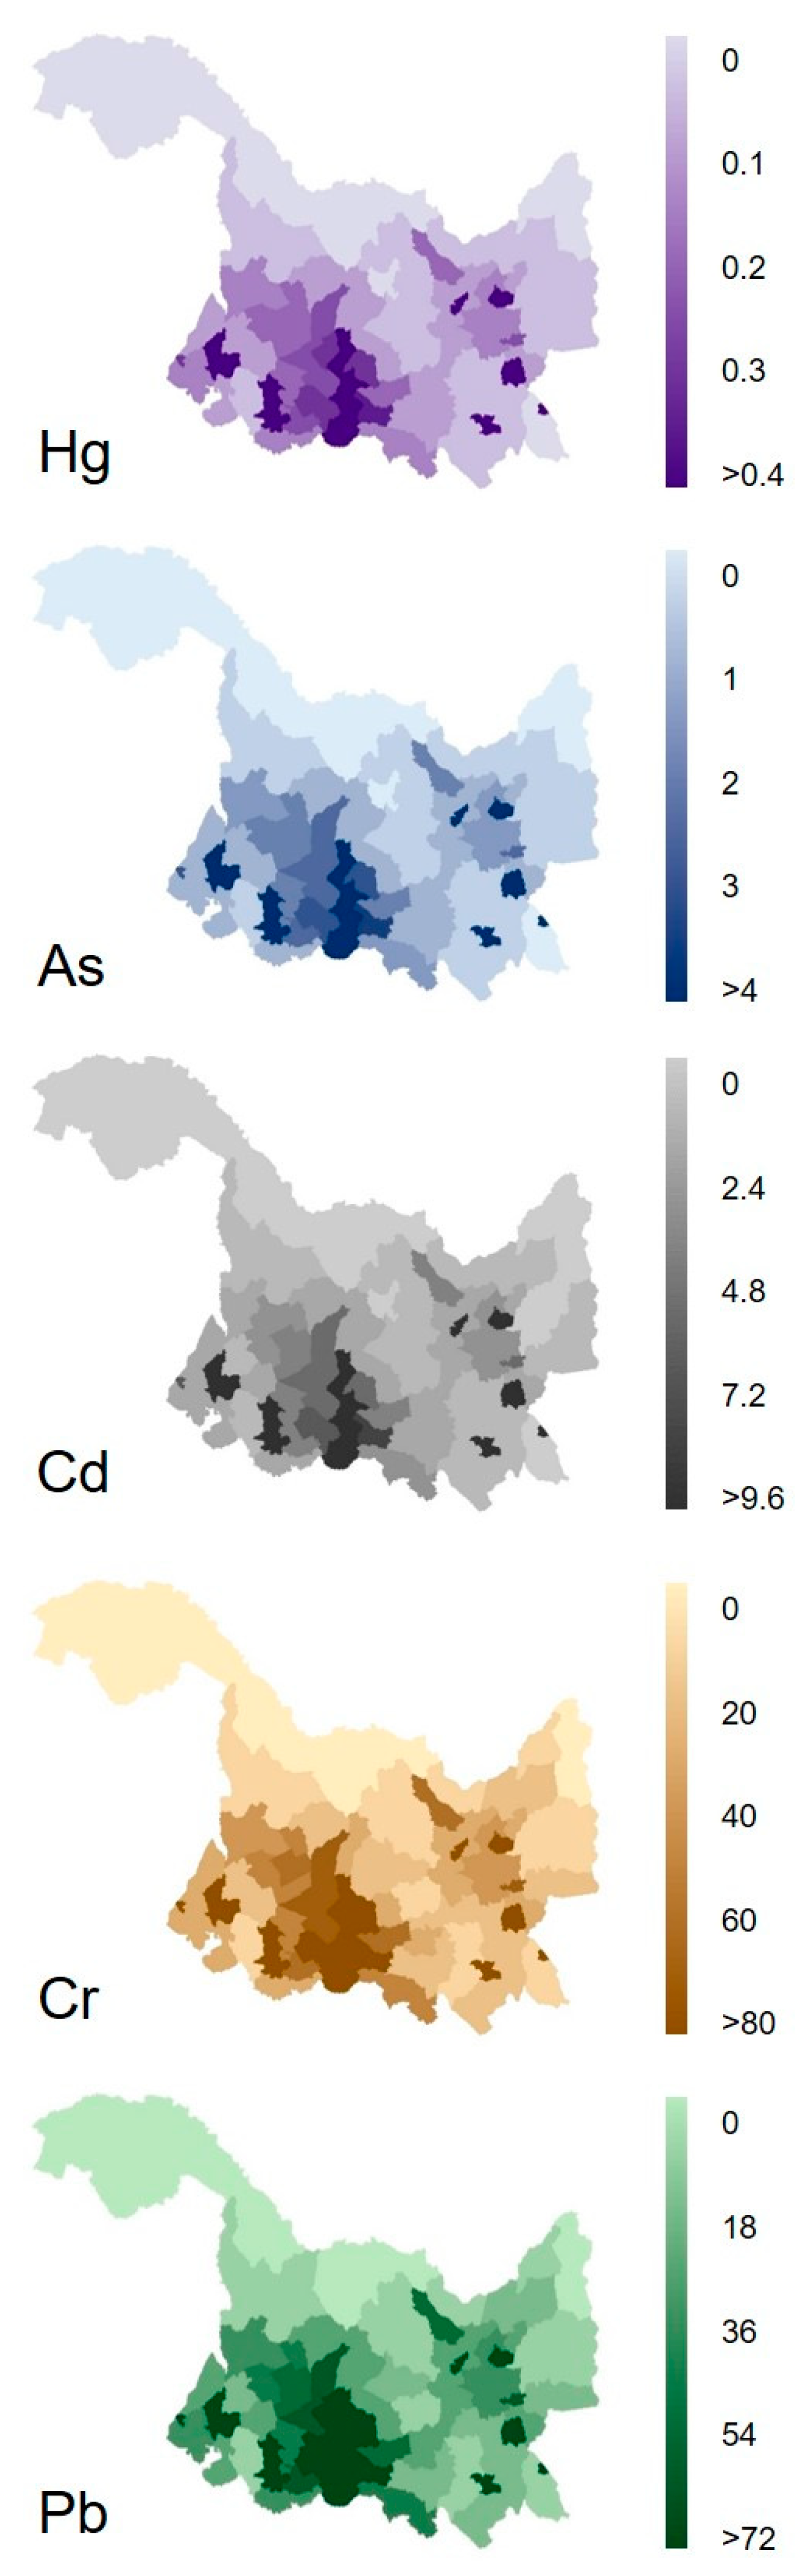
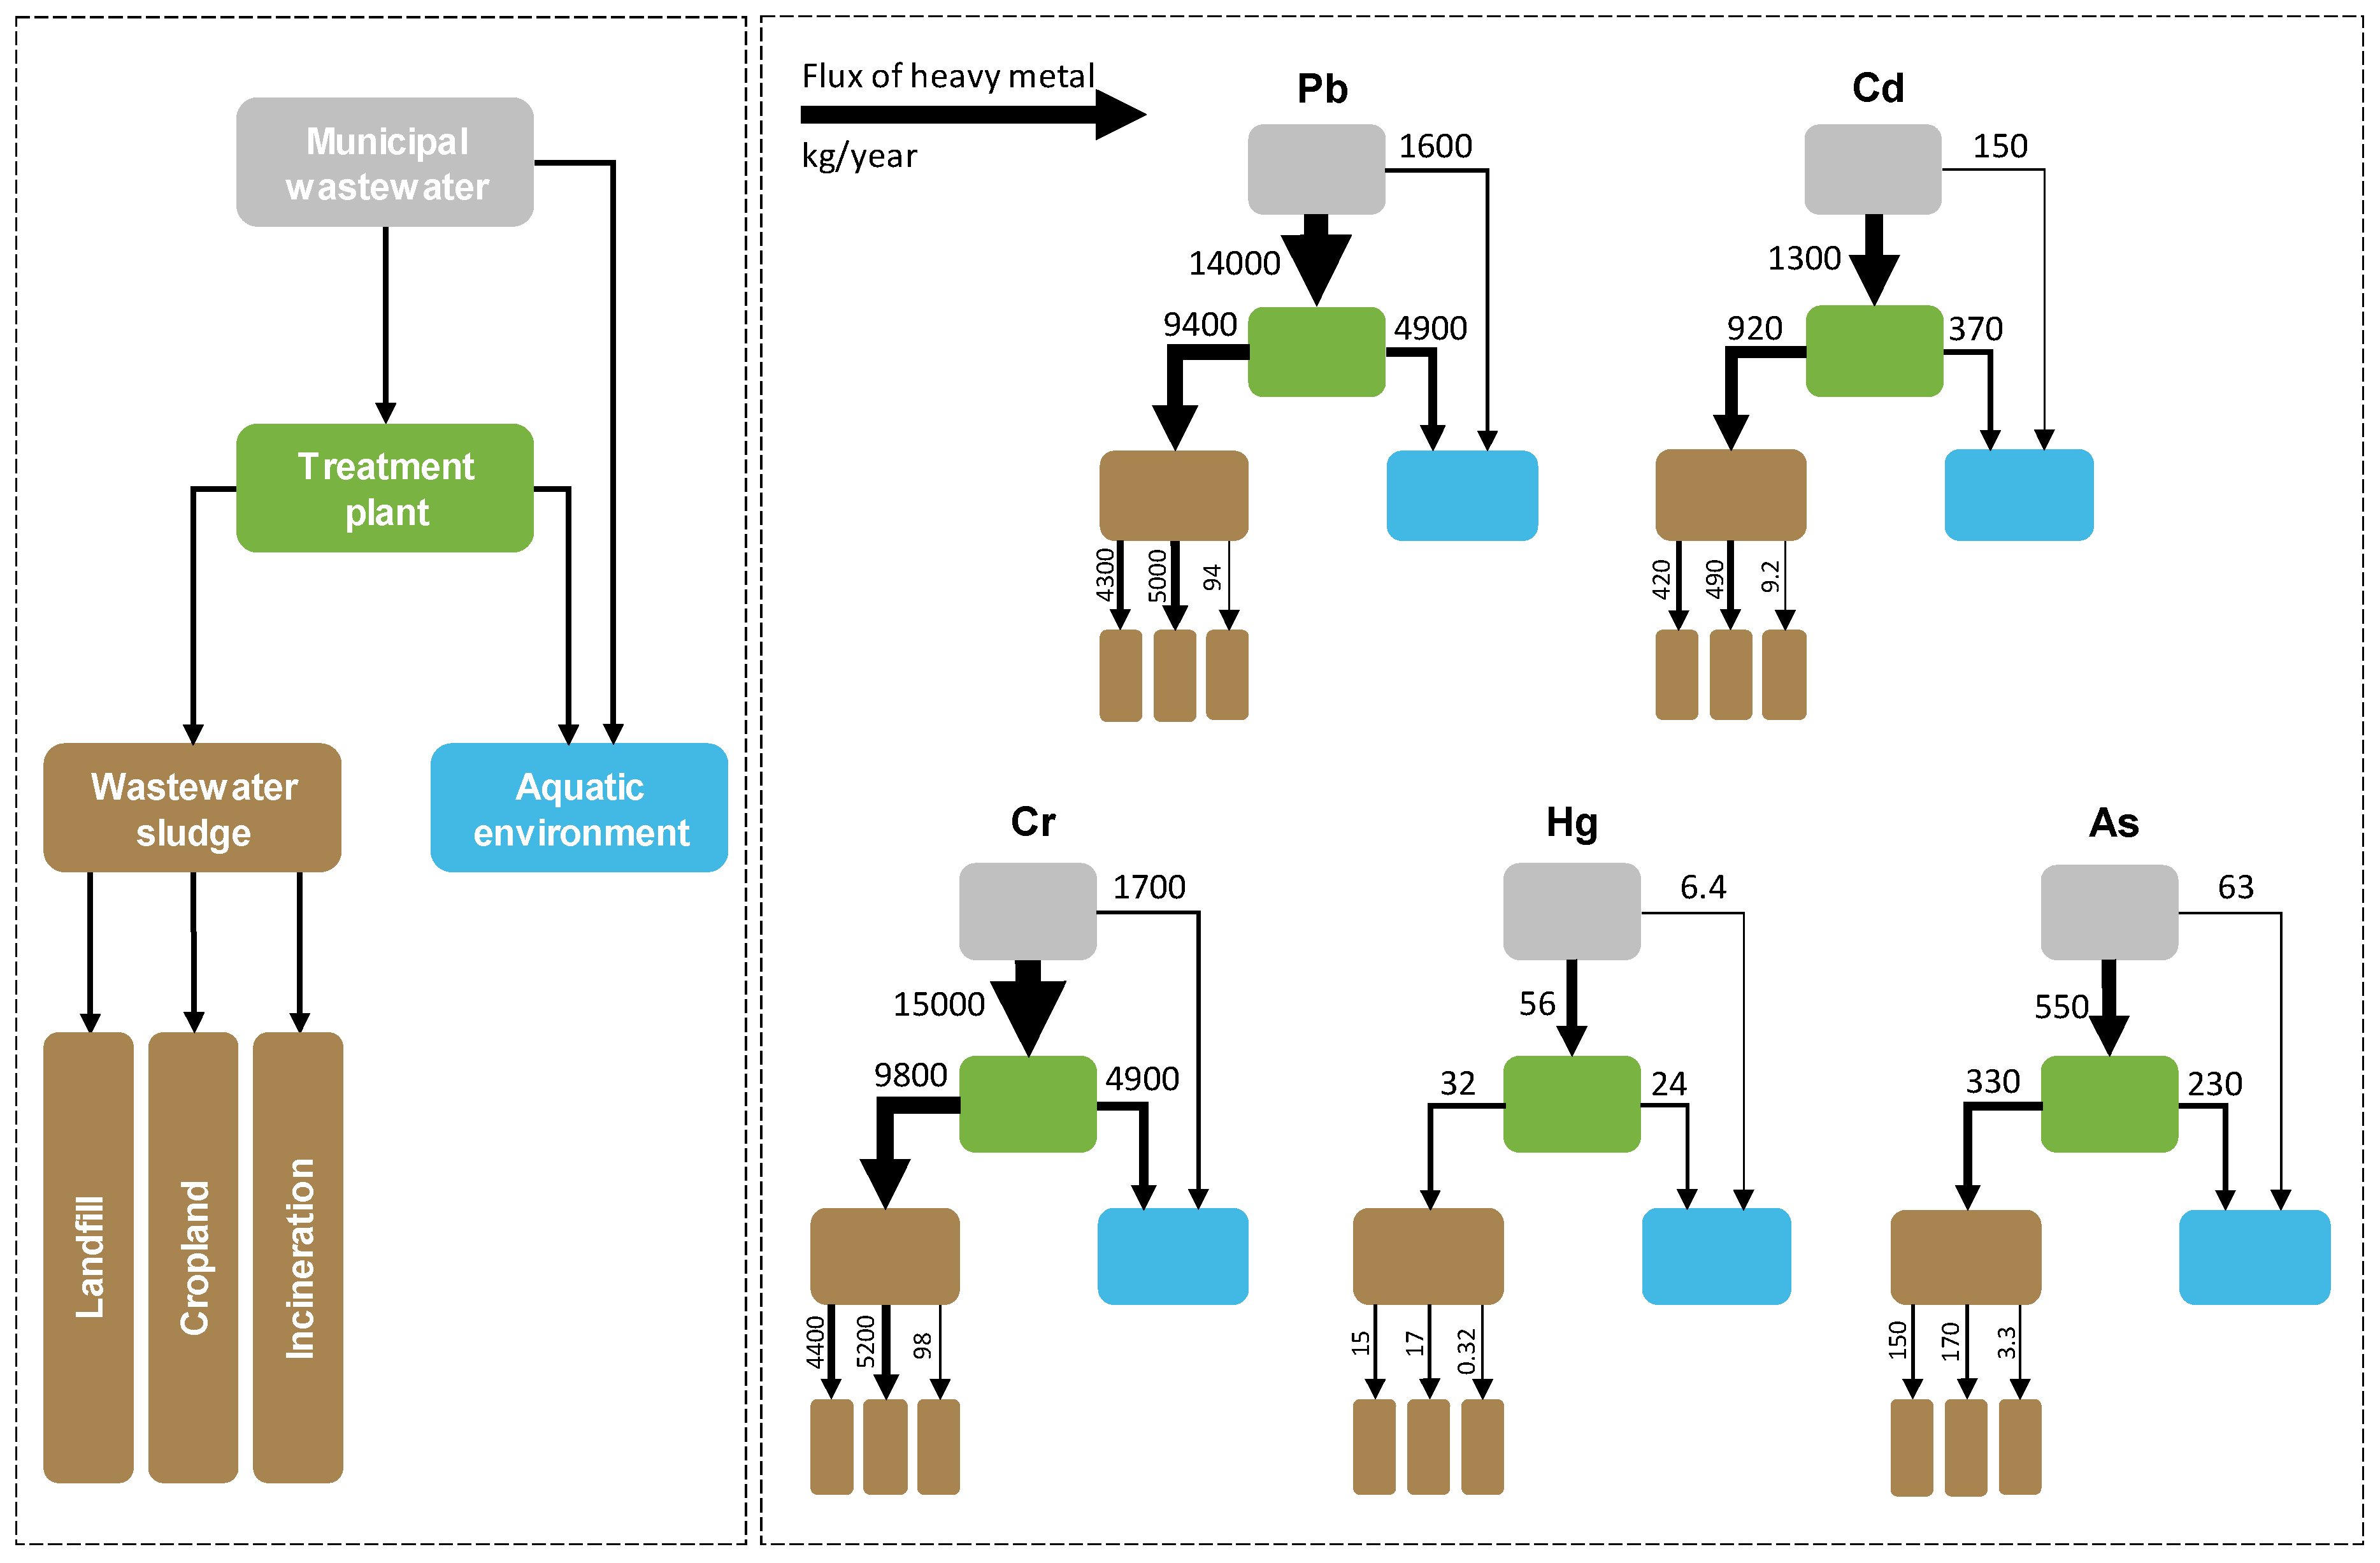
3.4. Material Flows from Municipal Wastewater to Sinks

The results of the material flow analysis indicated that substantial amounts of Pb, Cd, Cr, Hg, and As were released from municipal wastewater in Heilongjiang province; these amounts were 15,000, 1400, 16,000, 62, and 610 kg, respectively, in 2017. Meanwhile, relatively small amounts of these heavy metals were directly released into the aquatic environment without any treatment: 1600, 150, 1700, 6.4, and 63 kg of Pb, Cd, Cr, Hg, and As, respectively, in 2017 (Figure 5). On the other hand, 14,000, 1300, 15,000, 56, and 550 kg of Pb, Cd, Cr, Hg, and As, respectively, were discharged into MWTPs in 2017 (Figure 5). Subsequently, 4900, 370, 4900, 24, and 230 kg of Pb, Cd, Cr, Hg, and As, respectively, were released from municipal treatment plants into the aquatic environment in Heilongjiang province in 2017; these values are equal to 35%, 28%, 33%, 43%, and 42% of their discharges into MWTPs (Figure 5). Total amounts of 6500, 520, 6600, 30, and 290 kg of Pb, Cd, Cr, Hg, and As, respectively, were released from municipal wastewater into the aquatic environment in Heilongjiang province in 2017; these values were significantly decreased from the amounts released from municipal wastewater as shown above (Figure 5). These results suggest that constructions of MWTPs are conducive to significantly reduce the releases of heavy metals from urban areas into the aquatic environment in the study area. The results suggest that the overall municipal wastewater management strategy in the study area could serve as a valuable reference, particularly for developing regions that are struggling with inland water contaminations. Nevertheless, it shows that wastewater sludge is an important temporary sink for these five heavy metals from municipal wastewater.
Material flow analysis showed that municipal wastewater sludge could be a significant source of heavy metal pollution in the land. In total, 9400, 920, 9800, 32, and 330 kg of Pb, Cd, Cr, Hg, and As, respectively, were generated in wastewater sludge in 2017 (Figure 5). Approximately half of these heavy metals were stored in landfill, which seems a good choice as a reservoir for heavy metals. Meanwhile, substantial amounts of heavy metals were transported to cropland in wastewater sludge that was used as a fertilizer for crop plants; these amounts were 5000, 490, 5200, 17, and 170 kg for Pb, Cd, Cr, Hg, and As, respectively, in 2017 (Figure 5). This might potentially pose a health risk to humans. For example, previous studies suggested that Hg released into paddy soil could be methylated and accumulated in rice grains, which could subsequently become a significant dietary source for inhabitant Hg exposure [55,56]. Similarly, As, Cd, and Cr can also enter the food chain and become widely distributed throughout plants and animals, and thereby pose a risk to humans and wildlife [57,58,59]. Many publications in the literature also suggest that the application of wastewater sludge to cropland can enhance the accumulation of heavy metals in certain crop plants [60,61,62]. However, inconsistent results are still reported [63,64,65], and the reason for the difference is not well understood. The density of organic carbon in crop soil in Heilongjiang (average: 26 kg/m2) is substantially higher than those in most other regions in China (average in China: 16 kg/m2) [66,67]. Meanwhile, the soil pH value in Heilongjiang (5.5–7.2) is higher than that in Southern China (4.5–5.5) [68]. This might reduce the availability of soil heavy metals in Heilongjiang [69,70,71]. Further investigation of the accumulation of heavy metals from wastewater sludge into crop plants is desirable.
The results from the material flow analysis suggest that relatively small amounts of heavy metal were transported to incineration plants (i.e., 94, 9.2, 98, 0.32, and 3.3 kg of Pb, Cd, Cr, Hg, and As, respectively, in 2017) (Figure 5). Accordingly, 0.94–19, 3.7–5.5, <0.98, 0.15, and 0.066–1.3 kg of Pb, Cd, Cr, As, and Hg were emitted into the atmosphere during the incineration process. This means that the atmosphere is not a significant sink for these heavy metals from municipal wastewater. According to our investigation in Heilongjiang, only 1.0% of the municipal wastewater sludge was transported to incineration plants in 2017 [25]. This value is lower than that reported by the government in 2014 (3.5%, provincial average) [72]. Meanwhile, 65% and 63% of municipal wastewater sludge in Jiangsu and Zhejiang Provinces were transported to incineration plants in 2014, while the proportions in Anhui, Fujian, and Shandong exceeded 20% [72]. From the angle of controlling atmospheric heavy metal emissions, burying wastewater sludge in landfills might be a better option for Heilongjiang and other regions in China [73]. However, landfill leachate might also lead to heavy metal contamination of the surrounding soil, groundwater, and plants, particularly in developing countries [74,75,76,77]. In the study area, no heavy metal releases were identified in other parts of the terrestrial ecosystem besides the aquatic environment and cropland.

4. Conclusions

In this study, monthly county-level monitoring of five heavy metals in municipal wastewater was conducted in a Chinese province, which could fill a data gap in the understanding of the release of heavy metals from municipal wastewater into the environment in Heilongjiang. The five heavy metals in influents and effluents were detected with concentrations of up to 940 μg/L and 170 μg/L, respectively. Inflow fluxes of Pb, Cr, and Cd from 2015 to 2017 displayed an increased trend initially, then decreased after reaching a maximum value. Material flow analysis provided quantified evidence that the construction of MWTPs is conducive to significantly reducing the discharge of heavy metals into the aquatic environment in the study area. In addition, municipal wastewater sludge (used as fertilizer or spread on the land) was shown to be a significant source of heavy metal to the land.

Supplementary Materials

The following are available online at https://www.mdpi.com/2073-4441/12/3/728/s1, Table S1: Municipal wastewater treatment plants and sampling information in Heilongjiang Province, Figure S1: Relationship between removal ratios of five heavy metals and power consumption.

Author Contributions

P.D. and M.L. conceived the study. Y.M., N.W., and Y.L. conducted the sampling campaign and analysis. M.L., P.D., L.Z., and X.L. (Xinyue Li) performed the data analysis and generated the figures and tables. P.D., M.L., X.W., Z.W., K.M., J.H., X.Z., F.H., and X.L. (Xiqing Li) wrote and reviewed the manuscript. All authors have read and agreed to the published version of the manuscript.

Funding

This work is supported by the National Natural Science Foundation of China (Grant No. 41701543, 41977311, and 41630748), the Fundamental Research Funds for the Central Universities (Grant No. 2018NTST20, 2019B06614, and 2017XTCX02), and the 111 Project (B18006).

Acknowledgments

The authors are extremely grateful to all the personnel at the sampled MWTPs for their assistance in wastewater sampling.

Conflicts of Interest

The authors declare no conflict of interest.

References

  1. Rai, P.K.; Lee, S.S.; Zhang, M.; Tsang, Y.F.; Kim, K.-H. Heavy metals in food crops: Health risks, fate, mechanisms, and management. Environ. Int. 2019, 125, 365–385. [Google Scholar] [CrossRef] [PubMed]
  2. IARC (International Agency for Research on Cancer). Monographs—Cadmium; IARC: Lyon, France, 1993. [Google Scholar]
  3. Waalkes, M.P.; Misra, R.R.; Chang, L.W. Toxicology of Metals; CRC Press: Boca Raton, FL, USA, 1996. [Google Scholar]
  4. El-Kady, A.A.; Abdel-Wahhab, M.A. Occurrence of trace metals in foodstuffs and their health impact. Trends Food Sci. Technol. 2018, 75, 36–45. [Google Scholar] [CrossRef]
  5. Al-Saleh, I.; Al-Rouqi, R.; Elkhatib, R.; Abduljabbar, M.; Al-Rajudi, T. Risk assessment of environmental exposure to heavy metals in mothers and their respective infants. Int. J. Hyg. Environ. Health 2017, 220, 1252–1278. [Google Scholar] [CrossRef] [PubMed]
  6. Zhou, H.; Yang, W.; Zhou, X.; Liu, L.; Gu, J.; Wang, W.; Zou, J.; Tian, T.; Peng, P.; Liao, B. Accumulation of heavy metals in vegetable species planted in contaminated soils and the health risk assessment. Int. J. Environ. Res. Public Health 2016, 13, 289. [Google Scholar] [CrossRef] [PubMed] [Green Version]
  7. Costa, M. Toxicity and carcinogenicity of Cr (VI) in animal models and humans. Crit. Rev. Toxicol. 1997, 27, 431–442. [Google Scholar] [CrossRef]
  8. Soghoian, S.; Sinert, R. Heavy Metal Toxicity. Available online: http://emedicine.medscape.com/article/814960-overview (accessed on 24 August 2018).
  9. Tchounwou, P.B.; Yedjou, C.G.; Patlolla, A.K.; Sutton, D.J. Heavy metals toxicity and the environment. EXS 2012, 101, 133–164. [Google Scholar]
  10. Outridge, P.M.; Mason, R.P.; Wang, F.; Guerrero, S.; Heimburger-Boavida, L.E. Updated global and oceanic mercury budgets for the united nations global mercury assessment 2018. Environ. Sci. Technol. 2018, 52, 11466–11477. [Google Scholar] [CrossRef]
  11. Wai, K.; Wu, S.; Li, X.; Jaffe, D.A.; Perry, K.D. Global atmospheric transport and source-receptor relationships for arsenic. Environ. Sci. Technol. 2016, 50, 3714–3720. [Google Scholar] [CrossRef]
  12. Nriagu, J.O.; Pacyna, J.M. Quantitative assessment of worldwide contamination of air, water and soils by trace-metals. Nature 1988, 333, 134–139. [Google Scholar] [CrossRef]
  13. Kristensen, L.J. Quantification of atmospheric lead emissions from 70 years of leaded petrol consumption in Australia. Atmos. Environ. 2015, 111, 195–201. [Google Scholar] [CrossRef]
  14. Wang, S.; Zhang, L.; Li, G.; Wu, Y.; Hao, J.; Pirrone, N.; Sprovieri, F.; Ancora, M. Mercury emission and speciation of coal-fired power plants in China. Atmos. Chem. Phys. 2010, 10, 1183–1192. [Google Scholar] [CrossRef] [Green Version]
  15. Han, H.; Hu, S.; Syed-Hassan, S.S.A.; Xiao, Y.; Wang, Y.; Xu, J.; Jiang, L.; Su, S.; Xiang, J. Effects of reaction conditions on the emission behaviors of arsenic, cadmium and lead during sewage sludge pyrolysis. Bioresour. Technol. 2017, 236, 138–145. [Google Scholar] [CrossRef] [PubMed]
  16. Han, F.X.X.; Su, Y.; Monts, D.L.; Plodinec, M.J.; Banin, A.; Triplett, G.E. Assessment of global industrial-age anthropogenic arsenic contamination. Naturwissenschaften 2003, 90, 395–401. [Google Scholar] [CrossRef] [PubMed]
  17. Mason, R.P.; Fitzgerald, W.F.; Morel, F.M.M. The biogeochemical cycling of elemental mercury—Anthropogenic influences. Geochim. Cosmochim. Acta 1994, 58, 3191–3198. [Google Scholar] [CrossRef]
  18. Boxall, A.B.; Kolpin, D.W.; Halling-Sørensen, B.; Tolls, J. Are veterinary medicines causing environmental risks? Environ. Sci. Technol. 2003, 37, 286A–294A. [Google Scholar] [CrossRef] [Green Version]
  19. Chen, W.; Li, Y.; Chen, C.-E.; Sweetman, A.J.; Zhang, H.; Jones, K.C. DGT passive sampling for quantitative in situ measurements of compounds from household and personal care products in waters. Environ. Sci. Technol. 2017, 51, 13274–13281. [Google Scholar] [CrossRef] [Green Version]
  20. Jones, L.; Sullivan, T.; Kinsella, B.; Furey, A.; Regan, F. Occurrence of selected metals in wastewater effluent and surface water in Ireland. Anal. Lett. 2016, 50, 724–737. [Google Scholar] [CrossRef]
  21. Du, P.; Thai, P.K.; Bai, Y.; Zhou, Z.; Xu, Z.; Zhang, X.; Wang, J.; Zhang, C.; Hao, F.; Li, X. Monitoring consumption of methadone and heroin in major Chinese cities by wastewater-based epidemiology. Drug Alcohol Depend. 2019, 205, 107532. [Google Scholar] [CrossRef]
  22. Du, P.; Zhou, Z.; Huang, H.; Han, S.; Xu, Z.; Bai, Y.; Li, X. Estimating population exposure to phthalate esters in major Chinese cities through wastewater-based epidemiology. Sci. Total Environ. 2018, 643, 1602–1609. [Google Scholar] [CrossRef]
  23. Lei, K.; Zhu, Y.; Chen, W.; Pan, H.-Y.; Cao, Y.-X.; Zhang, X.; Guo, B.-B.; Sweetman, A.; Lin, C.-Y.; Ouyang, W.; et al. Spatial and seasonal variations of antibiotics in river waters in the Haihe river catchment in China and ecotoxicological risk assessment. Environ. Int. 2019, 130, 104919. [Google Scholar] [CrossRef]
  24. Liu, M.; Du, P.; Yu, C.; He, Y.; Zhang, H.; Sun, X.; Lin, H.; Luo, Y.; Xie, H.; Guo, J.; et al. Increases of total mercury and methylmercury releases from municipal sewage into environment in China and implications. Environ. Sci. Technol. 2018, 52, 124–134. [Google Scholar] [CrossRef] [PubMed]
  25. HBS (Heilongjiang Bureau of Statistics). Heilongjiang Statistical Yearbook 2018; China Statistics Press: Beijing, China, 2018. [Google Scholar]
  26. Du, P.; Li, K.; Li, J.; Xu, Z.; Fu, X.; Yang, J.; Zhang, H.; Li, X. Methamphetamine and ketamine use in major Chinese cities, a nationwide reconnaissance through sewage-based epidemiology. Water Res. 2015, 84, 76–84. [Google Scholar] [CrossRef] [PubMed]
  27. Silalahi, J.; Tampubolon, S.D.R.; Sagala, M.R.M.; Saraswati, I.N.; Silalahi, Y.C.E. Analysis of arsenic in raw and cooked rice by atomic absorption spectrophotometer. In Proceedings of the IOP Conference Series: Earth and Environmental Science, Banda Aceh, Indonesia, 26–27 September 2018; Volume 205. [Google Scholar]
  28. Brombach, C.C.; Chen, B.; Corns, W.T.; Feldmann, J.; Krupp, E.M. Methylmercury in water samples at the pg/L level by online preconcentration liquid chromatography cold vapor-atomic fluorescence spectrometry. Spectrochim. Acta B 2015, 105, 103–108. [Google Scholar] [CrossRef]
  29. Brunner, P.H.; Rechberger, H. Handbook of Material Flow Analysis: For Environmental, Resource, and Waste Engineers, 2nd ed.; CRC Press: Boca Raton, FL, USA, 2016. [Google Scholar]
  30. Chen, Y.; Zang, L.; Shen, G.; Liu, M.; Du, W.; Fei, J.; Yang, L.; Chen, L.; Wang, X.; Liu, W.; et al. Resolution of the ongoing challenge of estimating nonpoint source neonicotinoid pollution in the Yangtze River basin using a modified mass balance approach. Environ. Sci. Technol. 2019, 53, 2539–2548. [Google Scholar] [CrossRef]
  31. Churkina, G. Modeling the carbon cycle of urban systems. Ecol. Model. 2008, 216, 107–113. [Google Scholar] [CrossRef]
  32. Liu, M.; Xie, H.; He, Y.; Zhang, Q.; Sun, X.; Yu, C.; Chen, L.; Zhang, W.; Zhang, Q.; Wang, X. Sources and transport of methylmercury in the Yangtze River and the impact of the Three Gorges Dam. Water Res. 2019, 166, 115042. [Google Scholar] [CrossRef] [PubMed]
  33. Beltran, A.; Marce, R.M.; Cormack, P.A.G.; Borrull, F. Synthetic approaches to parabens molecularly imprinted polymers and their applications to the solid-phase extraction of river water samples. Anal. Chim. Acta 2010, 677, 72–78. [Google Scholar] [CrossRef]
  34. Hu, D.; Zhang, W.; Chen, L.; Chen, C.; Ou, L.; Tong, Y.; Wei, W.; Long, W.; Wang, X. Mercury emissions from waste combustion in China from 2004 to 2010. Atmos. Environ. 2012, 62, 359–366. [Google Scholar] [CrossRef]
  35. Wang, R.; Tao, S.; Wang, W.; Liu, J.; Shen, H.; Shen, G.; Wang, B.; Liu, X.; Li, W.; Huang, Y.; et al. Black carbon emissions in china from 1949 to 2050. Environ. Sci. Technol. 2012, 46, 7595–7603. [Google Scholar] [CrossRef]
  36. Li, M.M.; Gao, Z.Y.; Dong, C.Y.; Wu, M.Q.; Yan, J.; Cao, J.; Ma, W.J.; Wang, J.; Gong, Y.L.; Xu, J.; et al. Contemporary blood lead levels of children aged 0–84 months in China: A national cross-sectional study. Environ. Int. 2020, 134, 105288. [Google Scholar] [CrossRef]
  37. Li, L.; Mao, Y.; Li, Y.; Ma, Y.; Wang, X.; Song, D. Fate of heavy metals in the carrousel oxidation ditch wastewater treatment process. J. Saf. Environ. 2014, 14, 217–223. (In Chinese) [Google Scholar]
  38. Lu, J.; Chen, L.; Zhao, X. Study on the variation of heavy metals in the traditional municipal activated sludge wastewater treatment process. Environ. Pollut. Control 2008, 30, 29–32. (In Chinese) [Google Scholar]
  39. Luo, L.; Kang, D.; Wang, X. Removal and fate of typical heavy metals in municipal wastewater treatment process. J. Saf. Environ. 2010, 10, 52–55. (In Chinese) [Google Scholar]
  40. Yang, Q.; Chang, X.; Liu, Y.; Zhao, M.; Han, J. Analysis of heavy metals removal through A2/O process of municipal wastewater treatment in Yantai City. Environ. Sci. Technol. 2009, 32, 143–145. (In Chinese) [Google Scholar]
  41. Carletti, G.; Fatone, F.; Bolzonella, D.; Cecchi, F. Occurrence and fate of heavy metals in large wastewater treatment plants treating municipal and industrial wastewaters. Water Sci. Technol. 2008, 57, 1329–1336. [Google Scholar] [CrossRef] [PubMed]
  42. Buzier, R.; Tusseau-Vuillemin, M.-H.; Meriadec, C.M.D.; Rousselot, O.; Mouchel, J.-M. Trace metal speciation and fluxes within a major French wastewater treatment plant: Impact of the successive treatments stages. Chemosphere 2006, 65, 2419–2426. [Google Scholar] [CrossRef] [PubMed]
  43. Karvelas, M.; Katsoyiannis, A.; Samara, C. Occurrence and fate of heavy metals in the wastewater treatment process. Chemosphere 2003, 53, 1201–1210. [Google Scholar] [CrossRef]
  44. Chipasa, K.B. Accumulation and fate of selected heavy metals in a biological wastewater treatment system. Waste Manag. 2003, 23, 135–143. [Google Scholar] [CrossRef]
  45. Goldstone, M.E.; Atkinson, C.; Kirk, P.W.W.; Lester, J.N. The behavior of heavy-metals during waste-water treatment. III. Mercury and arsenic. Sci. Total Environ. 1990, 95, 271–294. [Google Scholar] [CrossRef]
  46. Goldstone, M.E.; Kirk, P.W.W.; Lester, J.N. The behavior of heavy-metals during waste-water treatment. I. Cadmium, chromium and copper. Sci. Total Environ. 1990, 95, 233–252. [Google Scholar] [CrossRef]
  47. Goldstone, M.E.; Kirk, P.W.W.; Lester, J.N. The behavior of heavy-metals during waste-water treatment. II. Lead, nickel and zinc. Sci. Total Environ. 1990, 95, 253–270. [Google Scholar] [CrossRef]
  48. Choubert, J.M.; Pomies, M.; Ruel, S.M.; Coquery, M. Influent concentrations and removal performances of metals through municipal wastewater treatment processes. Water Sci. Technol. 2011, 63, 1967–1973. [Google Scholar] [CrossRef] [PubMed]
  49. Joshua, D.I.; Abeykoon, S.; Watanabe, I.; Paszek, L.; Balakrishna, K.; Akiba, M.; Guruge, K.S. Seasonal movement of trace-element discharge in a typical south-Indian suburban community. Water Sci. Technol. 2018, 77, 1035–1047. [Google Scholar] [CrossRef] [PubMed] [Green Version]
  50. Üstün, G.E. Occurrence and removal of metals in urban wastewater treatment plants. J. Hazard. Mater. 2009, 172, 833–838. [Google Scholar] [CrossRef] [PubMed]
  51. Teijon, G.; Candela, L.; Tamoh, K.; Molina-Diaz, A.; Fernandez-Alba, A.R. Occurrence of emerging contaminants, priority substances (2008/105/CE) and heavy metals in treated wastewater and groundwater at Depurbaix facility (Barcelona, Spain). Sci. Total Environ. 2010, 408, 3584–3595. [Google Scholar] [CrossRef] [PubMed]
  52. Cantinho, P.; Matos, M.; Trancoso, M.A.; Correia dos Santos, M.M. Behaviour and fate of metals in urban wastewater treatment plants: A review. Int. J. Environ. Sci. Technol. 2016, 13, 359–386. [Google Scholar] [CrossRef] [Green Version]
  53. Zhang, Q.Q.; Ying, G.G.; Pan, C.G.; Liu, Y.S.; Zhao, J.L. Comprehensive evaluation of antibiotics emission and fate in the river basins of China: Source analysis, multimedia modeling, and linkage to bacterial resistance. Environ. Sci. Technol. 2015, 49, 6772–6782. [Google Scholar] [CrossRef]
  54. Liu, X.; Sheng, H.; Jiang, S.; Yuan, Z.; Zhang, C.; Elser, J.J. Intensification of phosphorus cycling in China since the 1600s. Proc. Natl. Acad. Sci. USA 2016, 113, 2609–2614. [Google Scholar] [CrossRef] [Green Version]
  55. Liu, M.; Chen, L.; He, Y.; Baumann, Z.; Mason, R.P.; Shen, H.; Yu, C.; Zhang, W.; Zhang, Q.; Wang, X. Impacts of farmed fish consumption and food trade on methylmercury exposure in China. Environ. Int. 2018, 120, 333–344. [Google Scholar] [CrossRef]
  56. Rothenberg, S.E.; Windham-Myers, L.; Creswell, J.E. Rice methylmercury exposure and mitigation: A comprehensive review. Environ. Res. 2014, 133, 407–423. [Google Scholar] [CrossRef] [Green Version]
  57. Hans, M.; Oscar, R. Cadmium in the Environment; Birkhäuser: Basel, Switzerland, 1974. [Google Scholar]
  58. Mandal, B.K.; Suzuki, K.T. Arsenic round the world: A review. Talanta 2002, 58, 201–235. [Google Scholar] [CrossRef]
  59. Shanker, A.K.; Cervantes, C.; Loza-Tavera, H.; Avudainayagam, S. Chromium toxicity in plants. Environ. Int. 2005, 31, 739–753. [Google Scholar] [CrossRef] [PubMed]
  60. Muchuweti, A.; Birkett, J.W.; Chinyanga, E.; Zvauya, R.; Scrimshaw, M.D.; Lester, J.N. Heavy metal content of vegetables irrigated with mixtures of wastewater and sewage sludge in Zimbabwe: Implications for human health. Agric. Ecosyst. Environ. 2006, 112, 41–48. [Google Scholar] [CrossRef] [Green Version]
  61. Singh, R.P.; Agrawal, M. Effects of sewage sludge amendment on heavy metal accumulation and consequent responses of Beta vulgaris plants. Chemosphere 2007, 67, 2229–2240. [Google Scholar] [CrossRef] [PubMed]
  62. Singh, R.P.; Agrawal, M. Variations in heavy metal accumulation, growth and yield of rice plants grown at different sewage sludge amendment rates. Ecotoxicol. Environ. Saf. 2010, 73, 632–641. [Google Scholar] [CrossRef] [PubMed]
  63. Borjesson, G.; Kirchmann, H.; Katterer, T. Four Swedish long-term field experiments with sewage sludge reveal a limited effect on soil microbes and on metal uptake by crops. J. Soils Sediments 2014, 14, 164–177. [Google Scholar] [CrossRef] [Green Version]
  64. Frost, H.L.; Ketchum, L.H. Trace metal concentration in durum wheat from application of sewage sludge and commercial fertilizer. Adv. Environ. Res. 2000, 4, 347–355. [Google Scholar] [CrossRef]
  65. McBride, M.B. Toxic metal accumulation from agricultural use of sludge—Are usepa regulations protective. J. Envrion. Qual. 1995, 24, 5–18. [Google Scholar] [CrossRef]
  66. Li, Z.P.; Han, F.X.; Su, Y.; Zhang, T.L.; Sun, B.; Monts, D.L.; Plodinec, M.J. Assessment of soil organic and carbonate carbon storage in China. Geoderma 2007, 138, 119–126. [Google Scholar] [CrossRef]
  67. Tang, H.; Qiu, J.; Van Ranst, E.; Li, C. Estimations of soil organic carbon storage in cropland of China based on DNDC model. Geoderma 2006, 134, 200–206. [Google Scholar] [CrossRef]
  68. Shangguan, W.; Dai, Y.; Liu, B.; Zhu, A.; Duan, Q.; Wu, L.; Ji, D.; Ye, A.; Yuan, H.; Zhang, Q.; et al. A China data set of soil properties for land surface modeling. J. Adv. Model. Earth Syst. 2013, 5, 212–224. [Google Scholar] [CrossRef]
  69. Kashem, M.A.; Singh, B.R. Metal availability in contaminated soils: I. Effects of floodingand organic matter on changes in Eh, pH and solubility of Cd, Ni and Zn. Nutr. Cycl. Agroecosyst. 2001, 61, 247–255. [Google Scholar] [CrossRef]
  70. Yin, Y.J.; Allen, H.E.; Li, Y.M.; Huang, C.P.; Sanders, P.F. Adsorption of mercury(II) by soil: Effects of pH, chloride, and organic matter. J. Environ. Qual. 1996, 25, 837–844. [Google Scholar] [CrossRef]
  71. Zeng, F.; Ali, S.; Zhang, H.; Ouyang, Y.; Qiu, B.; Wu, F.; Zhang, G. The influence of pH and organic matter content in paddy soil on heavy metal availability and their uptake by rice plants. Environ. Pollut. 2011, 159, 84–91. [Google Scholar] [CrossRef] [PubMed]
  72. NBS (National Bureau of Statistics). China Environment Yearbook 2015; National Bureau of Statistics: Beijing, China, 2015. [Google Scholar]
  73. Deng, C.; Xie, H.; Ye, X.; Zhang, H.; Liu, M.; Tong, Y.; Ou, L.; Yuan, W.; Zhang, W.; Wang, X. Mercury risk assessment combining internal and external exposure methods for a population living near a municipal solid waste incinerator. Environ. Pollut. 2016, 219, 1060–1068. [Google Scholar] [CrossRef] [PubMed]
  74. Bakis, R.; Tuncan, A. An investigation of heavy metal and migration through groundwater from the landfill area of Eskisehir in Turkey. Environ. Monit. Assess. 2011, 176, 87–98. [Google Scholar] [CrossRef]
  75. Kanmani, S.R.G. Assessment of heavy metal contamination in soil due to leachate migration from an open dumping site. Appl. Water Sci. 2013, 3, 193–205. [Google Scholar] [CrossRef] [Green Version]
  76. Oluyemi, E.A.; Feuyit, G.; Oyekunle, J.A.O.; Ogunfowokan, A.O. Seasonal variations in heavy metal concentrations in soil and some selected crops at a landfill in Nigeria. Afr. J. Environ. Sci. Technol. 2008, 2, 89–96. [Google Scholar]
  77. Pastor, J.; Hernandez, A.J. Heavy metals, salts and organic residues in old solid urban waste landfills and surface waters in their discharge areas: Determinants for restoring their impact. J. Environ. Manag. 2012, 95, S42–S49. [Google Scholar] [CrossRef]
Figure 1. Locations of the municipal wastewater treatment plants (MWTPs) for this study. The date on the distribution of the population is from the census information in 2018 [25].
Water 12 00728 g001
Figure 2. Apparent removal ratios of five heavy metals and power consumption (PC) at sampled MWTPs.
Water 12 00728 g002
Figure 3. Temporal variations of five heavy metals flux at sampled MWTPs.
Water 12 00728 g003
Figure 4. Distributions of five heavy metals released (g/km2·yr) from municipal wastewater in Heilongjiang province in 2017.
Water 12 00728 g004
Figure 5. Material flow analysis of five heavy metals from municipal wastewater to sinks (the flow from municipal wastewater to treatment plant represents influent heavy metal of the wastewater treatment plant, while the flow from municipal wastewater to aquatic environment represents the metal discharged from untreated wastewater to aquatic environment directly).
Water 12 00728 g005
Table 1. Statistics of heavy metals concentration in municipal wastewater samples.
Heavy MetalsnDF a (%)MinMedianMaxMean ± STD
μg/L
InfluentPb641100.044140940160 ± 100
Cd641100.07.0137815 ± 9.0
Cr649100.088160650170 ± 64
Hg65199.8<LOD0.54380.67 ± 1.5
As65099.7<LOD5.6956.2 ± 4.8
EffluentPb65699.5<LOD4517045 ± 15
Cd65699.5<LOD4.5565.2 ± 5.1
Cr65699.7275813057 ± 13
Hg65799.5<LOD0.261.00.28 ± 0.12
As65799.7<LOD2.4152.6 ± 1.4
a Detection frequency.
Table 2. Comparison of influents and effluents concentrations (μg/L) and removal ratios (%) of five heavy metals in different countries.
CountryNo. of
MWTPs
AsCdCrHgPb
In aEf bRe cInEfReInEfReInEfReInEfRe
Italy [41]54.32.244.57.50.10734110641.60.90337.17.636
France [42]1n.d. dn.d.n.d.0.60<0.20>679.02050n.d.n.d.n.d.18–20<1>95
Greece [43]1n.d.n.d.n.d.3.31.555402050n.d.n.d.n.d.392731
Poland [44]1n.d.n.d.n.d.10–20n.d.10–20n.d.n.d.n.d.n.d.n.d.n.d.~50n.d.30–40
UK [45,46,47]111–132.0–2.5811.5–2.00.25–0.50793510712.50.3906002596
France [48]93.0–10n.d.20≤3.0n.d.40–7510–100n.d.≥75n.d.n.d.n.d.10–100n.d.≥75
Indian [49]31.10.830n.d.n.d.n.d.3.53.114.00n.d.n.d.n.d.0.200.1034
Turkey [50]2n.d.n.d.n.d.11555150024077n.d.n.d.n.d.502158
Spain [51]1n.d.n.d.n.d.50005000n.d.n.d.n.d.n.d.370370n.d.5.216.1n.d.
Jiaozuo, China [37]11512.7141.3n.d.n.d.18.20.498n.d.n.d.n.d.4.1n.d.n.d.
Chungking, China [38]11.10.70331.20.5853n.d.n.d.n.d.0.550.1376181330
Xi’an China [39]10.900.03097n.d.n.d.n.d.9263310.430.0686n.d.n.d.n.d.
Yantai, China [40]1n.d.n.d.n.d.616.19056046921.50.11934804890
This study
(Heilongjiang, China)
276.2 ± 4.82.6 ± 1.45515 ± 9.05.2 ± 5.164170 ± 6457 ± 13640.67 ± 1.50.28 ± 0.1250160 ± 10045 ± 1567
a Influent concentration; b Effluent concentration; c Removal ratio; d no data.

