Spatiotemporal Variability of Precipitation in Beijing, China during the Wet Seasons


Abstract
1. Introduction
2. Data and Methodology
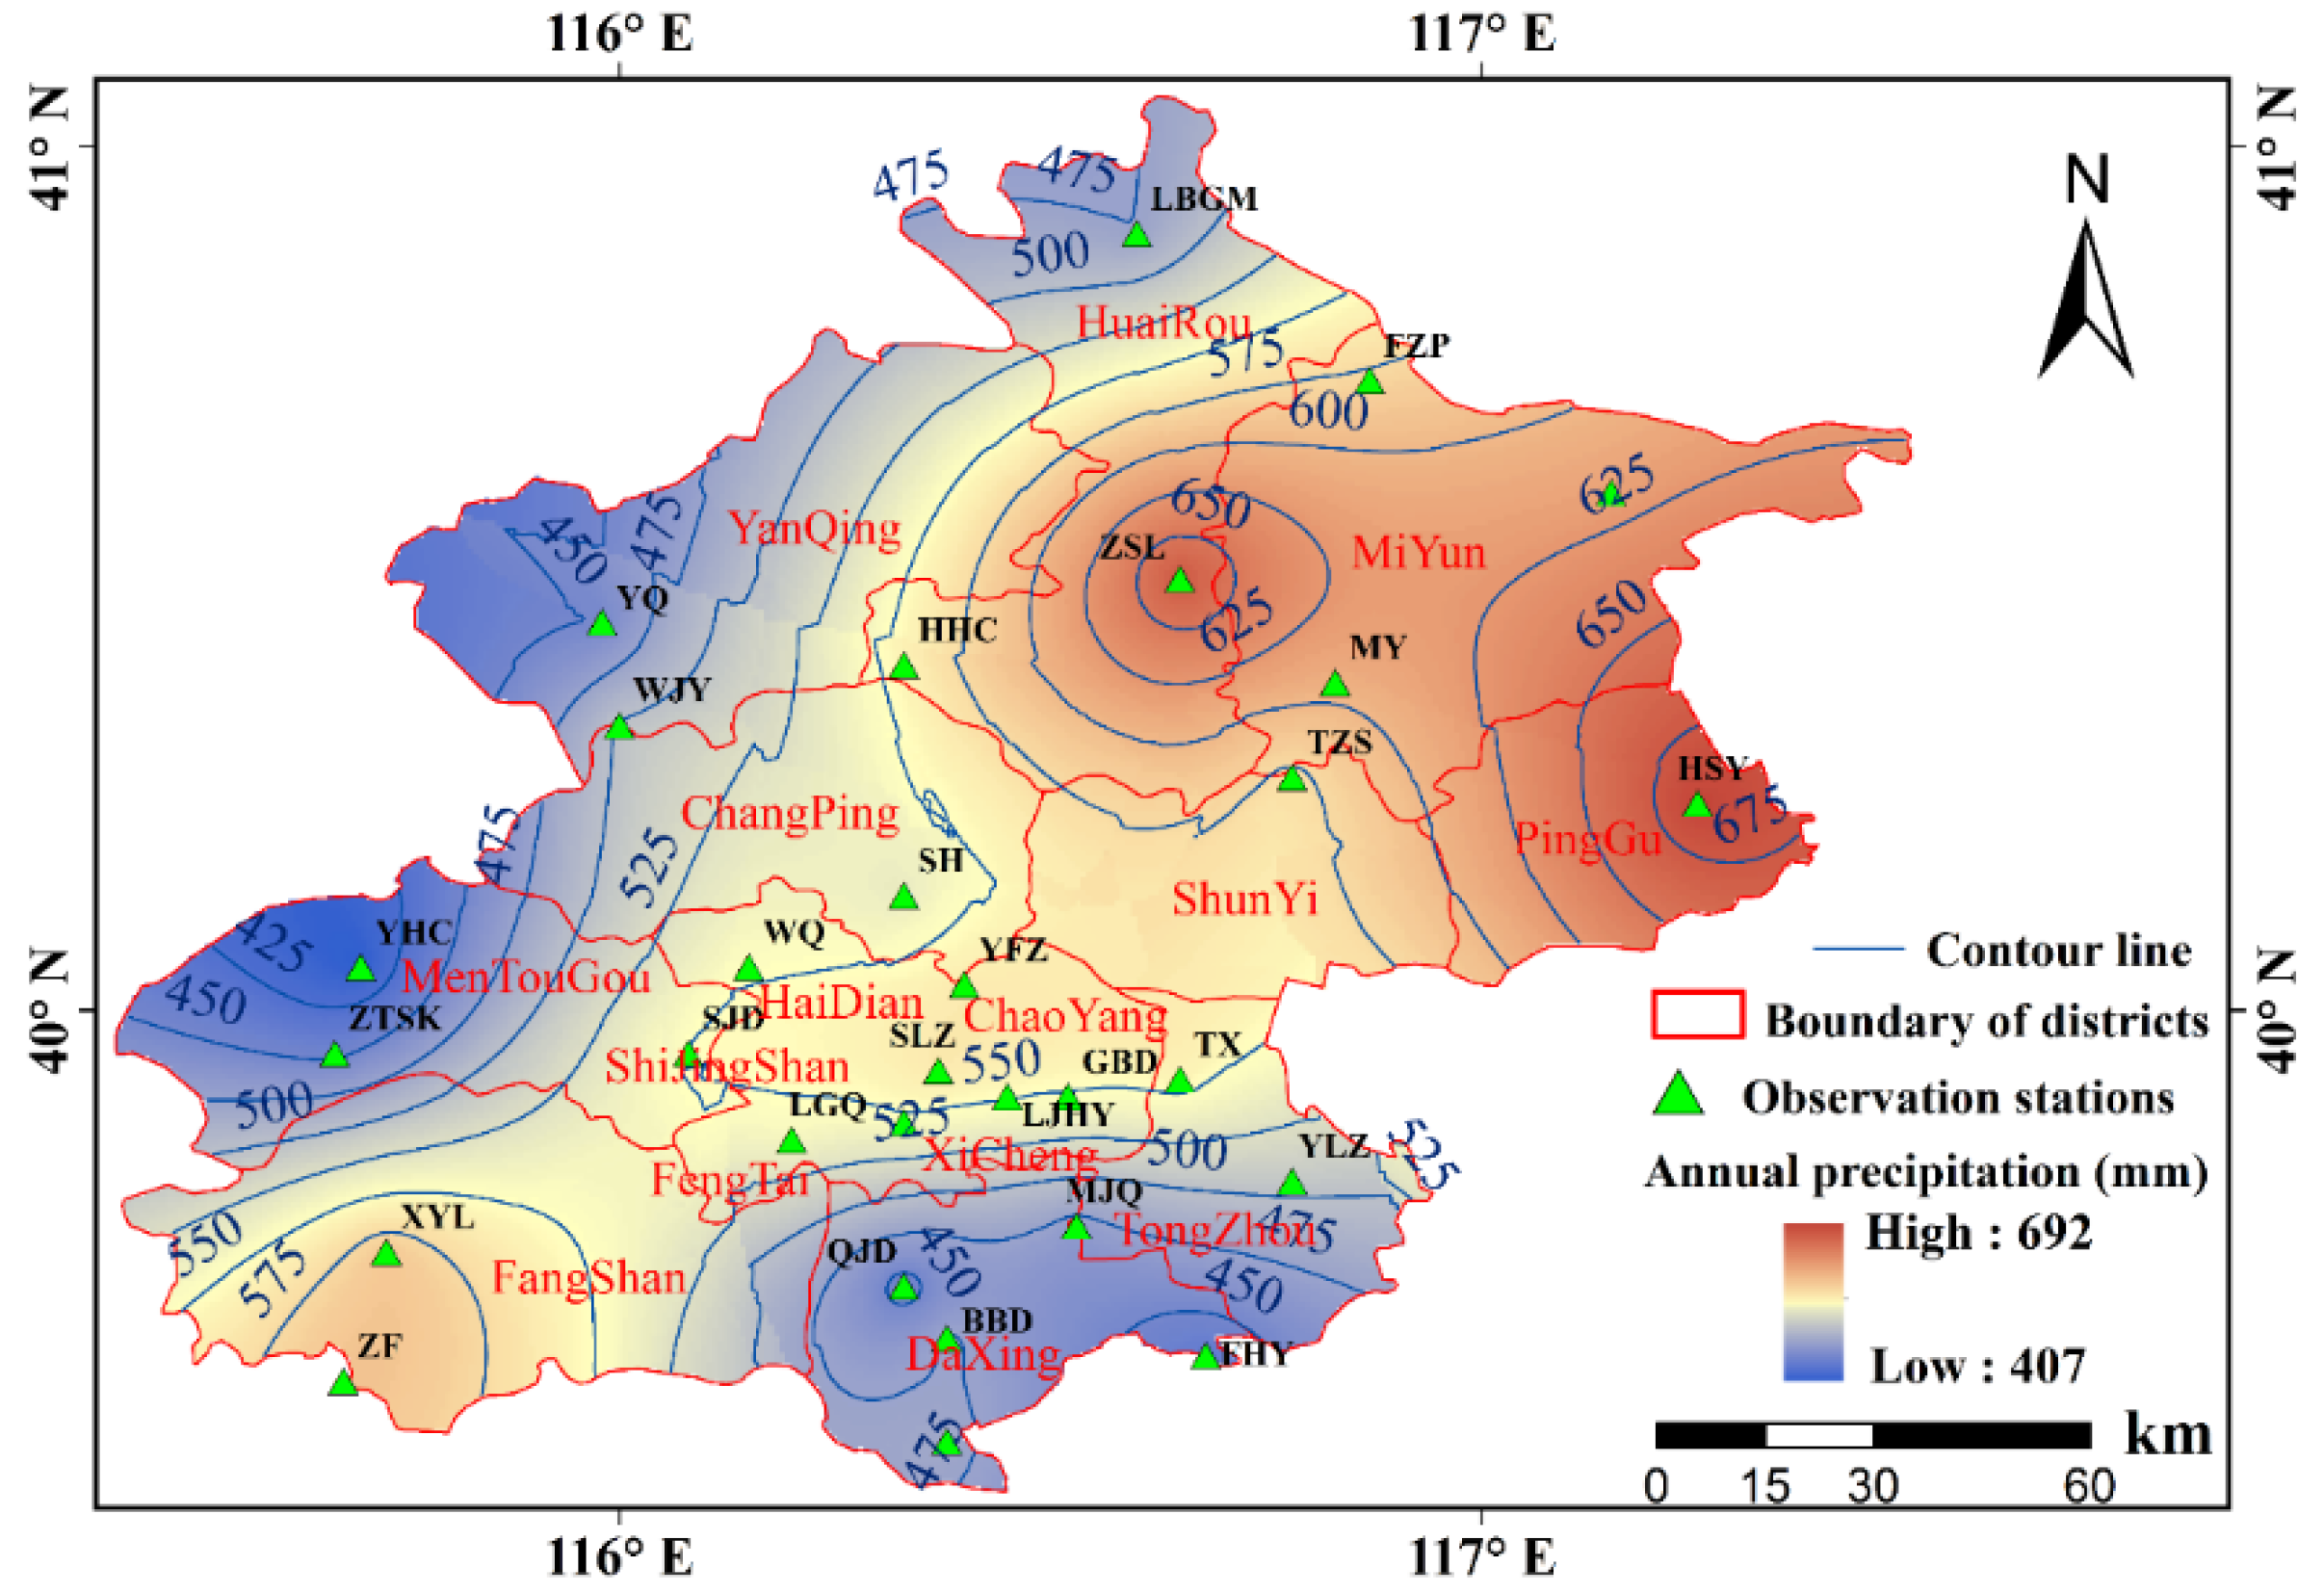
2.1. Study Area Description
2.2. Data Description
2.2.1. Precipitation Data
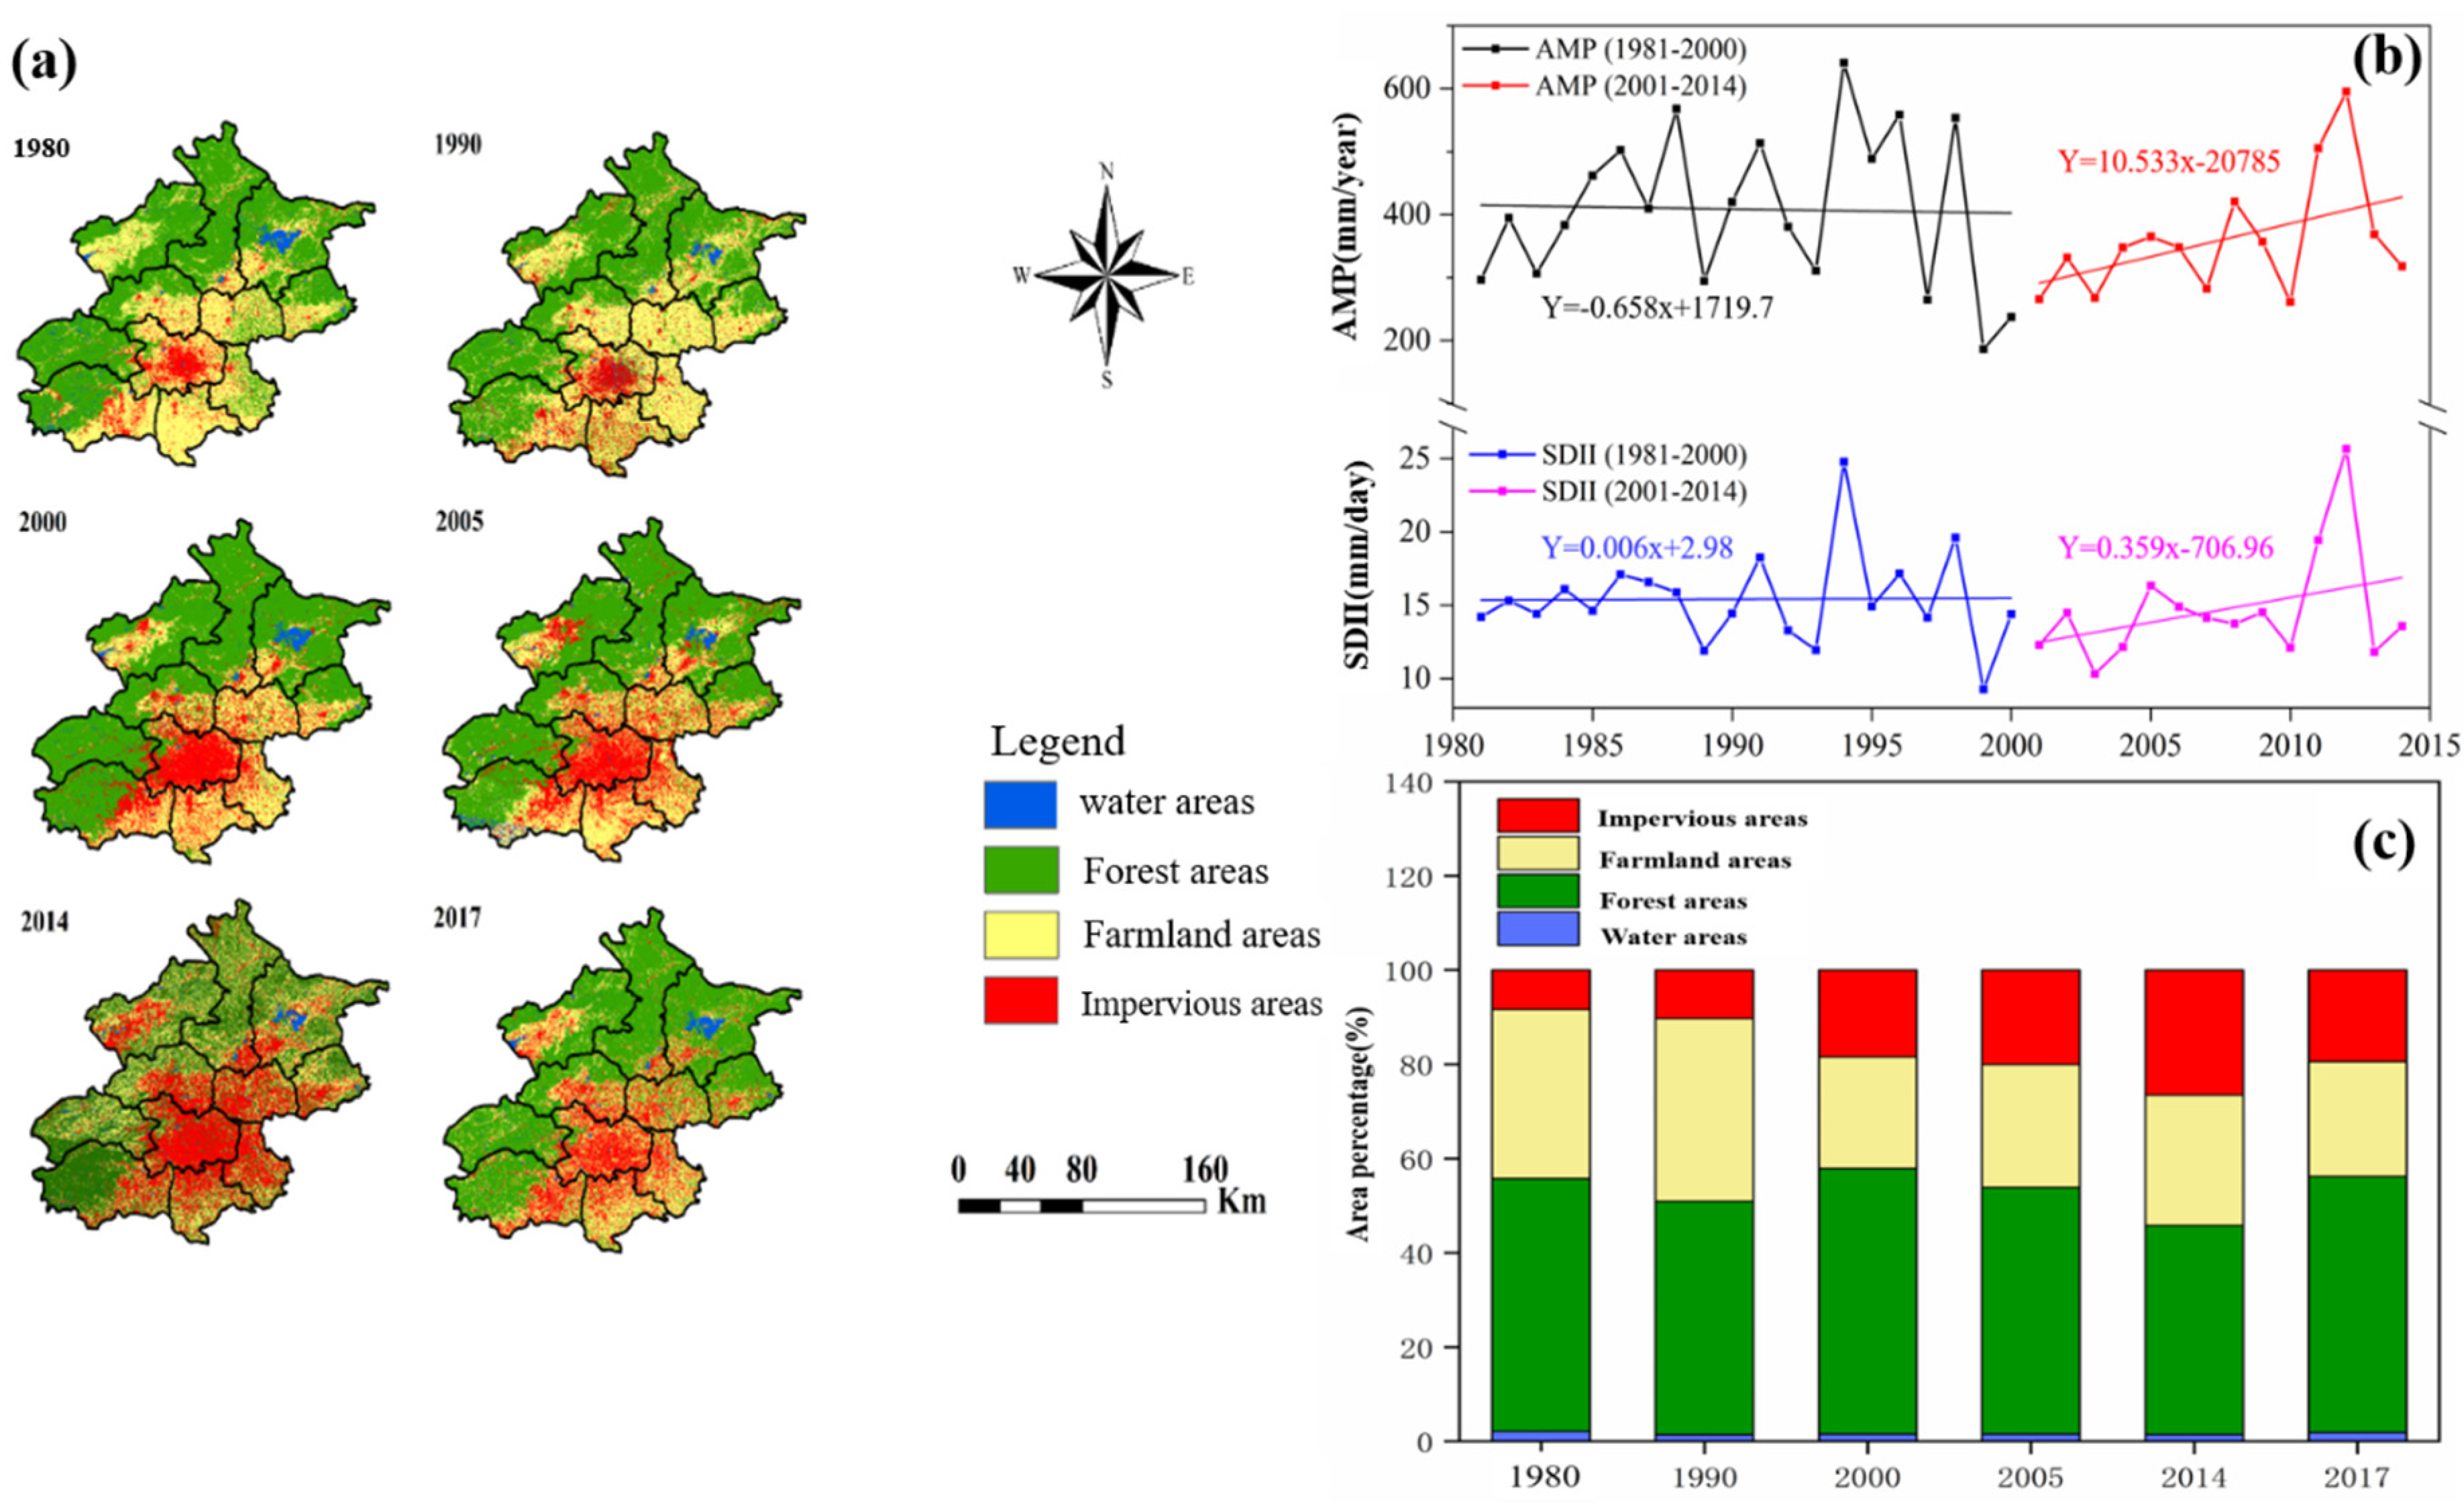
2.2.2. Land Use Data
2.3. Methodology Description
2.3.1. Extreme Precipitation Indices
2.3.2. Trend Analysis Methods
2.3.3. Correlation Analysis
3. Results Analysis
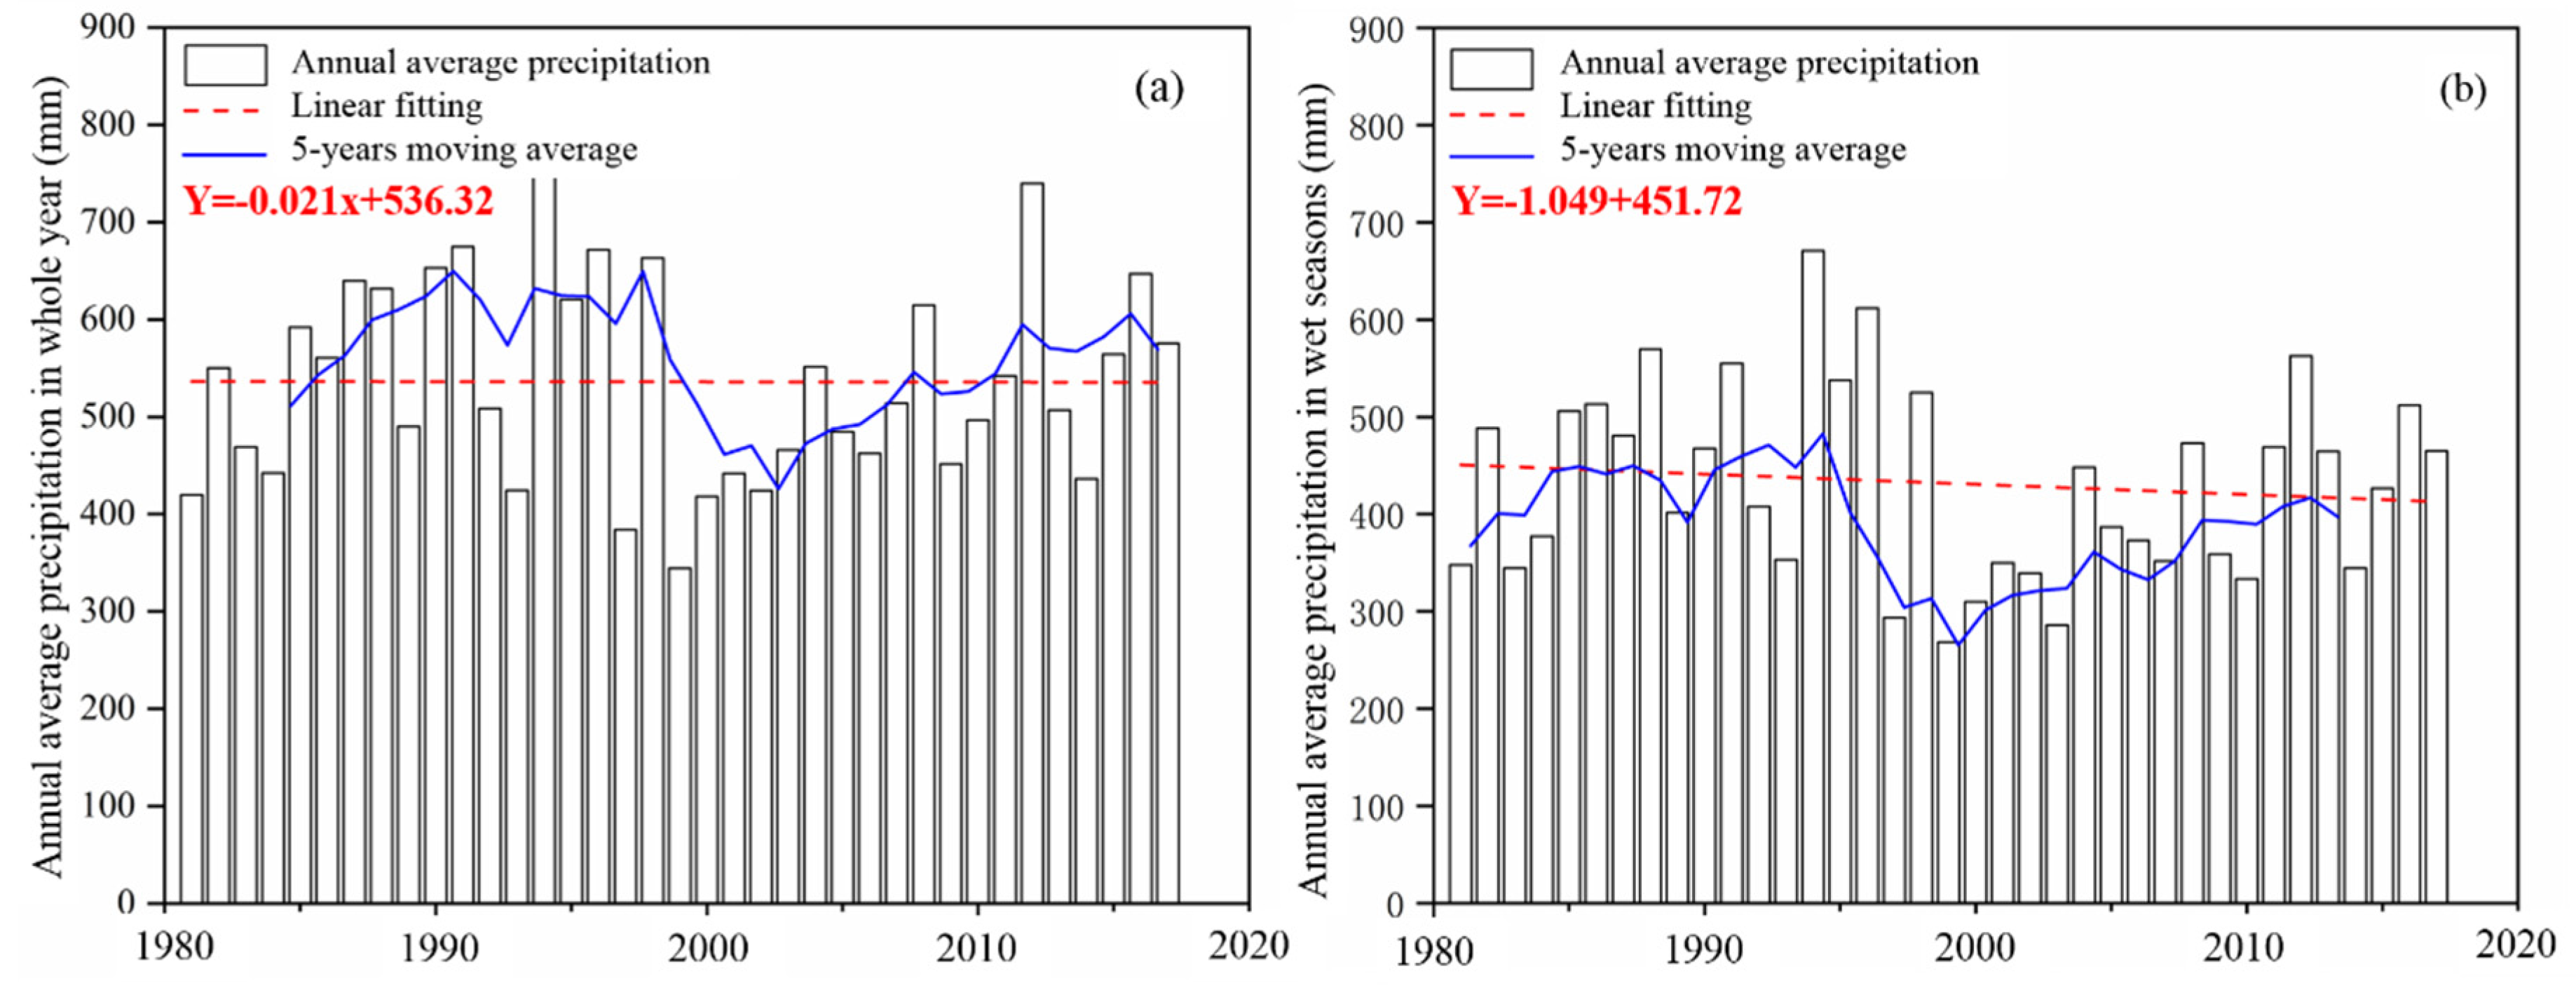
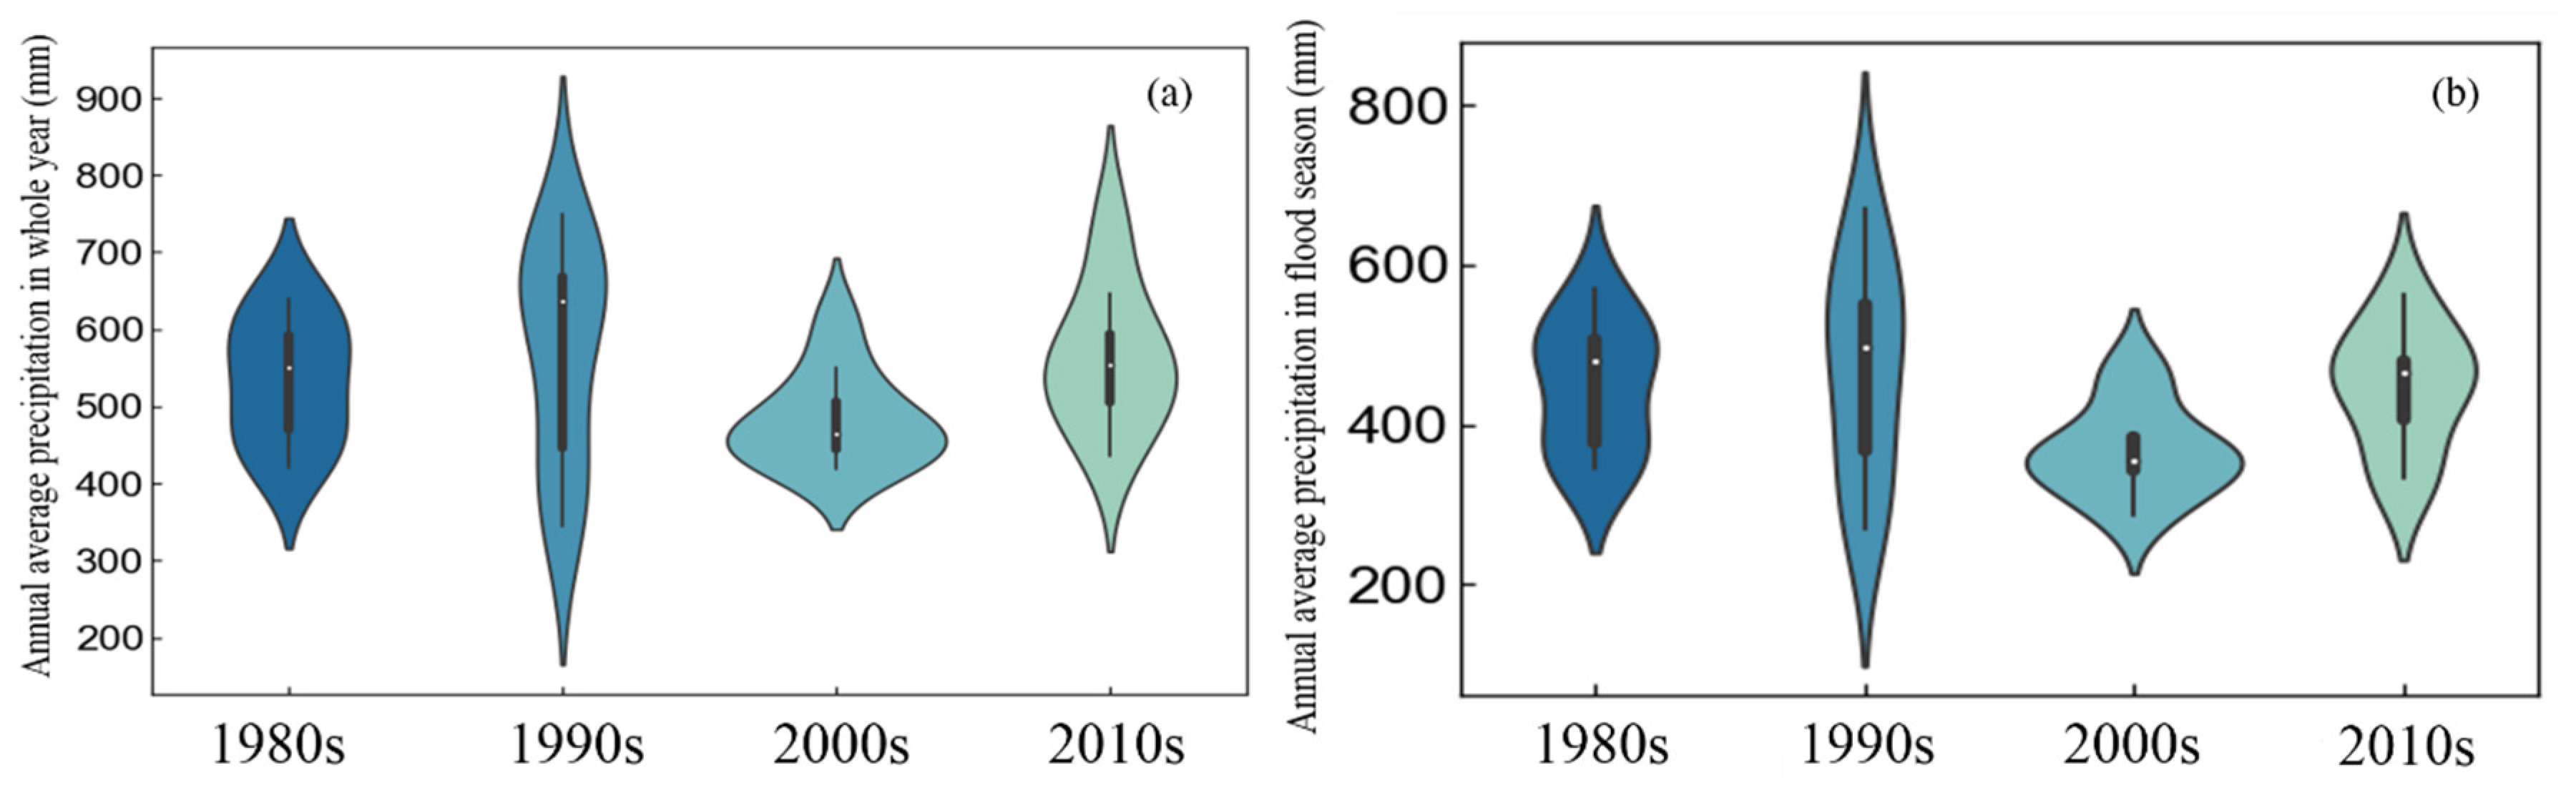
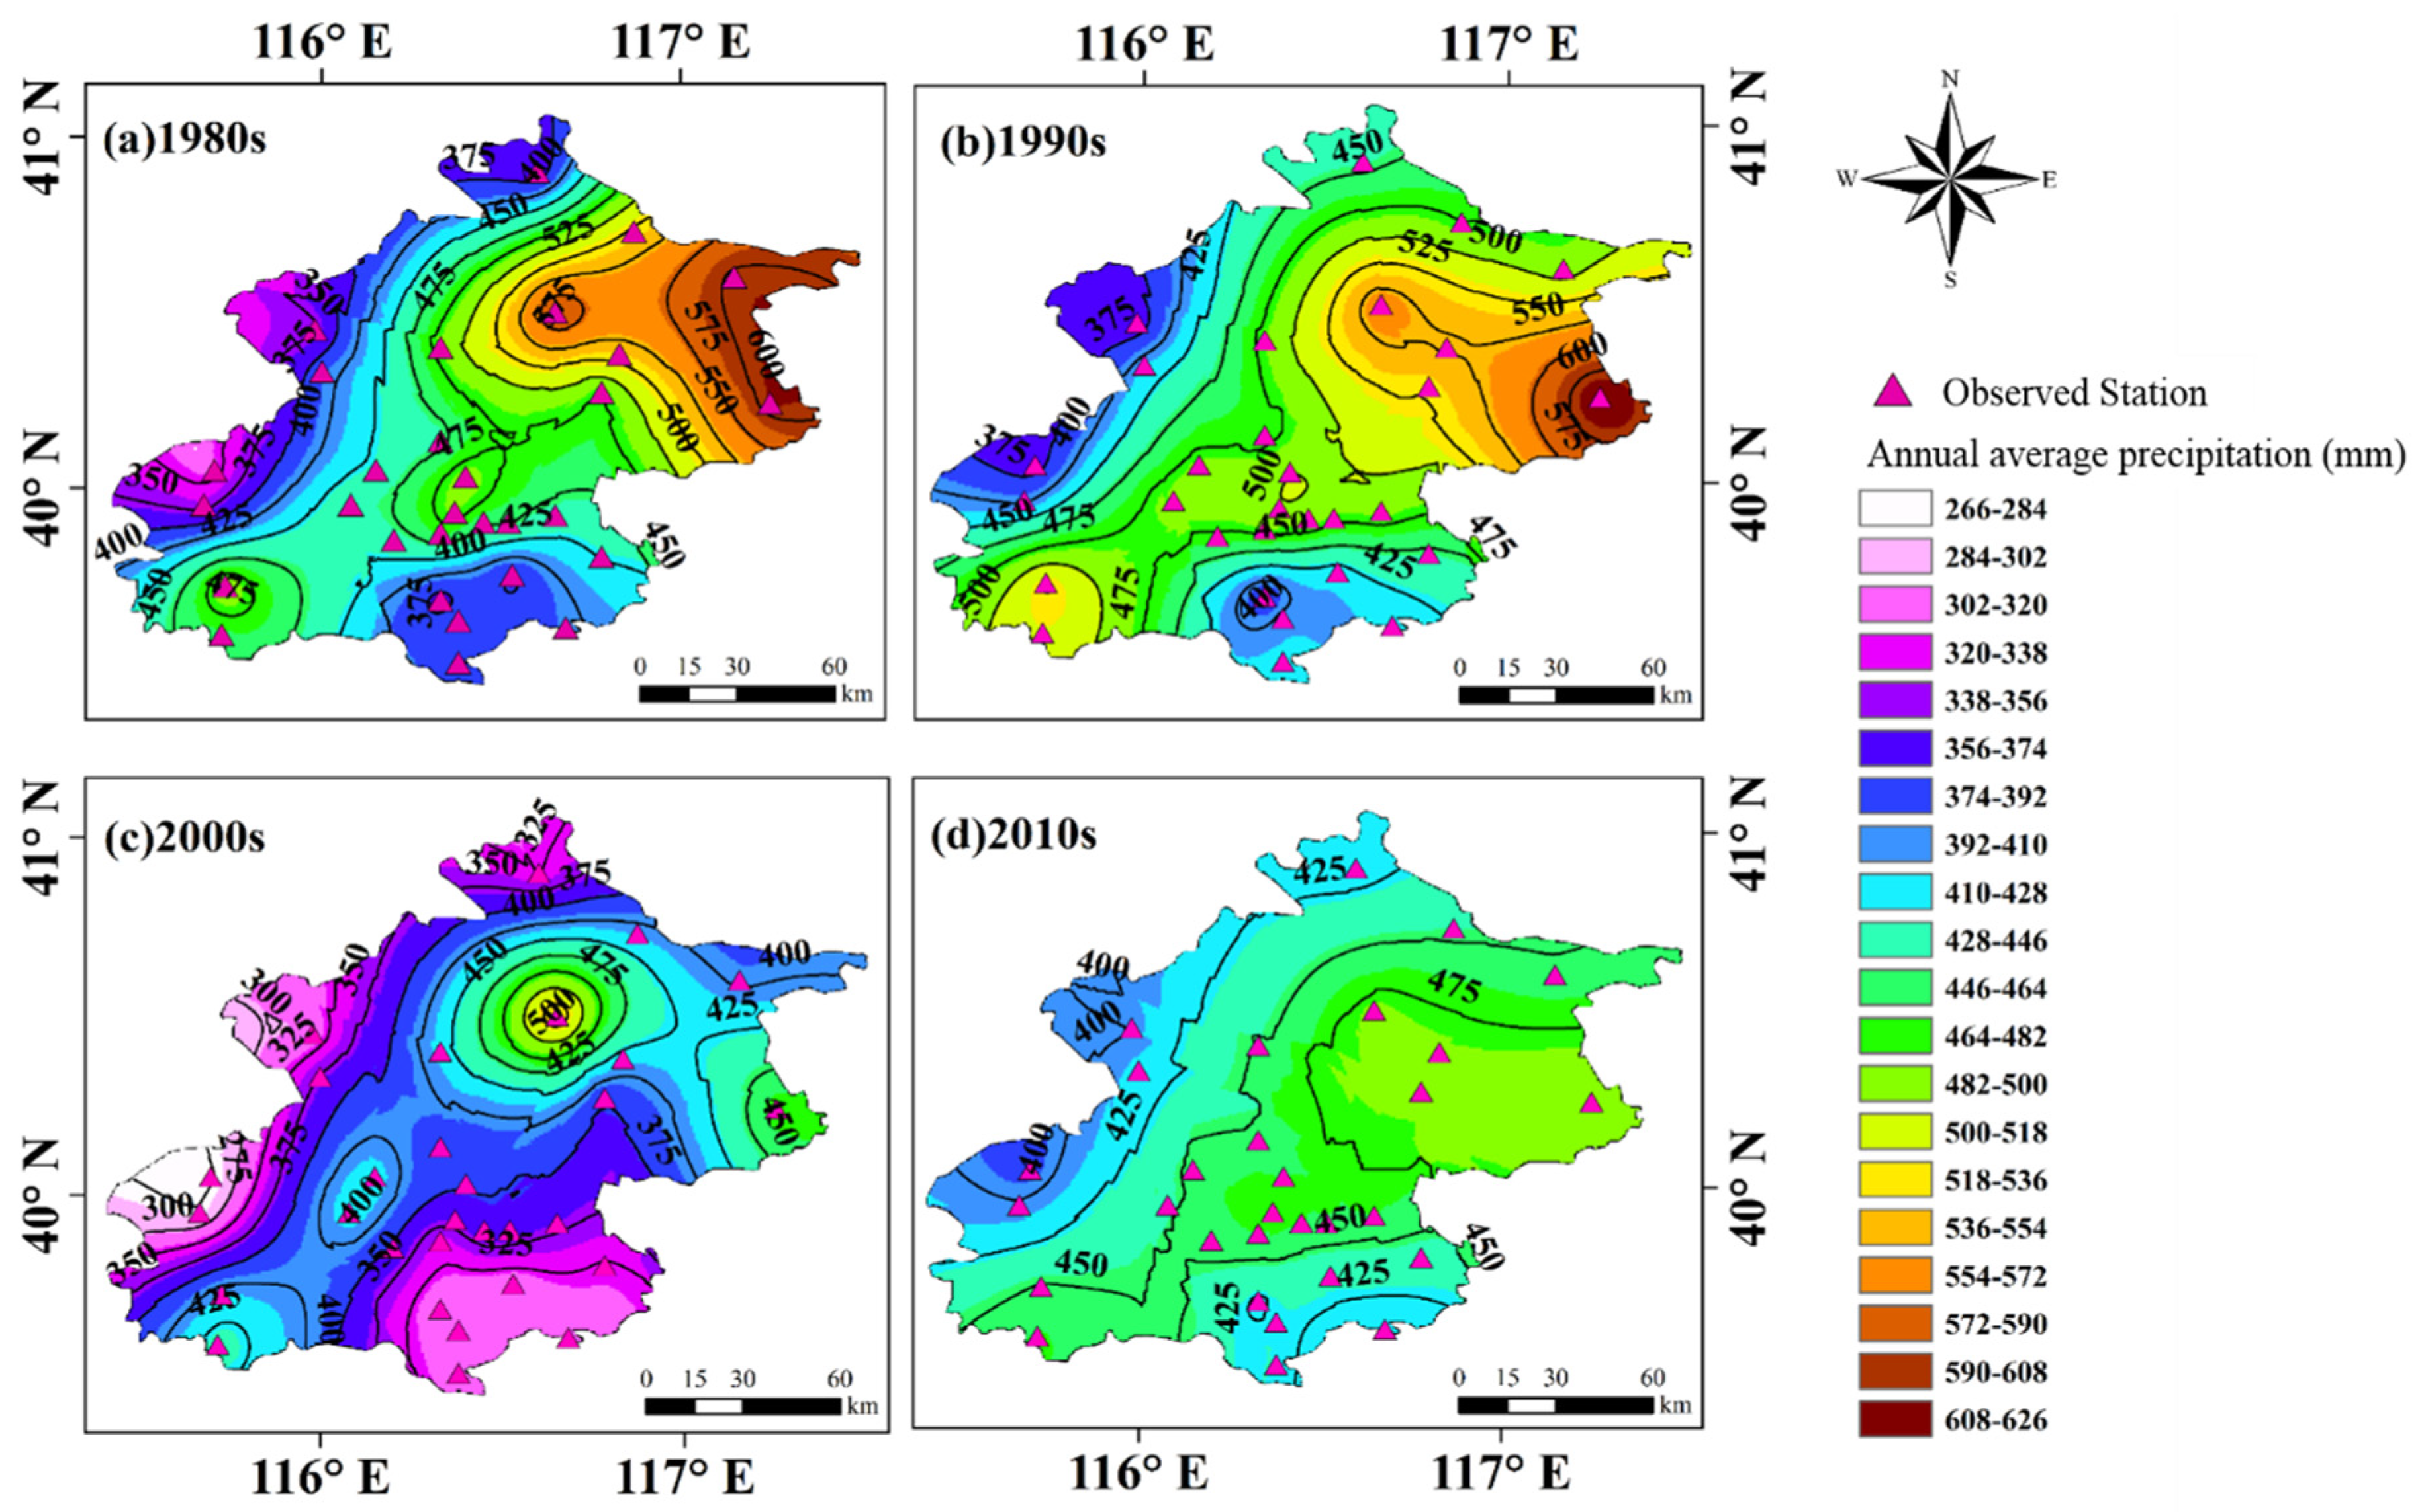
3.1. Annual Precipitation Description
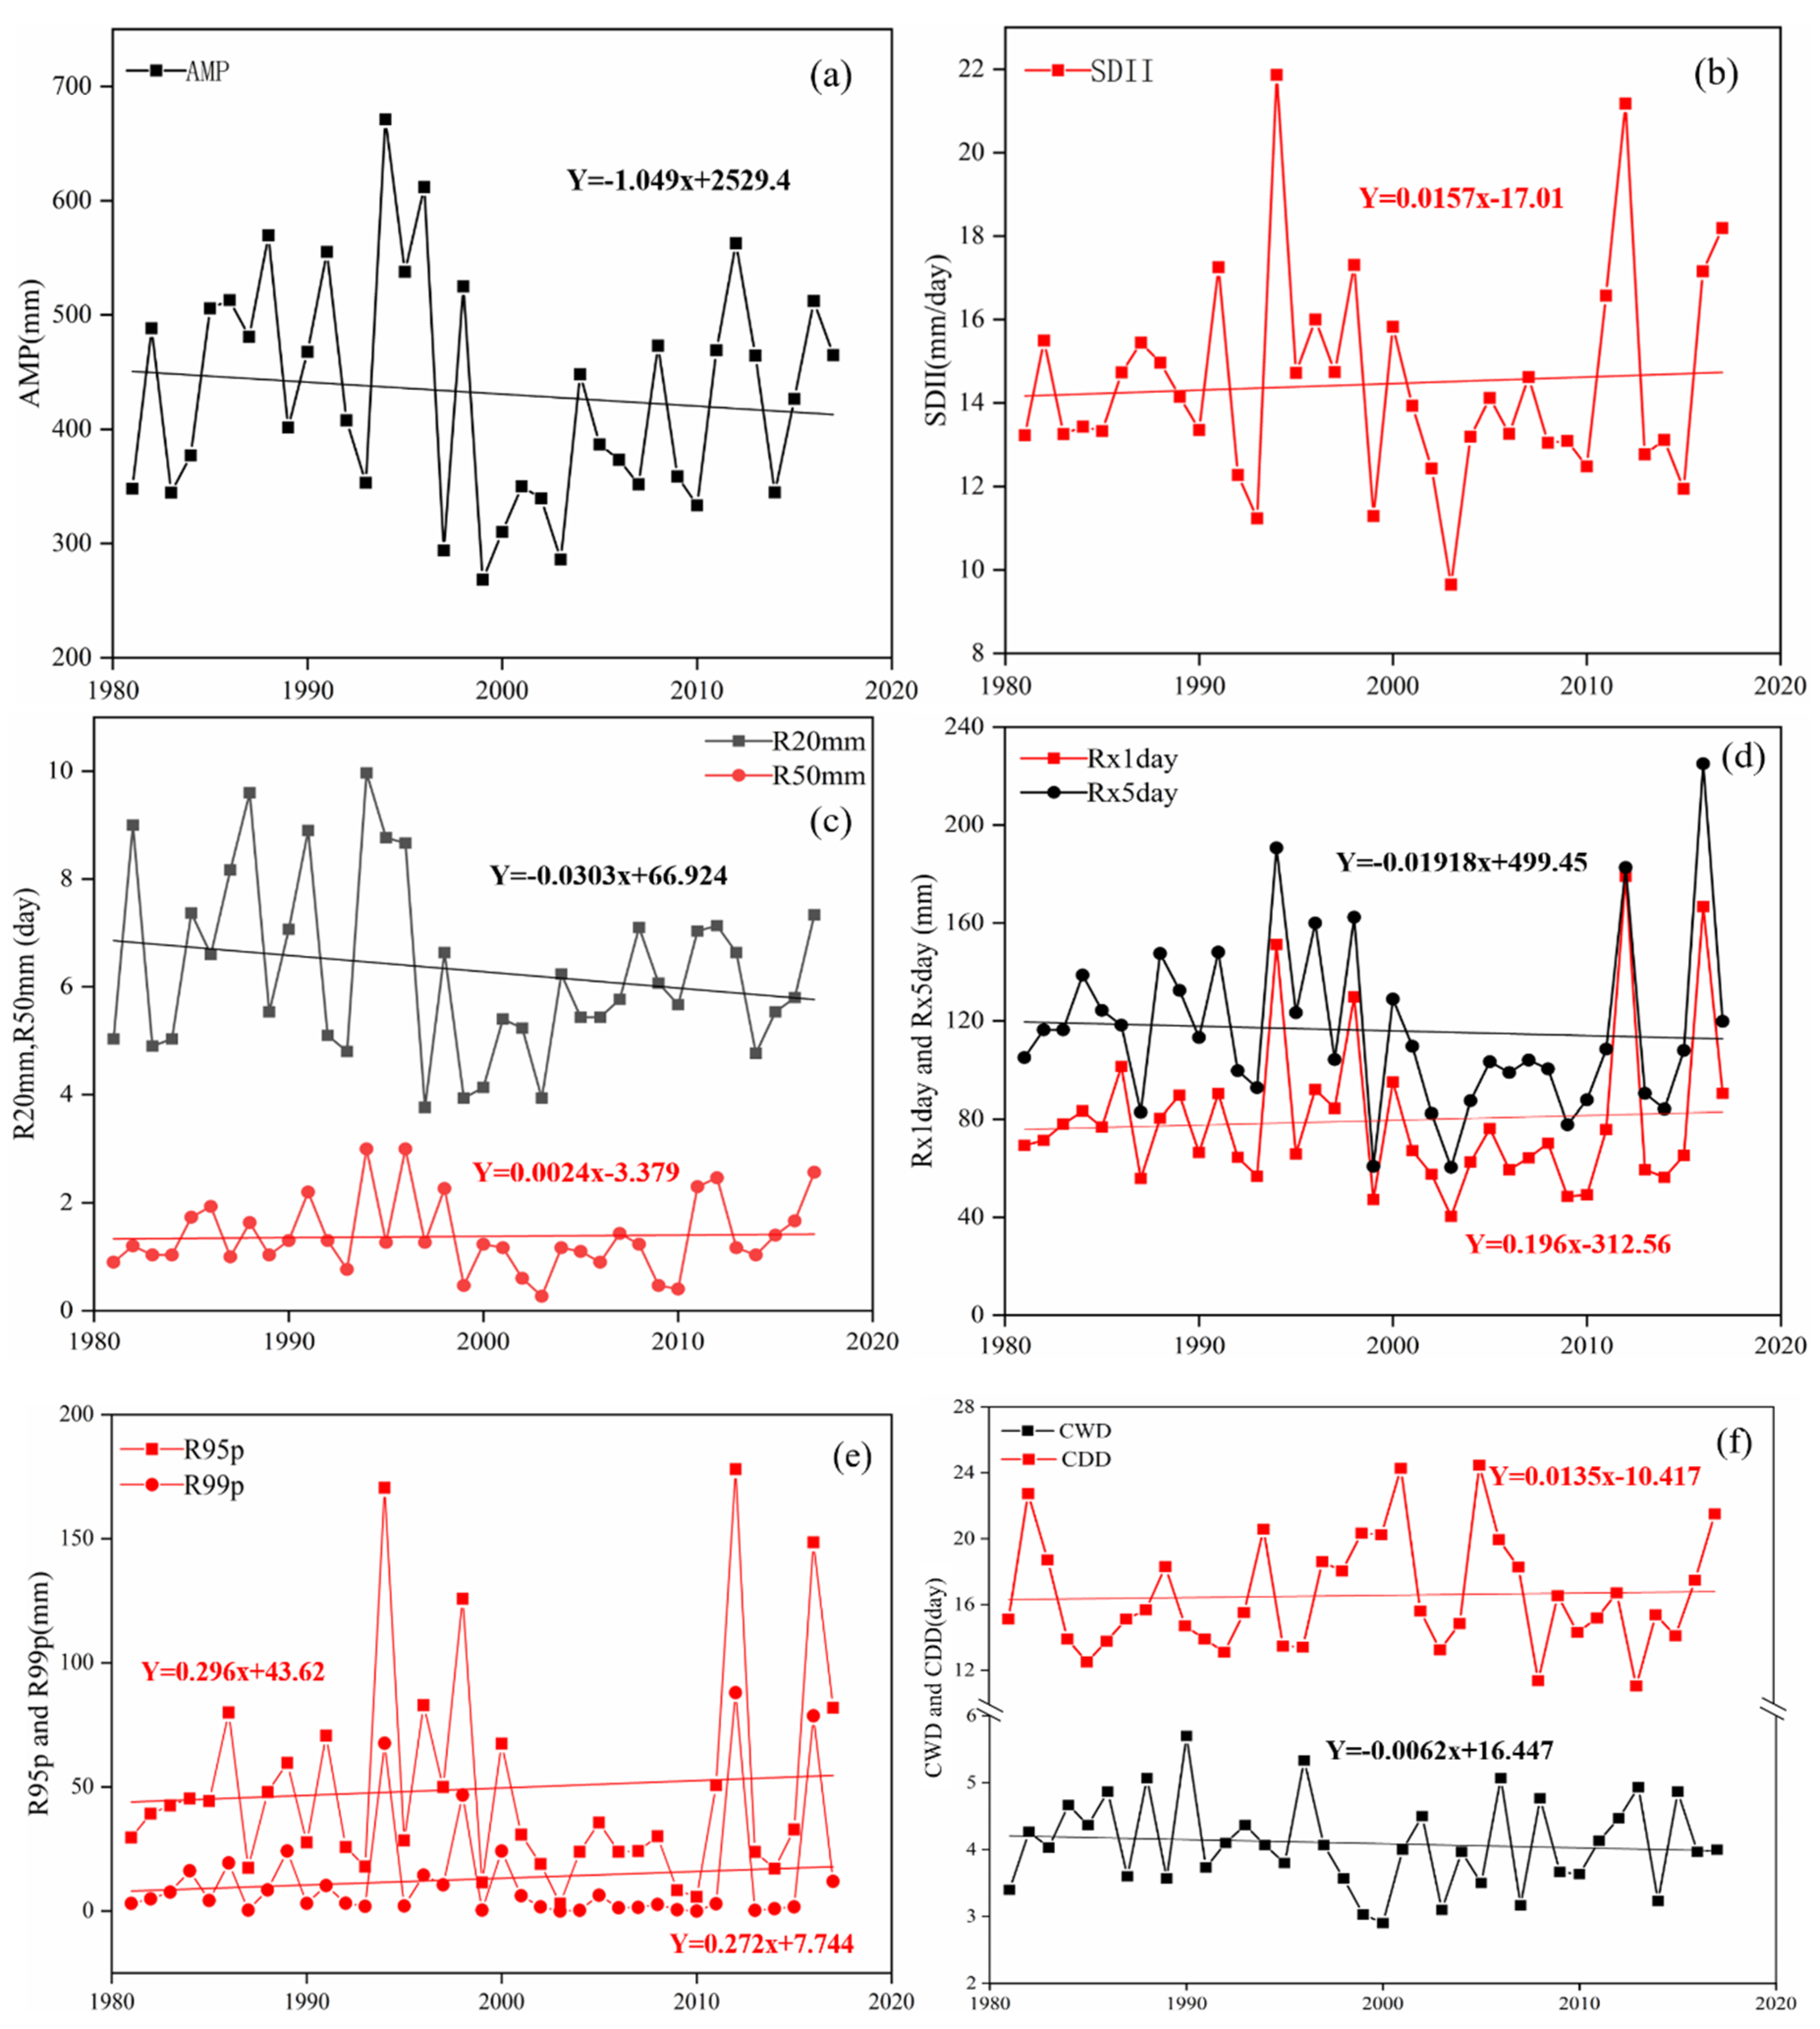
3.2. Temporal Trends of Daily Precipitation Indices in the Wet Seasons
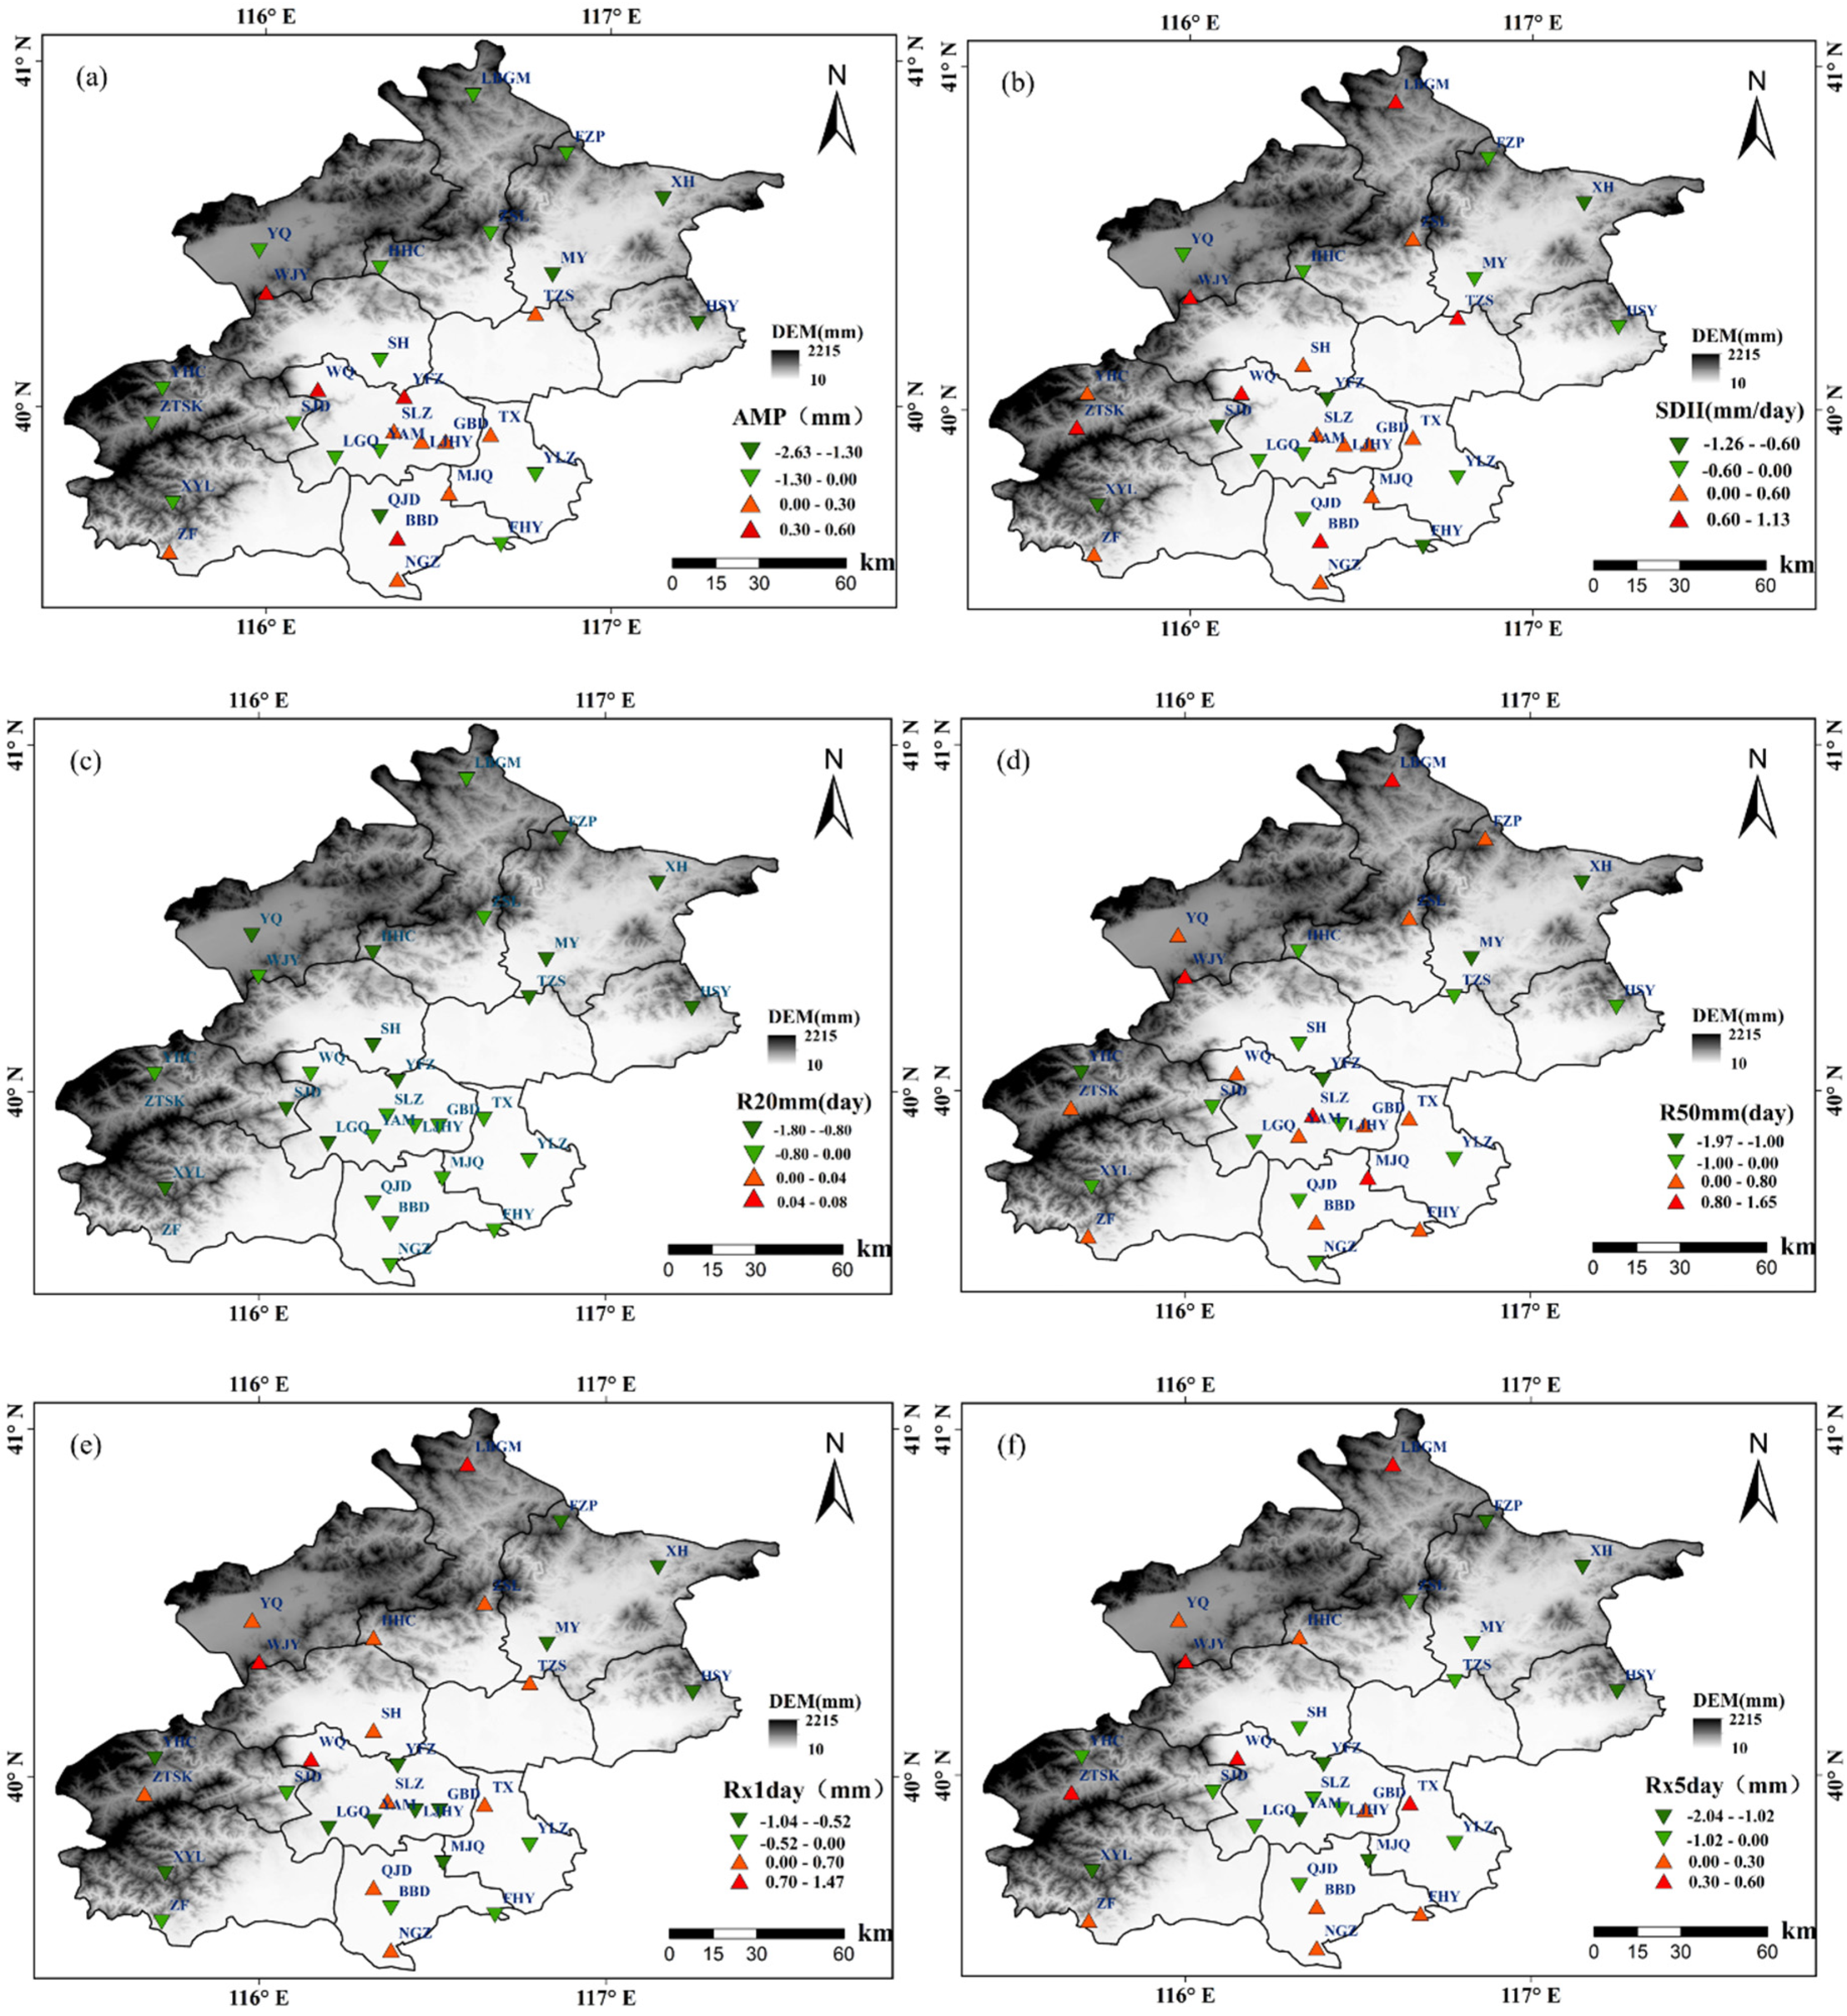
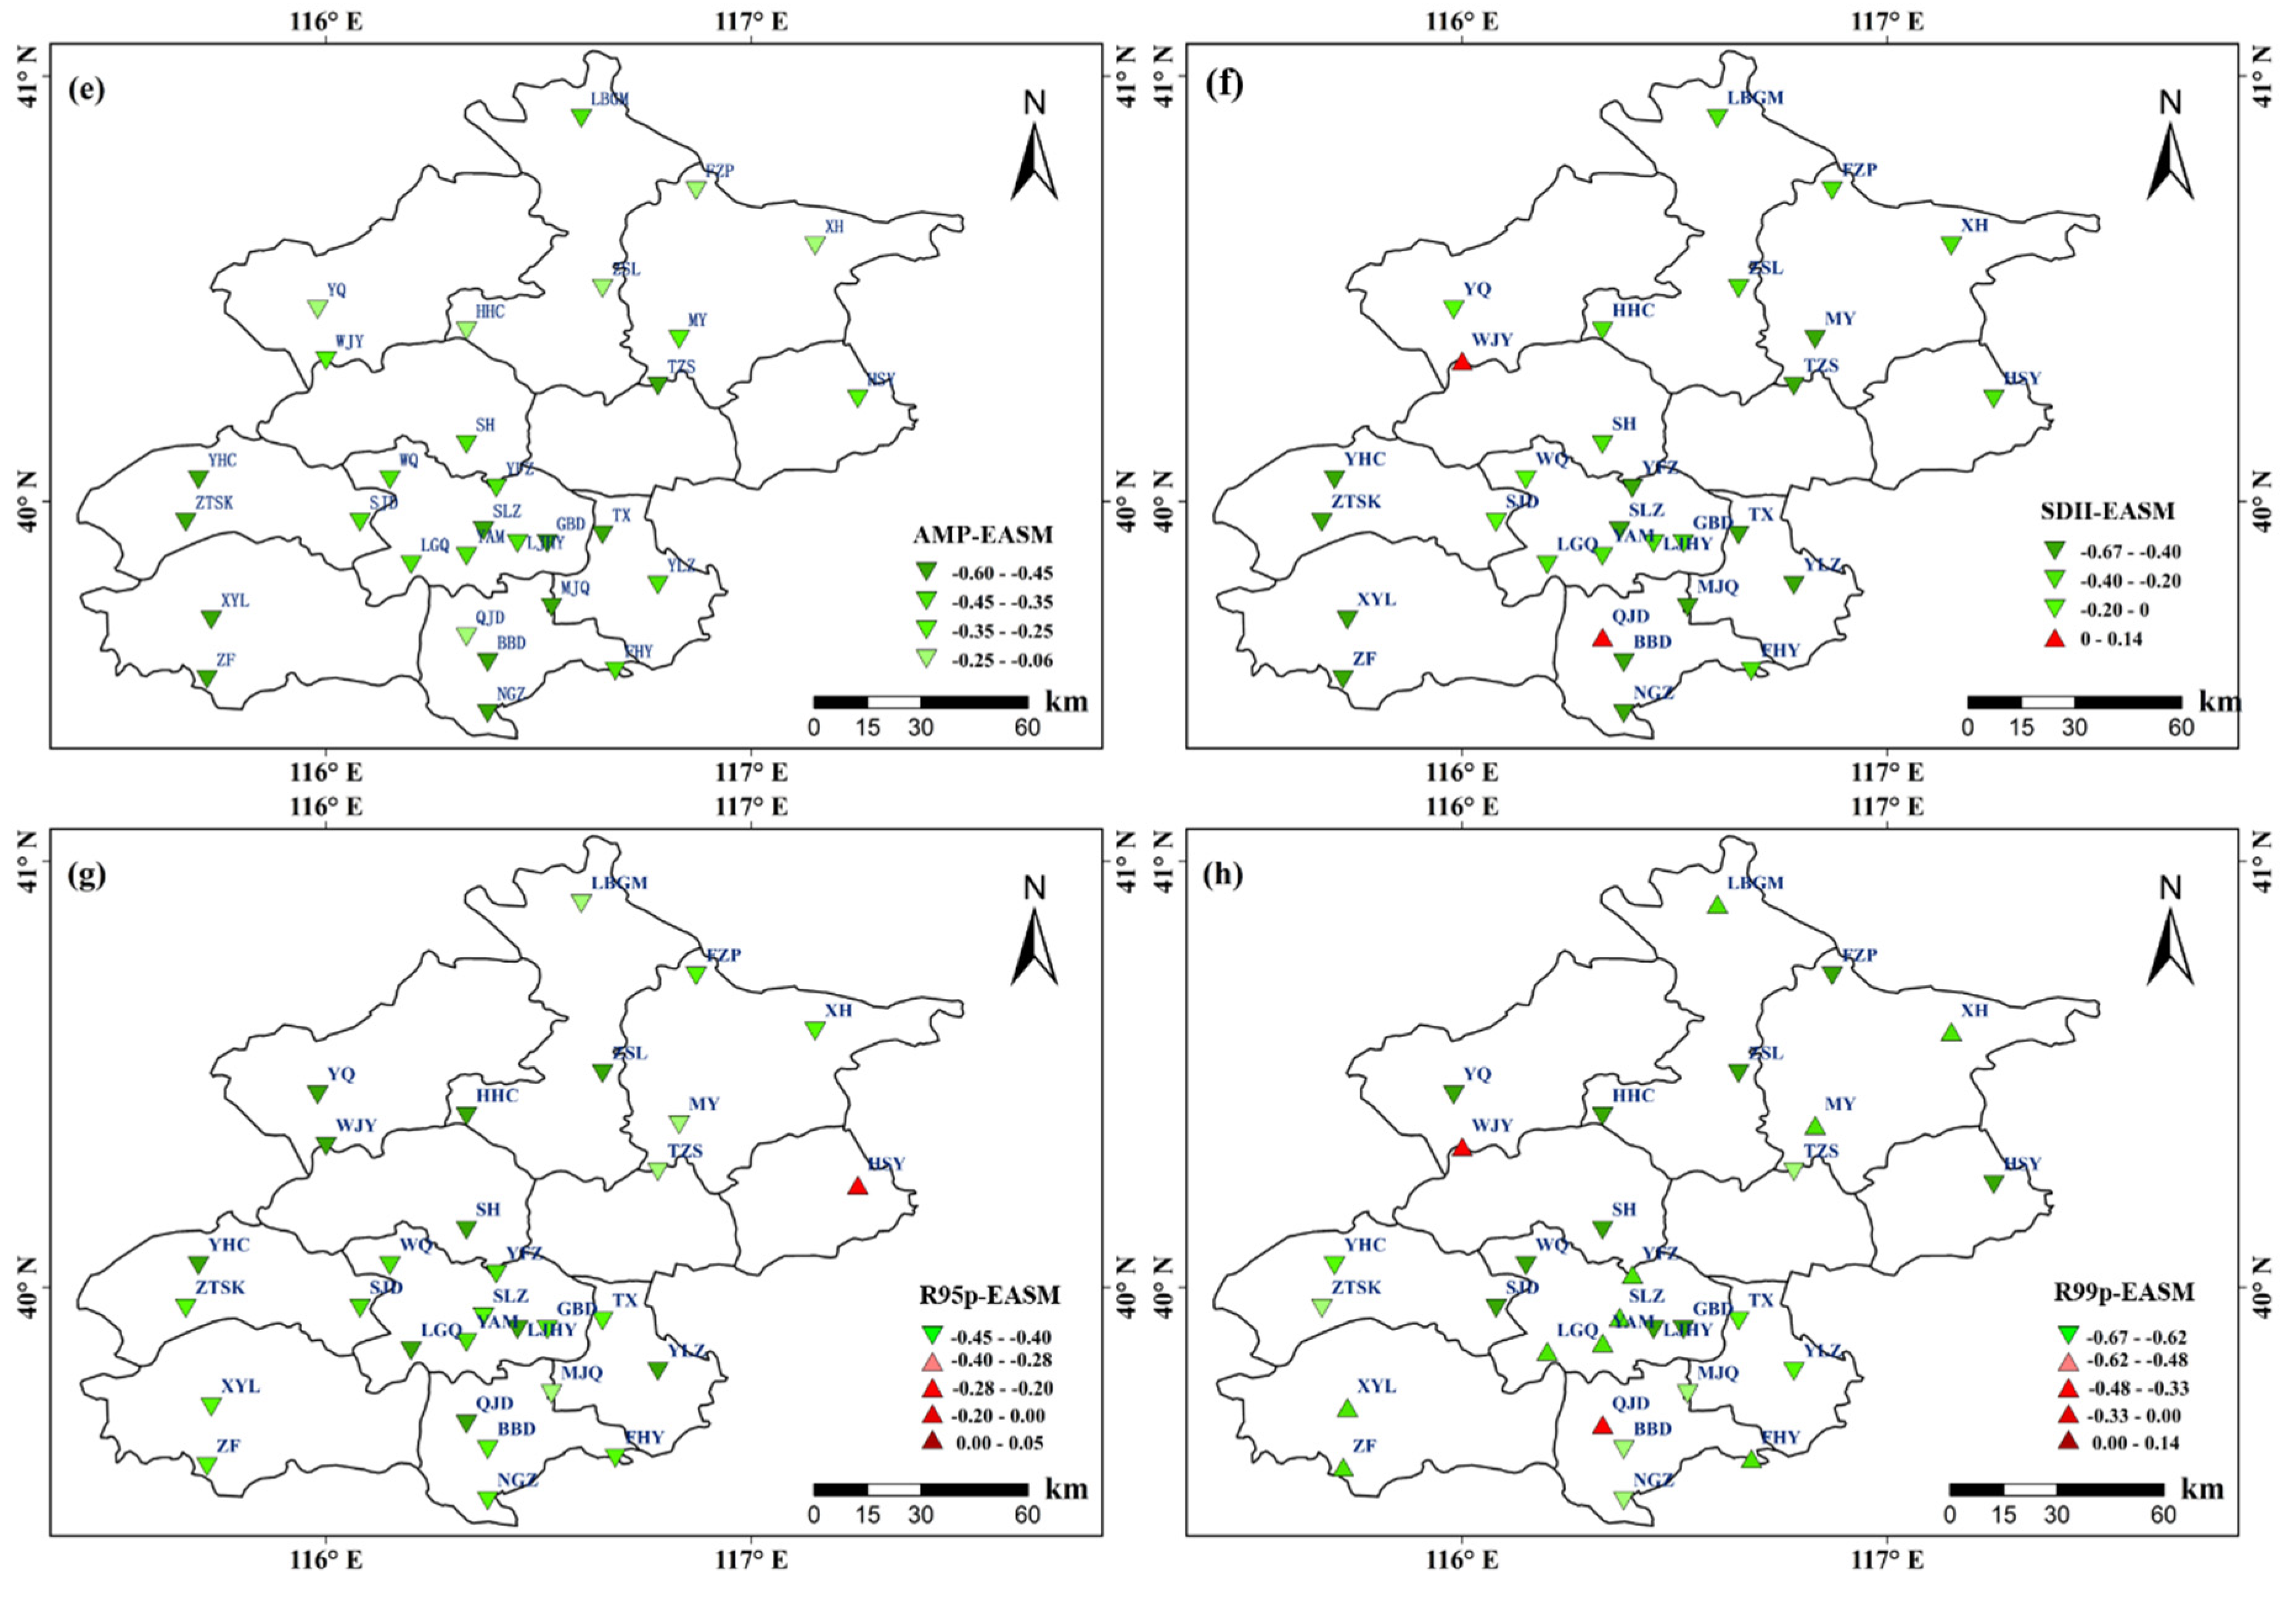
3.3. Spatial Patterns of Precipitation Indices in the Wet Seasons
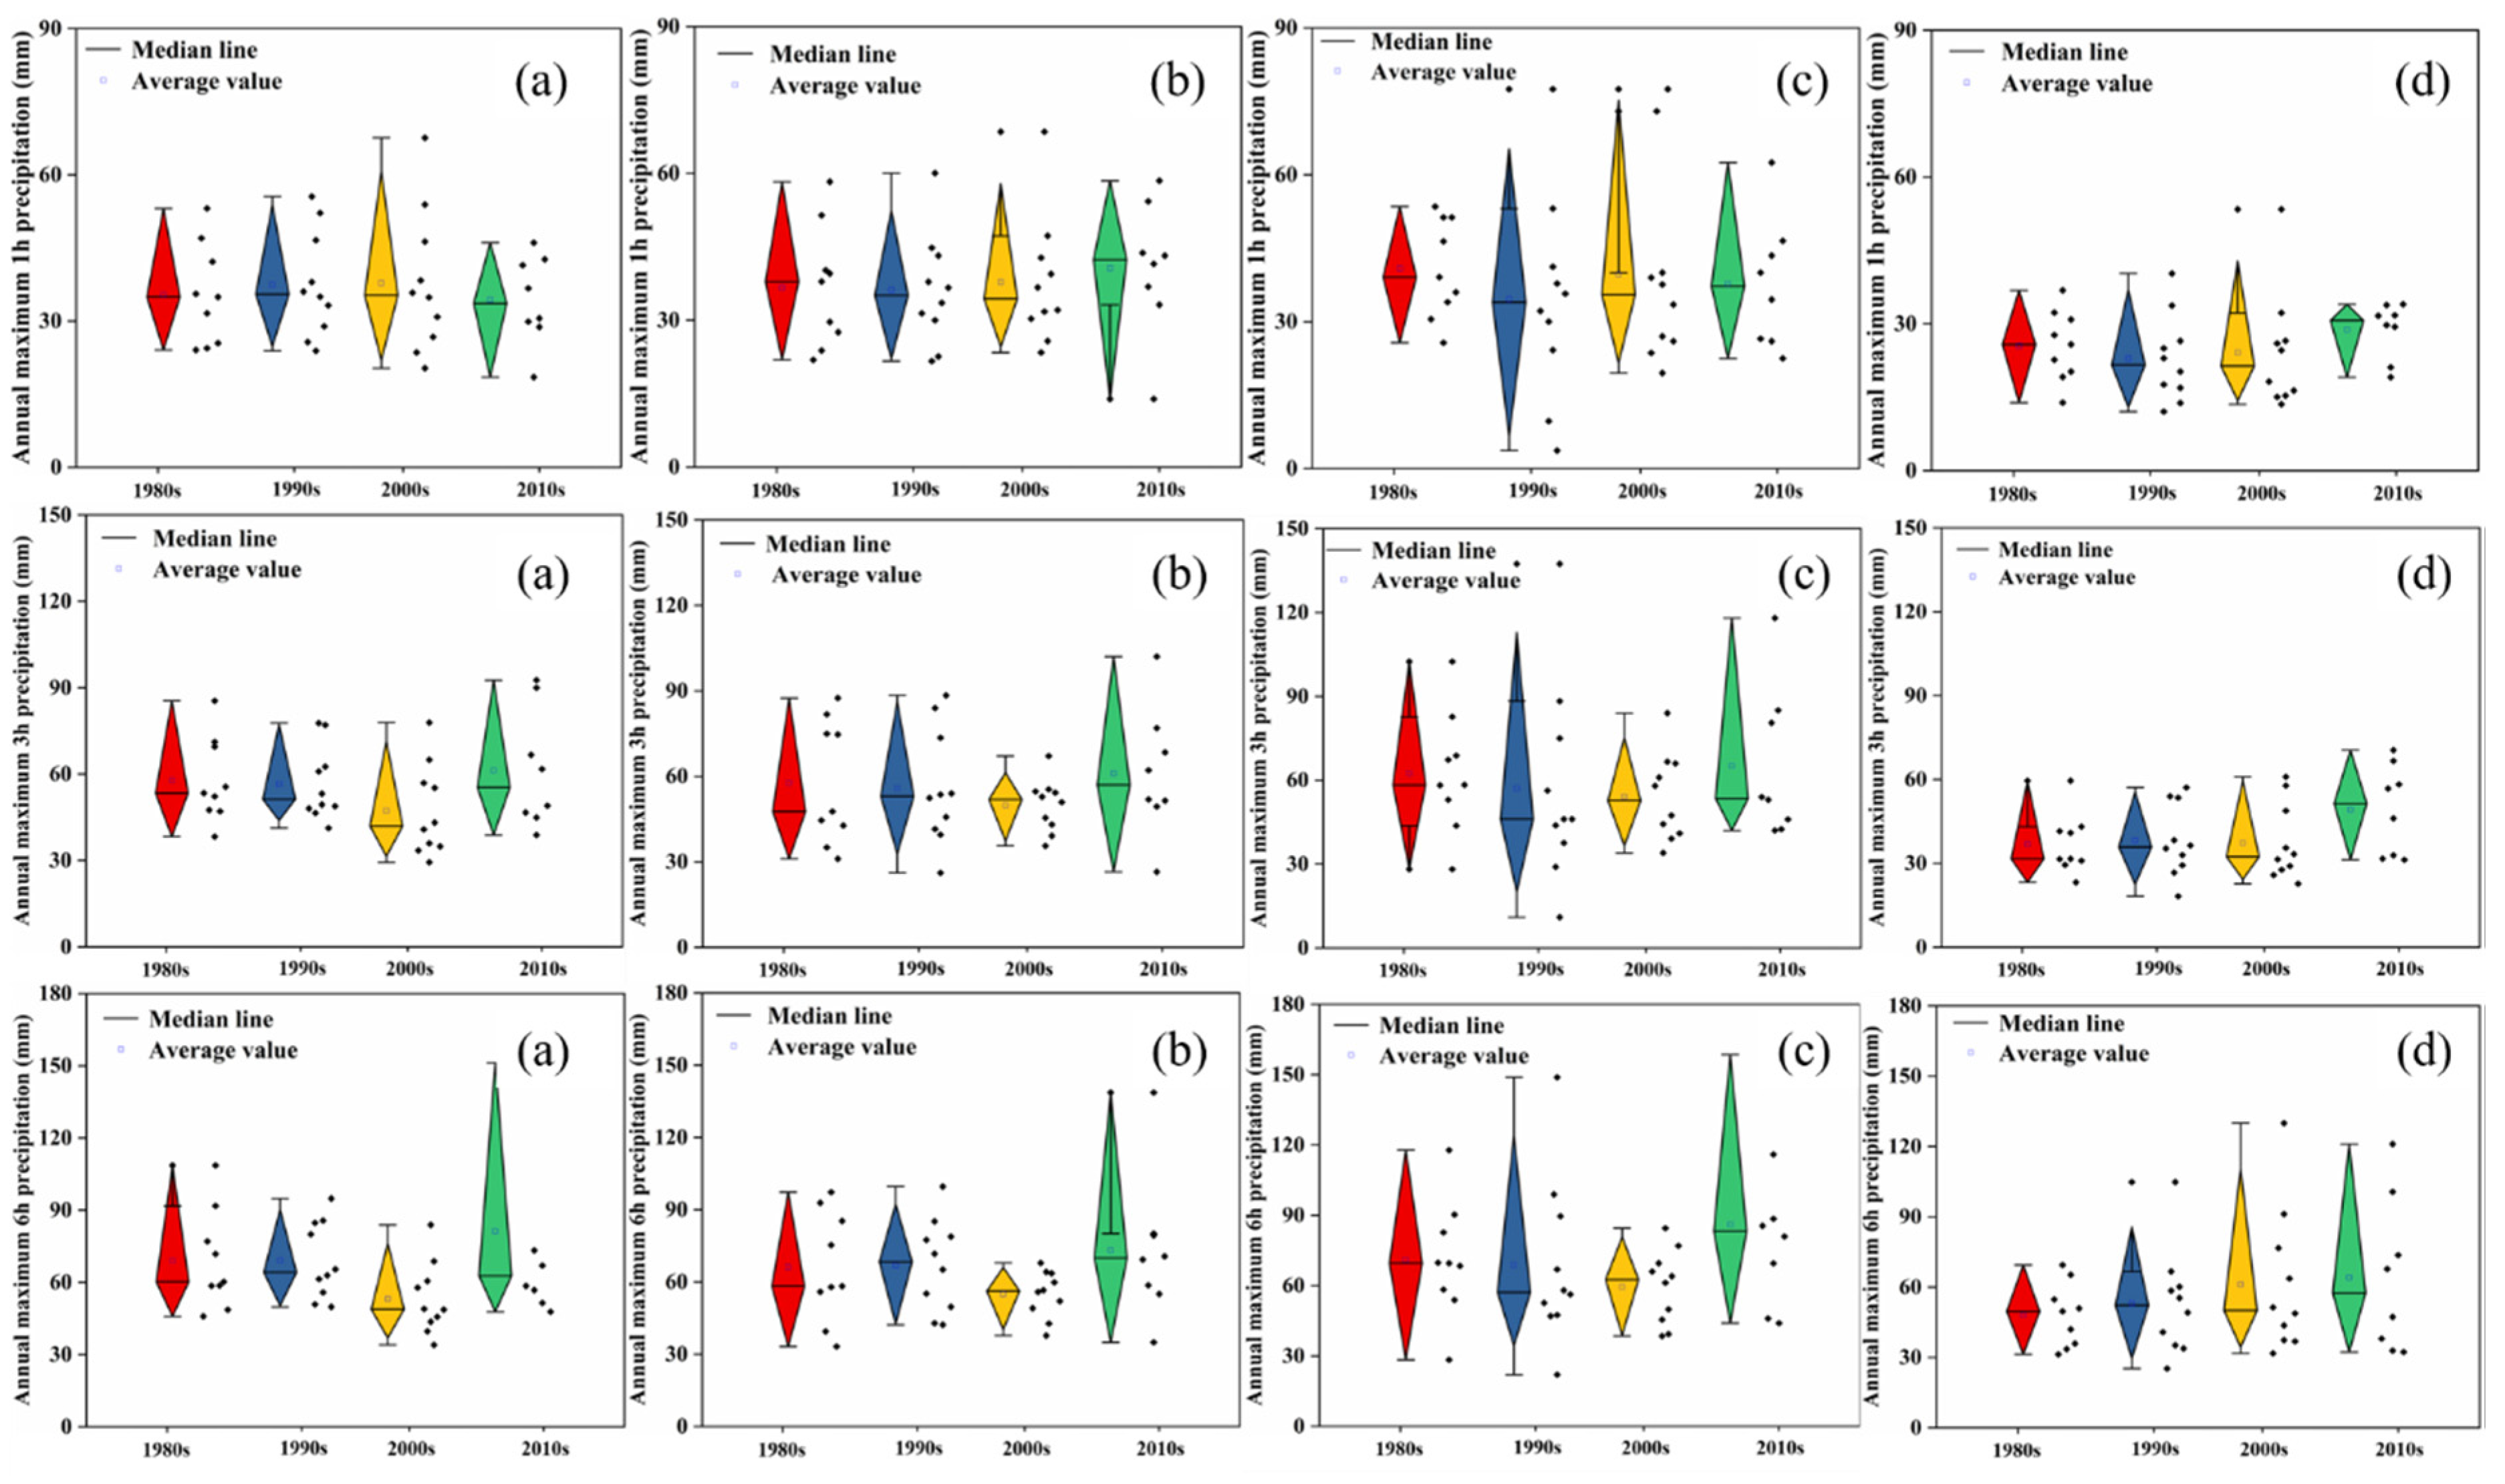
3.4. Temporal Trends of Hourly Precipitation
4. Discussion
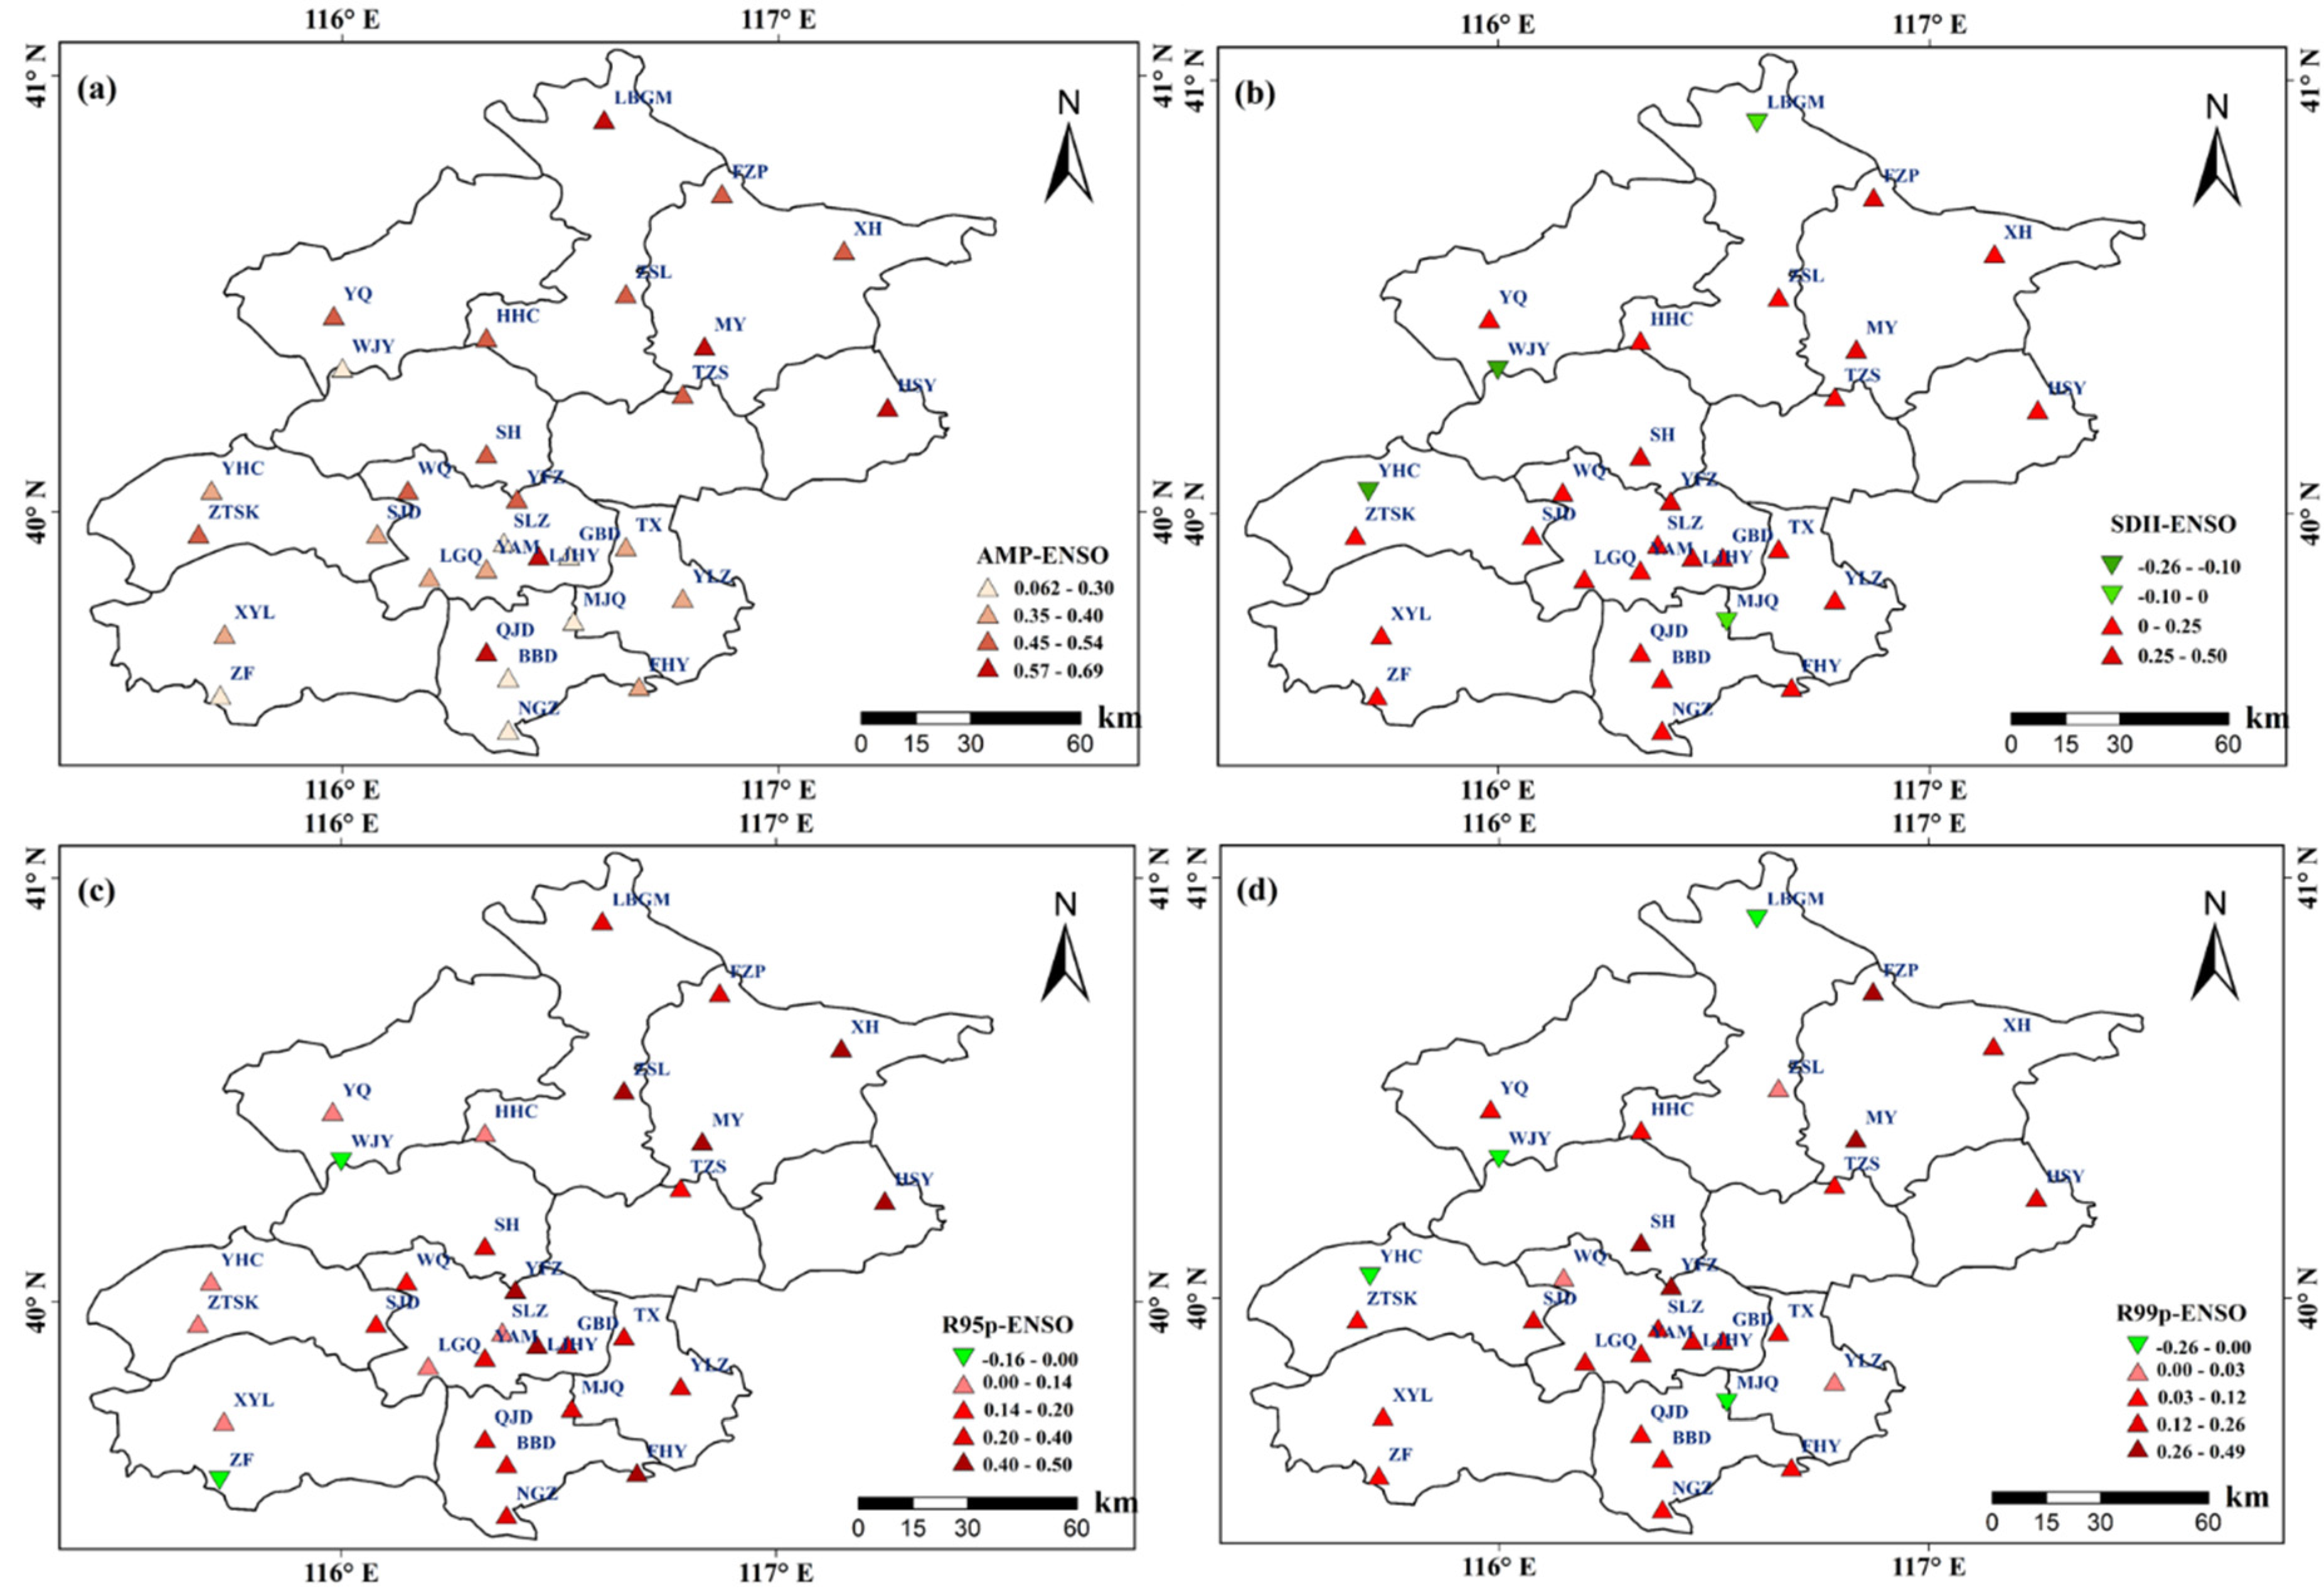
4.1. Correlation between the Atmospheric Circulation Index and Precipitation Indices
4.2. Impact of Urbanization
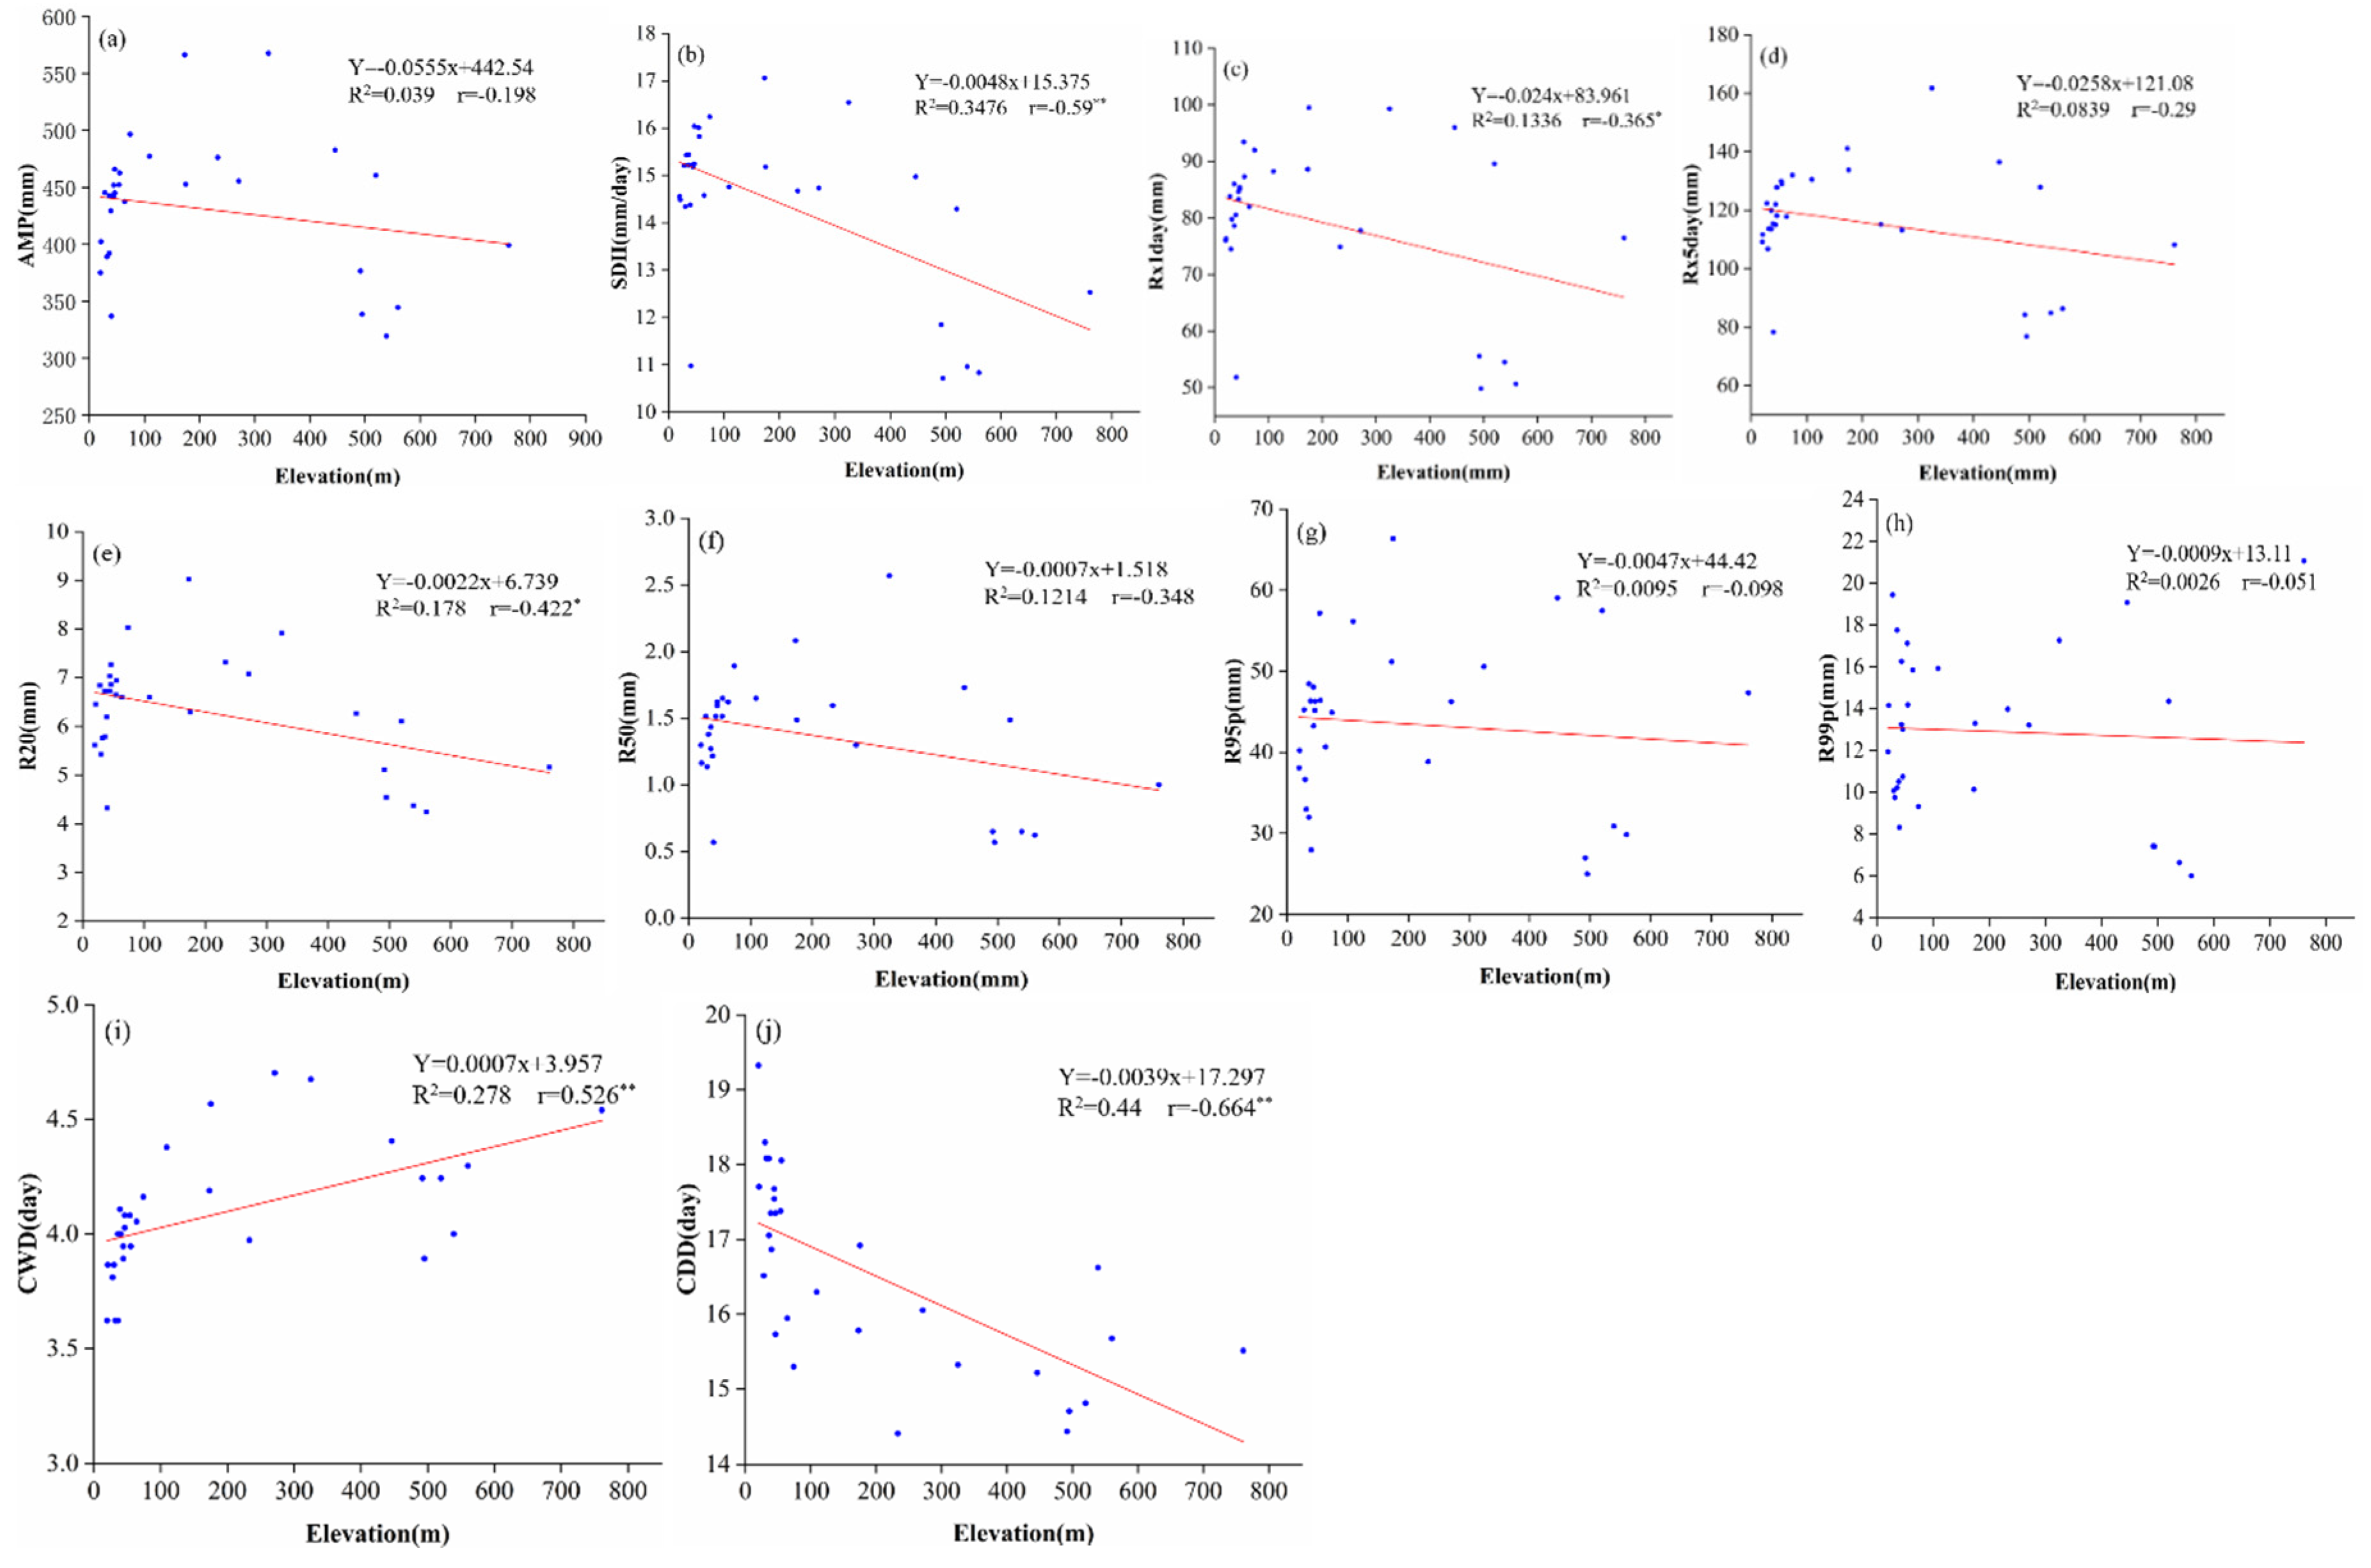
4.3. Relationship between Elevation and the Precipitation Indices
5. Conclusions
Author Contributions
Funding
Conflicts of Interest
References
- Shi Goswami, B.N.; Venugopal, V.; Sengupta, D. Increasing trend of extreme rain events over India in a warming environment. Science 2006, 314, 1442–1445. [Google Scholar] [CrossRef] [PubMed]
- Zhang, Q.; Xiao, M.Z.; Singh, V.P. Max-stable based evaluation of impacts of climate indices on extreme precipitation processes across the Poyang lake basin, China. Glob. Planet. Chang. 2014, 122, 271–281. [Google Scholar] [CrossRef]
- Guan, Y.H.; Zheng, F.L.; Zhang, X.C.; Wang, B. Trends and variability of daily precipitation and extremes during 1960–2012 in the Yangtze river basin, China. Int. J. Climatol. 2017, 37, 1282–1298. [Google Scholar] [CrossRef]
- Roxy, M.K.; Ghosh, S.; Pahak, A.; Athulya, R.; Mujumdar, M.; Murtugudde, R.; Terray, P.; Rajeevan, M. A threefold rise in widespread extreme rain events over central India. Nat. Commun. 2017, 8, 708. [Google Scholar] [CrossRef]
- Vellore, R.K.; Krishnan, R.; Pendharkar, J.; Choudhary, A.D.; Sabin, T.P. On the anomalous precipitation enhancement over the Himalayan foothills during monsoon breaks. Clim. Dynam. 2016, 43, 2009–2031. [Google Scholar] [CrossRef]
- Krishnan, R.; Sabin, T.P.; Vellore, R.; Mujumar, M.; Sanjay, J.; Goswami, B.N.; Hourdin, E.; Dufresse, J.L.; Terry, P. Deciphering the desiccation trend of the south Asian monsoon hydroclimate in a warming world. Clim. Dynam. 2015, 47, 1007–1027. [Google Scholar] [CrossRef]
- IPCC. Climate Change 2013: The Physical Science Basic Contribution of Working Group 7 to the Fifth Assessment Report of the Intergovernmental Panel on Climate Change; Cambridge University Press: Cambridge, UK; New York, NY, USA, 2013. [Google Scholar]
- Trenberth, K.E. Changes in precipitation with climate change. Clim. Res. 2011, 47, 123–138. [Google Scholar] [CrossRef]
- Dore, M.H.I. Climate change and changes in global precipitation patterns: What do we know? Environ. Int. 2005, 31, 1167–1181. [Google Scholar] [CrossRef]
- Jones, P.D.; Hulme, M. Calculating regional climatic time series for temperature and precipitation: Methods and illustrations. Int. J. Climatol. 1996, 16, 361–377. [Google Scholar] [CrossRef]
- Groisman, P.; Keal, T.; Easterling, D.; Knight, R.; Jamason, P.; Hennessy, K.; Suppiah, R.; Page, C.; Wibig, J.; Fortuniak, K.; et al. Changes in the probability of extreme precipitation: Important indicators of climate change. Clim. Chang. 1999, 42, 243–283. [Google Scholar] [CrossRef]
- Lu, Y.Q.; Yan, Y.; Ding, D.; Zhao, C.L.; Song, Y.; Zhao, J.Z. Trends of extreme precipitation in China and their influence on urban drainage pressure. Acta Ecol. Sin. 2018, 38, 1661–1667. (In Chinese) [Google Scholar]
- Willems, P. Revision of urban drainage design rules after assessment of climate change impacts on precipitation extreme at Uccle, Belgium. J. Hydrol. 2013, 496, 166–177. [Google Scholar] [CrossRef]
- Song, X.M.; Zhang, J.Y.; Zou, X.J.; Zhang, C.H.; AghaKouchak, A.; Kong, F.Z. Changes in precipitation extreme in the Beijing metropolitan area during 1960–2012. Atmos. Res. 2019, 222, 134–153. [Google Scholar] [CrossRef]
- Palumbo, A.; Mazzarella, A. Rainfall statistical properties in naples. Mon. Weather Rev. 1980, 108, 1011–1015. [Google Scholar] [CrossRef]
- Song, X.M.; Zhang, J.Y.; Liu, J.F.; Yang, M. Spatial-temporal variation characteristics of precipitation pattern in Beijing. Shuili Xuebao 2015, 46, 525–535. (In Chinese) [Google Scholar]
- Song, X.M.; Zhang, J.Y.; Kong, F.Z.; Wang, G.Q.; He, R.M.; Zhu, K. Spatical-temporal variation characteristics of precipitation extremes in Beijing. Adv. Water Sci. 2017, 28, 161–173. (In Chinese) [Google Scholar]
- Zhai, Y.Z.; Guo, Y.L.; Zhou, J.; Guo, N.; Wang, J.S.; Teng, Y.G. The spatio-temporal variability of annual precipitation and its local impact factors during 1724–2010 in Beijing, China. Hydrol. Process. 2014, 28, 2192–2201. [Google Scholar] [CrossRef]
- Zheng, Z.F.; Wang, A.W.; Gao, H. Characteristics of extreme precipitation events in summer and its effect on urbanization in Beijing area. Meteorol. Mon. 2013, 39, 1635–1641. (In Chinese) [Google Scholar]
- Donat, M.G.; Alexander, L.V.; Yang, H.; Durre, I.; Vose, R.; Dunn, R.J.H.; Willett, K.M.; Aguilar, E.; Bruent, M.; Caesar, J.; et al. Updated analyses of temperature and precipitation extreme indices since the beginning of the twentieth century: The HadEX2 dataset. J. Geophys. Res. 2013, 118, 2098–2118. [Google Scholar] [CrossRef]
- Pinskwar, I.; Chorynski, A.; Graczyk, D.; Kundzewicz, Z.W. Observed changes in extreme precipitation in Poland: 1991–2015 versus 1961–1990. Theor. Appl. Climatol. 2019, 135, 773–787. [Google Scholar] [CrossRef]
- Li, X.; Wang, X.; Babovic, V. Analysis of variability and trends of precipitation extremes in Singapore during 1980–2013. Int. J. Climatol. 2018, 38, 125–141. [Google Scholar] [CrossRef]
- Tan, M.L.; Ibrahim, A.L.; Crachnell, A.P.; Yusop, Z. Changes in precipitation extremes over the Kelantan River Basin, Malaysia. Int. J. Climatol. 2017, 37, 3780–3797. [Google Scholar] [CrossRef]
- Wang, R.; Chen, J.Y.; Chen, X.W.; Wang, Y.F. Variability of precipitation extremes and dryness/wetness over the southeast coastal region of China, 1960–2014. Int. J. Climatol. 2017. [Google Scholar] [CrossRef]
- Zhao, G.J.; Zhai, J.Q.; Tian, P.; Zhang, L.M.; Mu, X.M.; An, Z.F.; Han, M.W. Variations in extreme precipitation on the Loess plateau using a high-resolution dataset and their linkages with atmospheric circulation indices. Theor. Appl. Climatol. 2018, 133, 1235–1247. [Google Scholar] [CrossRef]
- Bai, L. Study on Near Surface Urban Heat Island Effect of Beijing City Based on Remote Sensing; Nanjing University of Information Science & Technology: Nanjing, China, 2017. (In Chinese) [Google Scholar]
- Song, X.M.; Zhang, J.Y.; Achakouchak, A. Rapid urbanization and changes in trends and spatial-temporal characteristics of precipitation in the Beijing metropolitan area. J. Geophys. Res. Atmos. 2014, 119, 11250–11271. [Google Scholar] [CrossRef]
- Wang, J.L.; Zhang, R.H.; Wang, Y.C. Areal differences in diurnal variations in summer precipitation over Beijing metropolitan region. Theor. Appl. Climatol. 2012, 110, 395–408. [Google Scholar] [CrossRef]
- Hu, Y.J.; Kong, X.B.; Zhang, B.D. Spatiotemporal features of land use change in Beijing in the past 30 years. J. China Agric. Univ. 2018, 23, 1–14. (In Chinese) [Google Scholar]
- You, Q.L.; Kang, S.C.; Aguilar, E.; Yan, Y. Changes in daily climate extremes in the eastern and central Tibetan Plateau during 1961–2005. J. Geophys. Res. 2018, 113. [Google Scholar] [CrossRef]
- Skansi, M.M.; Brunet, M.; SigróJ, A.E.; Groening, J.A.A.; Bentancur, O.J.; Geier, Y.R.C.; Amaya, R.L.C.; Jácome, H.; Ramos, A.M.; Rojas, C.O.; et al. Warming and wetting signals emerging from analysis of changes in climate extreme indices over South America. Glob. Planet. Chang. 2013, 100, 295–307. [Google Scholar] [CrossRef]
- He, L.S. Spatial-Temporal Variation of the Precipitation in North China and the Impact Factors of Precipitation Reduction; Nanjing University of Information Science & Technology: Nanjing, China, 2011. (In Chinese) [Google Scholar]
- Li, S.P. Impact of Atmospheric Circulation Patterns over East Asia on Summer Precipitation in Eastern China; Lanzhou University: Lanzhou, China, 2015. (In Chinese) [Google Scholar]
- Wu, W.B.; You, Q.L.; Wang, D.; Ruan, N. Characteristics of extreme precipitation and associated anomalous circulation over Eastern China during boreal summer. Clim. Environ. Res. 2018, 23, 47–58. (In Chinese) [Google Scholar]
- Fu, G.B.; Yu, J.J.; Yu, X.B.; Ouyang, R.L.; Zhang, Y.C.; Wang, P.; Liu, W.B.; Min, L.L. Temporal variation of extreme rainfall events in China, 1961–2009. J. Hydrol. 2013, 487, 48–59. [Google Scholar] [CrossRef]
- Miao, C.Y.; Duan, Q.Y.; Sun, Q.H.; Lei, X.H.; Li, H. Non-uniform changes in different categories of precipitation intensity across China and the associated large- scale circulations. Environ. Res. Lett. 2019, 14, 025004. [Google Scholar] [CrossRef]
- Wei, W.; Shi, Z.J.; Yang, X.H.; Wei, Z.; Liu, Y.S.; Zhang, Z.Y.; Ge, G.; Zhang, X.; Guo, H.; Wang, B.T. Recent trends of extreme precipitation and their teleconnection with atmospheric circulation in the Beijing—Tianjin sand source region, China, 1960–2014. Atmosphere 2017, 8, 83. [Google Scholar] [CrossRef]


| Regions | Name of Stations | Elevation (m) | Regions | Name of Stations | Elevation (m) |
|---|---|---|---|---|---|
| Central urban area | Gaobeidian (GBD) | 36 | Near southern suburb | Banbidian (BBD) | 33 |
| Lejiahuayuan (LJHY) | 44 | Fengheying (FHY) * | 20 | ||
| Lugouqiao (LGQ) * | 64 | Majuqiao (MJQ) | 30 | ||
| Songlinzha (SLZ) * | 55 | Nangezhuang (NGZ) | 32 | ||
| Wenquan (WQ) * | 54 | Yulinzhuang (YLZ) | 21 | ||
| Tongxian (TX) | 28 | Far suburb | Fanzipai (FZP) | 520 | |
| Yangfangzha (YFZ) | 44 | Huangsongyu (HSY) | 173 | ||
| You’an men (YAM) | 46 | Miyun (MY) * | 74 | ||
| Near northern suburb | Shahe (SH) | 39 | Tangzhishan (TZS) | 46 | |
| Southwest mountainous area | Sanjiadian (SJD) | 175 | Xiahui (XH) | 233 | |
| Wangjiayuan (WJY) * | 761 | Northwest mountainous area | Huanghuacheng (HHC) * | 271 | |
| Xiayunling (XYL) | 446 | Labagoumen (LBGM) | 492 | ||
| Yanhecheng (YHC) | 539 | Qianjiadian (QJD) | 40 | ||
| Zhaitangshuiku (ZTSK) | 560 | Yanqing (YQ) | 495 | ||
| Zhangfang (ZF) | 109 | Zaoshulin (ZSL) | 325 |
| Code | Descriptive Name | Definition of the Indices | Units |
|---|---|---|---|
| AMP | Annual mean precipitation | Annual mean precipitation | mm |
| SDII | Simply daily intensity index | Annual mean precipitation/total number of wet days | mm/day |
| R20mm | Number of moderate precipitation days | Annual precipitation days with daily precipitation greater than 20 mm | days |
| R50mm | Number of violent precipitation days | Annual precipitation days with daily precipitation greater than 50 mm | days |
| Rx1day | Maximum 1-day precipitation amount | Annual maximum 1-day precipitation | mm |
| Rx5day | Maximum 5-day precipitation amount | Annual maximum five consecutive days of precipitation | mm |
| R95p | Precipitation on very wet days | Annual precipitation exceeds 95% threshold | mm |
| R99p | Precipitation on extremely wet days | Annual precipitation exceeds 99% threshold | mm |
| CWD | Maximum consecutive wet days | Maximum number of consecutive days with daily precipitation greater than or equal to 1.0 mm | days |
| CDD | Maximum consecutive dry days | Maximum number of consecutive days with daily precipitation less than 1.0 mm | days |
| Areas | Precipitation Indices | |||||||||
|---|---|---|---|---|---|---|---|---|---|---|
| AMP mm | SDII mm/day | R20mm day | R50mm day | Rx1day mm | Rx5day mm | R95p mm | R99p mm | CWD day | CDD day | |
| Urban area | 447.43 | 15.31 | 6.80 | 1.52 | 85.70 | 121.76 | 46.93 | 15.86 | 3.98 | 17.19 |
| North suburb | 429.36 | 14.38 | 6.19 | 1.22 | 80.54 | 115.38 | 46.32 | 10.52 | 4.11 | 17.35 |
| South suburb | 385.70 | 14.85 | 5.81 | 1.28 | 77.04 | 110.95 | 35.98 | 11.23 | 3.72 | 18.30 |
| Far suburb | 493.05 | 15.66 | 7.55 | 1.74 | 86.10 | 128.79 | 47.50 | 11.71 | 4.12 | 15.21 |
| Southwest mountainous area | 412.63 | 13.21 | 5.49 | 1.19 | 77.56 | 113.35 | 48.26 | 13.67 | 4.36 | 16.04 |
| Northwest mountainous area | 415.03 | 12.96 | 5.79 | 1.13 | 66.85 | 102.86 | 35.34 | 10.73 | 4.30 | 15.48 |
| All stations | 430.53 | 14.40 | 6.27 | 1.35 | 78.96 | 115.51 | 43.39 | 12.29 | 4.10 | 16.59 |
| Areas | Precipitation Indices | |||||||||
|---|---|---|---|---|---|---|---|---|---|---|
| AMP mm | SDII mm/day | R20mm day | R50mm day | Rx1day mm | Rx5day mm | R95p mm | R99p mm | CWD day | CDD day | |
| Urban area | 0.07 | 0.04 | −0.53 | 0.02 | −0.29 | −0.52 | −0.17 | −0.12 | −0.24 | 1.13 |
| North suburb | −0.77 | 0.07 | −1.58 | −0.09 | 0.42 | −0.72 | 0.22 | 0.65 | −0.84 | −0.66 |
| South suburb | −0.13 | 0.17 | −0.47 | 0.28 | −0.30 | −0.30 | −0.20 | −0.49 | 0.27 | −0.10 |
| Far suburb | −1.35 | −0.29 | −1.22 | −0.87 | −0.56 | −1.16 | −0.60 | −0.41 | −0.81 | −0.12 |
| Southwest mountainous area | −0.28 | 0.16 | −0.63 | 0.10 | −0.10 | −0.18 | −0.16 | 0 | −0.32 | −0.04 |
| Northwest mountainous area | −0.89 | 0.21 | −0.87 | 0.36 | 0.66 | −0.09 | 0.83 | 0.70 | −1.34 | −0.17 |
| All stations | −0.56 | 0.06 | −0.88 | −0.03 | −0.03 | −0.50 | −0.08 | 0.33 | −0.55 | 0.01 |
© 2020 by the authors. Licensee MDPI, Basel, Switzerland. This article is an open access article distributed under the terms and conditions of the Creative Commons Attribution (CC BY) license (http://creativecommons.org/licenses/by/4.0/).
Share and Cite
Ren, M.; Xu, Z.; Pang, B.; Liu, J.; Du, L. Spatiotemporal Variability of Precipitation in Beijing, China during the Wet Seasons. Water 2020, 12, 716. https://doi.org/10.3390/w12030716
Ren M, Xu Z, Pang B, Liu J, Du L. Spatiotemporal Variability of Precipitation in Beijing, China during the Wet Seasons. Water. 2020; 12(3):716. https://doi.org/10.3390/w12030716
Chicago/Turabian StyleRen, Meifang, Zongxue Xu, Bo Pang, Jiangtao Liu, and Longgang Du. 2020. "Spatiotemporal Variability of Precipitation in Beijing, China during the Wet Seasons" Water 12, no. 3: 716. https://doi.org/10.3390/w12030716
APA StyleRen, M., Xu, Z., Pang, B., Liu, J., & Du, L. (2020). Spatiotemporal Variability of Precipitation in Beijing, China during the Wet Seasons. Water, 12(3), 716. https://doi.org/10.3390/w12030716