Visualization Framework for High-Dimensional Spatio-Temporal Hydrological Gridded Datasets using Machine-Learning Techniques


Abstract
1. Introduction
2. Materials and Methods
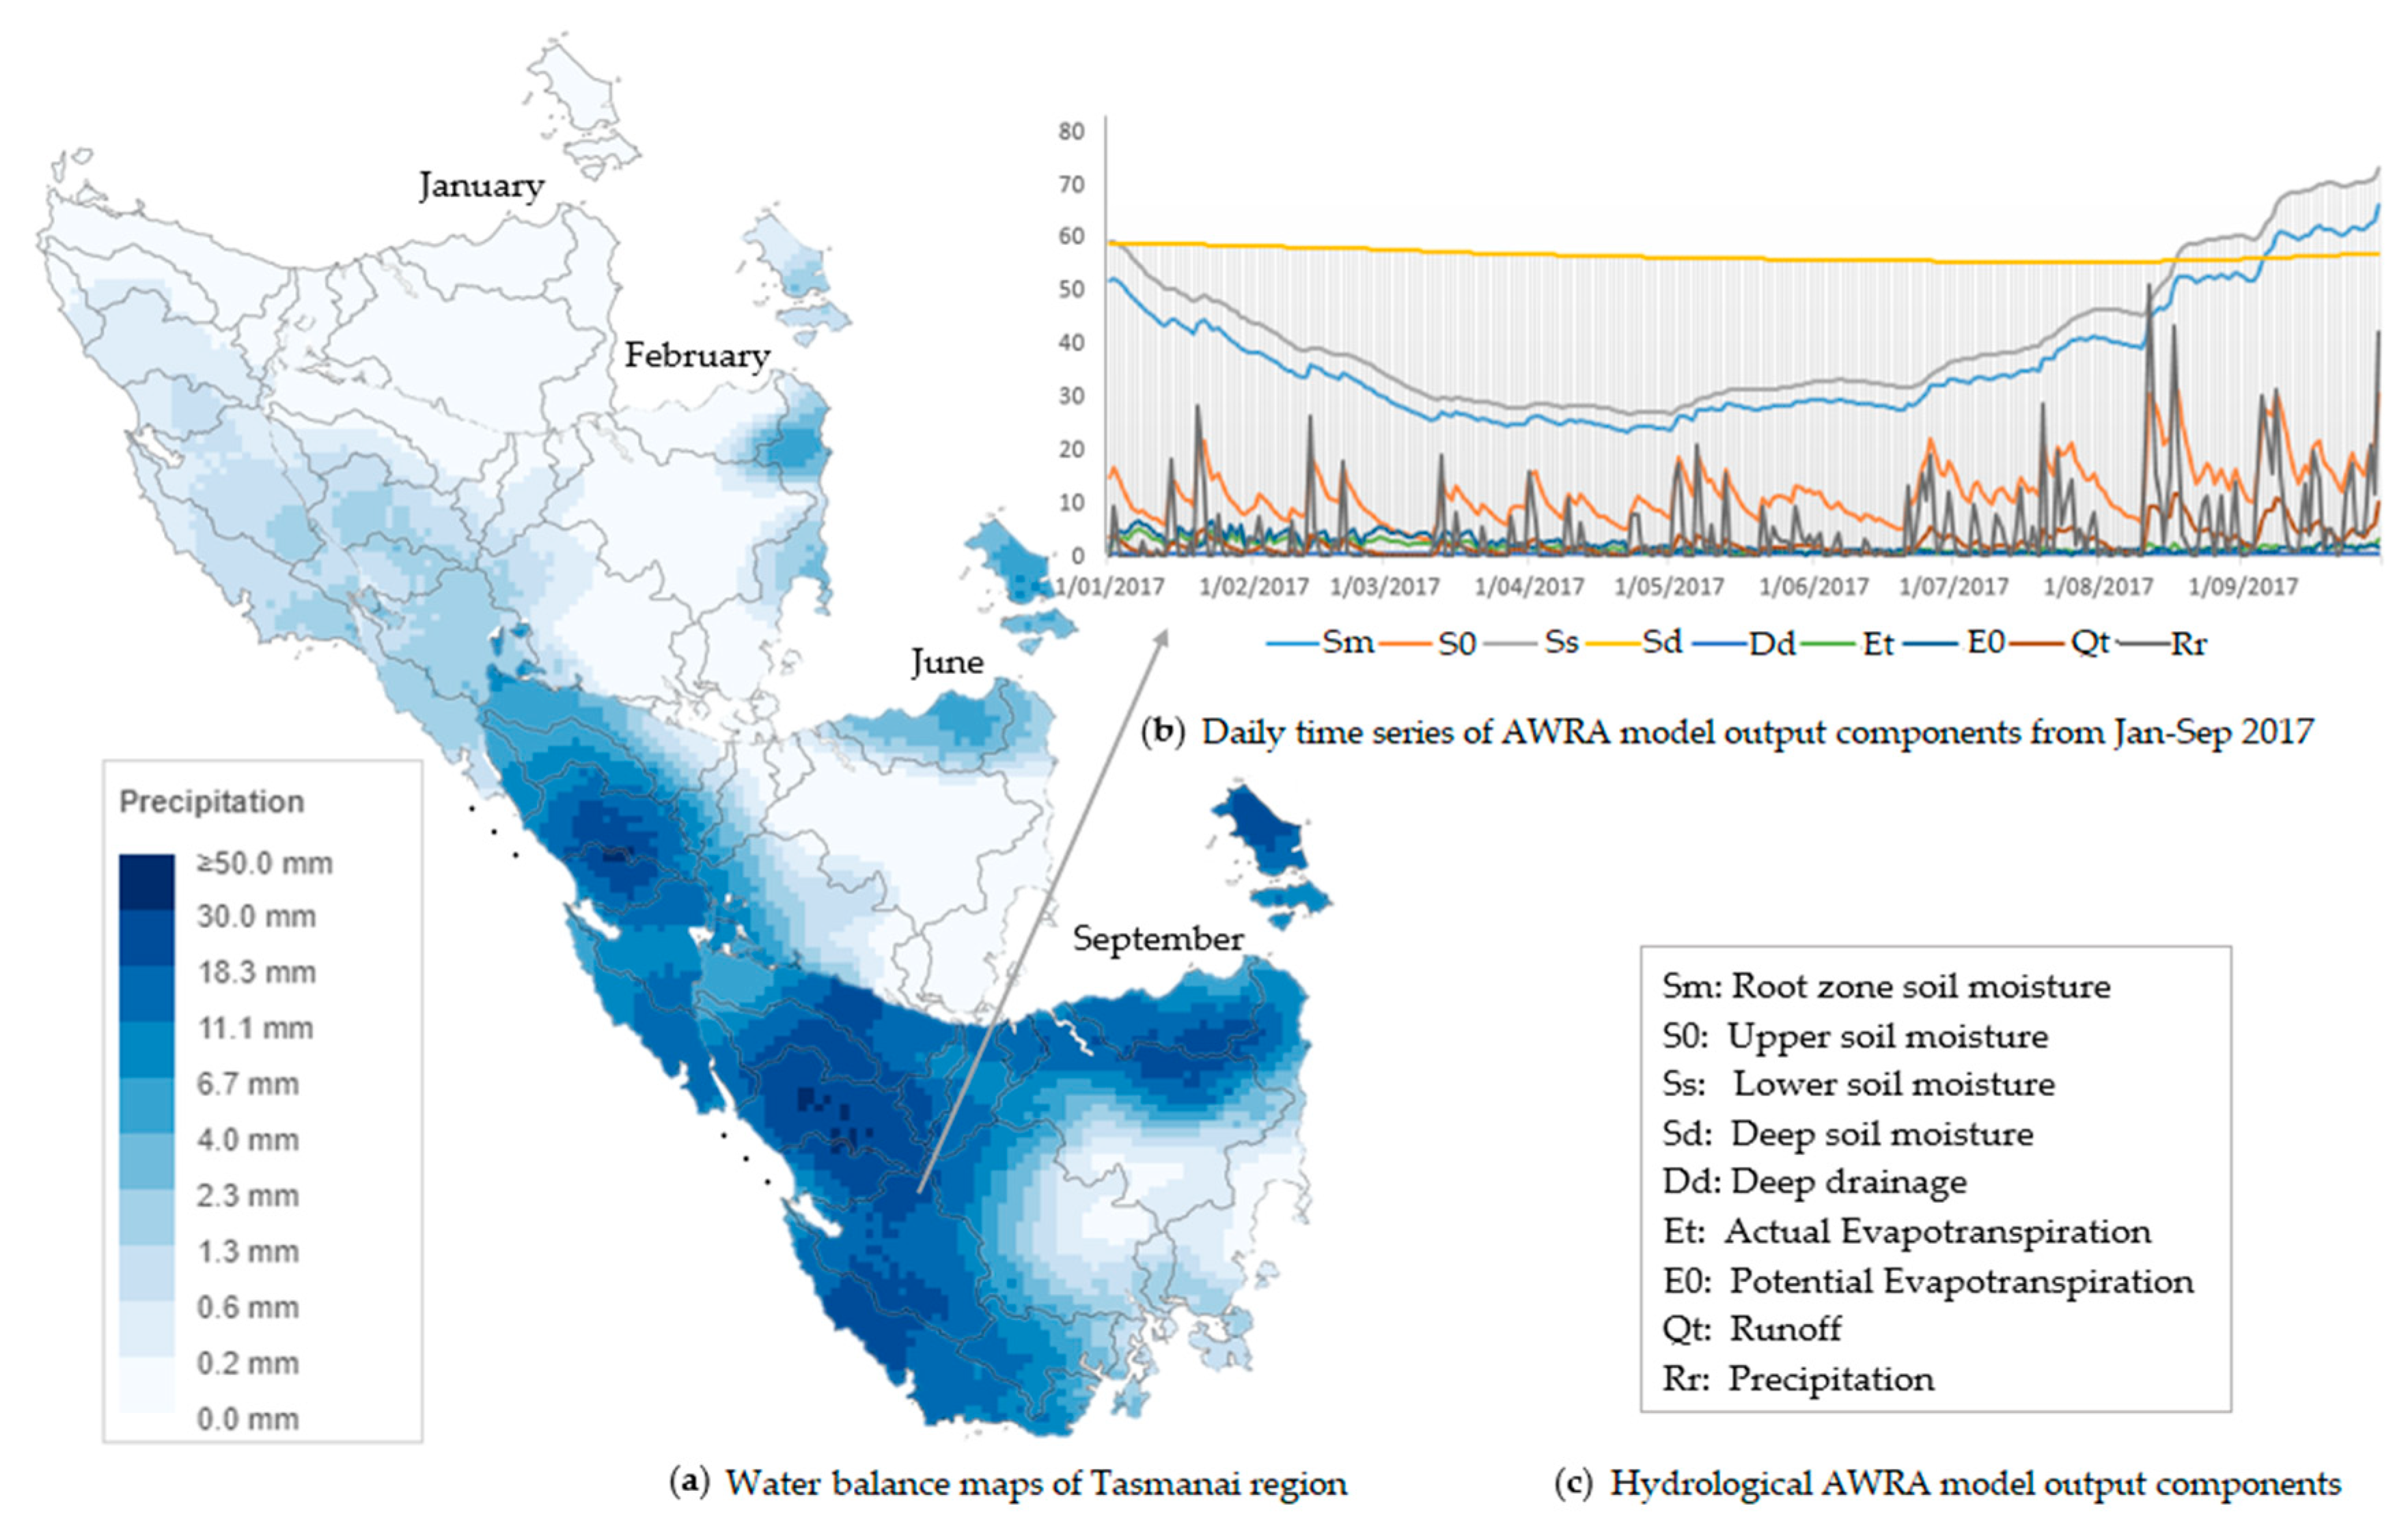
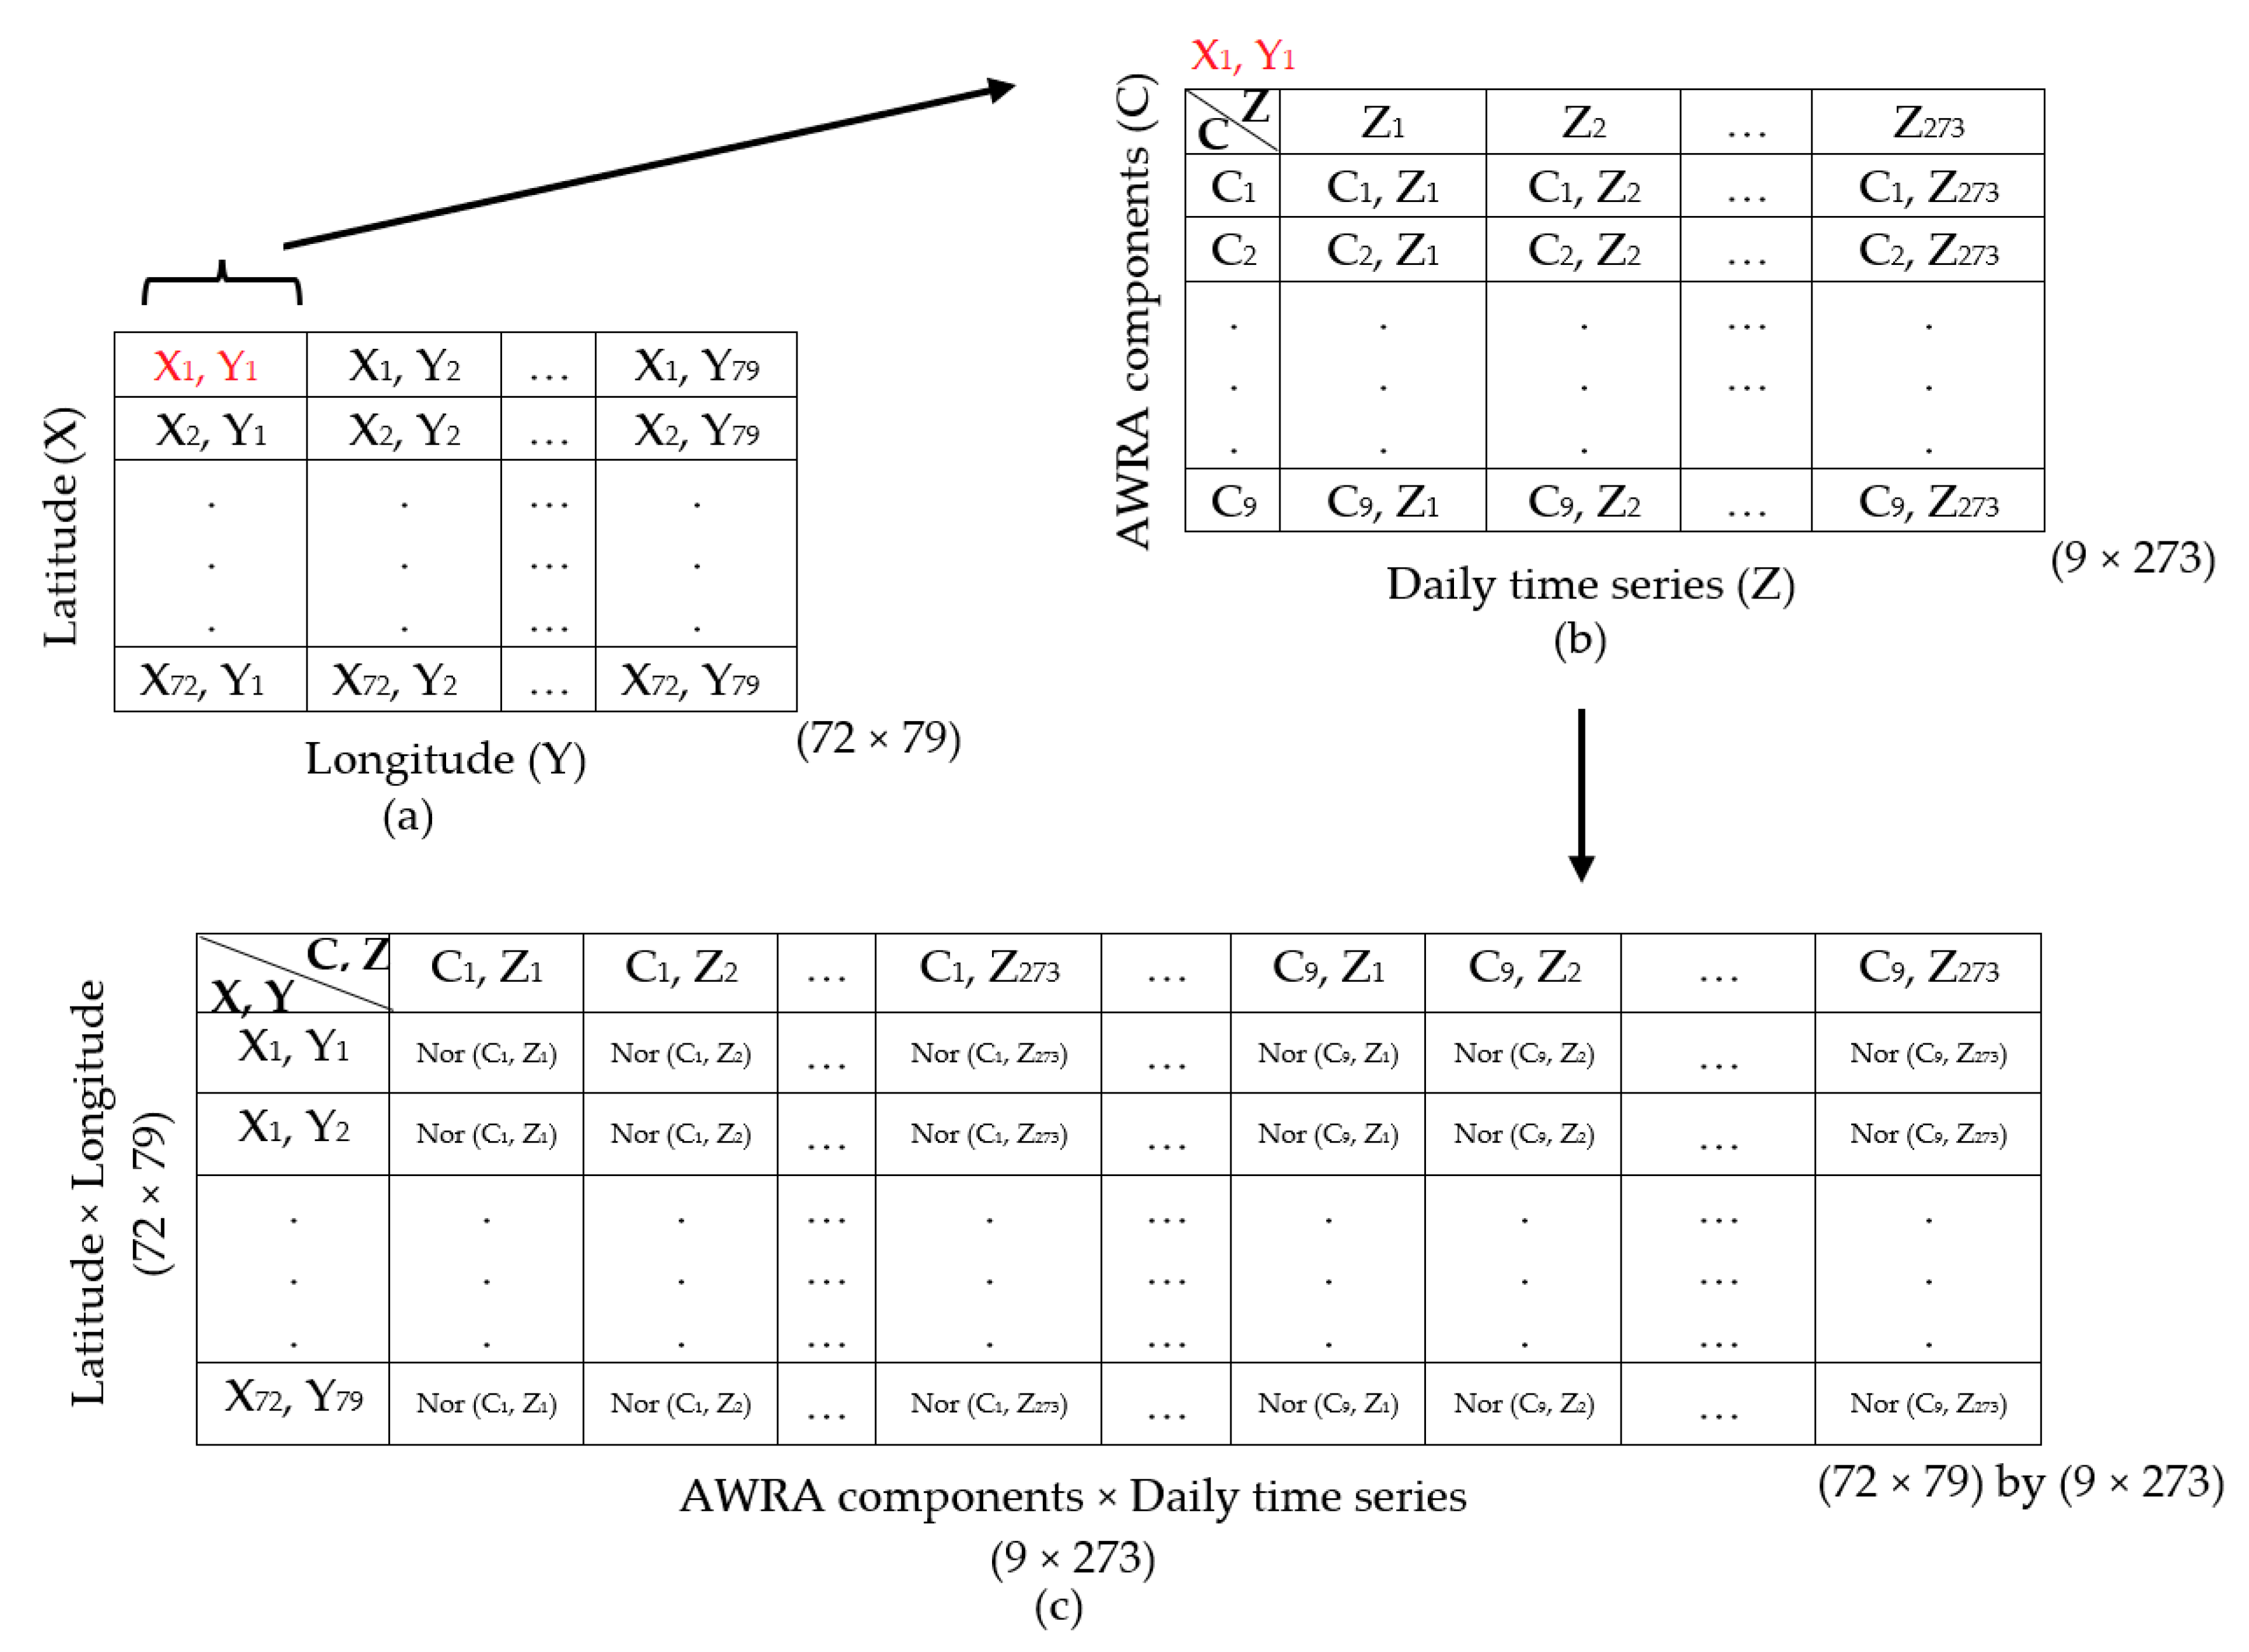
2.1. Dataset and Study Area
2.2. Methods
2.2.1. Dimensionality Reduction Techniques (DRTs)
2.2.2. Quality Metric
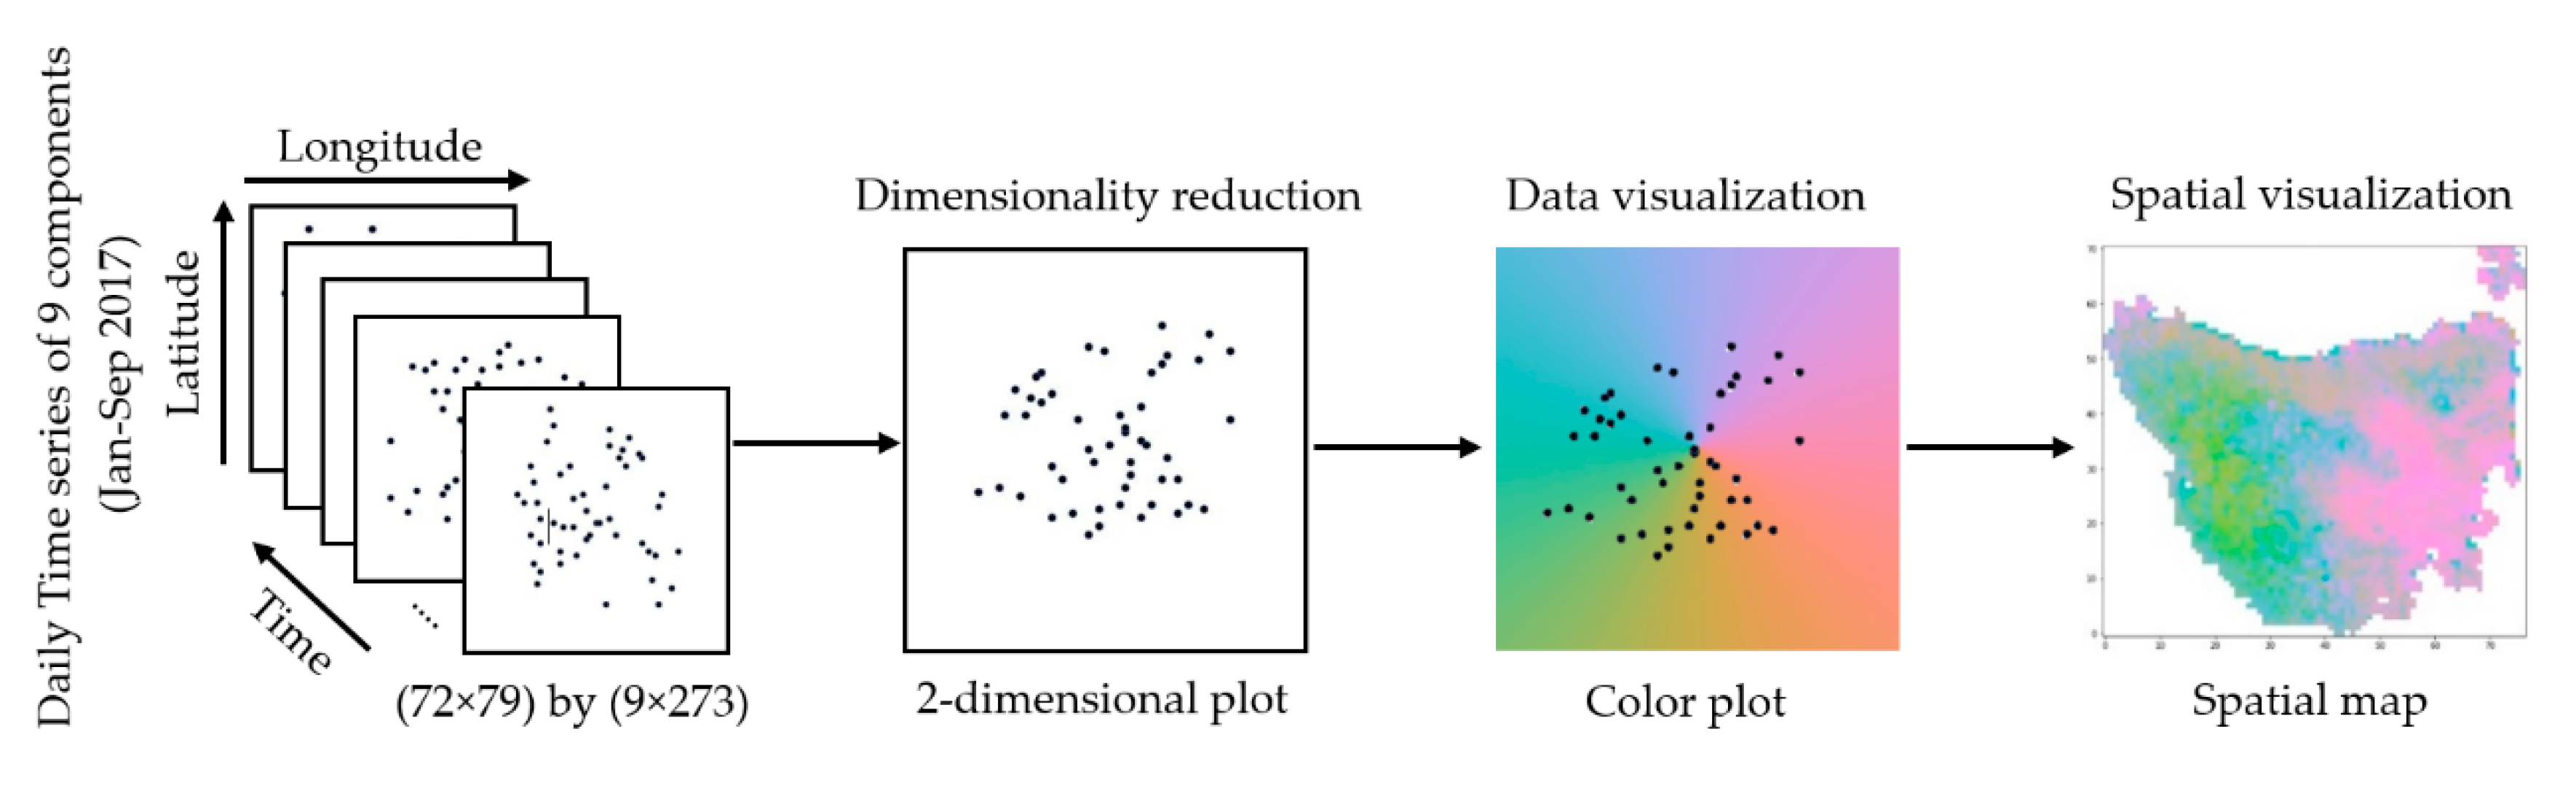
2.2.3. Visualization
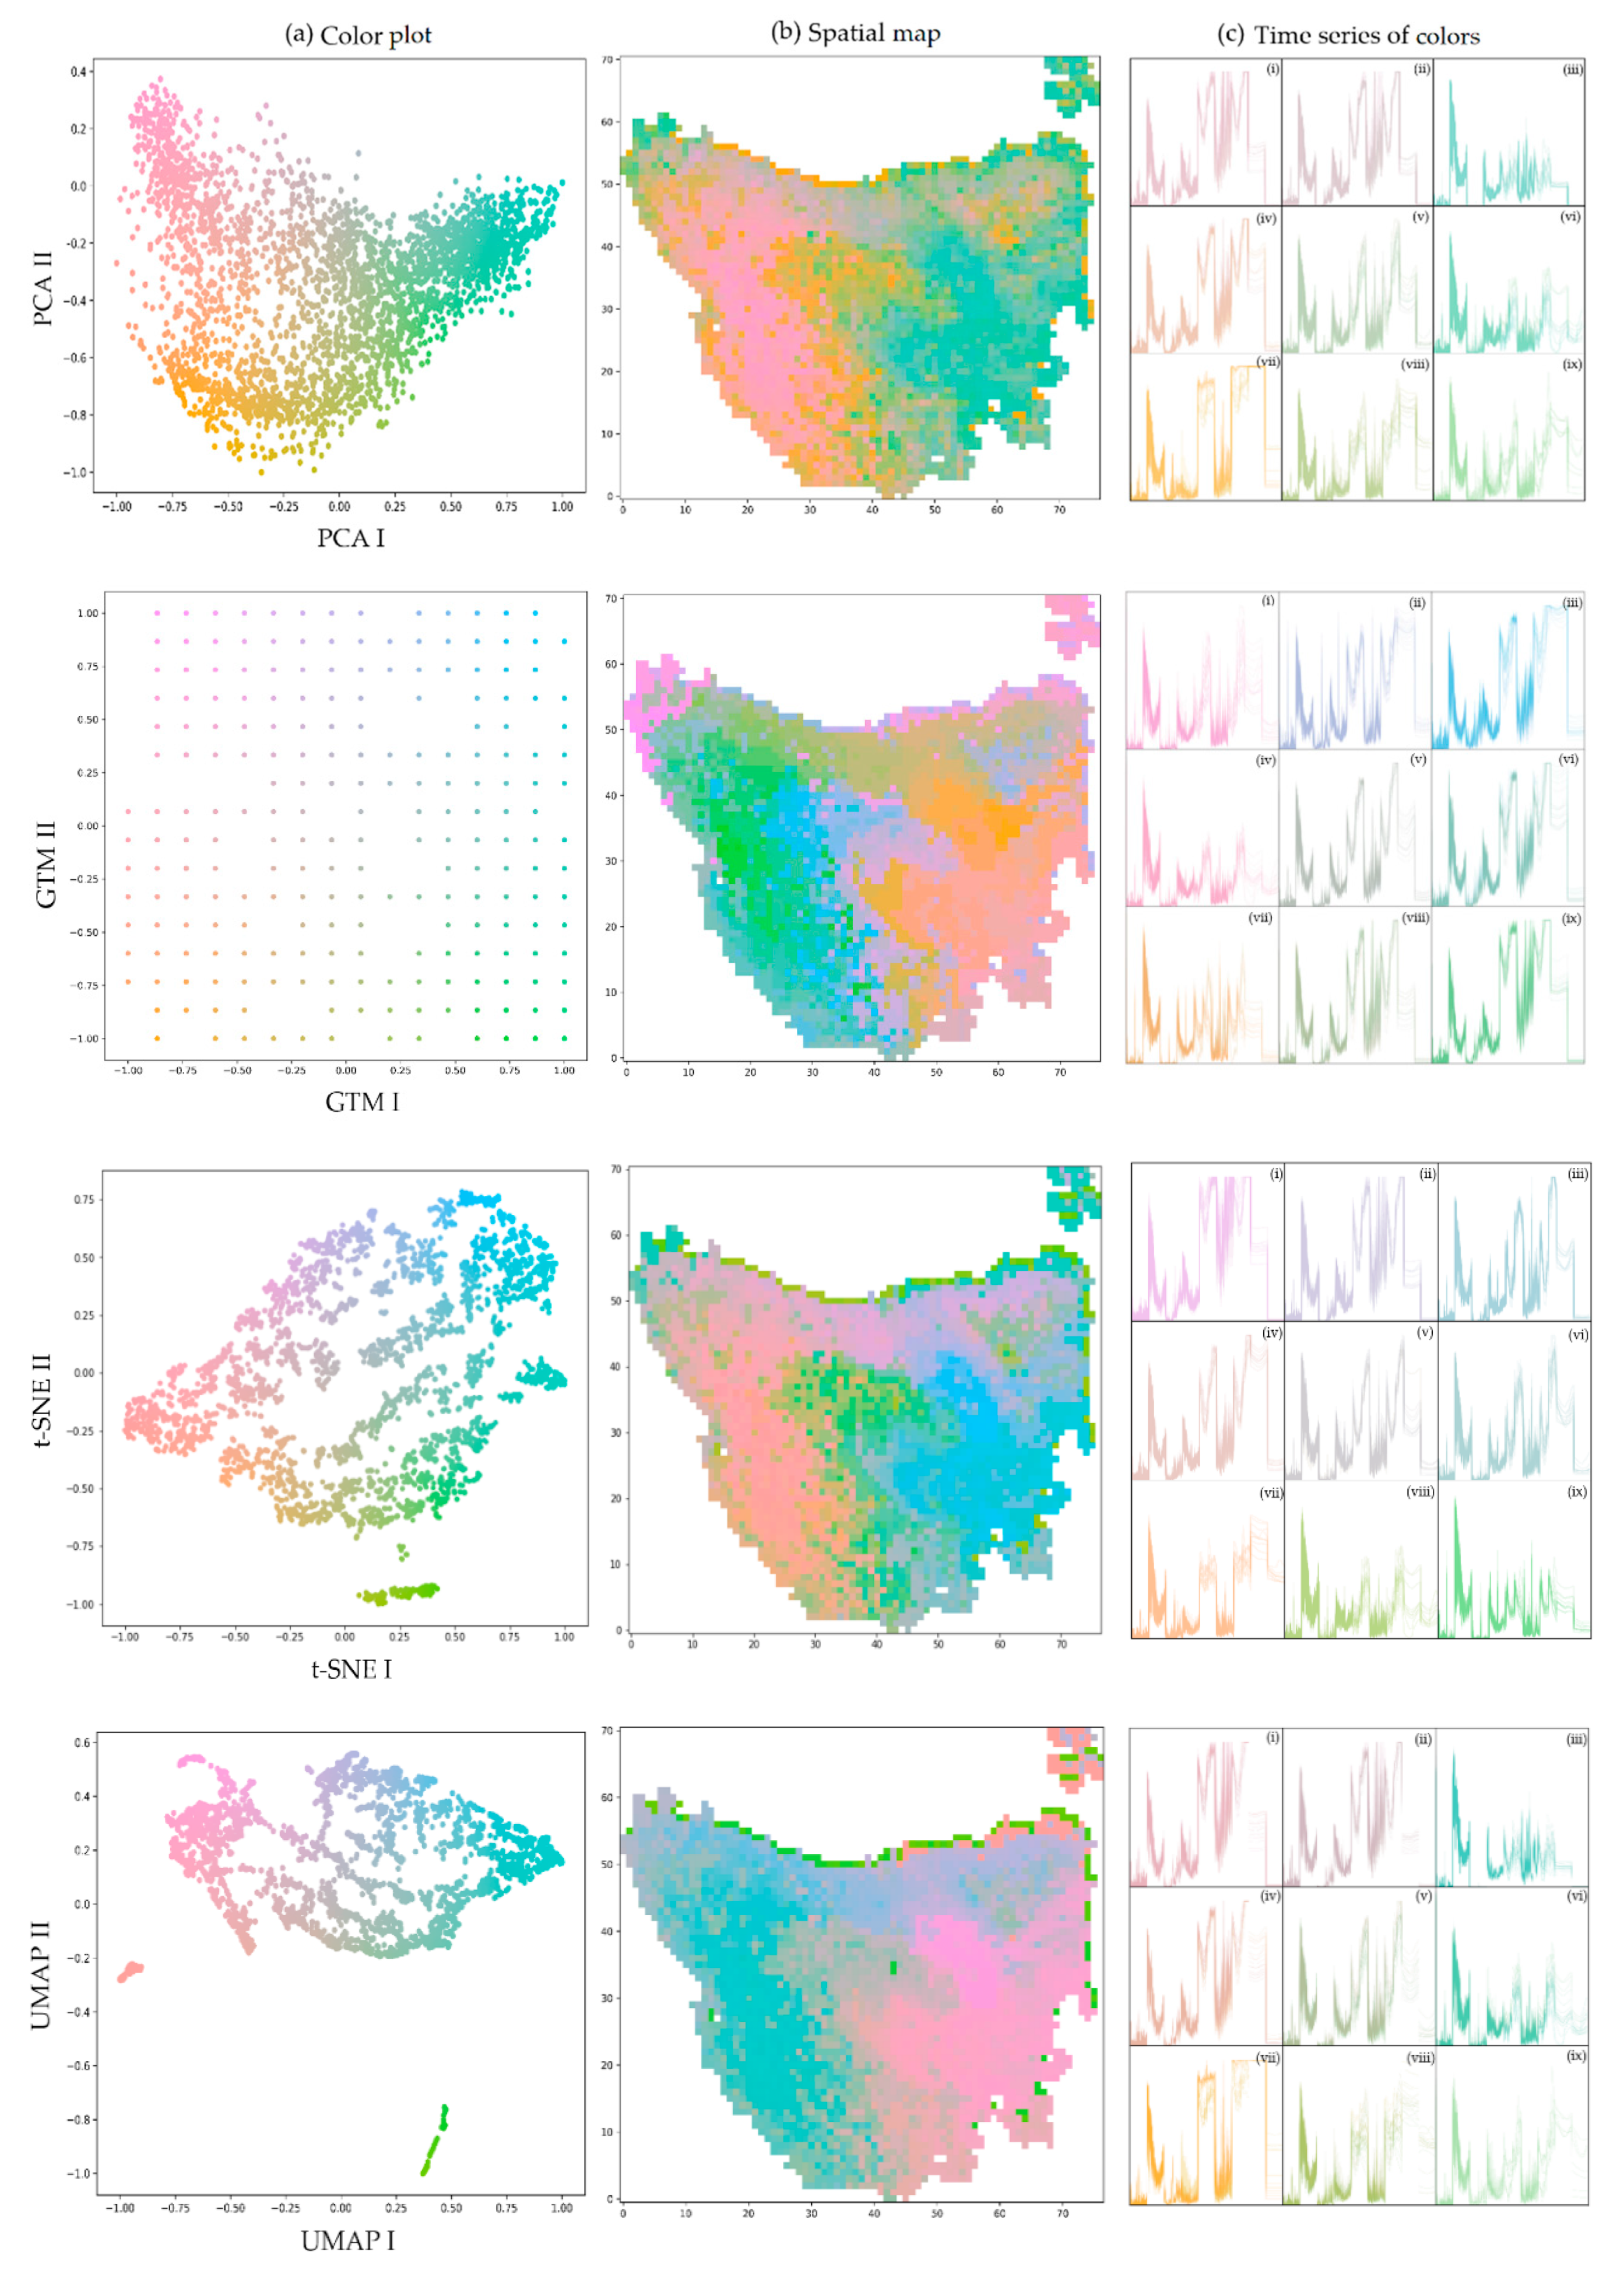
3. Results
4. Discussion
5. Conclusions
Funding
Acknowledgments
Conflicts of Interest
References
- Keim, D.; Kohlhammer, J.; Ellis, G.; Mansmann, F. Visual Analytics. In Mastering the Information Age: Solving Problems with Visual Analytics; Eurographics Association: Munich, Germany, 2010; pp. 7–18. [Google Scholar]
- Sucharitha, V.; Subash, S.R.; Prakash, P. Visualization of Big Data: Its Tools and Challenges. Int. J. Appl. Eng. Res. 2014, 9, 5277–5290. [Google Scholar]
- Kerren, A.; Stasko, J.T.; Fekete, J.D.; North, C. Information Visualization—Human-Centered Issues and Perspectives; Springer: Berlin/Heidelberg, Germany, 2008. [Google Scholar]
- Güler, C.; Thyne, G.D.; McCray, J.E. Evaluation of graphical and multivariate statistical methods for classification of water chemistry data. Hydrogeol. J. 2002, 10, 455–474. [Google Scholar] [CrossRef]
- Ward, M.; Grinstein, G.; Keim, D.A. Interactive Data Visualization: Foundations, Techniques, and Application; A K Peters, Ltd.: Boca Raton, FL, USA, 2010. [Google Scholar]
- Van der Maaten, L.J.P.; Postma, E.O.; van den Herik, H.J. Dimensionality Reduction: A Comparative Review; Tilburg University: Tilburg, The Netherland, 2009. [Google Scholar]
- Kennard, M.J.; Pusey, B.J.; Olden, J.D.; MacKay, S.J.; Stein, J.L.; Marsh, N. Classification of natural flow regimes in Australia to support environmental flow management. Freshw. Biol. 2010, 55, 171–193. [Google Scholar] [CrossRef]
- Herbst, M.; Gupta, H.V.; Casper, M.C. Mapping model behaviour using {S}elf-{O}rganizing {M}aps. Hydrol. Earth Syst. Sci. 2009, 13, 395–409. [Google Scholar] [CrossRef]
- Wang, N.; Biggs, T.W.; Skupin, A. Com puters, Environ ment and Urban System s Visualizing gridded time series data with self-organizing maps: An application to multi-year snow dynamics in the Northern Hemisphere. Comput. Environ. Urban Syst. 2013, 39, 107–120. [Google Scholar] [CrossRef]
- Biswas, A.; Lin, G.; Liu, X.; Shen, H.W. Visualization of Time-Varying Weather Ensembles across Multiple Resolutions. IEEE Trans. Vis. Comput. Graph. 2017, 23, 841–850. [Google Scholar] [CrossRef] [PubMed]
- Gisbrecht, A.; Hammer, B. Data visualization by nonlinear dimensionality reduction. Wires Data Min. Knowl. Discov. 2015, 5, 51–73. [Google Scholar] [CrossRef]
- Van der Maaten, L.; Hinton, G. Visualizing data using t-SNE. J. Mach. Learn. Res. 2008, 9, 2579–2605. [Google Scholar]
- Lee, J.A.; Verleysen, M. Nonlinear Dimensionality Reduction; Springer: New York, NY, USA, 2007. [Google Scholar]
- Bunte, K.; Biehl, M.; Hammer, B. A general framework for dimensionality-reducing data visualization mapping. Neural Comput. 2012, 24, 771–804. [Google Scholar] [CrossRef]
- Saul, L.K.; Roweis, S.T. Think globally, fit locally: Unsupervised learning of low dimensional manifolds. J. Mach. Learn. Res. 2003, 4, 119–155. [Google Scholar]
- Jolliffe, I.T. Principal Component Analysis, 2nd ed.; Springer: New York, NY, USA, 2002. [Google Scholar]
- Nam, K.; Je, H.; Choi, S. Fast Stochastic Neighbor Embedding: A trust-region algorithm. In Proceedings of the IEEE International Joint Conference on Neural Networks, Budapest, Hungary, 25–29 July 2004. [Google Scholar]
- Kohonen, T. Self-Organizing Maps; Springer: Heidelberg, Germany, 2001. [Google Scholar]
- Bishop, C.M.; Svensen, M. GTM: The Generative Topographic mapping. Neural Comput. 1998, 10, 215–234. [Google Scholar] [CrossRef]
- Cox, T.F.; Cox, M.A.A. Multidimensional Scaling; Chapman & Hall: London, UK, 1994. [Google Scholar]
- Hinton, G.E.; Salakhutdinov, R.R. Reducing the dimensionality of data with neural networks. Science 2006, 313, 504–507. [Google Scholar] [CrossRef] [PubMed]
- James, R.W. Multivariate Statistical Methods in Hydrology-A comparison using data of known functional relationship. Water Resour. Res. 1965, 1, 447–461. [Google Scholar]
- Kaski, S. Dimensionality reduction by random mapping: Fast similarity computation for clustering. In Proceedings of the International Joint Conference on Neural Networks (IJCNN’98), Anchorage, AK, USA, 4–9 May 1998. [Google Scholar]
- Bingham, E.; Mannila, H. Random projection in dimensionality reduction: Applications to image and text data. In Proceedings of the Seventh ACM SIGKDD International Conference on Knowledge Discovery and Data Mining (KDD 2001), San Francisco, CA, USA, 26–29 August 2001. [Google Scholar]
- Atlas, L.; Isik, M.; Kavurmaci, M. Determination of arsenic levels in the water resources of Aksaray Province, Turkey. J. Environ. Manag. 2011, 92, 2182–2192. [Google Scholar]
- Mahlknecht, J.; Steinich, B.; Navarro de León, I. Groundwater chemistry and mass transfers in the independence aquifer, central Mexico, by using multivariate statistics and mass-balance models. Environ. Geol. 2004, 45, 781–795. [Google Scholar] [CrossRef]
- Azhar, S.C.; Aris, A.Z.; Yusoff, M.K.; Ramli, M.F.; Juahir, H. Classification of River Water Quality Using Multivariate Analysis. Procedia Environ. Sci. 2015, 30, 79–84. [Google Scholar] [CrossRef]
- Schölkopf, B.; Smola, A.J.; Müller, K.R. Kernel principal component analysis. In Advances in Kernel Methods; Support Vector Learning: Lausanne, Switzerland, 1999. [Google Scholar]
- Brand, M. Charting a manifold. In Advances in Neural Information Processing Systems 15; MIT Press: Cambridge, MA, USA, 2003. [Google Scholar]
- Yin, H. On multidimensional scaling and the embedding of self-organising maps. Neural Netw. 2008, 21, 160–169. [Google Scholar] [CrossRef]
- Kaban, A. A scalable generative topographic mapping for sparse data sequences. In Proceedings of the International Conference on Information Technology: Coding and Computing (ITCC’05), Las Vegas, NV, USA, 4–6 April 2005. [Google Scholar]
- Zhong, F.; Zheng, X.; Tan, Z.; Shi, T. Application of generative topographic mapping to the classification of bearing fault. In Proceedings of the IEEE International Conference on Control and Automation, Guangzhou, China, 30 May–1 June 2007. [Google Scholar]
- Gaspar, H.A.; Marcou, G.; Horvath, D.; Arault, A.; Lozano, S.; Vayer, P.; Varnek, A. Generative topographic mapping-based classification models and their applicability do-main: Application to the biopharmaceutics drug disposition classification system (BD-DCS). J. Chem. Inf. Model. 2013, 53, 3318–3325. [Google Scholar] [CrossRef]
- Demartines, P.; Hérault, J. Curvilinear component analysis: A self-organizing neural network for nonlinear mapping of data sets. IEEE Trans. Neural. Netw. 1997, 8, 148–154. [Google Scholar] [CrossRef]
- Lee, J.A.; Lendasse, A.; Verleysen, M. Nonlinear projection with curvilinear distances: Isomap versus curvilinear distance analysis. Neurocomputing 2004, 57, 49–76. [Google Scholar] [CrossRef]
- Lee, J.A.; Verleysen, M. Nonlinear projection with the isotop method. Proceedings of International Conference on Artificial Neural Networks (ICANN’2002), Madrid, Spain, 28–30 August 2002. [Google Scholar]
- Hinton, G.; Roweis, S. Stochastic neighbor embedding. In Processing of Advances in Neural Information Systems (NIPS); MIT Press: Vancouver, CO, Canada, 2002. [Google Scholar]
- Gashi, I.; Stankovic, V.; Leita, C.; Thonnard, O. An experimental study of diversity with off the-shelf antivirus engines. In Proceedings of the Eighth IEEE International Symposium on Networking Computing and Applications (NCA 2009), Cambridge, MA, USA, 9–11 July 2009. [Google Scholar]
- Abdelmoula, W.M.; Balluff, B.; Englert, S.; Dijkstra, J.; Reinders, M.J.T.; Walch, A.; McDonnell, L.A.; Lelieveldt, B.P.F. Data-driven identification of prognostic tumor subpopulations using spatially mapped t-sne of mass spectrometry imaging data. Proc. Natl. Acad. Sci. USA 2016, 113, 12244–12249. [Google Scholar] [CrossRef] [PubMed]
- Hamel, P.; Eck, D. Learning features from music audio with deep belief networks. In Proceedings of the 11th International Society for Music Information Retrieval Conference (ISMIR), Utrecht, The Netherlands, 9–13 August 2010. [Google Scholar]
- Wallach, I.; Lilien, R. The protein-small-molecule database (psmdb), a non-redundant structural resource for the analysis of protein-ligand binding. Bioinformatics 2009, 25, 615–620. [Google Scholar] [CrossRef] [PubMed]
- Bengio, Y. Learning Deep Architectures for AI; Universite de Montreal: Montreal, QC, Canada, 2007. [Google Scholar]
- Cornell University. Statistics, Machine Learning. Available online: https://arxiv.org/abs/1802.03426 (accessed on 10 March 2018).
- Cold Spring Harbor Laboratory. The Preprint Service for Biology. Available online: https://www.biorxiv.org/content/10.1101/298430v1 (accessed on 15 May 2018).
- Fuhrimann, L.; Moosavi, V.; Ohlbrock, P.O.; Dacunto, P. Data-driven design: Exploring new structural forms using machine learning and graphic statics. In Proceedings of the IASS Annual Symposium (IASS 2018), Boston, USA, 16–20 July 2018. [Google Scholar]
- Cornell University. Computer Science, Machine Learning. Available online: https://arxiv.org/abs/1810.03052 (accessed on 10 October 2018).
- Gracia, A.; Gonzalez, S.; Robles, V.; Menasalvas, E. A methodology to compare dimensionality reduction algorithms in terms of loss of quality. Inf. Sci. 2014, 270, 1–27. [Google Scholar] [CrossRef]
- Lee, J.A.; Verleysen, M. Quality assessment of nonlinear dimensionality reduction based on K-ary neighborhoods. In Proceedings of the workshop and conference on New Challenges for Feature Selection in Data Mining and Knowledge Discovery, Antwerp, Belgium, 15 September 2008. [Google Scholar]
- Mokbel, B.; Lueks, W.; Gisbrecht, A.; Hammer, B. Visualizing the quality of dimensionality reduction. Neurocomputing 2013, 112, 109–123. [Google Scholar] [CrossRef]
- Gorban, A.; Zinovyev, A. Principal manifolds and graphs in practice: From molecular biology to dynamical systems. Int. J. Neural. Syst. 2010, 20, 219–232. [Google Scholar] [CrossRef]
- Lee, J.; Verleysen, M. Scale-independent quality criteria for dimensionality reduction. Pattern Recogn. Lett. 2010, 31, 2248–2257. [Google Scholar] [CrossRef]
- Venna, J.; Peltonen, J.; Nybo, K.; Aidos, H.; Kaski, S. Information retrieval perspective to nonlinear dimensionality reduction for data visualization. J. Mach. Learn. Res. 2010, 11, 451–490. [Google Scholar]
- Lee, J.; Verleysen, J. Quality assessment of dimensionality reduction: Rank-based criteria. Neurocomputing 2009, 72, 1431–1443. [Google Scholar] [CrossRef]
- Kennett, B.; Chopping, R.; Blewett, R. The Australian Continent: A Geophysical Synthesis; ANU Press and Geoscience Australia: Acton, Australia, 2018. [Google Scholar]
- Minty, B.; Franklin, R.; Milligan, P.; Richardson, M.; Wilford, J. The Radiometric Map of Australia. Explor. Geophys. 2009, 40, 325. [Google Scholar] [CrossRef]
- Gao, B. NDWI-A normalized difference water index for remote sensing of vegetation liquid water from space. Remote Sens. Environ. 1996, 58, 257–266. [Google Scholar] [CrossRef]
- Peeters, L. A Background Colour Scheme for Piper Plots to Spatially Visualize Hydro-chemical Patterns. Groundwater 2013, 52, 2–6. [Google Scholar] [CrossRef] [PubMed]
- Peeters, L.; Bação, F.; Lobo, V.; Dassargues, A. Exploratory data analysis and clustering of multivariate spatial hydrogeological data by means of GEO3DSOM, a variant of Kohonen’s Self-Organizing Map. Hydrol Earth Syst. Sci. 2007, 11, 1309–1321. [Google Scholar] [CrossRef]
- Bujack, R.; Turton, T.L.; Samsel, F.; Ware, C.; Rogers, D.H.; Ahrens, J. The Good, the Bad, and the Ugly: A Theoretical Framework for the Assessment of Continuous Colourmaps. IEEE Trans. Vis. Comput. Graph. 2018, 24, 923–933. [Google Scholar] [CrossRef] [PubMed]
- Cornell University. Computer Science, Graphics. Available online: https://arxiv.org/abs/1509.03700 (accessed on 18 June 2018).
- Light, A.; Bartlein, P.J. The end of the rainbow? Colour schemes for improved data graphics. Eos Trans. AGU 2004, 85, 385–391. [Google Scholar] [CrossRef]
- Vaze, J.; Viney, N.; Stenson, M.; Renzullo, L.; Van Dijk, A.; Dutta, D.; Crosbie, R.; Lerat, J.; Penton, D.; Vleeshouwer, J.; et al. The Australian Water Resource Assessment System (AWRA). In Proceedings of the 20th International Congress on Modelling and Simulation (MODSIM2013), Adelaide, Australia, 1–6 December 2013. [Google Scholar]
- Peeters, L.J.M.; Crosbie, R.S.; Doble, R.C.; Van Dijk, A.I.J.M. Conceptual evaluation of continental land-surface model behaviour. Environ. Modell. Softw. 2013, 43, 49–59. [Google Scholar] [CrossRef]
- Gladish, D.W.; Pagendam, D.E.; Peeters, L.J.M.; Kuhnert, P.M.; Vaze, J. Emulation Engines: Choice and Quantification of Uncertainty for Complex Hydrological Models. J. Agric. Biol. Envirostats. 2017, 23, 9–62. [Google Scholar] [CrossRef]
- Kireeva, N.; Baskin, I.I.; Gaspar, H.A.; Horvath, D.; Marcou, G.; Varnek, A. Generative Topographic Mapping (GTM): Universal Tool for Data Visualization, Structure-Activity Modelling and Dataset Comparison. Mol. Inf. 2012, 31, 301–312. [Google Scholar] [CrossRef]
- Gaspar, H.A. ugtm: A Python Package for Data Modeling and Visualization Using Generative Topographic Mapping. J. Open Res. Softw. 2018, 6, 26. [Google Scholar] [CrossRef]
- Basic UMAP Parameters. Available online: https://umap-learn.readthedocs.io/en/latest/parameters.html (accessed on 20 October 2018).


| Parametric | Non-Parametric | |
|---|---|---|
| Linear | PCA (P) | - |
| Non-linear | GTM (P) | t-SNE (P4), UMAP(P) |
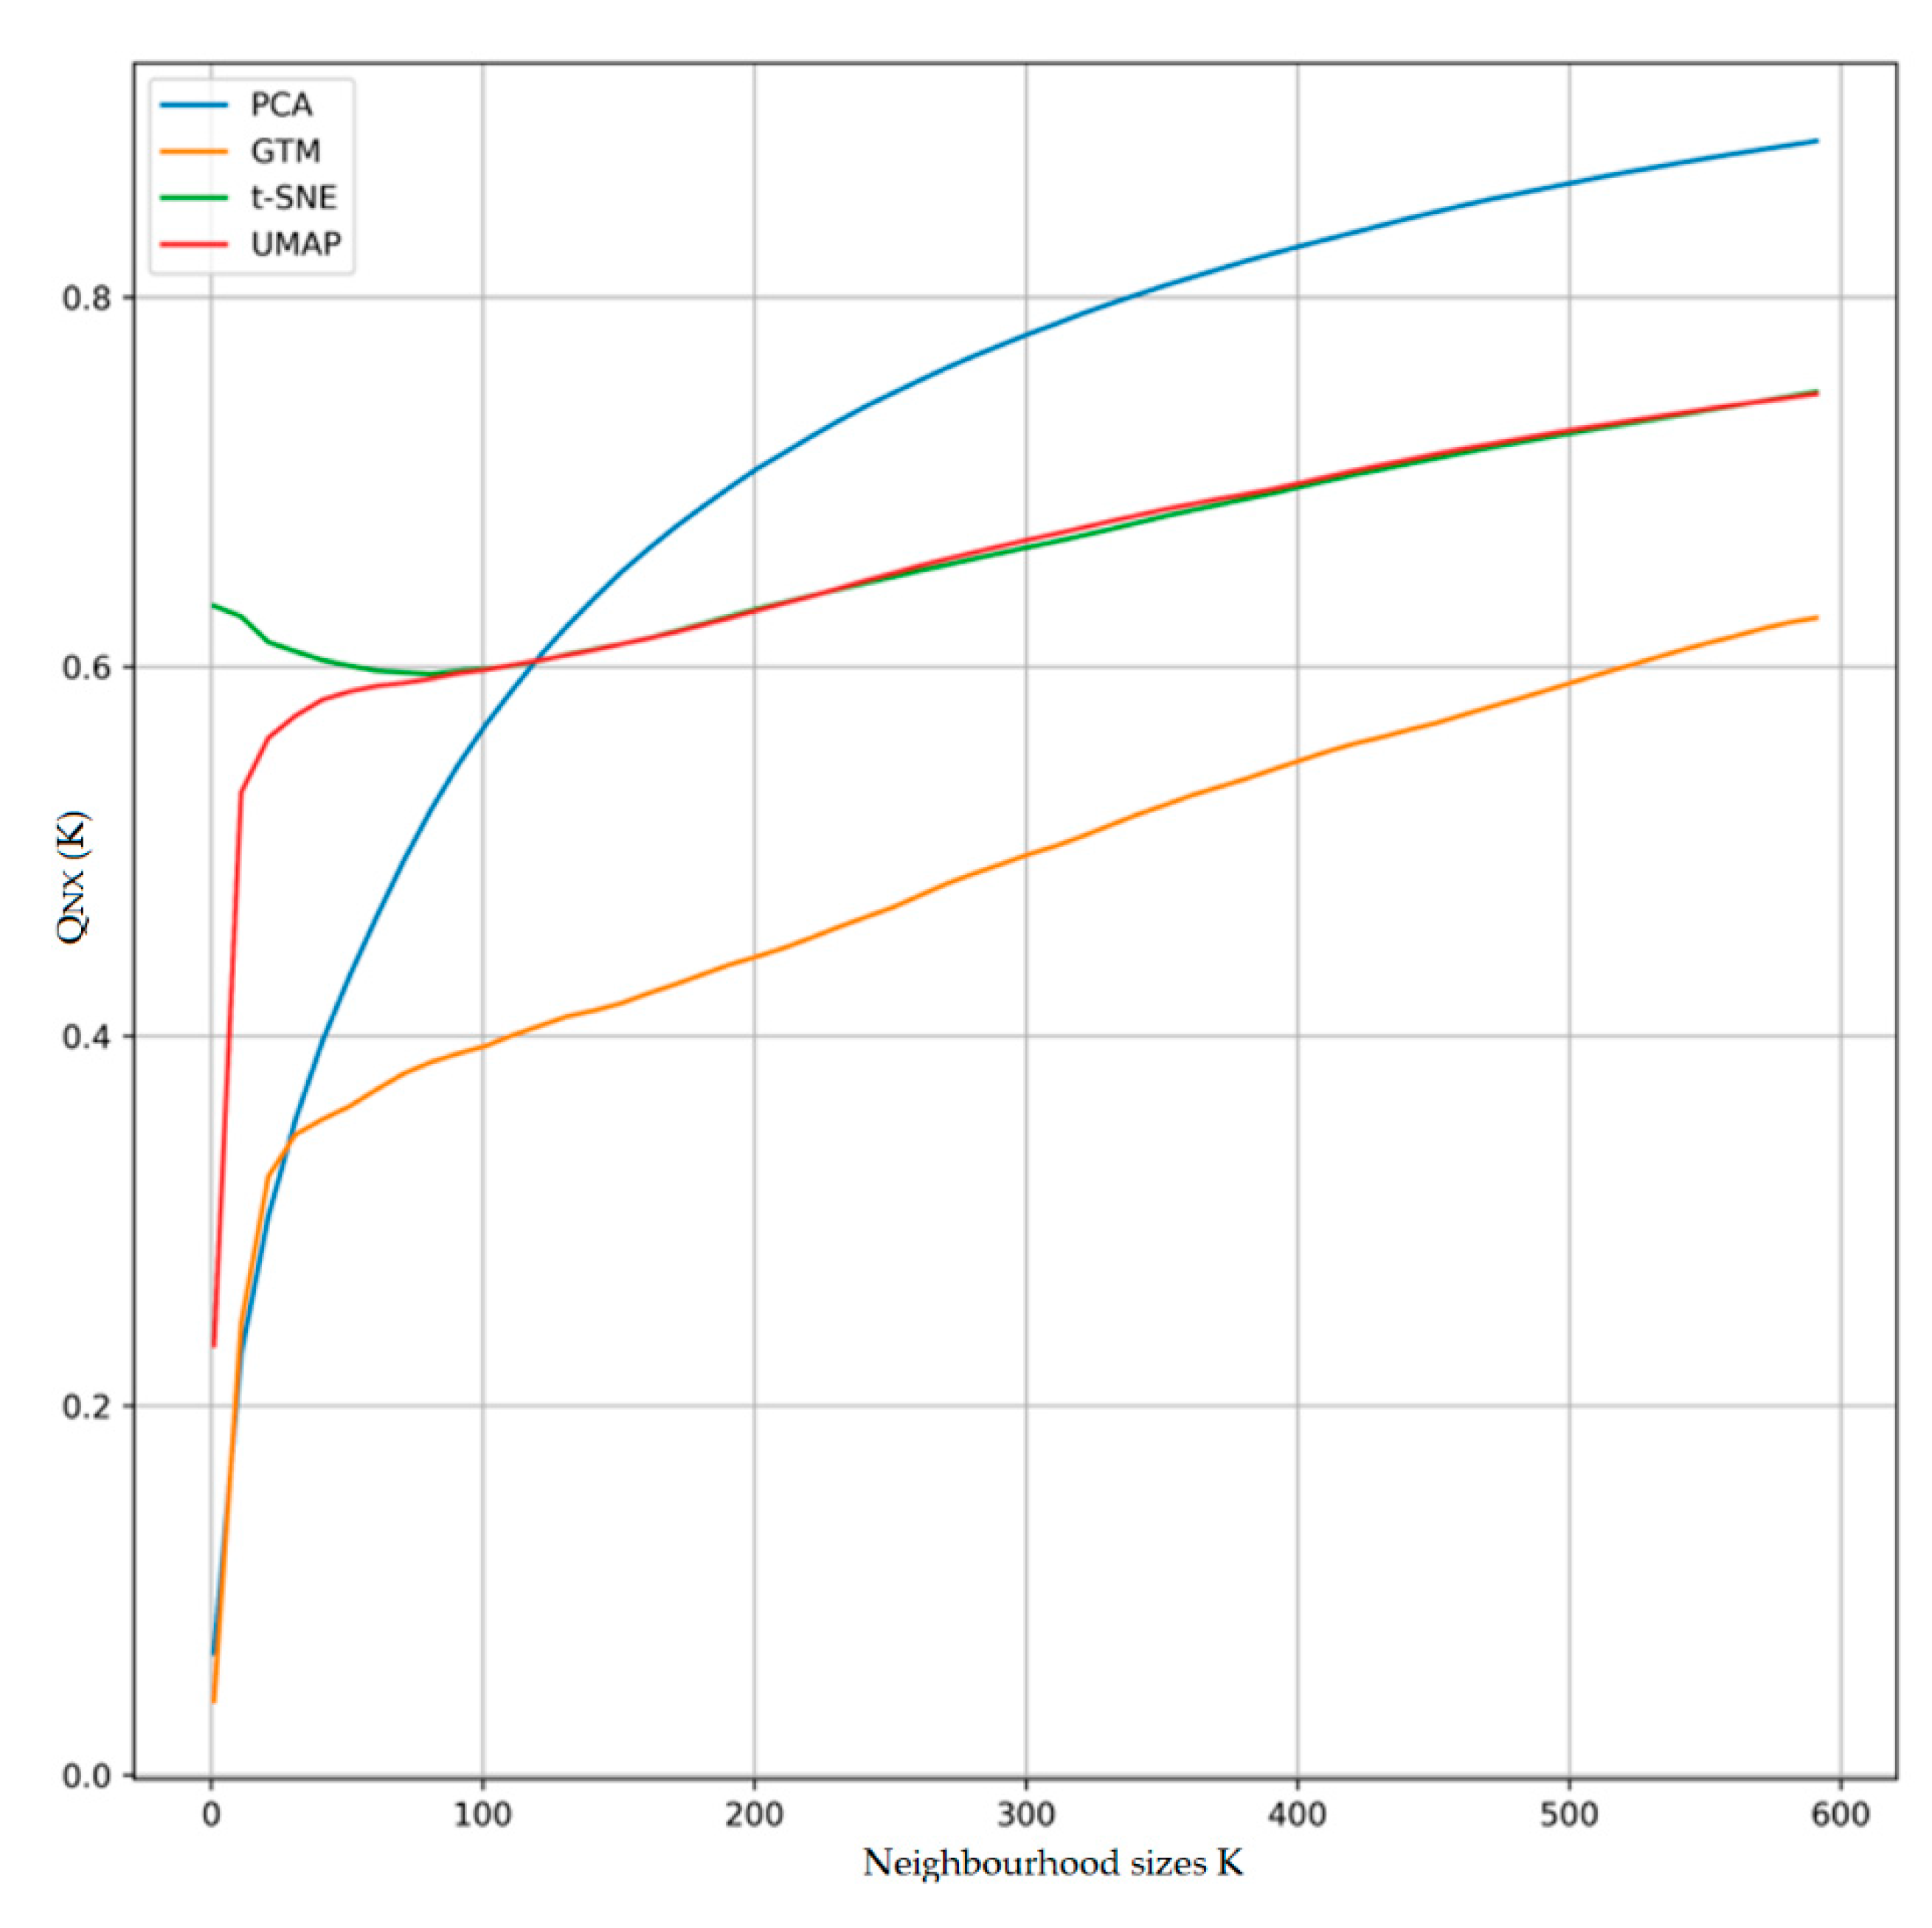
| QNX(K)/K | 0 | 60 | 120 | 180 | 240 | 300 | 360 | 420 | 480 | 540 |
|---|---|---|---|---|---|---|---|---|---|---|
| PCA | 0.06 | 0.50 | 0.60 | 0.70 | 0.75 | 0.79 | 0.81 | 0.83 | 0.85 | 0.86 |
| GTM | 0.04 | 0.38 | 0.42 | 0.44 | 0.47 | 0.50 | 0.52 | 0.57 | 0.59 | 0.61 |
| t-SNE | 0.63 | 0.60 | 0.60 | 0.62 | 0.65 | 0.67 | 0.68 | 0.70 | 0.72 | 0.73 |
| UMAP | 0.22 | 0.59 | 0.60 | 0.62 | 0.652 | 0.673 | 0.682 | 0.702 | 0.722 | 0.732 |
© 2020 by the author. Licensee MDPI, Basel, Switzerland. This article is an open access article distributed under the terms and conditions of the Creative Commons Attribution (CC BY) license (http://creativecommons.org/licenses/by/4.0/).
Share and Cite
Mazher, A. Visualization Framework for High-Dimensional Spatio-Temporal Hydrological Gridded Datasets using Machine-Learning Techniques. Water 2020, 12, 590. https://doi.org/10.3390/w12020590
Mazher A. Visualization Framework for High-Dimensional Spatio-Temporal Hydrological Gridded Datasets using Machine-Learning Techniques. Water. 2020; 12(2):590. https://doi.org/10.3390/w12020590
Chicago/Turabian StyleMazher, Abeer. 2020. "Visualization Framework for High-Dimensional Spatio-Temporal Hydrological Gridded Datasets using Machine-Learning Techniques" Water 12, no. 2: 590. https://doi.org/10.3390/w12020590
APA StyleMazher, A. (2020). Visualization Framework for High-Dimensional Spatio-Temporal Hydrological Gridded Datasets using Machine-Learning Techniques. Water, 12(2), 590. https://doi.org/10.3390/w12020590