1. Introduction
Multiple factors contribute to water scarcity, including its heterogeneous distribution, population growth and increased water consumption in the agricultural, industrial and energy production sectors [
1,
2,
3]. One of the solutions that can be used in buildings in order to save potable water is the rainwater harvesting system.
In general, Brazil has a high potential for saving potable water [
4,
5,
6,
7] through the use of rainwater, since the annual rainfall average ranges from 1146 mm to 2182 mm [
5], depending on the region of the country. In residential buildings located in Santa Catarina, it is estimated that the potential for saving potable water varies between 23% and 100% [
8]. According to Lopes et al. [
9], it is possible to save between 75 and 471 L/household/day when using rainwater in houses in Santa Catarina. Therefore, it is important that the management of water consists of reusing, recycling and recovering the resource [
3].
In Florianópolis, for example, there is a law [
10] that requires the use of alternative sources of water supply in buildings. The city has a high potential for potable water savings (73%) by using rainwater, primarily in February [
8]. Results from research conducted in a multi-storey residential building in the city show that the largest potential for saving potable water corresponds to 17% [
11]. These variations in the potential for potable water savings through the use of rainwater occur due to different demands for potable water and different rainwater catchment areas. Research conducted in public buildings in Florianópolis showed that between 56% and 86% of the potable water consumption could be replaced with rainwater [
12,
13].
Regarding the water end-uses in residential buildings in different countries, it is noticeable that, in general, showers contribute to the highest water consumption [
14,
15,
16,
17,
18,
19]. Beyond that, the percentage of water consumed for toilet flushes is significant. In Rathnayaka et al. [
17] and Matos et al. [
20] research, for example, the toilet flush occupies the third place among the end-uses with a higher percentage of consumption of potable water in the residential sector. In a study conducted by Jordán-Cuebas et al. [
19] the toilet flush was the second largest end-use in two multi-storey residential buildings. In schools and office buildings, toilet flushes contribute with a percentage of water consumption even larger when compared to the percentage obtained in residential buildings [
13,
21].
Even though Florianópolis has a high potential for potable water savings, before implementing a rainwater harvesting system in a building it is necessary to measure the feasibility of implementing this type of solution using financial indicators, i.e., to perform an economic feasibility analysis. In Athayde Júnior et al. [
22] research, for example, it is noted that the implementation of this type of system is only feasible in high-standard buildings, where the tariffs and consumption of water are higher than the tariffs and consumption of water in medium and low-standard buildings. According to Dòmenech and Saurí [
23], for both single-family and multi-storey residential buildings, there is only economic feasibility on the implementation of rainwater harvesting systems when the water consumption is high. According to Matos et al. [
24], there is economic feasibility on the implementation of rainwater harvesting systems in commercial buildings. In wetter years or in intermediate humidity conditions in India, rainwater harvesting systems were economically feasible as payback period ranged from 2 to 10 years [
25]. In China, Jing et al. [
26] corroborate this information by stating that there is economic feasibility of the system only in humid and semi-humid regions of the country. Severis et al. [
27] and Abas and Mahlia [
28] state that rainwater harvesting systems that demand larger volumes of water tend to be more economically feasible. According to Amos et al. [
29] the economic feasibility of the implementation of a rainwater harvesting system is affected by the regional cost of potable water, which is also supported by Abdulla [
30].
User acceptance and satisfaction with domestic rainwater harvesting systems should also be taken into consideration before adopting this solution in buildings. In Bangladesh, Islam et al. [
31] interviewed low-income residents and found that there is generally good acceptance for the use of rainwater as an alternative source for community water supply. Domènech and Saurí [
23] conducted a survey in Spain to verify satisfaction of residents with rainwater harvesting systems in their homes. The research was conducted in high-standard single-family buildings and in a high-standard multi-storey residential building. According to the authors, the residents were satisfied with this type of system. However, there is still a gap to be filled in the scientific literature on this subject. Few studies have investigated user acceptance or satisfaction with this type of solution.
The use of rainwater harvesting systems in buildings is an alternative in order to enable the rational use of potable water. In addition of that, rainwater harvesting systems do not always provide water with adequate visual characteristics [
32], which can be a barrier for acceptance of this type of solution. Thus, the purpose of this article is to perform economic analysis resizing a rainwater tank taking into account the end-uses of a high-standard multi-storey residential building in Florianópolis, southern Brazil. Furthermore, a user satisfaction assessment was conducted related to the rainwater harvesting system installed in the building.
2. Method
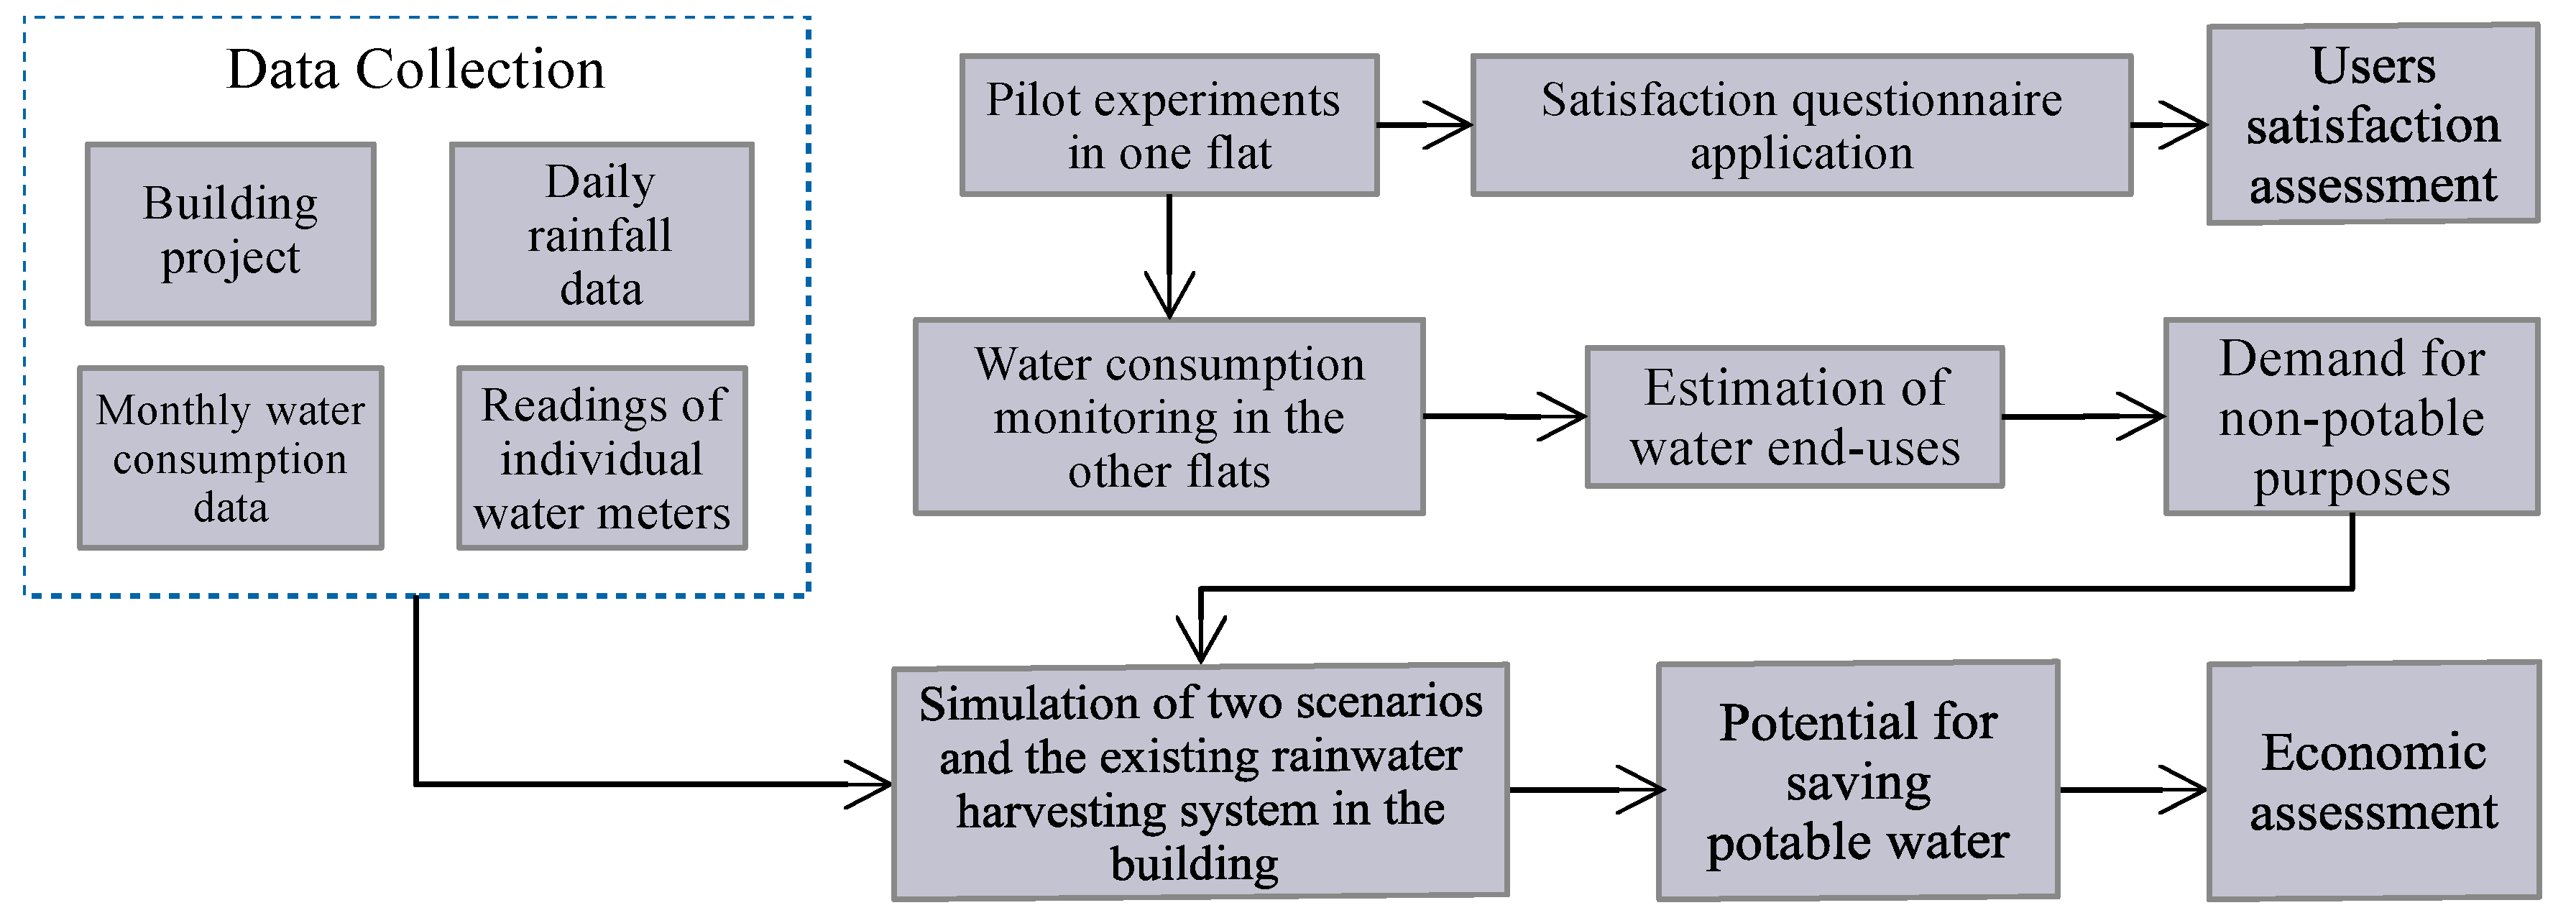
In order to assess economic and user satisfaction aspects related to the rainwater harvesting system in a multi-storey residential building, some procedures were conducted. Water consumption data were collected from the flats; water consumption monitoring questionnaires were applied to the residents; the water end-uses were estimated and two scenarios considering different water consumption for non potable purposes were simulated to verify the ideal capacity of rainwater tank. Finally, the costs of equipment used in the current rainwater harvesting system were surveyed. Labour and electricity costs were also included in the feasibility analysis. The satisfaction survey was conducted by applying questionnaires to the residents.
Figure 1 shows the steps performed during the research period.
2.1. Characteristics of the Study Area
Florianópolis is located between the parallels 27°10′ and 27°50′ of south latitude and between the meridians 48°25′ and 48°35′ of west longitude [
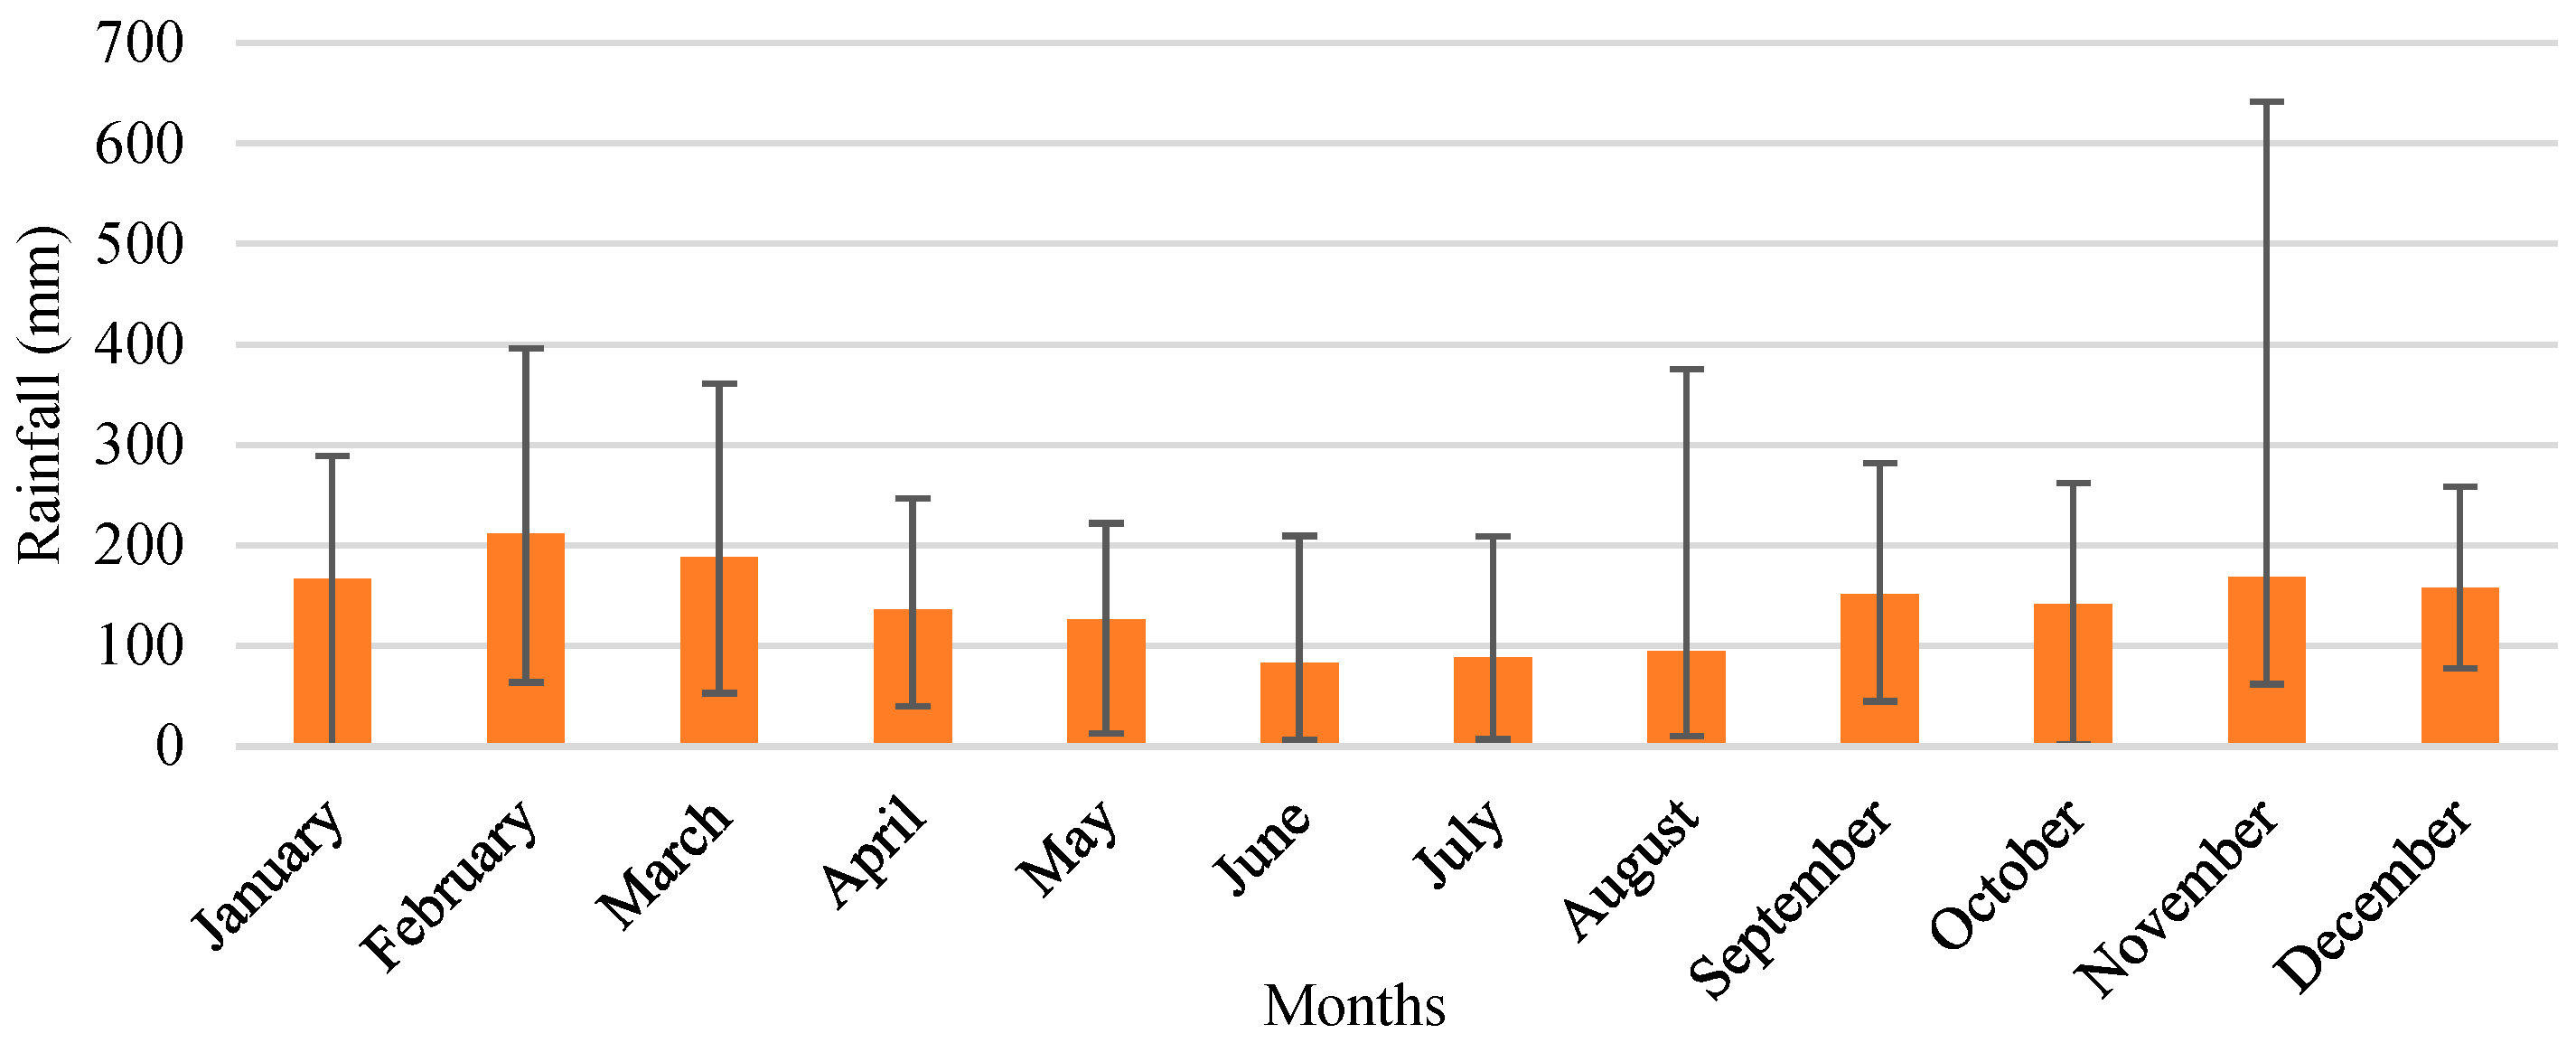
33]. The lowest rainfalls occur during winter, while the maximum rainfall in three consecutive months occurs in January, February and March (over summer) [
34].
Figure 2 shows average rainfall over 2000 to 2015, obtained from EPAGRI/CIRAM (Santa Catarina Agricultural Research and Rural Extension Enterprise/Santa Catarina Environmental Resources and Hydrometeorology Information Center) weather station (latitude: 27°38′50″ S, longitude: 48°30′ W and altitude equal to two meters).
2.2. The Multi-Storey Residential Building
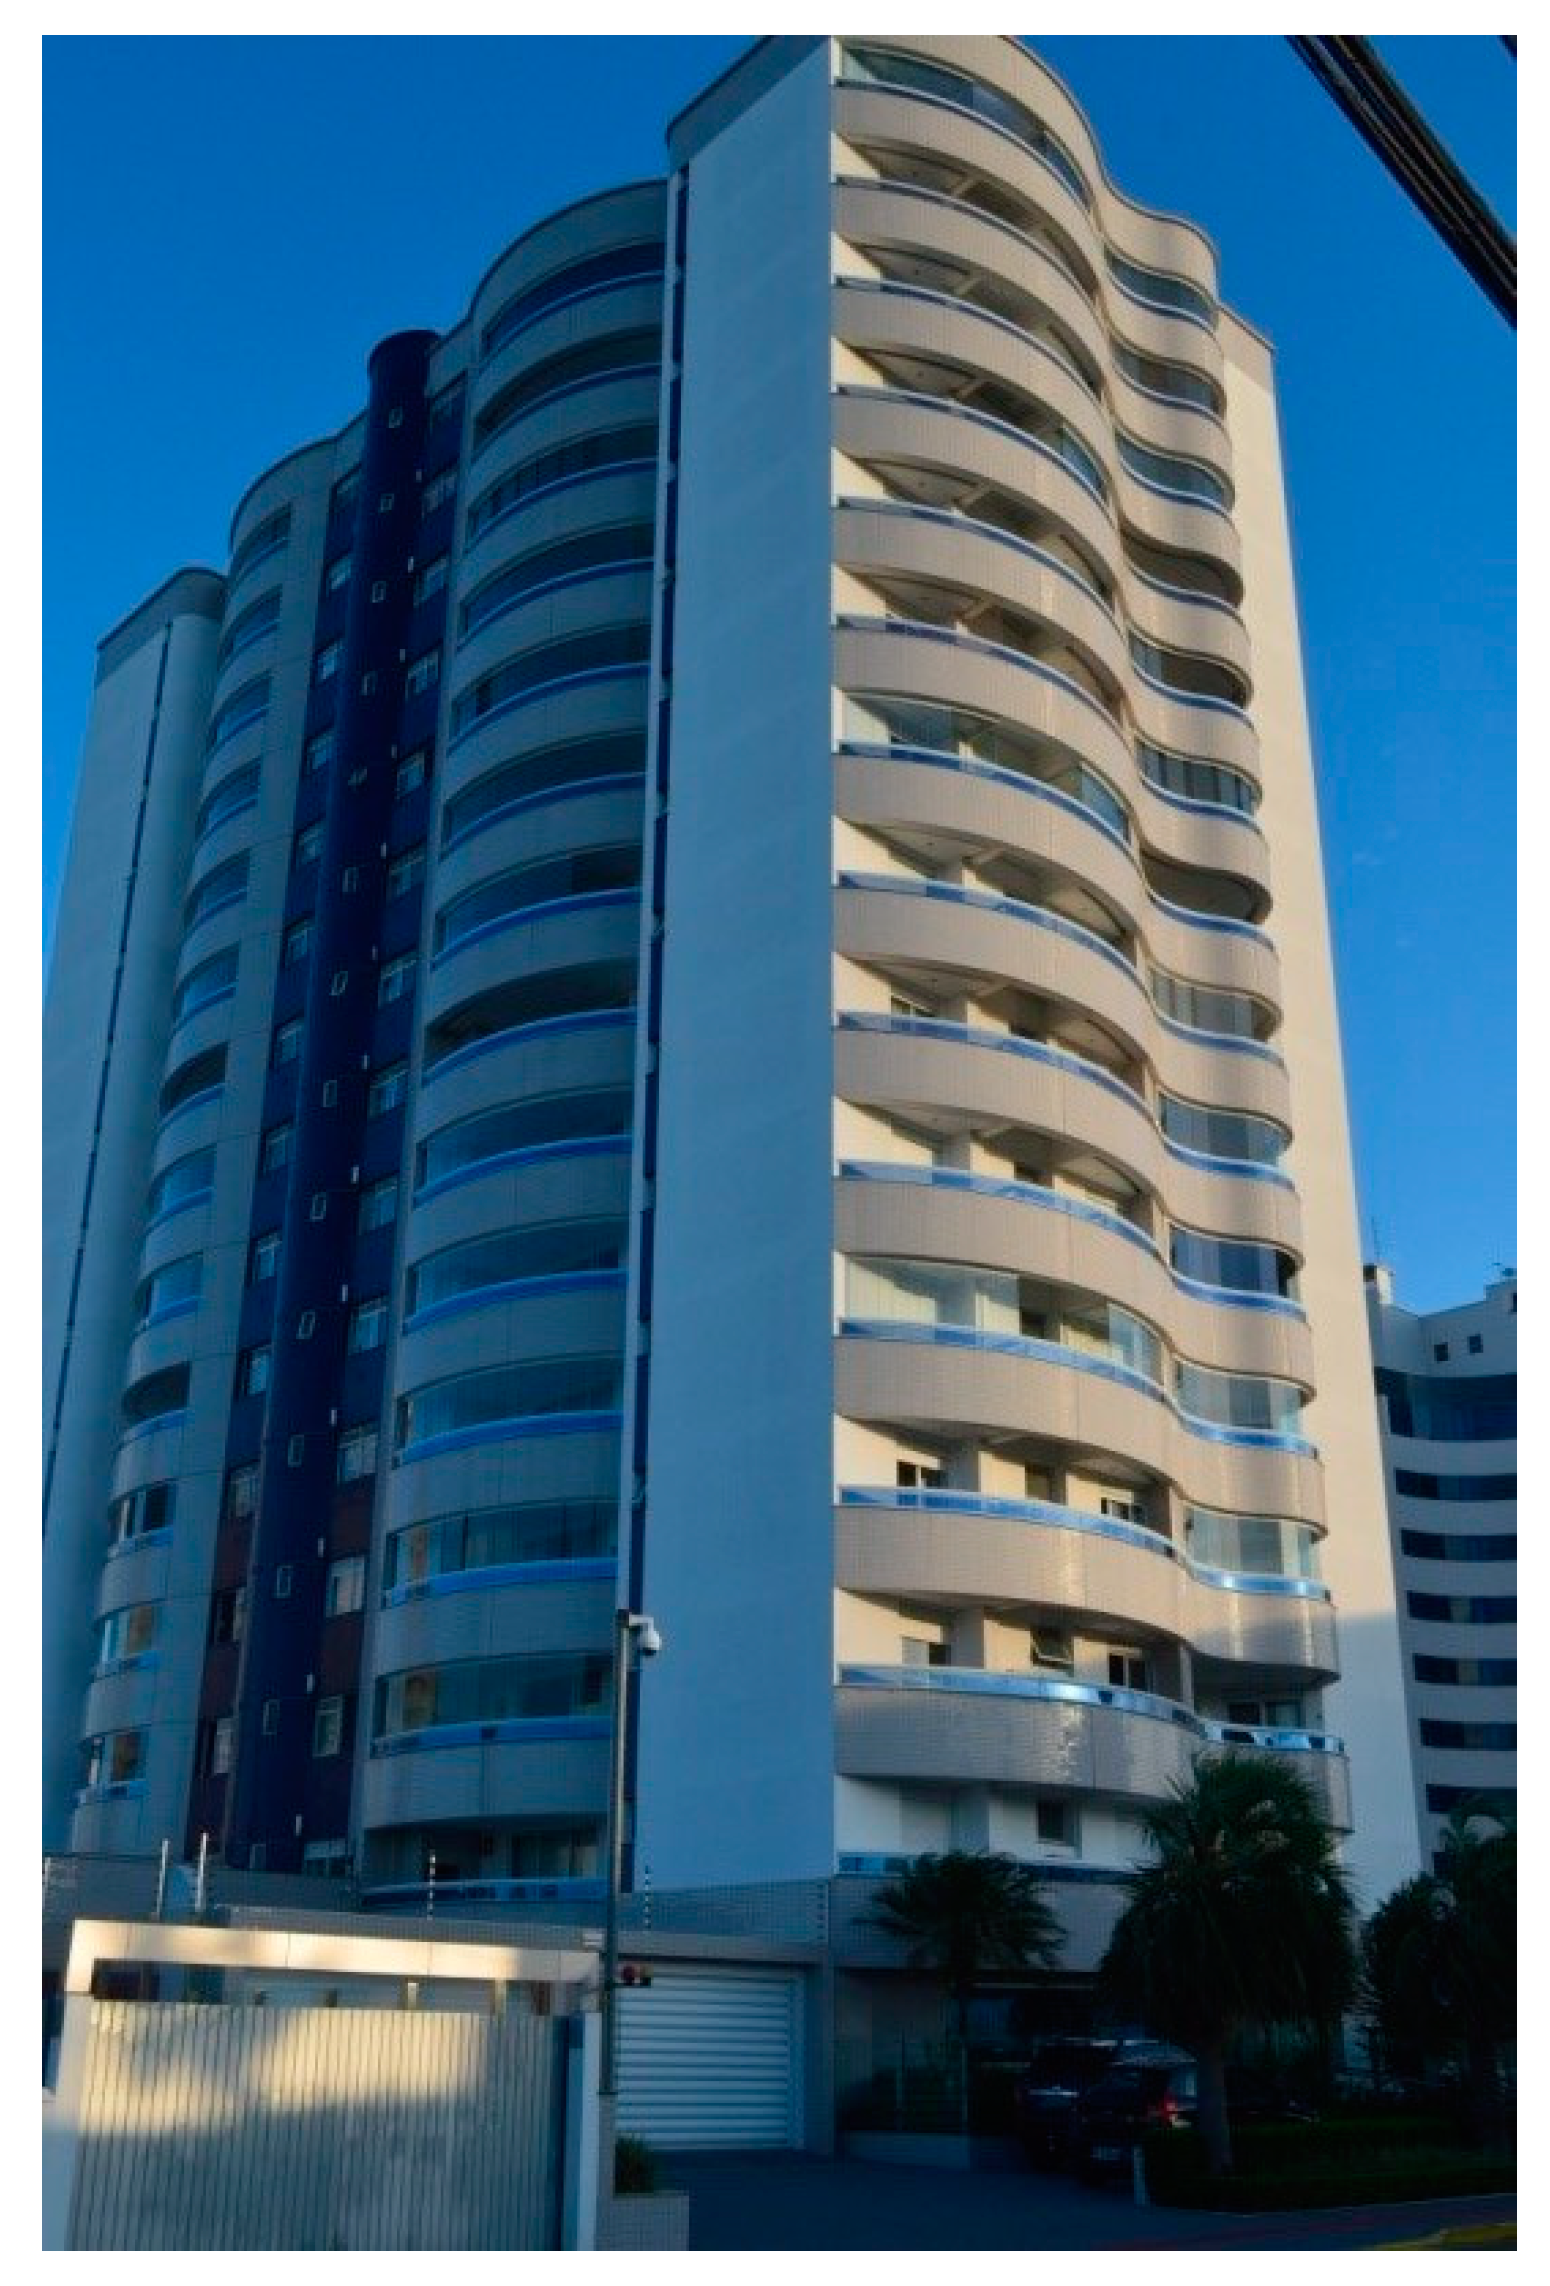
This research was conducted in a multi-storey residential building which holds a rainwater harvesting system that supplies the flush of toilets. In Brazil the building is considered as a high-standard one. It consists of fourteen floors, and each floor contains four flats. The residents who live in the building are between the middle and upper social classes.
Figure 3 shows the building facade and
Table 1 shows the floor-plan area of the rooms in the flats.
2.3. Data Collection
Daily rainfall data recorded from 2000 to 2015 were used in this research. Analysing the architectural project of the building, the available roof area for rainwater catchment was obtained, i.e., 561.60 m2.
Regarding water consumption in the flats, two types of data were collected. First, daily readings were taken on the water meters for each flat. These readings were performed over 21 days, between February and March (summer), at 10 pm. (due to lower water consumption). The difference between two readings performed on consecutive days resulted in the daily water consumption per flat. In addition, readings were recorded on the same date and start time of a questionnaire which was completed after 24 h in the flats—the procedure is better detailed in
Section 2.4. Monthly water consumption data for each flat, from 2011 to 2018, were also collected from the water bills.
2.4. Water End-Uses
The water end-uses in the flats were estimated using a questionnaire with information about frequency, time of use and water flows at the water fixtures.
2.4.1. Pilot Experiment
Two different questionnaires were developed and two pilot experiments were conducted in order to define the questionnaire that minimised the error associated with the responses of the residents to water consumption. The most accurate questionnaire was applied to as many flats as possible.
Water Consumption
The water consumption on taps and showers where the pilot experiment was conducted was estimated through the product between the water flow of the water fixture and the time of use of the water fixture. The consumption of washing machines and dishwashers was obtained from the manufacturers with brand and model information of the equipment, provided by the residents according to
Table 2. Cells marked with “-” indicate that the equipment was not used during monitoring of water consumption.
There are dual-flush bowl-and-tank toilets in all flats; 3 litres of water are used in a half flush and 6 litres of water in a full flush.
The drinking water consumption was estimated considering the number of glasses (200 mL) of water the residents consume in a day. Consumption of bottled water was not included. The potable water consumption in the flat was calculated summing the daily consumption of drinking water, washing machine, the dishwasher, taps and showers.
Although potable water is also consumed for flushing the toilets, it was not possible to quantify separately the volumes of potable water and rainwater used in these appliances. This is because there is no measurement of the rainwater used nor measurement of the potable water used to flush the toilets. Therefore, the water consumption for toilet flushing was calculated separately from the water consumption in the flats.
Flow Rates Calculation
The water flow rates of taps and showers were calculated through the ratio of the recipient capacity (500 mL) to the time required to fill it. The taps were opened to half of their maximum aperture, in order to obtain an average flow of water when compared to their maximum flow rates. The valve of the shower was completely open. The final flow rates were calculated as the average of three flow rate measurements performed at each water fixture.
The First Questionnaire Developed
The first questionnaire was developed to allow residents to answer questions about their daily water consumption at each water fixture and questions related to their satisfaction with the rainwater harvesting system. Participants also expressed their opinion on the importance of water savings. This questionnaire was applied to a family of five people. After their responses, the average water consumption was calculated, excluding water consumption for toilet flushing. For verification purposes, the water consumption recorded in the water meter during the day of the experiment was used as a reference value.
The Second Questionnaire Developed
In order to improve the precision of the residents’ answers, another questionnaire was elaborated, consisting of two parts. The first part, filled out by each person, questioned the participants about their particular opinions and habits. The second part aimed to monitor the water consumption in the flats over 24 h. The questionnaire was prepared in order that residents could register the usage time of each water fixture when they would use it. An area was also reserved for registering the amount of full and half toilet flushes that were set during the monitoring period, as explained in
Section 2.4.2. In the questionnaires of the kitchen and laundry room, it was requested that the characteristics (brand and model) of the dishwasher and washing machine be registered. An area was also reserved to ask residents to mark the number of glasses of water consumed in the day. Residents were asked to write their names on the questionnaires in order to allow their identification in case of non comprehension of some data. This questionnaire was applied to the same family.
The second questionnaire provided more accurate results than the first questionnaire. Therefore, it was used to give continuity to the experiments in the other flats.
2.4.2. Experimental Procedure
Both parts of the second questionnaire were applied to the residents from February to April 2018. First, the residents were asked about the possibility of completing and delivering the questionnaire. On the delivery date of the questionnaire, the experimental procedure was explained in detail to the residents. They were asked about the possibility of differences in their water consumption during the weekdays and on weekends. In the flats whose residents answered that this possibility was true, the questionnaire was applied during a working day, as well as during a day on a weekend. Next, the day of the experiment was scheduled. It was clarified that the experiment should be concluded 24 h after its beginning. Besides, residents were instructed to keep water consumption as close as possible to their daily consumption and to send to the researcher photographs of showers and taps they used during monitoring.
Water consumption was calculated according to
Section 2.4.1. In order to obtain tap and shower flow rates, some measurements were performed on taps in the common areas of the building due to the non consent by the residents to measure the flow rates in some flats. Thus, the flow rates used for the kitchen and laundry room taps correspond to the average of the flow rate of the kitchen tap obtained in the pilot experiment and the flow rate measured in the kitchen of the building common area. The flow rate in the washbasins was estimated as the average between the washbasin flows of the pilot experiment and the flow rates measured in the common areas. For the gas showers, it was considered the shower flow rate obtained in the pilot experiment. For electric showers, the flow rates specified by the manufacturer were used.
2.4.3. Differences Between Measured and Estimated Consumption
The potable water transported through the rainwater harvesting system is measured in the building general water meter, and it is monthly prorated between flats. Therefore, the water consumptions obtained using the questionnaire should approach the maximum of the consumption registered in the individual water meters. In this way, it will be possible to admit that there were no errors of registration in the questionnaire associated with the water consumption in the toilet flushes. The difference between the water consumption resulting from the questionnaire and the water consumption recorded in the water meter will be considered as an error.
2.4.4. Percentage of Consumption at the Points of Use
The water end-uses were estimated through the proportion between the daily water consumption in the water fixture and the total daily water consumption in the flat resulting from monitoring.
The average daily water consumption in the building was estimated through the sum of the average daily water consumption in the flats. These water consumptions were estimated by the ratio between the sum of the daily water consumptions of flats and the number of water meters read at 10 pm., according to
Section 2.3.
2.5. Potential for Saving Potable Water
2.5.1. Percentage of Non Potable Water that can be Replaced with Rainwater and Simulated Scenarios
In order to estimate the potential for saving potable water in the building by using rainwater, the percentage of water used for non potable purposes was calculated. It corresponds to the sum of percentages of water used in toilet flushes, tanks in the laundry room and the washing machines of the flats. Thus, the first scenario was simulated in order that the rainwater harvesting system would provide rainwater for use in toilet flushes, laundry troughs and washing machines. The second scenario considered that the rainwater harvesting system would provide rainwater only for use in toilets (which is the current real situation of the existing rainwater harvesting system in the building).
2.5.2. Rainwater Tank Capacity
Although there is already a rainwater tank in the building, the method used to size such a tank is not known. In addition, it is sought to verify the feasibility of the rainwater harvesting system not only to supply the toilets flushes but also to supply the washing machines and the tap of the laundry tub.
The sizing of the rainwater tank was performed by using the “Netuno” programme [
35], a computer programme developed in order to simulate rainwater harvesting systems. The programme simulates a rainwater catchment system for a set of known variables, supplied as input: daily rainfall data; discharge of the initial rainfall (equal to 2.0 mm [
36]); catchment area; daily consumption of potable water per capita; total number of residents in the building; runoff coefficient of 0.85 in fibre cement tiles [
37]; percentage of potable water to be replaced with rainwater; capacity of lower and upper rainwater tanks. The daily potable water consumption per capita was established through the proportion between the average monthly water consumption of the building, from historical series of water consumption data and the product between the residents of the building and the number of days in the month.
Several rainwater tank capacities were simulated at 1.0 m3 intervals for each of the two different percentages of potable water to be replaced with rainwater. For each simulation, the “Netuno” programme calculated the potential for potable water savings through the use of rainwater. Thus, a graph was created where the x-axis represents the simulated lower rainwater tank capacities and the y-axis indicates the corresponding potential for potable water savings.
First, the total percentage of potable water that could be replaced with rainwater was considered. Then, only the percentage of water regarding the use in toilet flushes was considered. Ideal rainwater tank capacities were those whose last volume variation resulted in an increase in the potential of water savings equal to or less than 0.21% considering the use of rainwater in toilet flushes, washing machines and tubs in the laundry rooms and 1.1% when the rainwater harvesting system was sized to use rainwater only in the toilet flushes. The maximum capacities of the lower rainwater tanks were approximately 10 times higher than the daily rainwater demands considered in this study.
The upper rainwater tank capacities were considered equal to the daily rainwater demands: firstly the daily water consumption in the toilets, tubs in the laundry rooms and washing machines were considered and, finally, only the daily water consumption in the toilet flushes of the flats was taken into account.
2.6. Satisfaction of Users
Participants were individually asked about the use of full and half toilet flushes and the appearance of water in the toilets. In addition, they were asked about their satisfaction with the rainwater harvesting system, their knowledge related to the existence of this system, their satisfaction regarding the water pressure at the water fixtures and personal questions on water saving. Name, age, number of residents in the flat and gender were also registered.
Several answers were obtained since the questions were open. In order to facilitate data interpretation, each response was framed in a category defined by the researcher. Regarding the question about water saving importance, the answers associated with the environmental preservation argument were included in the category “resource preservation”. Responses on water scarcity were included in the category “ensuring water supply to the population”, and responses in which water savings were associated with a reduction of financial expenses were included in the “financial savings” category.
After data collection, the answers were transferred to a spreadsheet. Data were summarised, mainly through tables and frequency charts. The analyses verified both satisfaction of residents with the rainwater harvesting system and awareness of residents about water saving.
2.7. Economic Analyses
The economic feasibility analyses of the systems were performed using the “Netuno” programme [
35], which estimates the internal rate of return, payback and the net present value. First, the feasibility of the system currently installed in the building was analysed. Subsequently, the economic feasibility analyses of two other systems were performed: one considering the total percentage of potable water that may be replaced with rainwater and the other considering only the percentage of water consumed to flush the toilets. In the first simulation, the capacities of the upper and lower tanks were considered according to the hydro-sanitary building project. In the second and third simulations, the rainwater tank capacities were modified to the ideal capacities found through the analyses explained in
Section 2.5.2.
Since many costs could not be obtained for the time when the building was constructed, economic analyses were performed based on costs available in 2018. Equation (1), proposed by Tomaz in 2010 [
38], was used to calculate the costs of the tanks constructed with reinforced concrete. The value (from 2010) was corrected for actuality considering Brazilian inflation from 2011 to 2018.
where: C is the cost of the rainwater tank (USD) and V is the capacity of the tank (m
3).
Costs were considered for concreting as well as manufacturing, installation and removal of forms of the tanks [
39]. For the system components installation, labour costs were also included [
40].
Costs associated with the cleanliness of the tanks were estimated based on previous expenses of the building over the rainwater harvesting system operation (USD 125.00 per tank). Cleanliness of the tank was considered every six months. Pipe costs were estimated considering that they represent 15% of the contingency obtained when including costs of tanks and accessories of rainwater harvesting system [
41].
For inflation, it was considered a monthly rate whose annual inflation corresponds to 4.0%—inflation target for 2020, according to resolution 4582 of the Central Bank of Brazil [
42]. The minimum attractiveness rate was obtained through the monthly averages of interest rates (SELIC) from 2011 to May 2018, according to data provided by Brazilian Federal Revenue [
43]. The analysis period considered was 20 years, the lifetime of the system [
24,
44].
Specifications in the sanitary project regarding motor pumps were also considered, as well as the tariffs of energy from the local energy company. In addition, the daily operation time of the pump was estimated according to the established rainwater demand (Equations (2) and (3)). The monthly cost of electric energy for the pump operation is given by Equation (4).
where: T
op.npu is the time of daily pump operation when the rainwater harvesting system supplies all nonpotable uses (h/day); C
Mmonth is the monthly average consumption of water in the building, including the water volumes spent on toilets (m
3); P
npu is the percentage of water regarding nonpotable uses (%); Q
pump is the flow rate of water holding pressure of the motor pump assembly, specified in project and equal to 2.18 m
3/h; T
func.toilet is the daily operating time of the pump when the rainwater harvesting system only supplies toilets (h/day); P
p.toilet is the potable water percentage which may be replaced with rainwater regarding to the consumption in the toilets (%); C
monthly is the monthly energy cost demanded by motor pumps (USD); P
mp is the power of the motor pumps (kW); T
func. is the daily operation time of the motor pumps (h/day); N
d/month is the number of days in the month when the pump is operating, and V
CELESC is the electric energy cost charged by the local energy company (USD/kWh).
Water and sewage tariffs were obtained from CASAN (Santa Catarina Water Sanitation Company), the local water company. In the case of the studied building the tariff corresponds to USD 1.9328 per m2 consumed. The sewage rate charged corresponds to 100% of the water tariff. Two Brazilian taxes were also considered: PIS (1.65%)—Social Integration Programme and COFINS (7.60%)—Contribution to Social Security Financing, obtained from the water bills over 2018. A complete economic analysis should include assessment of the benefits from rainwater use, such as: reducing the costs of water bills, prevention of possible shortages of potable water and environmental preservation. The economic analyses performed in this article, however, did not quantify the last two benefits, since to perform this evaluation it would be necessary to perform a more complex analysis, which deviates from the main objectives of this study.
3. Results
3.1. Historical Data on Water Consumption
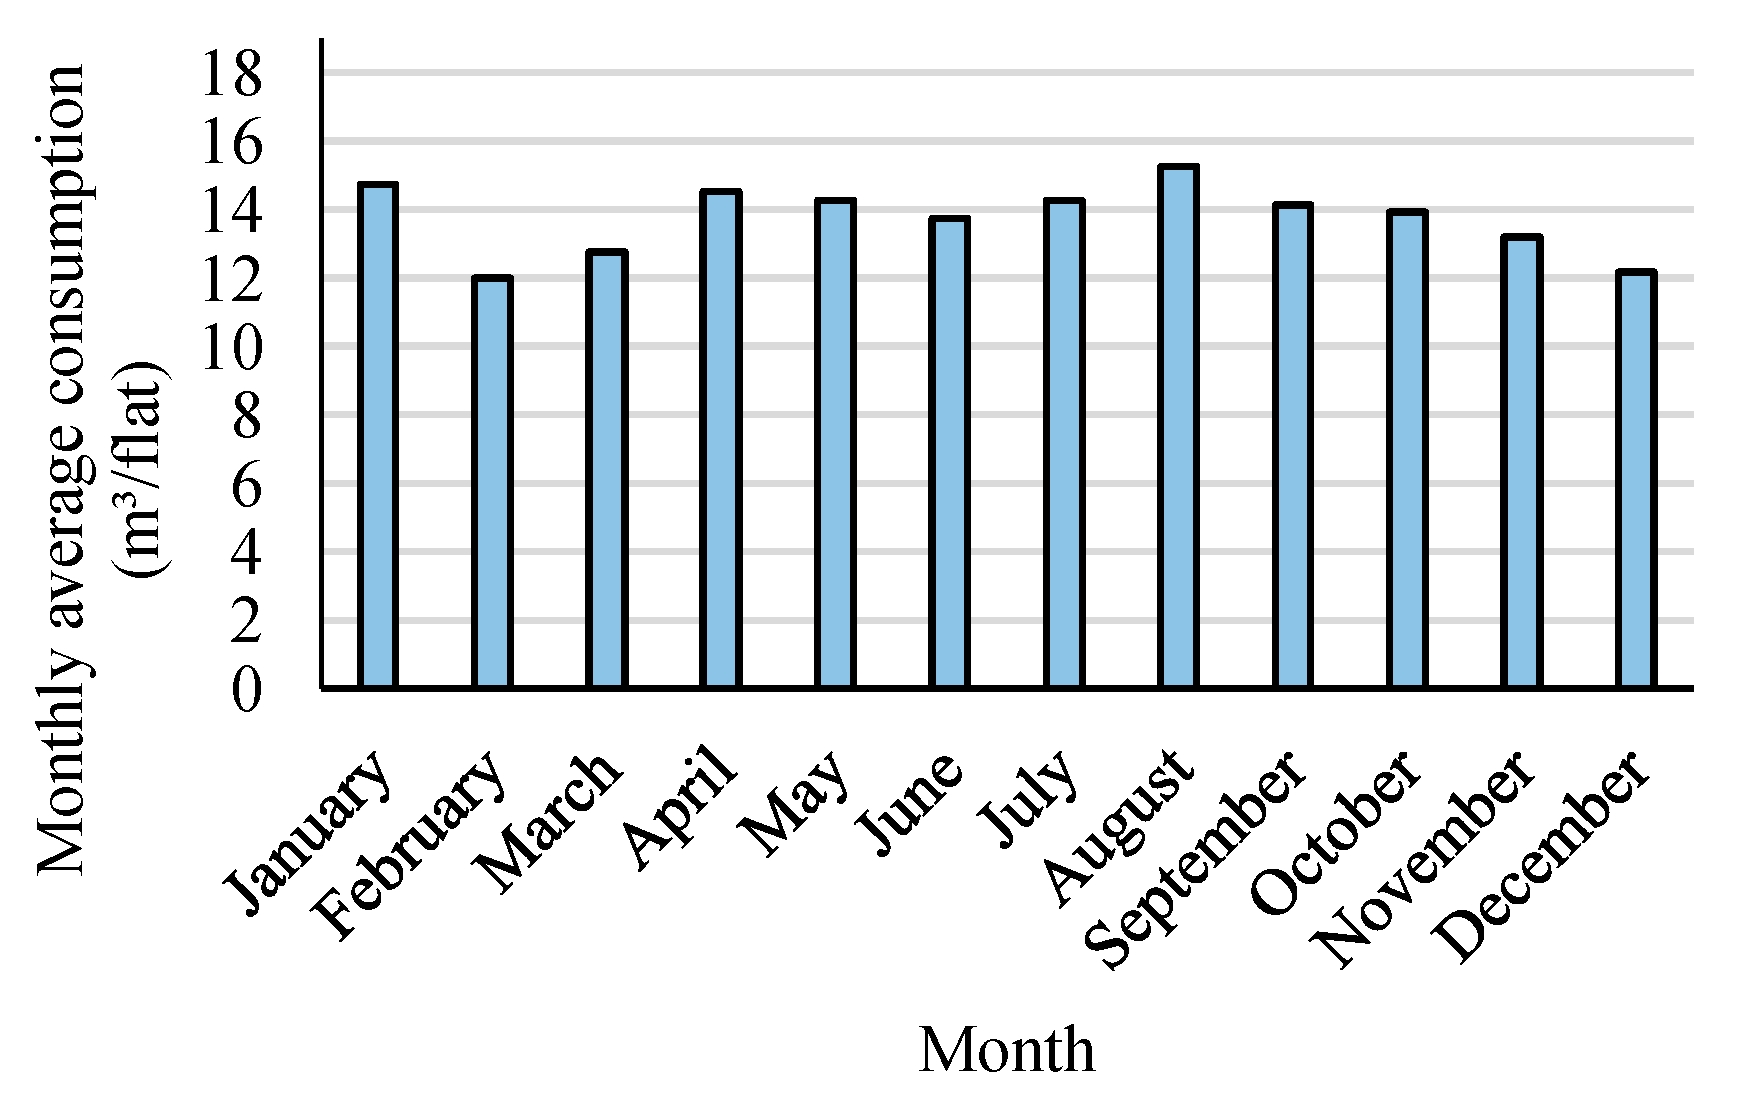
The building studied was inaugurated in 2009. Flats’ water consumption data were available from 2011 to March 2018. Then, averages of monthly water consumption were calculated for each year and each flat. Subsequently, average daily consumptions were calculated for each flat using average monthly consumption data. Finally, the average water consumption per capita for the entire building was estimated. In addition, monthly water consumption averages were calculated as well as the average of the total monthly water consumption, regarding total monthly data available (which was 12.63 m
3).
Figure 4 shows the maximum, minimum and monthly average water consumptions. It is noted that in February the average monthly water consumption of the flats is lower. This probably happens because in that month some residents tend to travel for summer holidays, thus they are not consuming water in the flats.
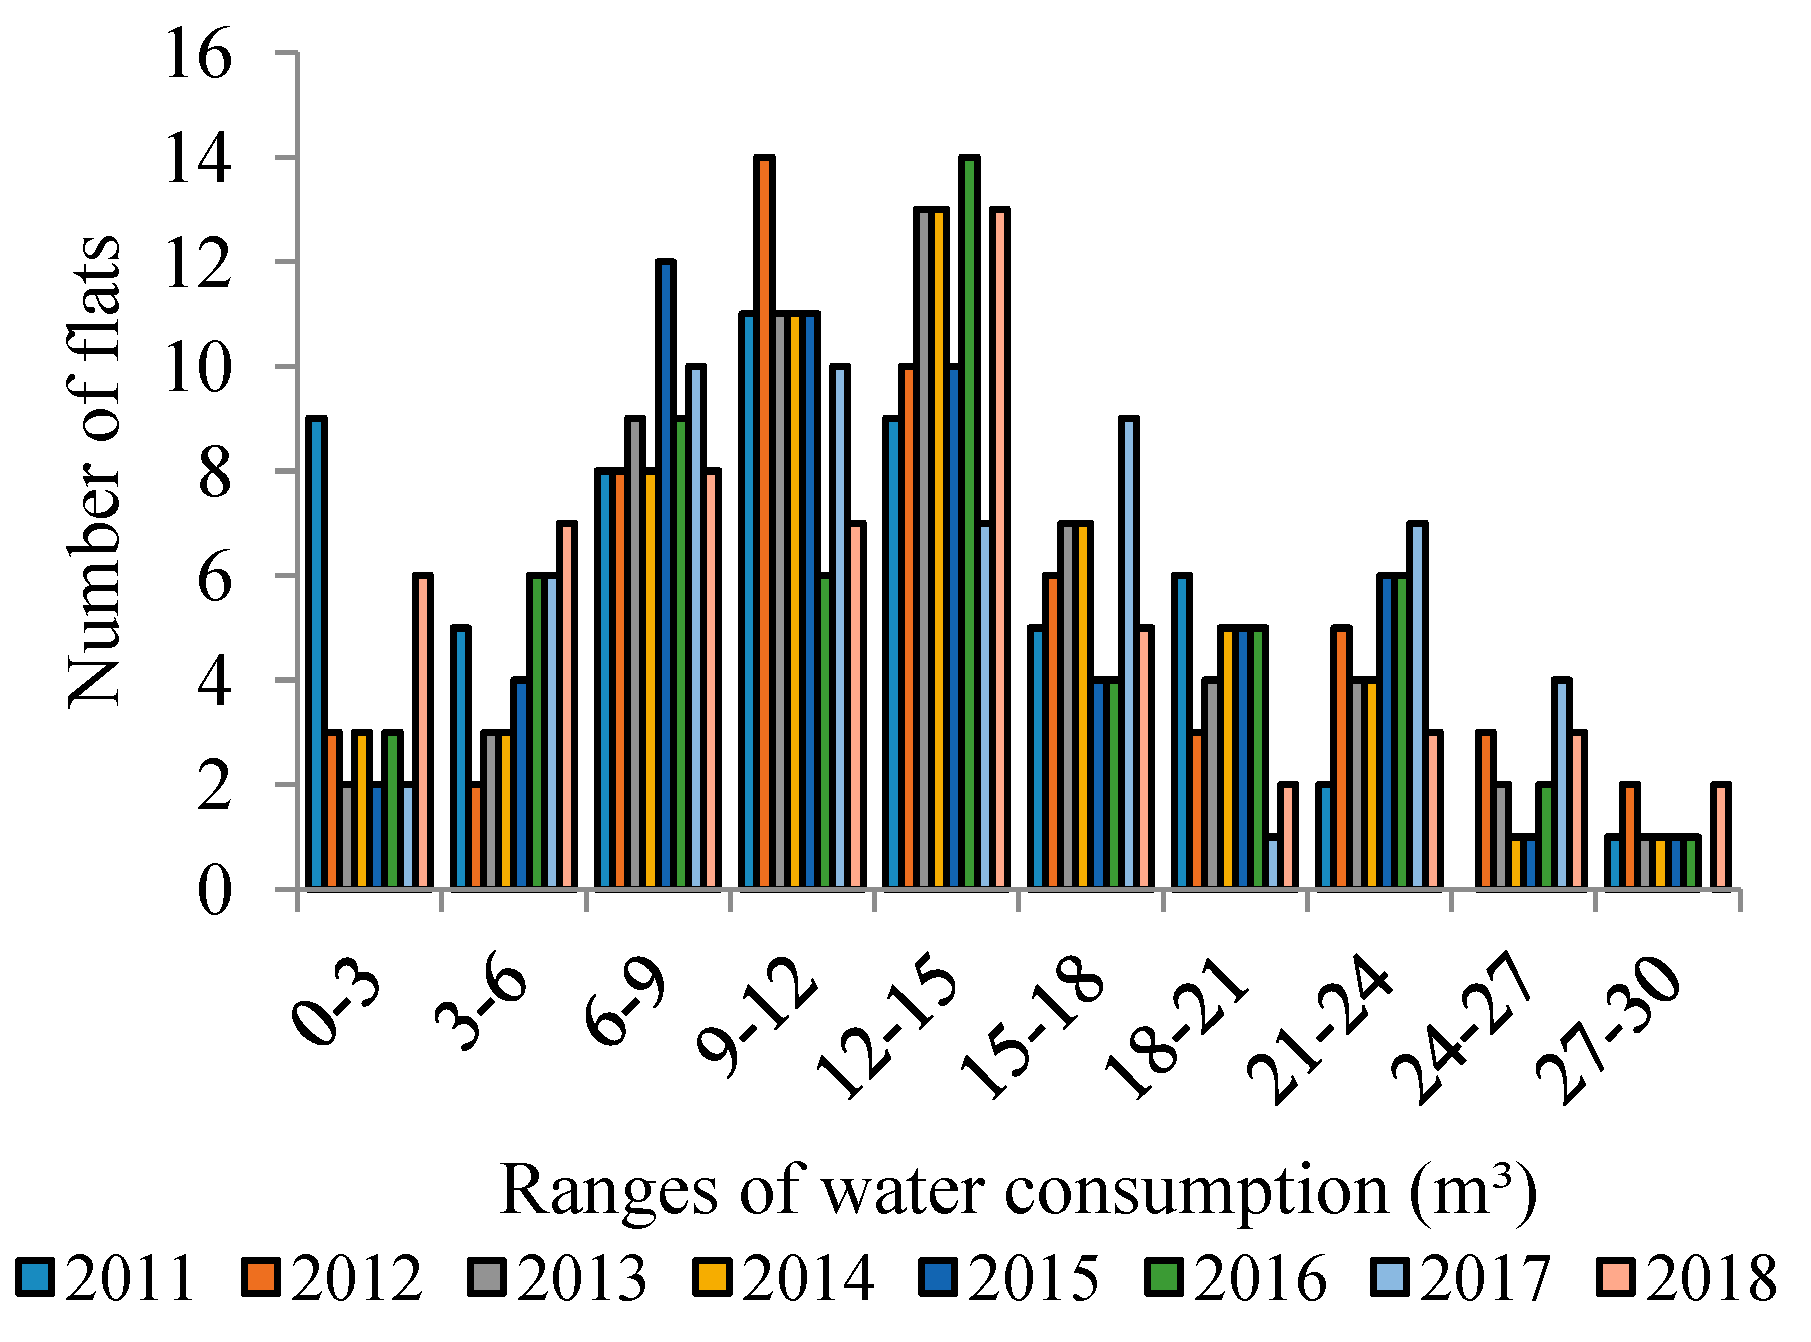
Figure 5 shows the distribution of frequencies for average monthly water consumption from 2011 to 2018. In
Figure 5, it is noted that the consumption frequency between 0 and 3 m
3 is higher in 2011. In 2018 it was also observed that the number of flats whose consumption of water was between 0 and 3 m
3 was relatively higher than in 2012 and 2017. This may be explained because residents travel more during January and March. It is notable that in 2011, 2012 and 2017 one of the highest frequencies of water consumption in the flats corresponds to the range 9–12 m
3. In 2013, 2014, 2016 and in the first quarter of 2018 the highest frequency of average monthly water consumption was from 12 to 15 m
3. In 2015 and 2017, one of the highest frequencies of average monthly water consumption was from 6 to 9 m
3.
There are 150 residents living in the building (three residents per flat, on average). Thus, average consumption per capita was obtained in the building. Considering consumption data from January 2011 to March 2018, it is estimated that the average corresponds to 0.157 m
3/person/day.
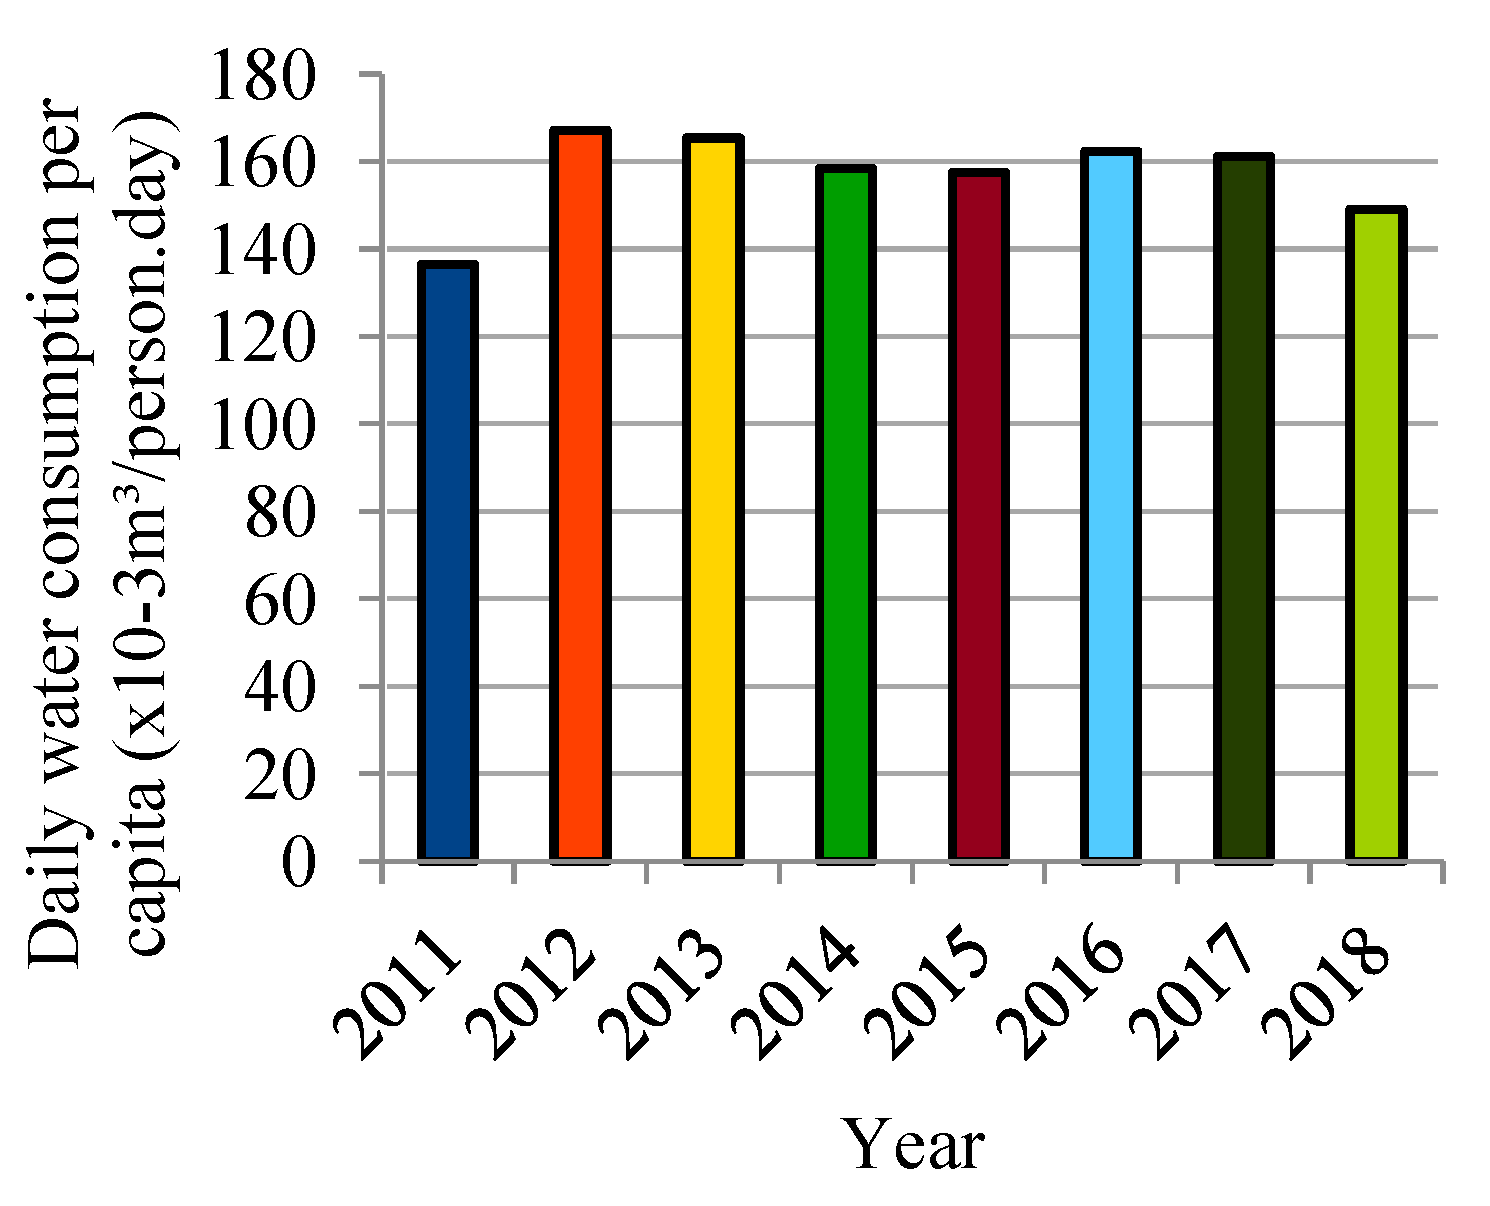
Figure 6 shows average daily water consumption per capita for each year of the analysis period. It should be noted that the lowest average water consumption per capita occurred in 2011 (0.136 m
3/person/day) while the highest water consumption per capita occurred in 2012 (0.167 m
3/person/day). The lowest consumption, in 2011, may be related to the fact that the number of residents in the building this year was lower than that considered for all years analysed (150 residents). The same number of inhabitants as 2018 was considered for the previous years since the number of inhabitants of these years is unknown.
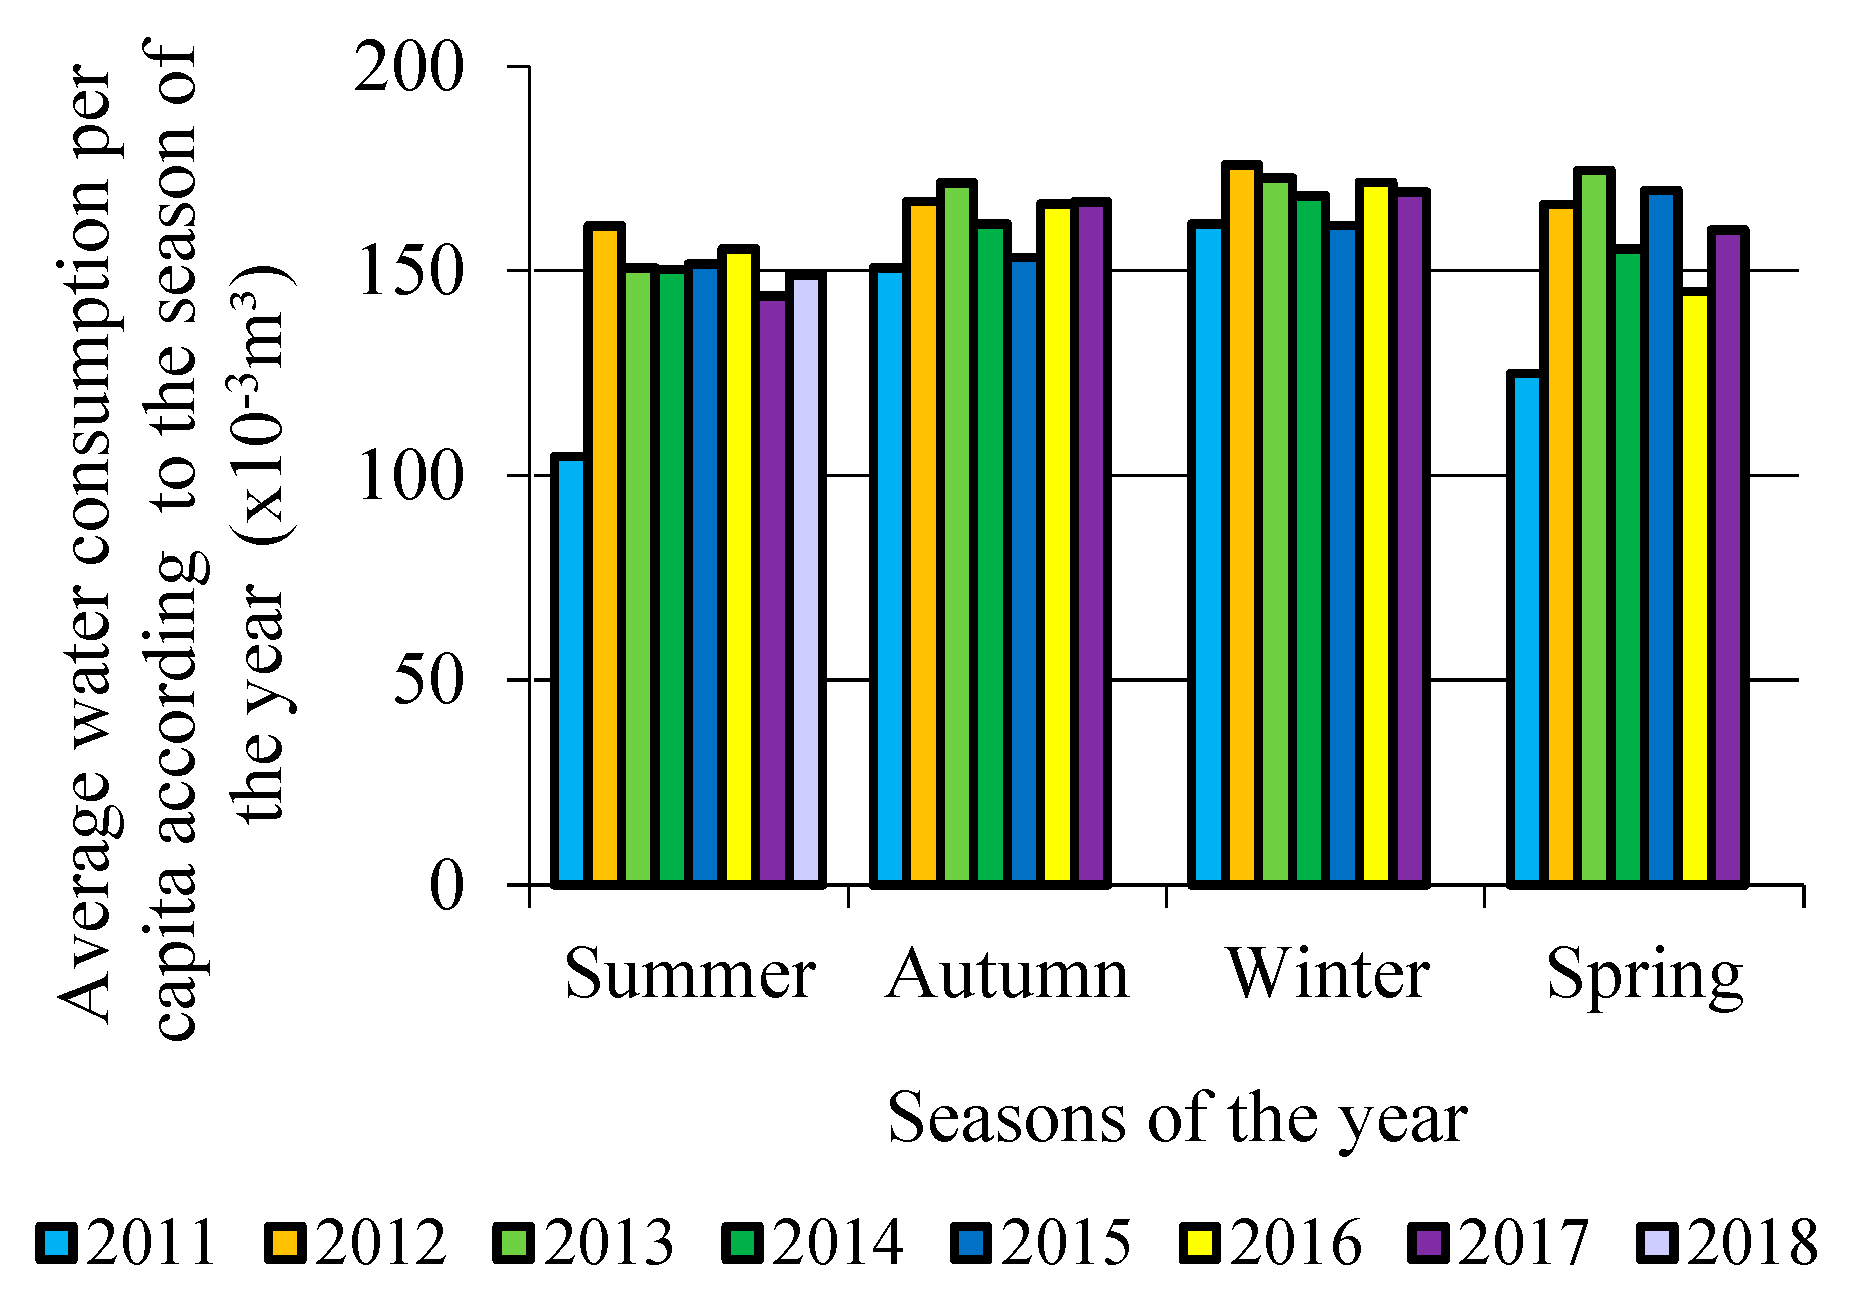
Water consumption data were also separated by the seasons of the year, and they were summarised as shown in
Figure 7. Average daily water consumption per capita were also calculated for each season, including all consumption data (from 2011 to 2018)—
Table 3. Thus, it is noticed that, in general, residents consume less water over the summer. However, in such a season, water consumption per capita data show a greater dispersion around the average consumption when compared to data from other seasons of the year. The lower consumption during summer may be associated with the period in which some residents travel or go on vacations, for example. In general, the highest consumption per capita occurs during autumn and winter. Some hypotheses may justify the higher consumption of water during the winter, such as long hot showers and a greater amount of time spent in the flats.
3.2. Daily Readings
The daily readings of the 56 water meters in the building indicate a trend towards lower water consumption on weekends. The average daily water consumption in the flats was 0.427 m3, and the average daily consumption per capita was 0.154 m3. The maximum daily consumption was 1.788 m3 and, in some flats, there was no water consumption (these flats were empty during the reading period). It is important to emphasise that these water consumptions do not include the portion of water consumed in the toilets.
3.3. Pilot Experiment
After the application of the questionnaire in the first pilot experiment, it was verified that the difference between the water consumptions estimated and measured was 39.3%. This difference is due to mistaken estimates by residents on their average water consumption. When applying the second questionnaire, such a difference between consumptions was reduced to approximately 5.6%.
Table 4 shows the results achieved with the application of these questionnaires.
3.4. Water Flow Rates
In the showers of the flats (except for flats whose showers have an electric heating system), the flow rates measured in flat 1001 (0.00942 m
3/min) were considered.
Table 5 shows the flow rates used in this study.
3.5. Water End-Uses
Among the 56 flats in the building, 23 accepted to participate in the monitoring of water consumption. In general, residents completed the questionnaire just once. Most of them reported being absent more frequently on weekends when compared to working days. As only two flats monitored the water consumption also on a weekend, such data was not considered separately from consumptions obtained on working days.
After calculating the daily water consumption in the flats (which excludes the water used for toilet flushing) and comparing it with the water consumption recorded using the water meters, a difference between real and estimated water consumption of less than 25% was verified for 15 flats. This difference was assumed once the number of households that accepted monitoring water consumption in the flats was restricted. Differences below 25% would greatly reduce the sample collected, impairing the representativeness of the sample. Among the other participating flats, three presented data with extremely high errors—for which reason they were not considered—(298.0%; 223.0% and 373.5%). In these three cases, the actual water consumption registered in the water meter was lower than the water consumption estimated using the questionnaire. These errors may be the result of mistaken estimates of appliance usage time (especially showers), inaccuracies in flow rates, high water consumption in the washing machine (since manufacturers usually provide its maximum water consumption).
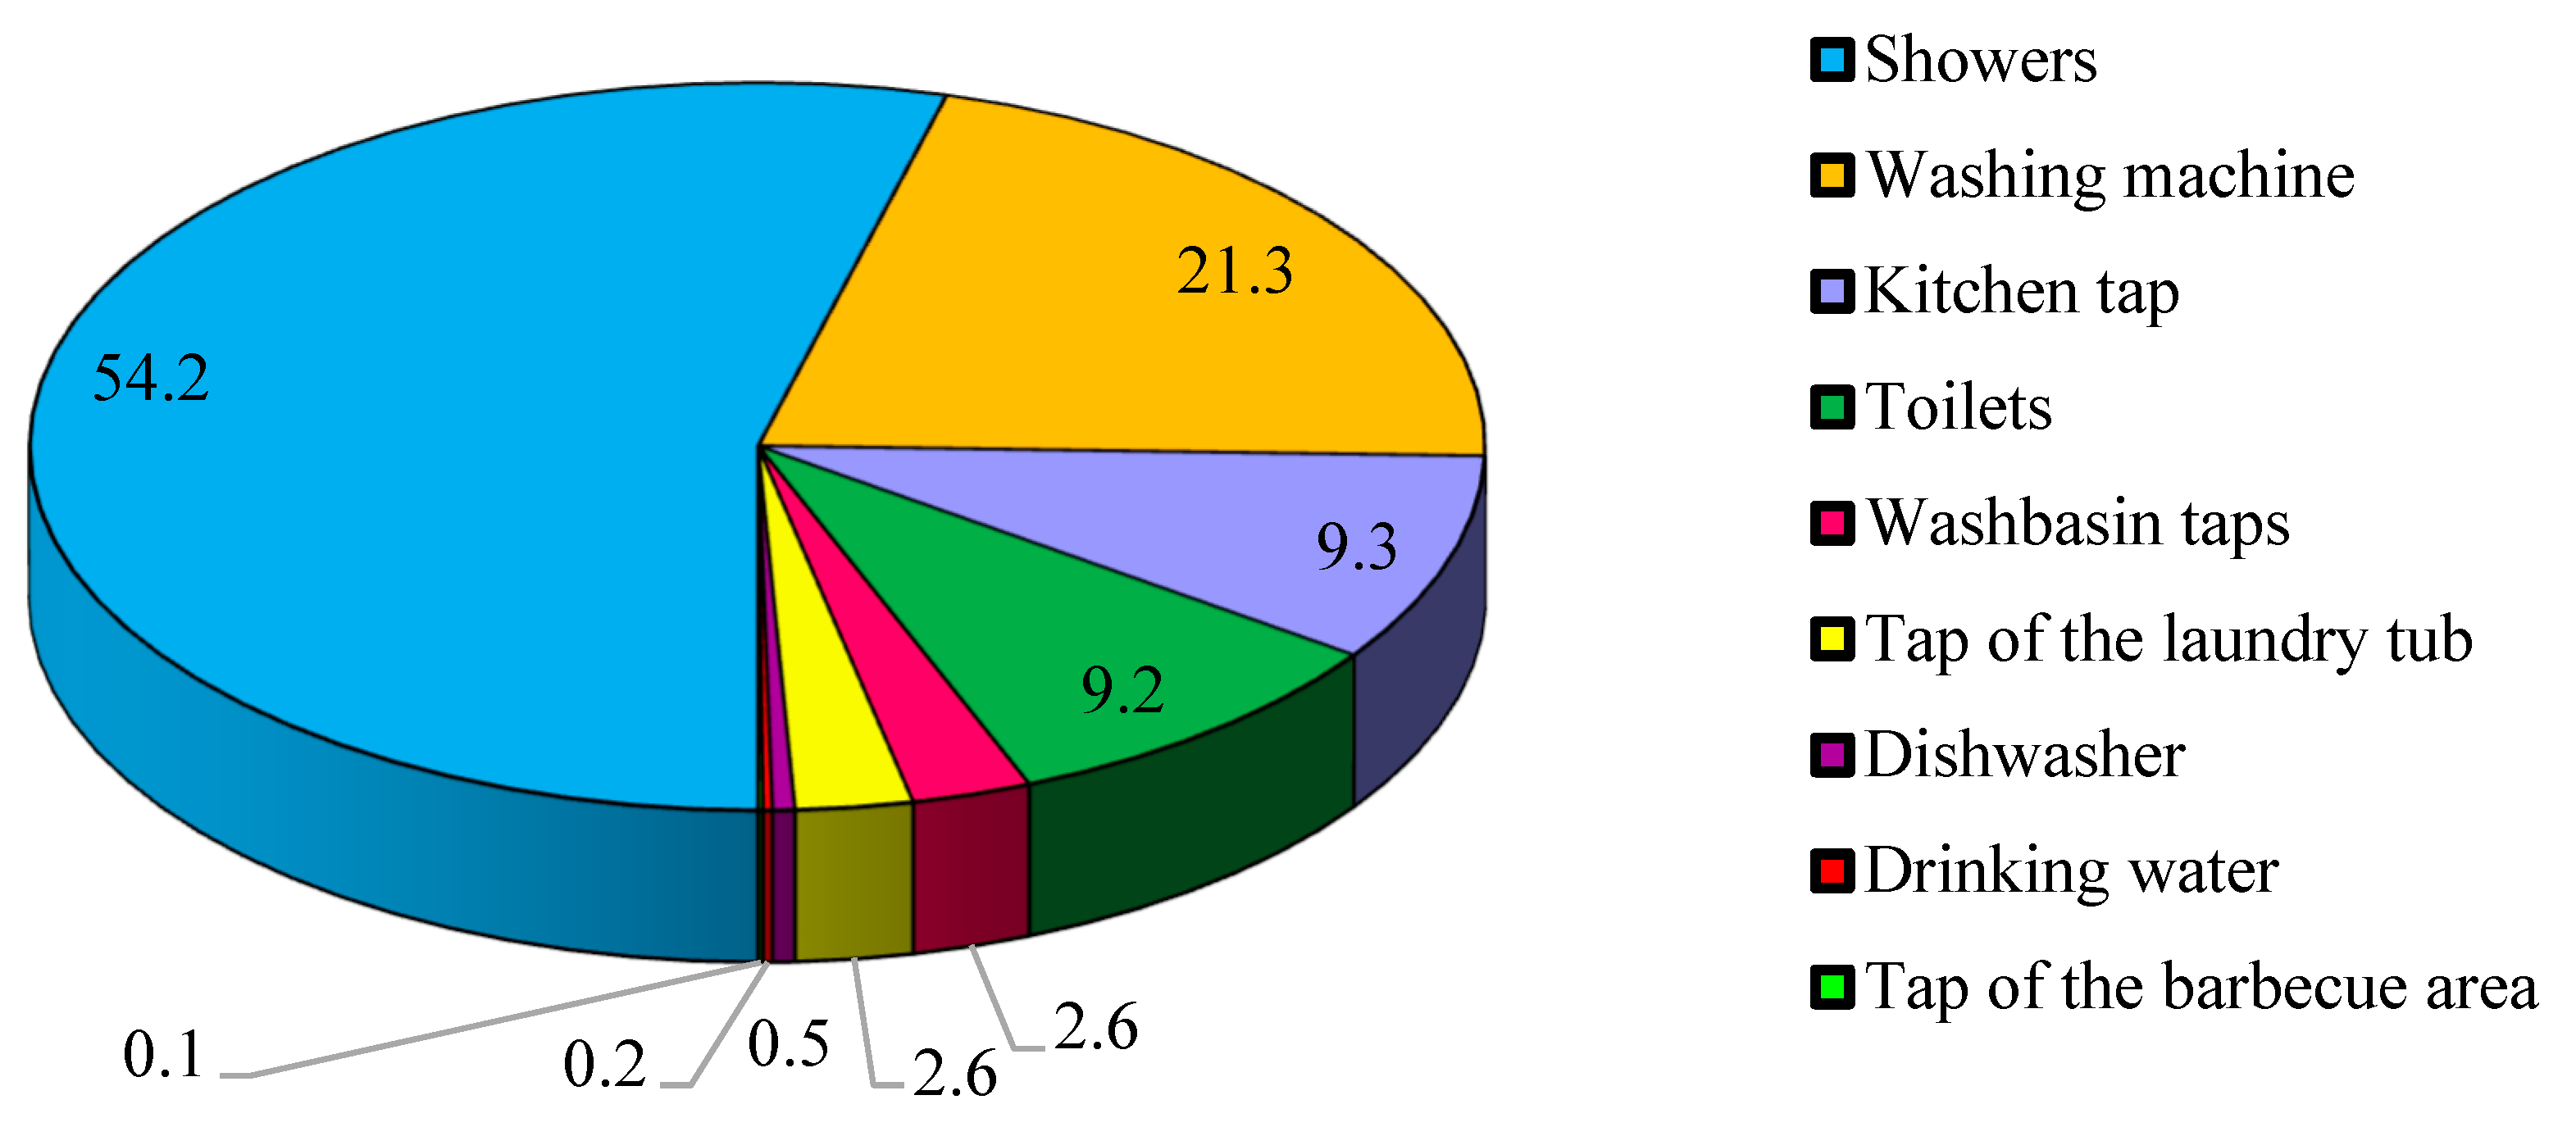
Figure 8 shows the percentage of water used at each water fixture to the total water consumption average in a flat.
There are differences between actual and estimated water consumption (0.533 m3 and 0.563 m3, respectively). However, this difference is relatively low (5.4%). It is noted that the water consumption in showers exceeds half of the total water consumption in flats. The second largest consumption of water occurs with the use of washing machines, followed by the kitchen tap and toilets.
The monitoring of water consumption was performed for 24 h at each flat, since participants could not perform it for a full week. Thus, the day when participants performed the monitoring may not have been the most representative of their water consumption routine. Residents may have performed it when they usually wash their clothes, for example, which may raise the percentage of water used in washing machines. In addition, most washing machine manufacturers provide maximum water consumption values per cycle, but the programme used in the washing machine will not always be the one whose water consumption is the maximum. There are also flats where it is usual to use the washing machine more than once in a day. In one of the flats, for example, the use of the washing machine was observed four times during a day in the economic cycle. The manufacturer, however, only provided maximum consumption data, which makes it difficult to estimate the water consumption in the washing machines with more accuracy.
3.6. Potential for Rainwater Harvesting
Considering water consumption for laundry tubs, washing machines and toilets, it is possible to replace 33.1% of potable water with rainwater. The second scenario aims to verify if the rainwater tank was adequately sized to supply the demand for toilets, i.e., 9.2%.
Table 6 shows the input data considered.
The upper tank capacity was assumed to be equal to the daily rainwater demand. Total water demand was calculated considering that the daily average of water consumed per person (0.157 m3) corresponds to 90.81% of the total water demand. It was assumed that the remaining percentage is the portion of water consumption per capita used in the toilet. Therefore, the total water consumption of 0.173 m3/person/day was considered.
It was verified that 150 residents were living in the building at the time. However, three flats were empty. Therefore, to perform the simulations in “Netuno”, three residents were considered in each of these flats, adding up to 159 residents.
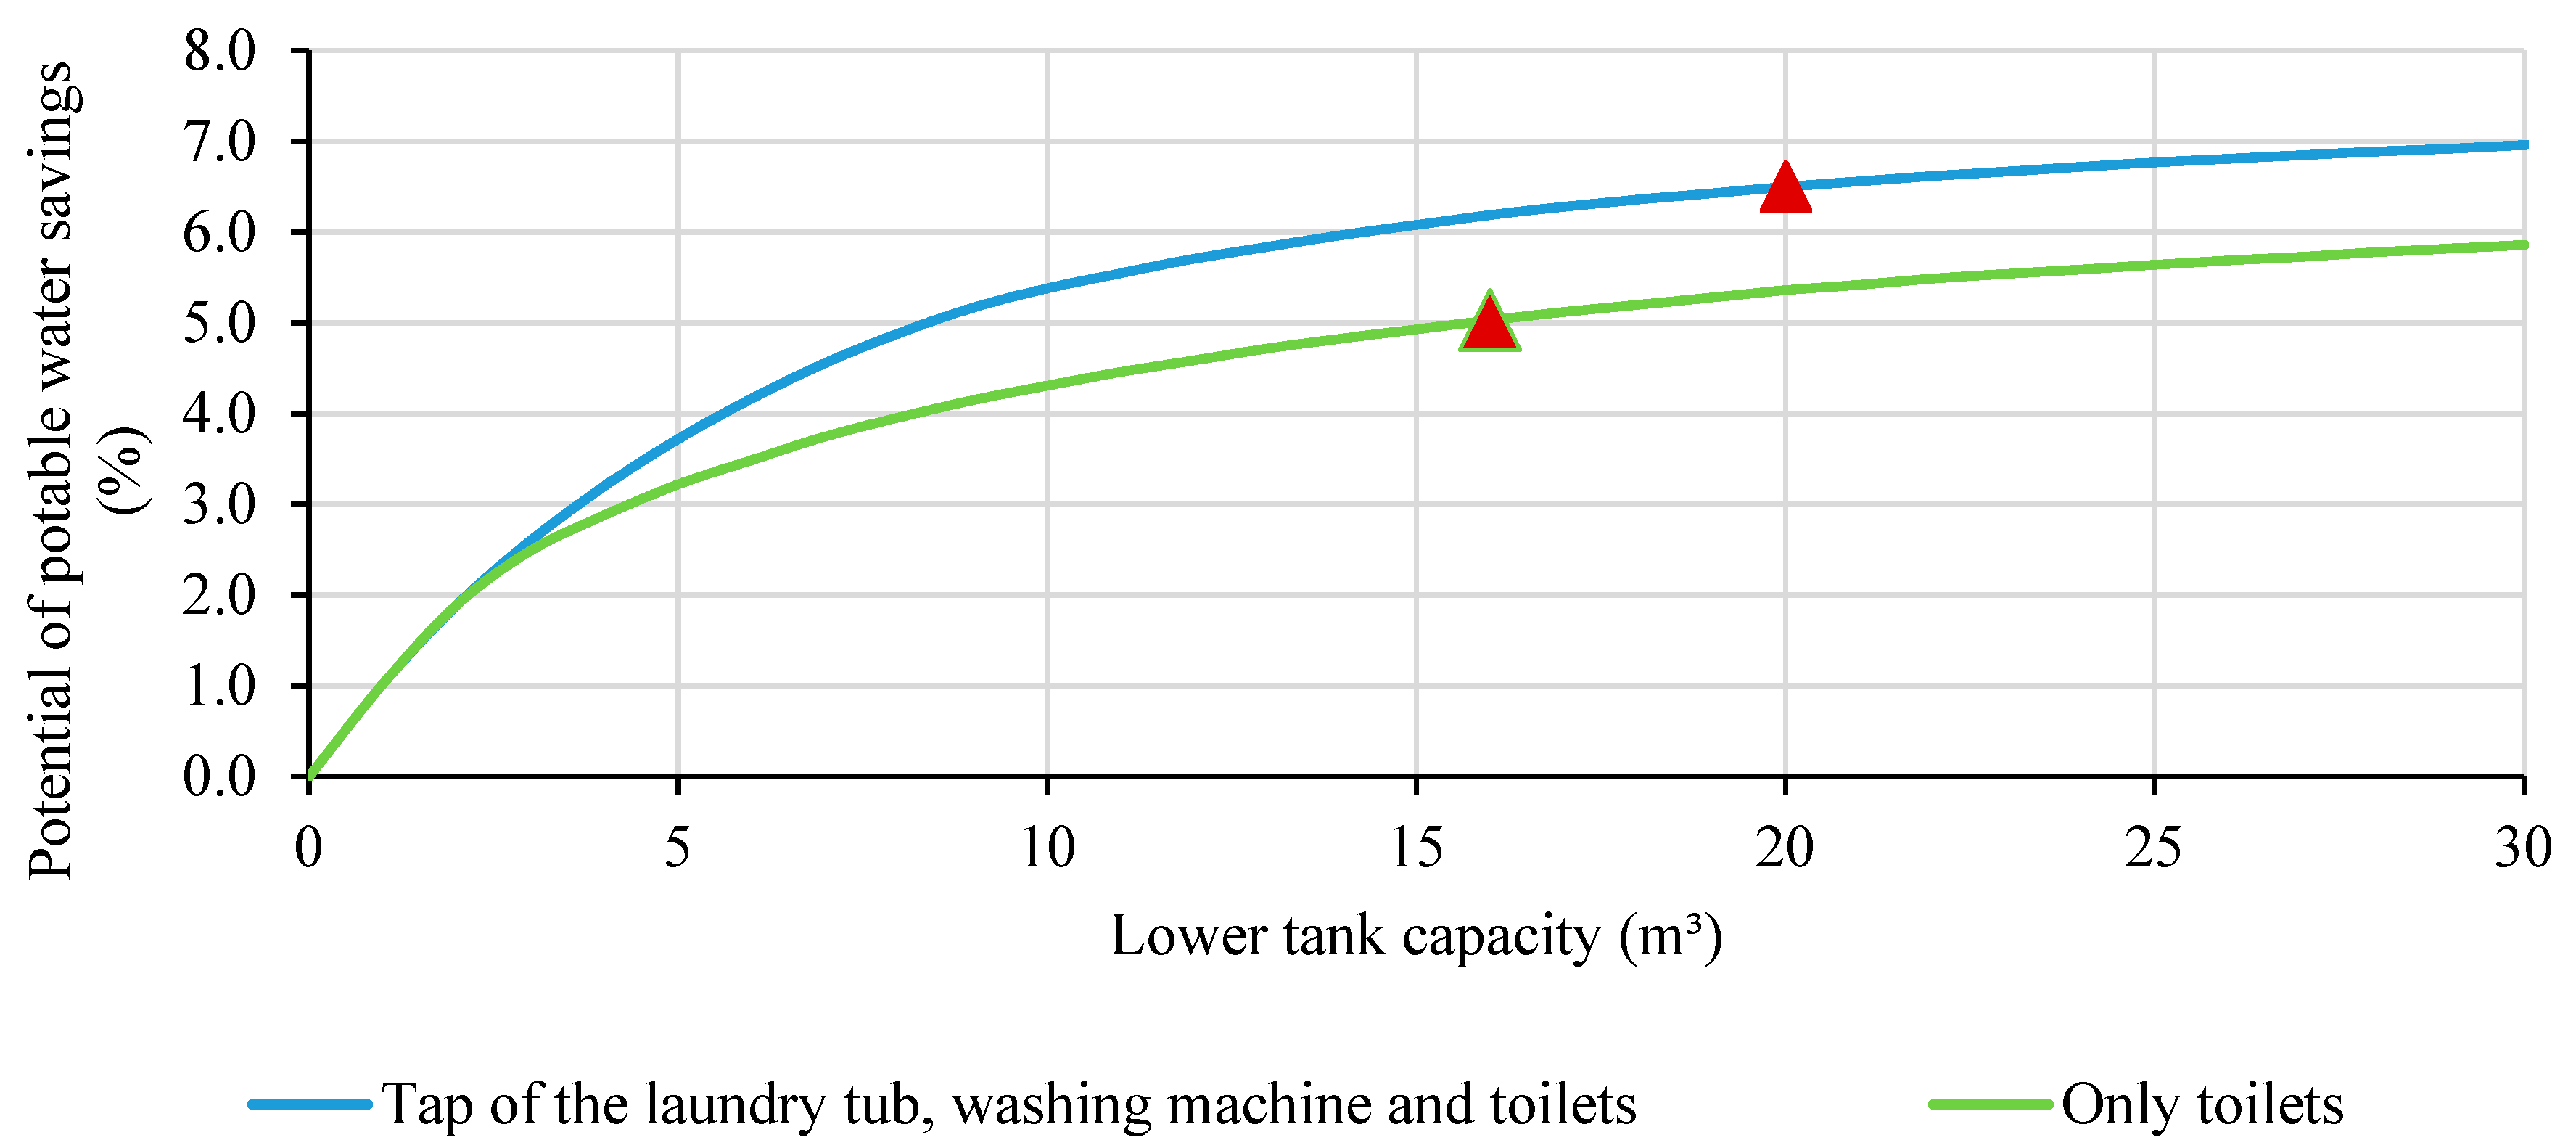
The simulation which took into account the water demand required to supply all the non potable uses indicated that the ideal lower tank capacity should be 20 m
3, with a potential of water savings equal to 6.5%. The tank capacity when rainwater was used only for toilet flushing was 16.0 m
3, with potable water savings equal to 5.0%.
Figure 9 shows the simulated scenarios.
The capacity of the lower rainwater tank which is currently in use in the building is 30.9 m
3. Such a capacity is much larger than the ideal capacities obtained for both scenarios. In addition, the capacity for the upper rainwater tank currently in use is 28.59 m
3.
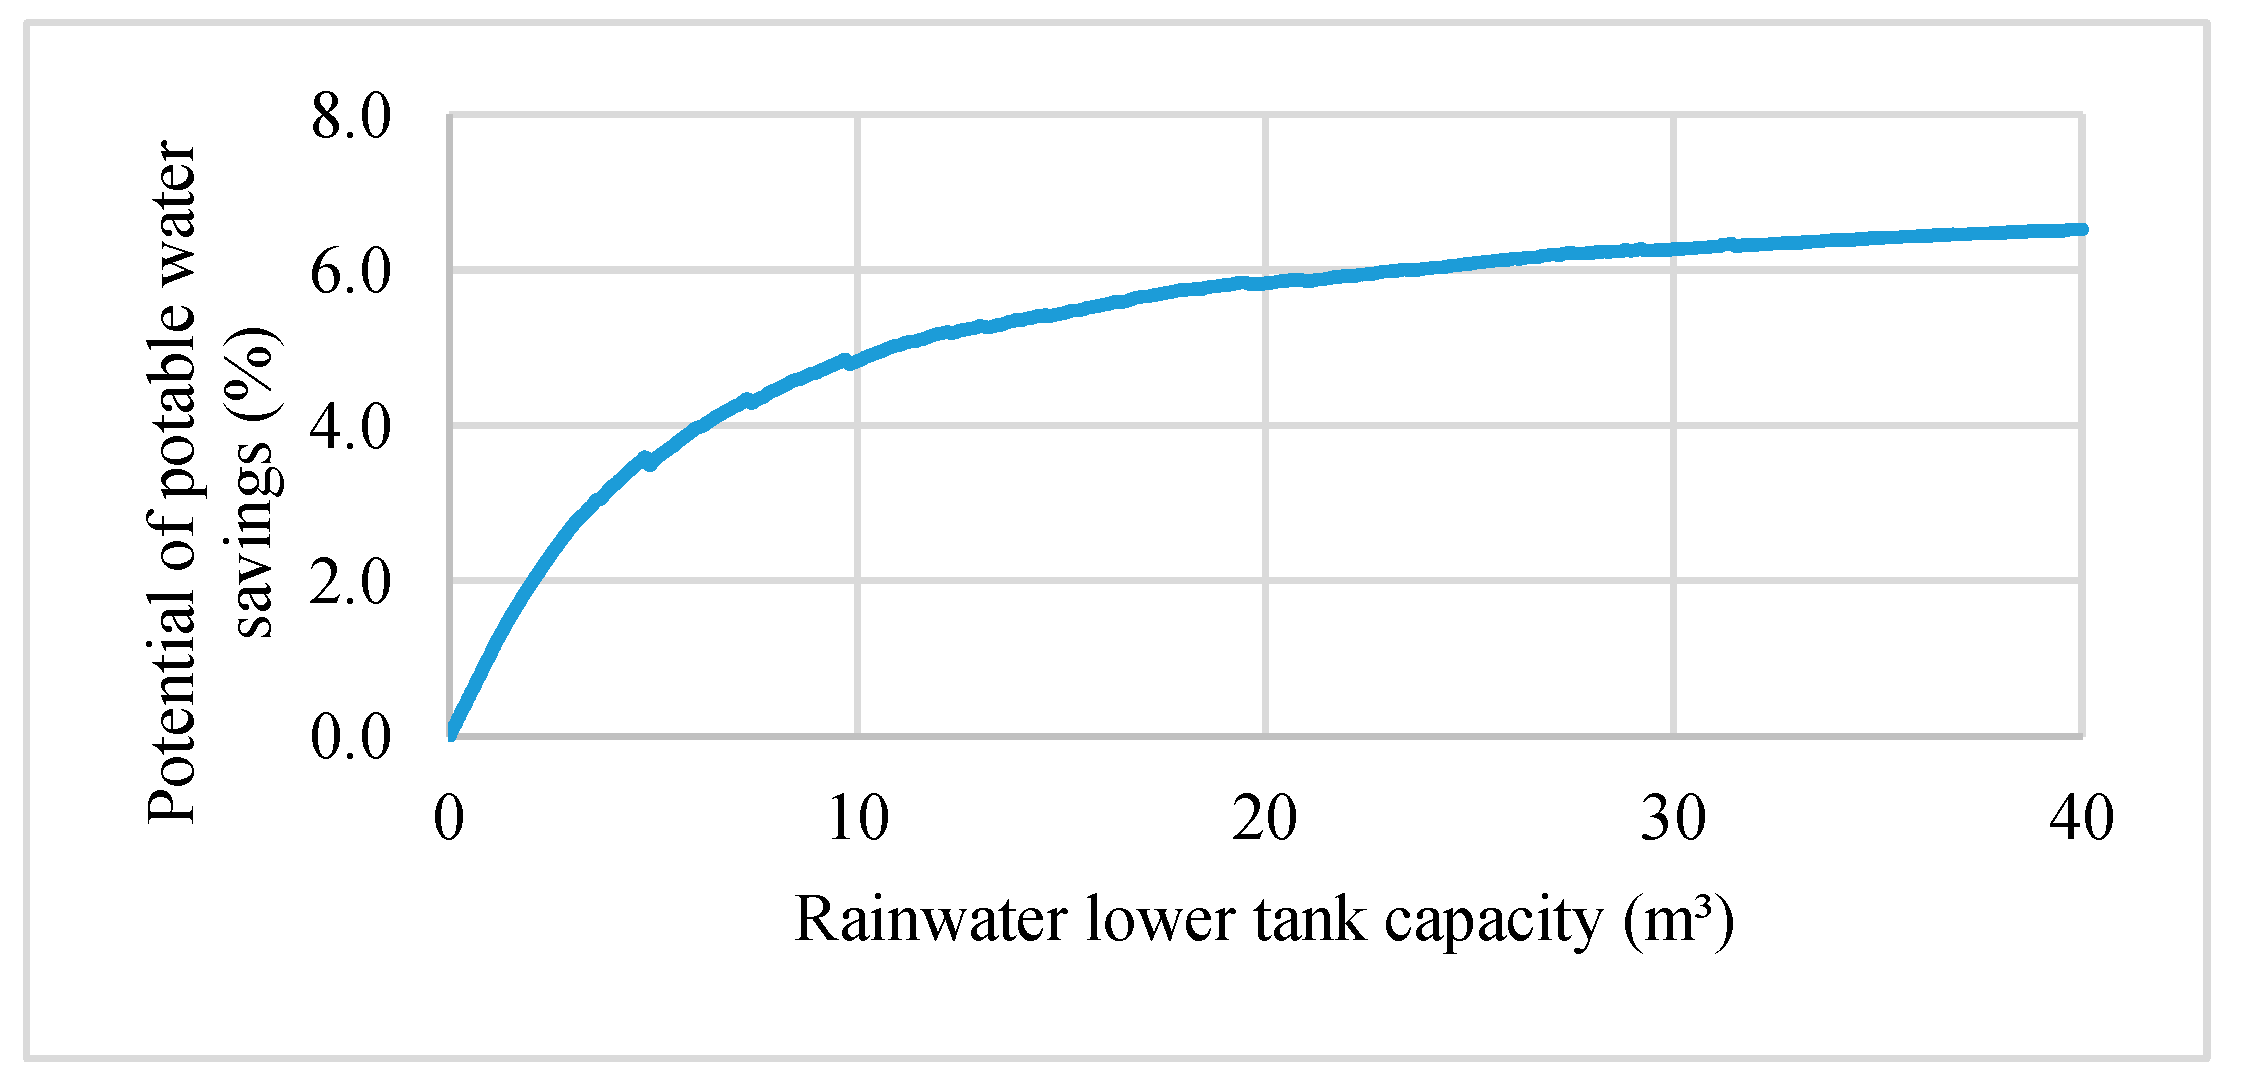
Figure 10 shows the results from Netuno when considering capacities from the rainwater tank currently in use in the building. The potential for potable water savings is approximately 6.15%. Therefore, the rainwater tanks that were constructed in the building were oversized.
3.7. Economic Analysis
The average water consumption—based on the historical series of water consumption in the building—corresponds to 13.9 m
3/month/flat (including the percentage used in toilets).
Table 7 shows other data used in the economic analysis in each of the scenarios. In 2010, the year in which the work of Tomaz [
38] showed an equation for calculating costs of rainwater tanks constructed with reinforced concrete was published, one dollar was equivalent (on average) to 1.76 reais.
Table 8 shows the results found after performing the economic analyses.
According to the economic analysis, all the scenarios are economically feasible. The highest net present value was obtained for the scenario designed to supply all non potable uses in the flats, i.e., laundry tubs, washing machines and toilet flushing. However, payback was higher than the one for the system designed to supply rainwater to toilet flushing only. Among the two scenarios and the current rainwater harvesting system of the building, this last one is the least economically feasible, and this is due to the large rainwater tank capacities used in the building. The best economic feasibility was the one for the scenario that supplies rainwater to toilet flushing only, in which the rainwater tank capacities are smaller than those installed in the building.
3.8. User Satisfaction
Questionnaires were completed in 27 flats but not all the residents of the flats answered them. From all answers collected, 31 were from females (55.4%) and 25 (44.6%) from males. The average age of the sample was 49 years, ranging from 14 to 94 years. On average there were three residents per flat but this ranged from one to five.
The first four questions were related to their habits on full and half toilet flushes.
Table 9 summarises the results associated with such questions. Most of the residents use the half flush and many of them admit that using a single half flush is enough to transport the waste (42.9%). Thus, a higher percentage of not using total flush was expected. Although many participants agreed with this, 82% of the participants stated that they use the full flush. This can occur due to the lack of attention when flushing the toilet, a simple habit of using full flush without concern about the real need for its use or a disregard by users since the water used in the toilets can be rainwater.
The residents were satisfied with the appearance of rainwater used in the toilets. Twelve residents reported having noticed turbidity in the toilet rainwater; most of them stated that this had been caused by incorrect cleaning of the rainwater tank. Regarding the water pressure at the water fixtures, almost all residents were satisfied; only two of them expressed dissatisfaction associated with water pressure.
Table 9 also shows the results related to water appearance and water pressure satisfaction.
Regarding the questions about the rational use of water, 21.4% of participants were unaware of the existence of a rainwater harvesting system in the building and 7.1% of them did not answer this question.
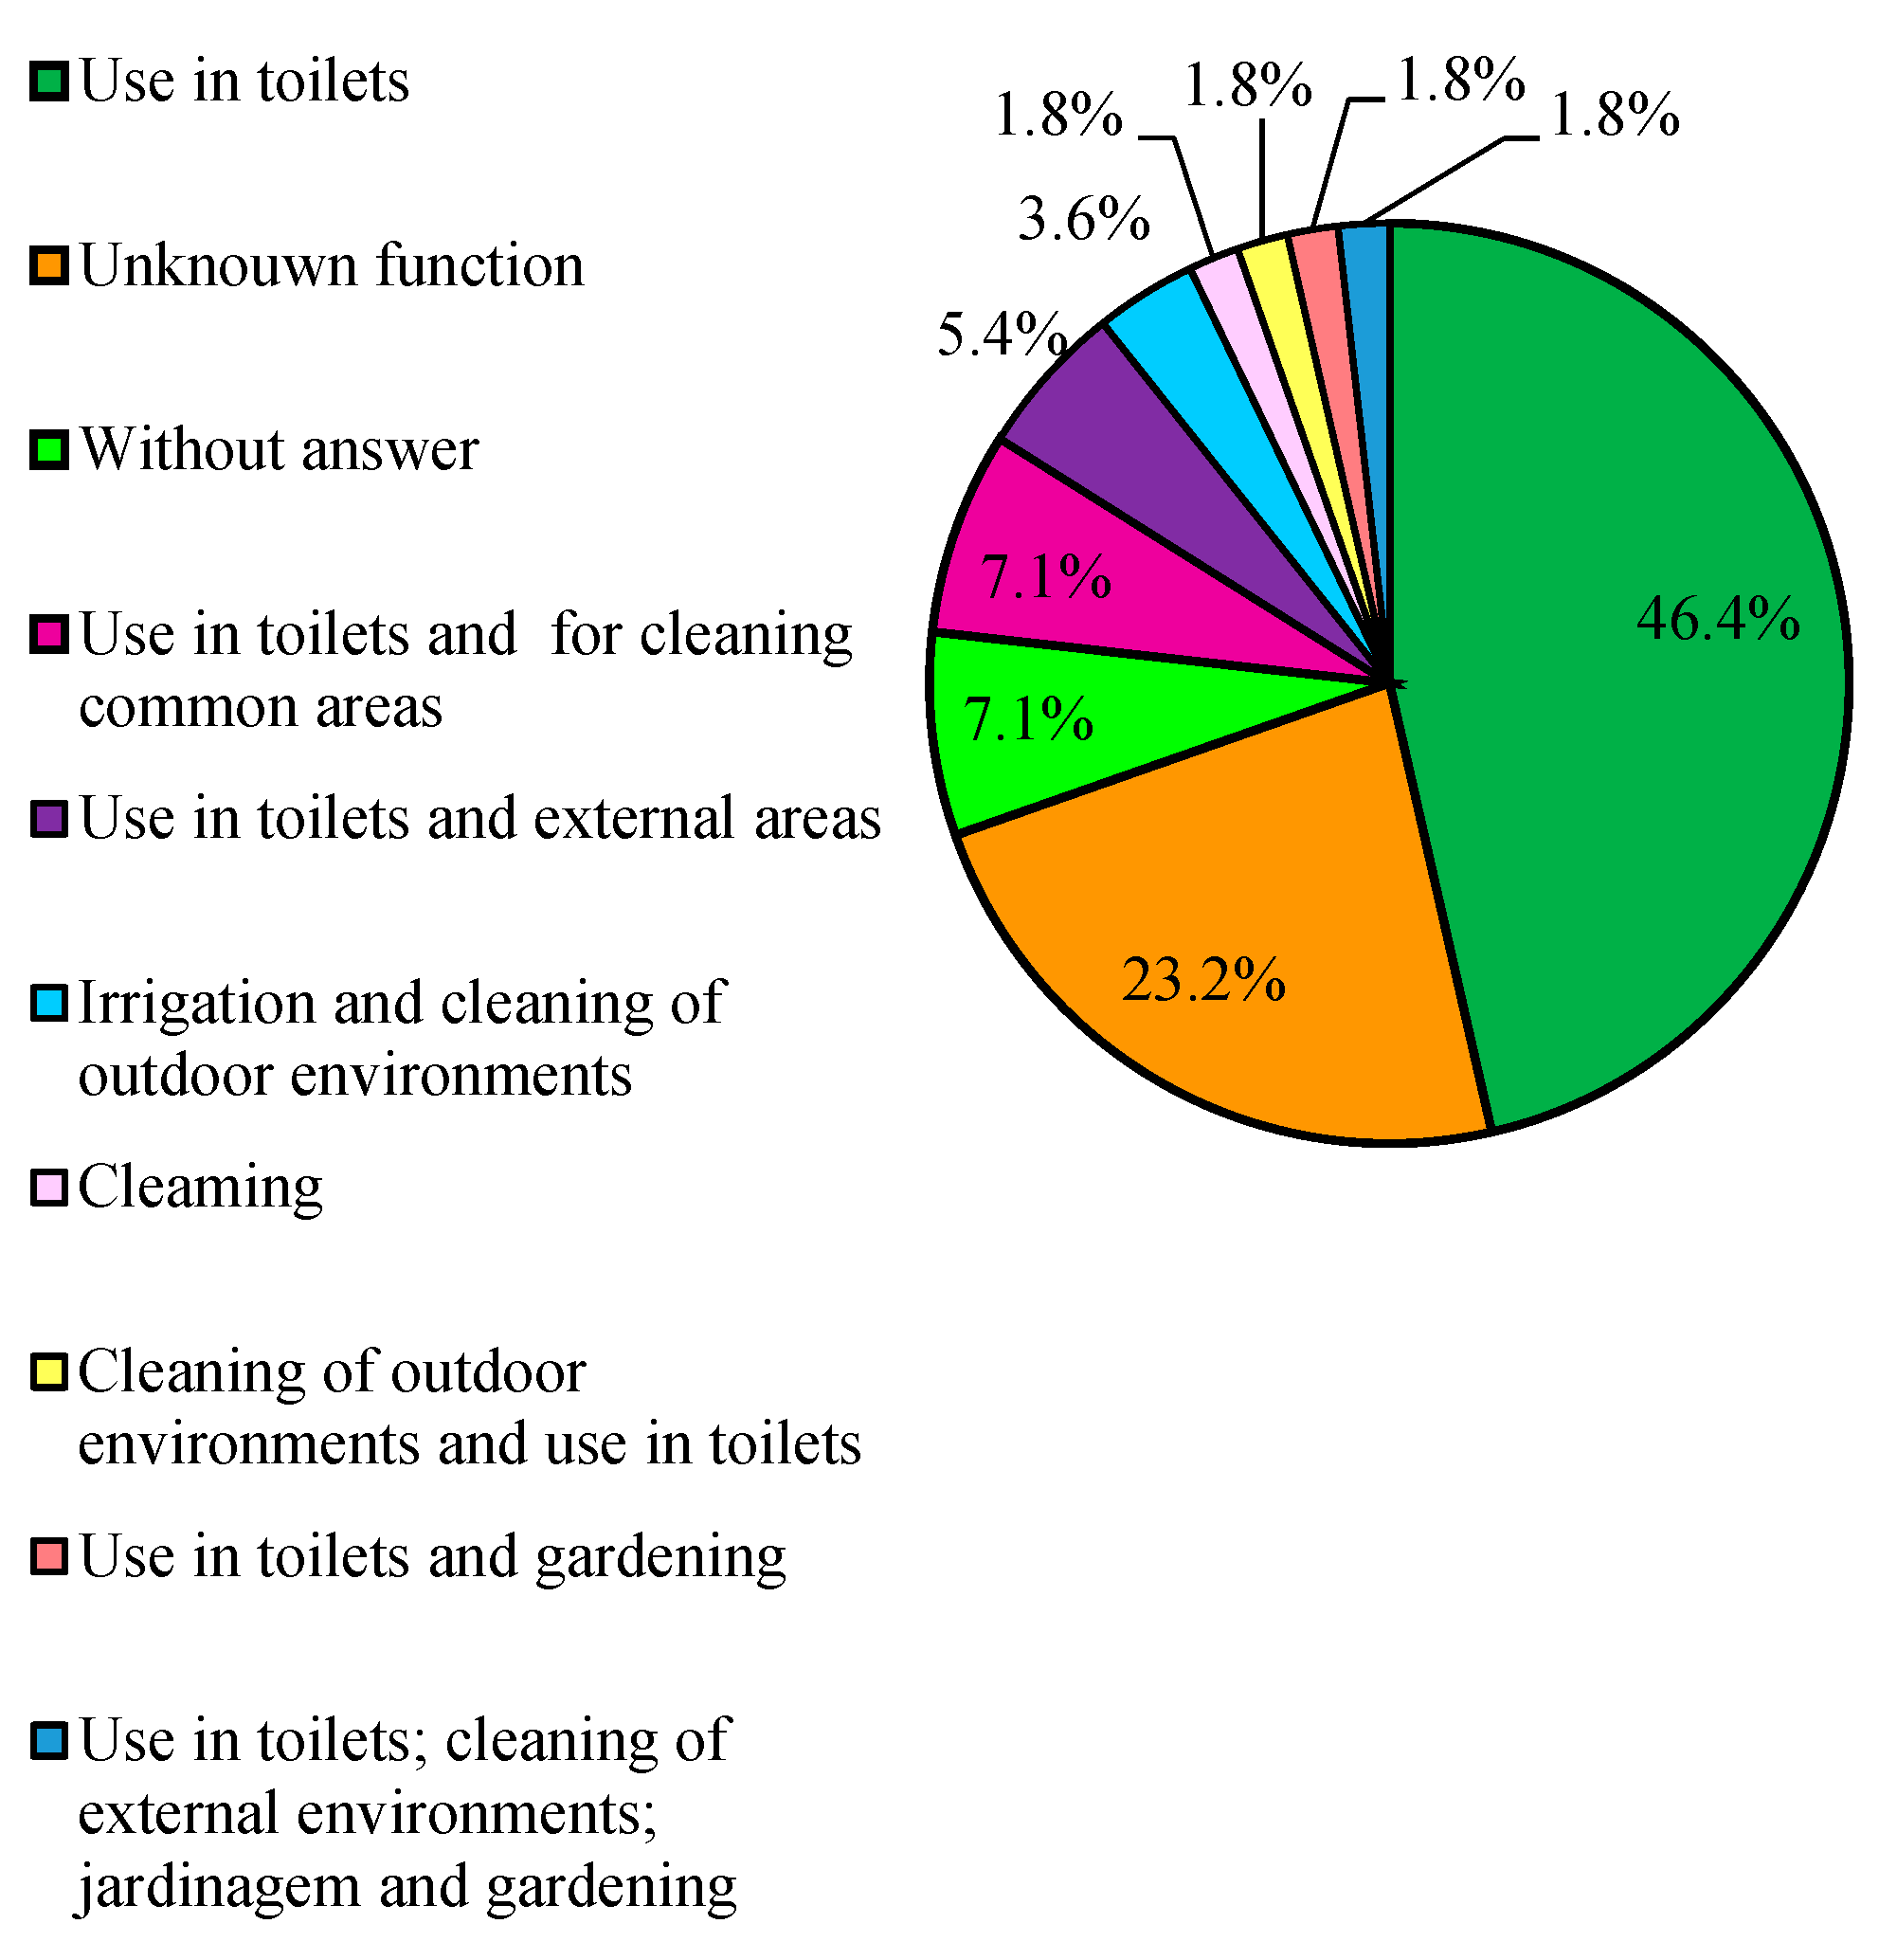
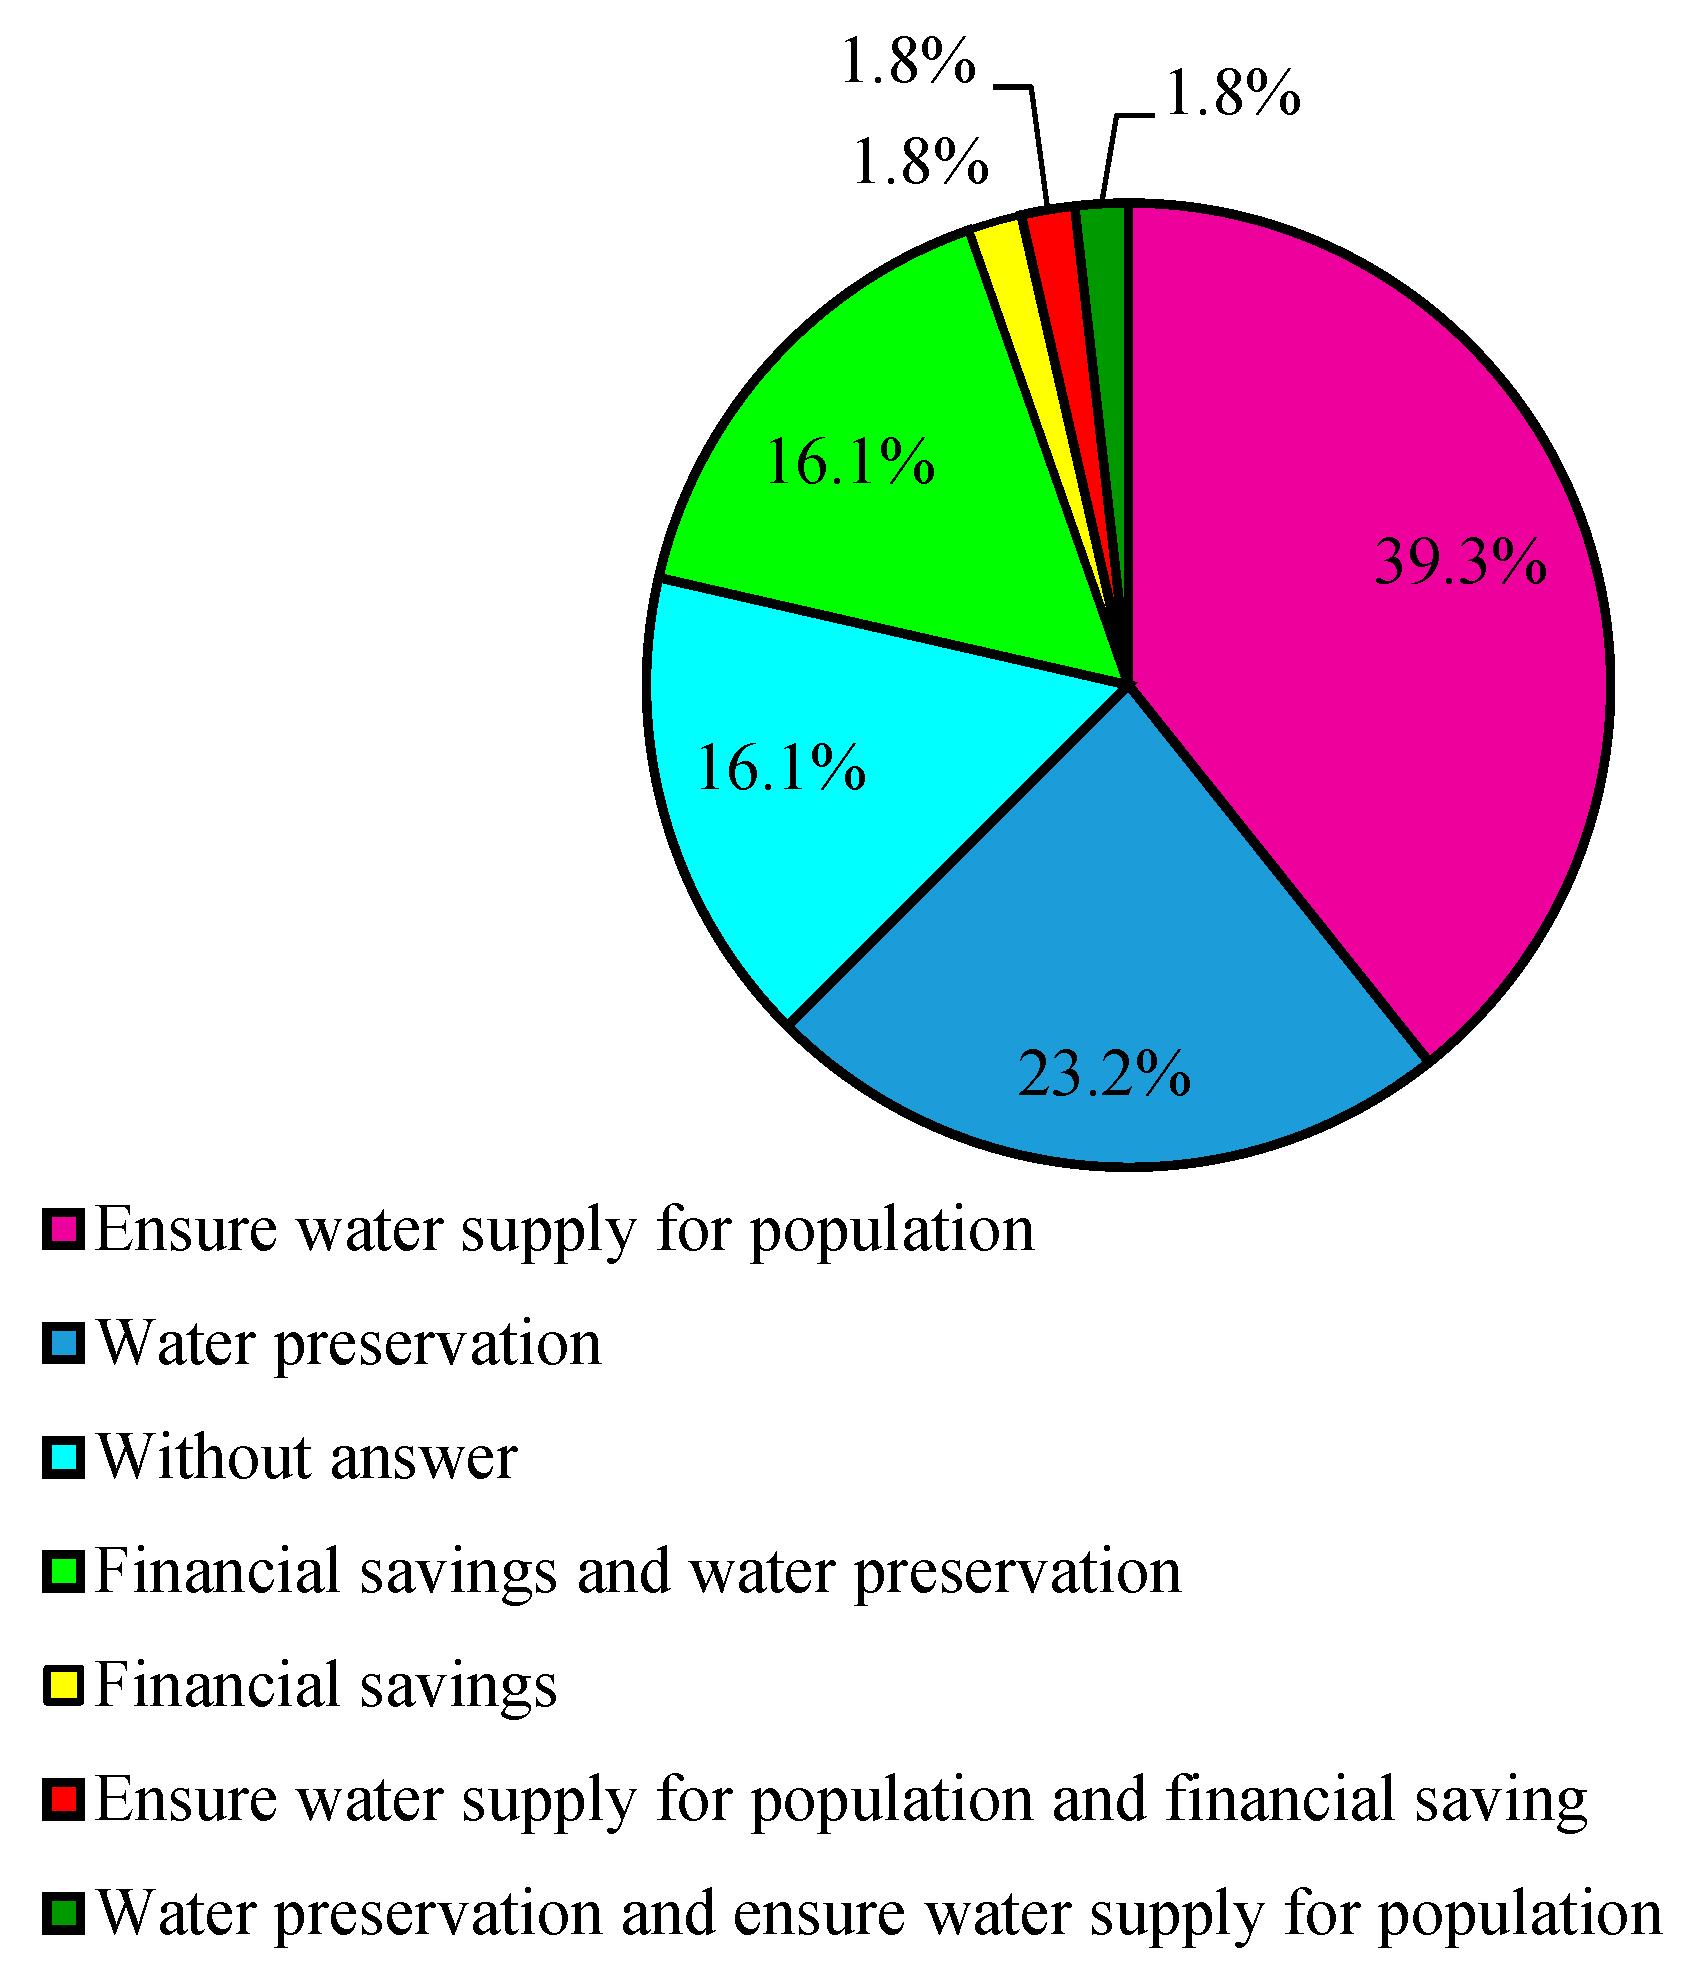
Figure 11 and
Figure 12 show the percentage of answers regarding the function of the rainwater harvesting system and the importance of saving water, respectively.
Almost half of the residents who answered the questionnaire know that the rainwater harvesting system supplies only toilets. In general, residents associate the importance of saving water with the possible scarcity of the resource, making it insufficient to supply the population. However, 20% of residents stated that water savings also represents economic savings in the monthly water bill. All participants understood the importance of saving water, but 6% admitted that they could save more, or that they do not care about saving water. Some residents did not answer if they usually save water (16%). Most participants said they were trying to save it (78%), however, many answers resembled the following statement: “whenever I can, I save water” or “I save water whenever it is possible”. These statements, however, are very vague to define whether the residents are concerned or not about saving water.
4. Discussion
It was observed that daily water consumption per capita (including consumption in toilets) is similar to the consumption of water found in surveys conducted by Willis et al. [
15] in Australian residential buildings and by Loh and Coghlan [
16], who also analysed water consumption in Australian households. In addition, the increasing order of water consumption found in the two surveys is very similar to that found in this work (showers, washing machines, kitchen taps, toilets and washbasin taps). However, in both studies, the percentage of water consumed in the shower is lower (33% in both surveys) than that found in our study (more than 50%). The percentage of water used in the washing machines is slightly higher (21.3%) than the percentage observed in the Australian residential buildings of the research of Willis et al. [
15] (19%) and higher than the percentage of water used in the same type of equipment in the Loh and Coghlan study [
16]. There was also a difference in the use of water in toilets. The research of Willis et al. [
15] showed that water consumption in toilets equals 13% of the total water consumption in residential buildings. The research of Loh and Coghlan [
16] estimated that water consumption used in toilets is 17% of the total water consumption in residential buildings, i.e., higher values than those obtained in our research. The report about rational water use and energy efficiency in social housing [
45] also found that in popular houses, the shower represents the largest share in water consumption.
Regarding the estimation of potable water savings by using rainwater harvesting system, it was verified that the savings obtained in our work are considerably lower than several surveys conducted not only in Florianópolis but also in other regions of Brazil [
5,
6,
7,
8,
11]. One of the reasons why this discrepancy was observed may be associated with the small size of the catchment area in relation to the demand required to meet the non potable uses of flats.
Some authors [
22,
23] agree that the implementation of a rainwater harvesting system is only economically feasible when there is high daily water consumption per capita. However, the economic analyses performed in this research, for different potentials of potable water savings, confirmed the economic feasibility of the system implementation even if the average daily consumption per capita is not that high.
The building where this research was conducted is considered to be a high standard one, since the construction company values the quality of buildings using high quality materials, optimized construction processes and continuous improvement (certified by ISO 9001 (International Organization for Standardization)). Even so, it is important that research be performed to investigate the behaviour of users in these buildings in order to verify whether a certain constructive solution, especially in the area of sustainability, is well used. The analysis about the answers on the habits related to the use of the toilet flushes revealed that the majority of residents use the half flush and most of them answered that a single half flush is sufficient to transport the solid waste. In general, the residents of the building are satisfied with the pressure and appearance of water used in toilets, which demonstrates satisfaction with the rainwater harvesting system performance. Most residents did not notice signs of turbidity. On issues related to water savings, all residents are aware of this importance and many of them affirm that they save water whenever it is possible.
During the research some limitations were assumed. One of them corresponds to the number of flats participating in the survey. Although the building consists of 56 flats, only 26 households agreed to participate in the experiment. Even with 26 data resulting from water consumption monitoring in the flats, some were excluded from the analysis due to their high consumption differences. Other limitations were: the impossibility of making measurements of water end-uses, being necessary the monitoring questionnaire application; impossibility to conduct monitoring for one week in each flat, which could produce more stringent results regarding the water consumption routine in the flats (the probability of using equipment with higher water consumption, such as washing machine and dishwasher would increase); use of average flow rate values for taps and showers of flats, rather than real values, measured on site; the water consumption in the toilets was considered to be real (without comparing it with the measured water consumption, since there was no measurement of such water consumption); no life-cycle analyses were conducted associated with the components of the rainwater harvesting system.
Although the study was applied to a multi-storey residential building in Brazil, the results described can be applied to multi-storey residential buildings with similar characteristics, in addition to residents with similar socioeconomic status.
5. Conclusions
The current rainwater tanks used in the building were oversized, which resulted in unnecessary costs and greater payback period. The upper rainwater tank could have a capacity close to the daily average rainwater demand. The capacity of the lower rainwater tank could be closer to 20.0 m3 (in the case of using rainwater to supply toilets, washing machines and laundry tubs) or 16.0 m3 (in the case of using rainwater to supply only toilets). The highest potential for potable water savings among the scenarios simulated was 6.50% for a lower tank capacity equal to 20.0 m3.
Data from satisfaction analysis for the water used in toilets showed good acceptance by residents. Results may indicate that visual water quality parameters are not essential for water to be used for nonpotable purposes.
The results show that the implementation of rainwater harvesting systems in multi-storey residential buildings is an economically feasible alternative that satisfies users between middle and upper socioeconomic classes in Florianópolis. The most feasible scenario is the one which is adequately sized to supply only toilets. It should be noted that the most economically feasible alternative will not always be the one that uses rainwater to supply larger amounts of water appliances. The implementation of rainwater harvesting systems may be a marketing strategy for construction companies to expand the sale of residential buildings that promote more rational use of water. On the other hand, it is suggested to construction companies to provide rainwater meters for each flat so that residents can be more aware about the amount of rainwater being used and the amount of potable water required to supply the water appliances when rainwater is not available. This can make residents value the water resources more, avoiding waste.
Some factors, however, do not support the decision to implement the rainwater harvesting system in buildings located in Florianópolis. One of them is the system of charging the water tariff in the municipality. The local water company establishes a fixed (minimum) rate of water for monthly consumption up to 10 m3. Buildings whose monthly water consumption is less than 10 m3 pay the fixed rate and, therefore, the implementation of rainwater harvesting systems in these buildings would not provide economic savings. In addition, it is not very attractive for construction companies to install this type of system, since it raises the cost of the enterprise and does not provide direct benefit to the companies. In order for rainwater harvesting systems to be more widespread, there is a need to change the mentality of many consumers, change the method of water tariff charging (especially in buildings where consumption is low) and create public policies that encourage the use and installation of rainwater harvesting systems.


