1. Introduction
Taiwan is located at the boundary of the Eurasian Plate and the Philippine Plate and is characterized by a landscape dominated by mountains. The island has a West Pacific subtropical climate. The active geological effects on the island, i.e., the yearly spring and summer monsoons and multiple typhoons in summer and autumn, are characteristics that dispose Taiwan to a high risk of landslides [
1,
2]. Landslides are a key influence on ground surface morphology and surface erosion [
3,
4]. Various types of landslides also cause enormous loss of life and property [
5]. Mountain communities in Taiwan are mostly located in remote areas, therefore, evacuation efforts before a disaster occurs are time-consuming and labor-intensive. These communities become isolated during disasters because of inaccessibility, which impedes inward- and outward-bound transportation. Hence, considerable effort must be investigated to survey disaster-prone environments around mountain areas to fully prepare these areas for disaster events under complex and extreme climates and geological conditions. To address these potential threats, numerous protective software and hardware facilities have been made available for disaster prevention operations or projects. However, an effective contingency plan relies on an understanding of the place of interest. Research on landslide monitoring and simulation is therefore both necessary and important for safeguarding mountain communities. Landslides usually present many different difficulties in performing slope stability and run-out analysis. Advanced numerical techniques for landslide prediction [
6,
7], simulation [
8,
9], post-failure, and run-out [
10,
11,
12] play important roles in the completeness of the landslide process.
The 2014 Oso mudslide in the United States highlighted the severity of major landslides, presenting a typical example of circular arc failure. In Taiwan, statistical analysis is generally used as the research method for forecasting slope disasters (landslides or mudslides). Landslide disasters make up one of the most complex physical processes in nature. Numerous important methods have been developed to assess potential landslides, which are mainly divided into three categories, namely, deterministic, statistical, and physical models. The deterministic methods are easy to implement but involve a subjective definition of the weights of each landslide factor. The physical methods generally provide accurate results, but detailed parameters and in situ observed data are necessary [
13]. A statistical mode of analysis involves collecting historical data on disaster events in a region, choosing appropriate statistical analysis methods, and then analyzing and organizing these data to propose a reference for early warning of similar events in the future [
14,
15,
16,
17]. Statistical analysis is commonly applied in empirical equations to estimate precipitation thresholds or landslide size. Because the statistical mode of analysis lacks consideration for the physical and mechanical aspects of the object of analysis, it cannot predict the actual location of a disaster. However, the simplicity of the equations and processes used in the analysis still makes it one of the mainstream approaches for landslide disaster assessment. The mechanism of a landslide event has long been a topic of interest in landslide-related research. Mechanical analysis of landslides can identify the mechanism by which a landslide occurs by analyzing shear stress at the most probable slope failure surface and the shear strength of soil [
18,
19]. This task is difficult to perform because earth materials are mostly heterogenous and isotropic, the parameters to be analyzed are difficult to acquire, and the effects of surface flow and subsurface flow further complicate problems.
A physical model enables analysis of basic regional information and the results of in situ surveys and monitoring, which are done to assess the location, range, mass, and direction of areas with high landslide potential, thereby providing further insight into the landslide characteristics of the study area. In this study, the physical model of a landslide was developed using the United States Geological Survey (USGS) Scoops3D slope stability model [
20], which employs the three-dimensional (3D) column limit-equilibrium and digital elevation model (DEM) techniques to perform 3D slope stability analysis. Scoops3D assesses the stability of a rotational, spherical slip surface encompassing many DEM cells, providing the least-stable potential landslide for each DEM cell in the landscape alongside the associated volumes and areas. Scoops3D provides two well-known geotechnical moment equilibrium methods (the Ordinary method and Bishop’s simplified method) to compute the stability of a rotational trial surface. DEM has been extensively applied in one-dimensional [
21,
22] and two-dimensional [
23,
24] stability analysis. Furthermore, 1D or 2D slope stability analysis of homogenous slopes generally produces more conservative results than 3D analysis does, making it extremely useful in engineering designs. However, slope failure in real life is 3D in nature; thus, using 3D methods to analyze slope failure likely yields more accurate results and is more suitable for scientific exploration of real-life slope failure or inverse calculations of slope failure parameters [
20].
In this paper, we prevalently pay attention to the landslide disaster assessment and modeling. The purpose of this study was to develop a high-precision and high-performance landslide disaster assessment model, providing valuable information for landslide disaster management to assess landslide potential and an estimate of the landslide’s size. The study area was the Antong hot spring area in Hualien, Taiwan, where multiple instances of landslides have been reported over the years. According to in situ survey results, landslides in these areas are caused by circular arc sliding failure. Therefore, the Scoops3D slope stability analysis program was used to analyze and assess the potential risk and mass of landslides in the study area. The landslide mass analysis results were subsequently compared with the results calculated using the empirical equations of the statistical model, and their differences are discussed. Relevant results could be used as references for early warning of landslide disasters.
2. Description of the Study Area
Antong hot spring was selected to investigate the applicability of the proposed model.
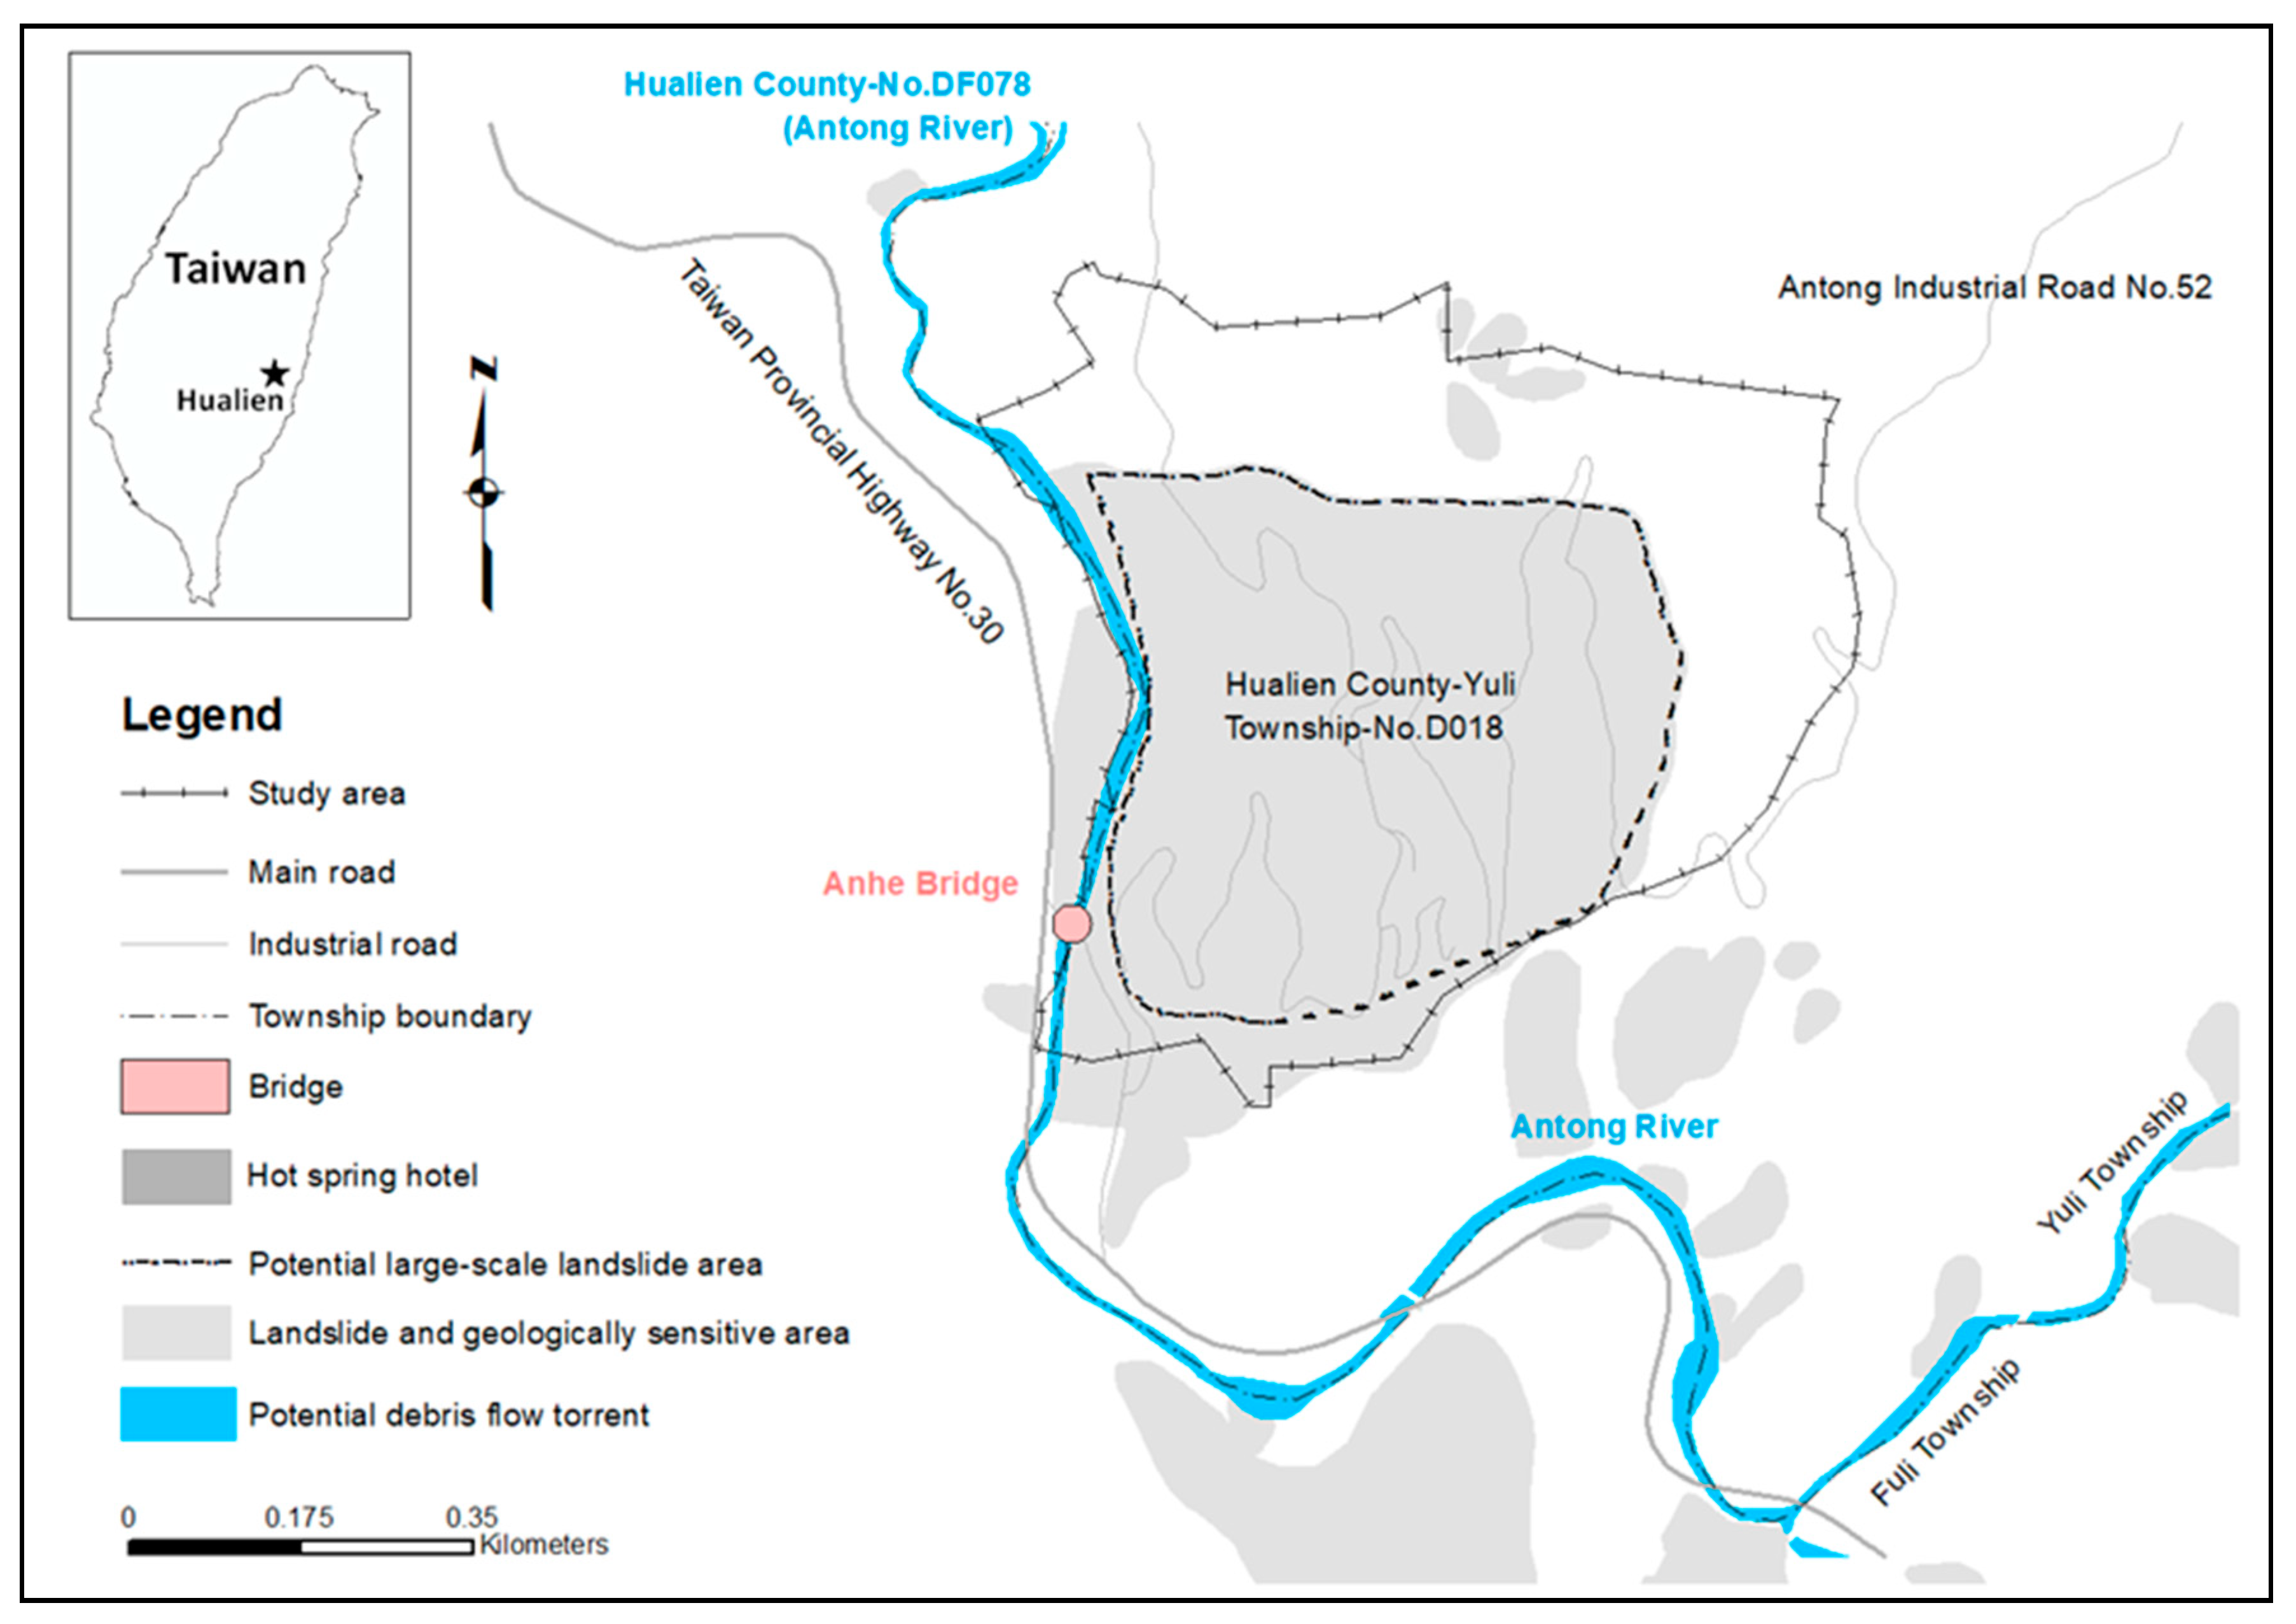
Figure 1 shows the location and type of potential disaster in the study area. The study area was the slope on the right side of the Antong River in Yuli Township of Hualien County, where hot spring businesses make up the majority of community activities. The study area is part of the drainage basin of the Antong River, which is a tributary of the Xiuguluan River and connects mainly to Yuli–Changbin Provincial Highway 30. The scope of this research was the slope to the east of Anhe Bridge on Provincial Highway 30. The study area was roughly 0.498 km
2 in area. The targets to be protected from landslide disasters were the hot spring hotels, orchards, tea plantations, and Antong Industrial Road No. 52.
Figure 1 is an overlay of potential disasters around the study area and shows that the Antong River flows by the toe of the slope in the study area. The Antong River is also labeled as Hualien County DF078 by the Soil and Water Conservation Bureau (SWCB) in Taiwan and is potentially prone to mudslide disasters. Clear sliding cliff-shaped topography has been observed in the area, suggesting the occurrence of major landslides in the past. The study area also consists of a potential large-scale landslide area designated by Central Geological Survey (CGS) in Taiwan as Hualien County–Yuli Township–No. D018, approximately 22.5° steep; six residential households would potentially be affected by landslides. Consequently, the study area has a high potential for landslides according to image interpretation and onsite surveys [
25]. In August 2016, the area was designated as a landslide-prone area. In terms of type of potential disasters, the study area is susceptible to common geological disasters, such as mudslides and landslides.
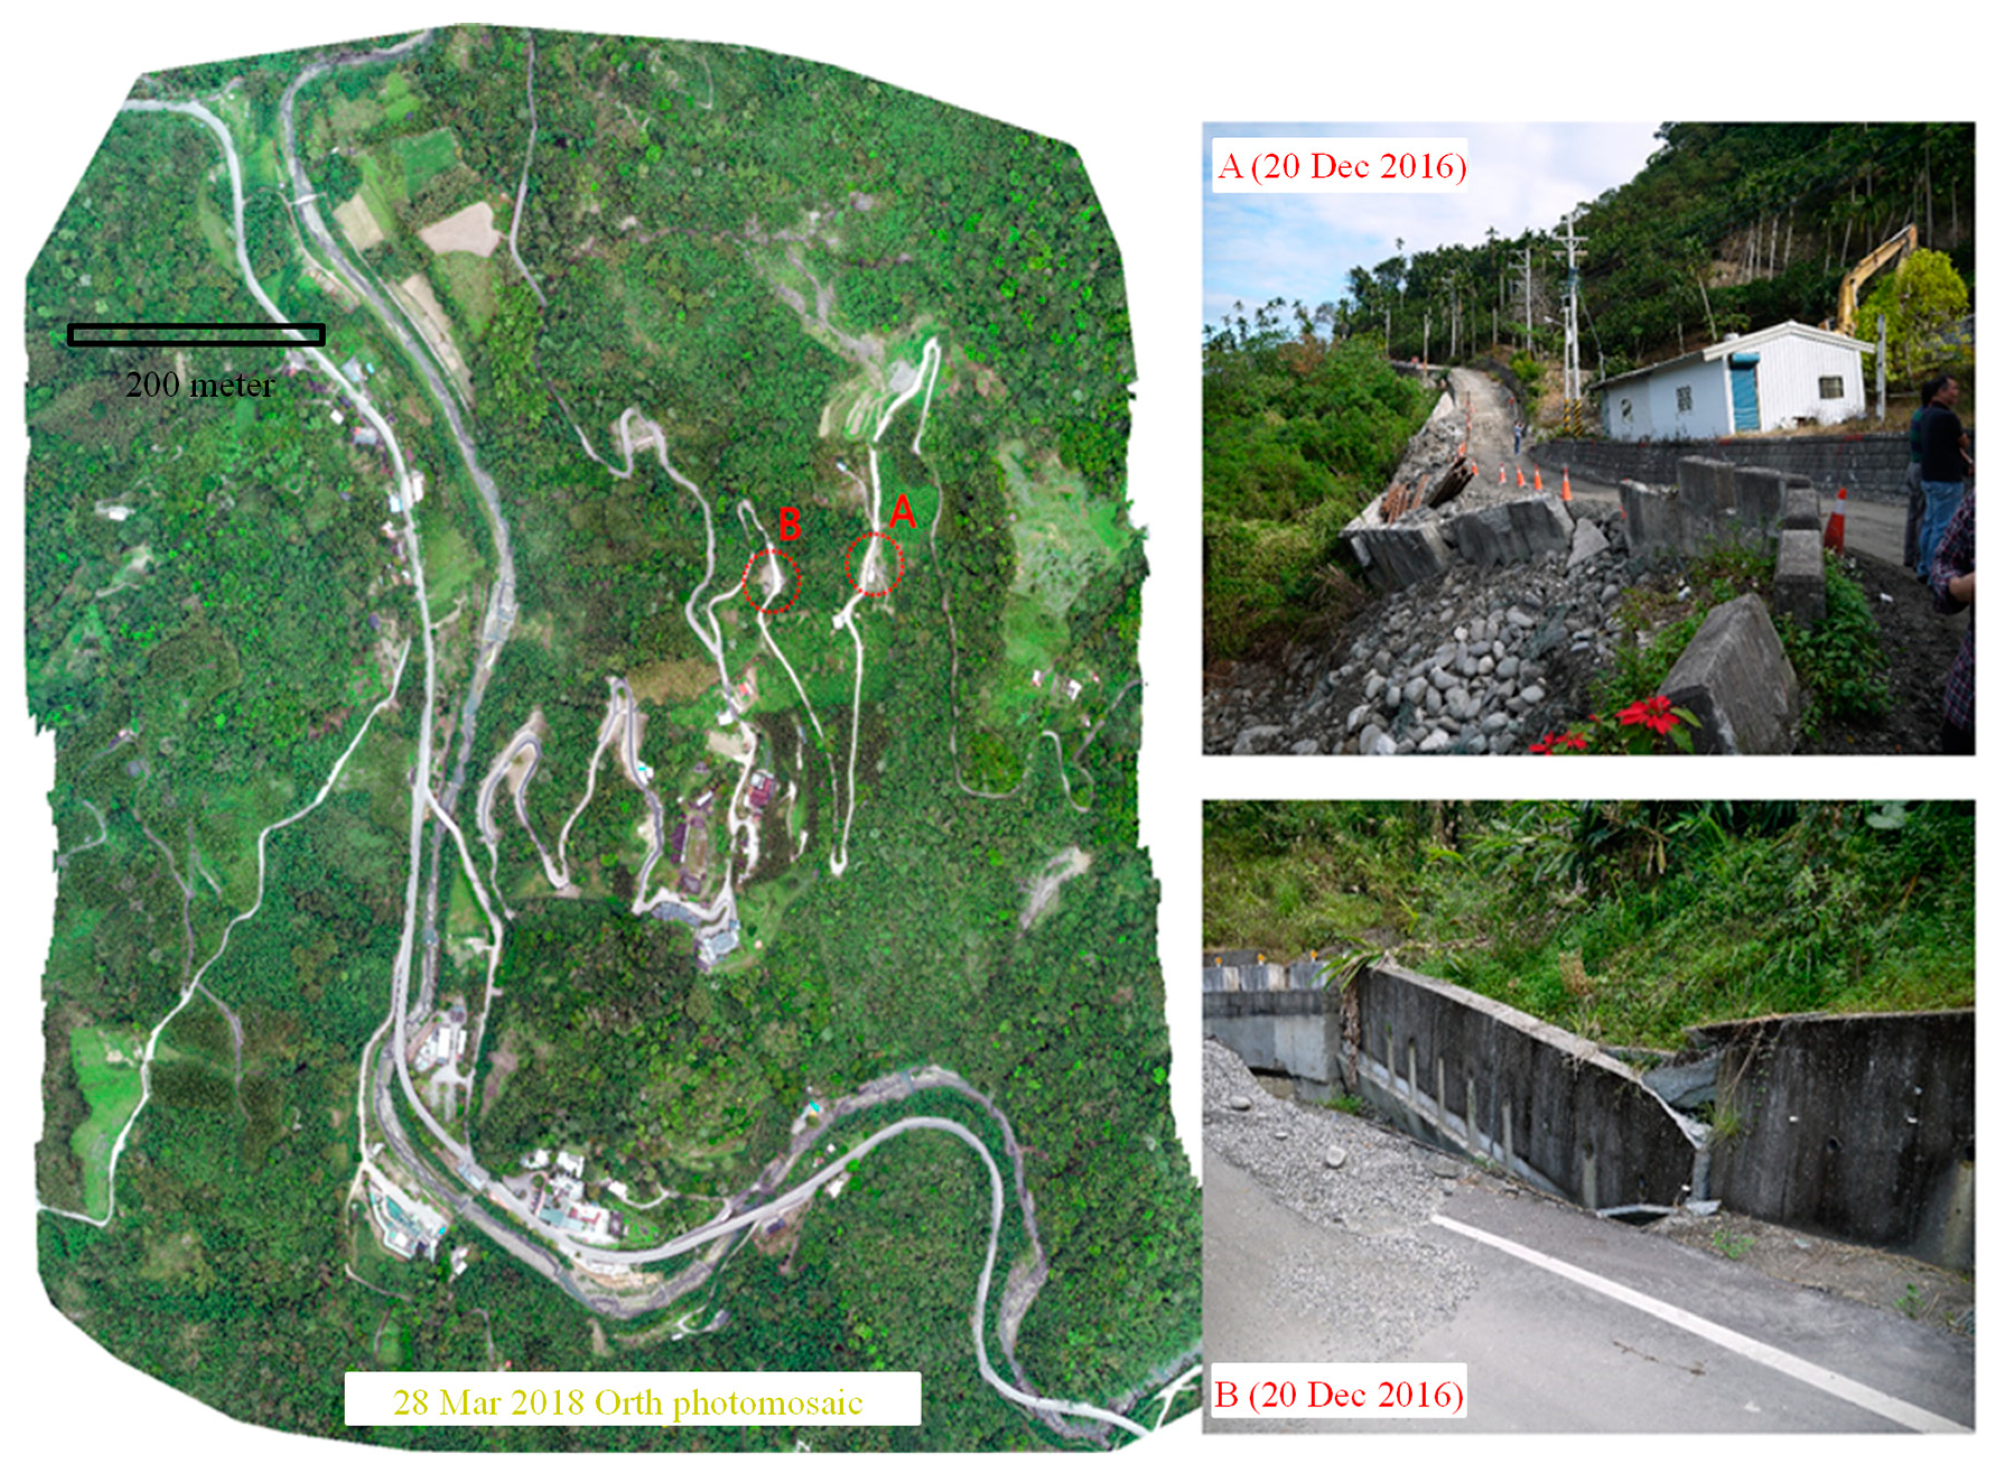
According to the disaster history, landslides have struck the study area over the years, including small-scale landslides during Typhoon Bilis in 2000, local landslides during Typhoon Toraji in 2001, and various other disasters, such as subsidence, mudslide, collapse of a retaining wall, and deposition of landslide debris in Antong River. As shown in
Figure 2, Typhoon Aere in October 2016 brought severe landslides to the area, causing the road downslope to collapse by 0.012 km
2 and approximately 50 m of the road to sink downward, resulting in a ground displacement of 0.5–1.0 m. The ground on which residential properties were situated cracked because the rock mass collapsed. Slipping of a retaining wall on the upward slope of the road by 0.8–1.0 m was also reported.
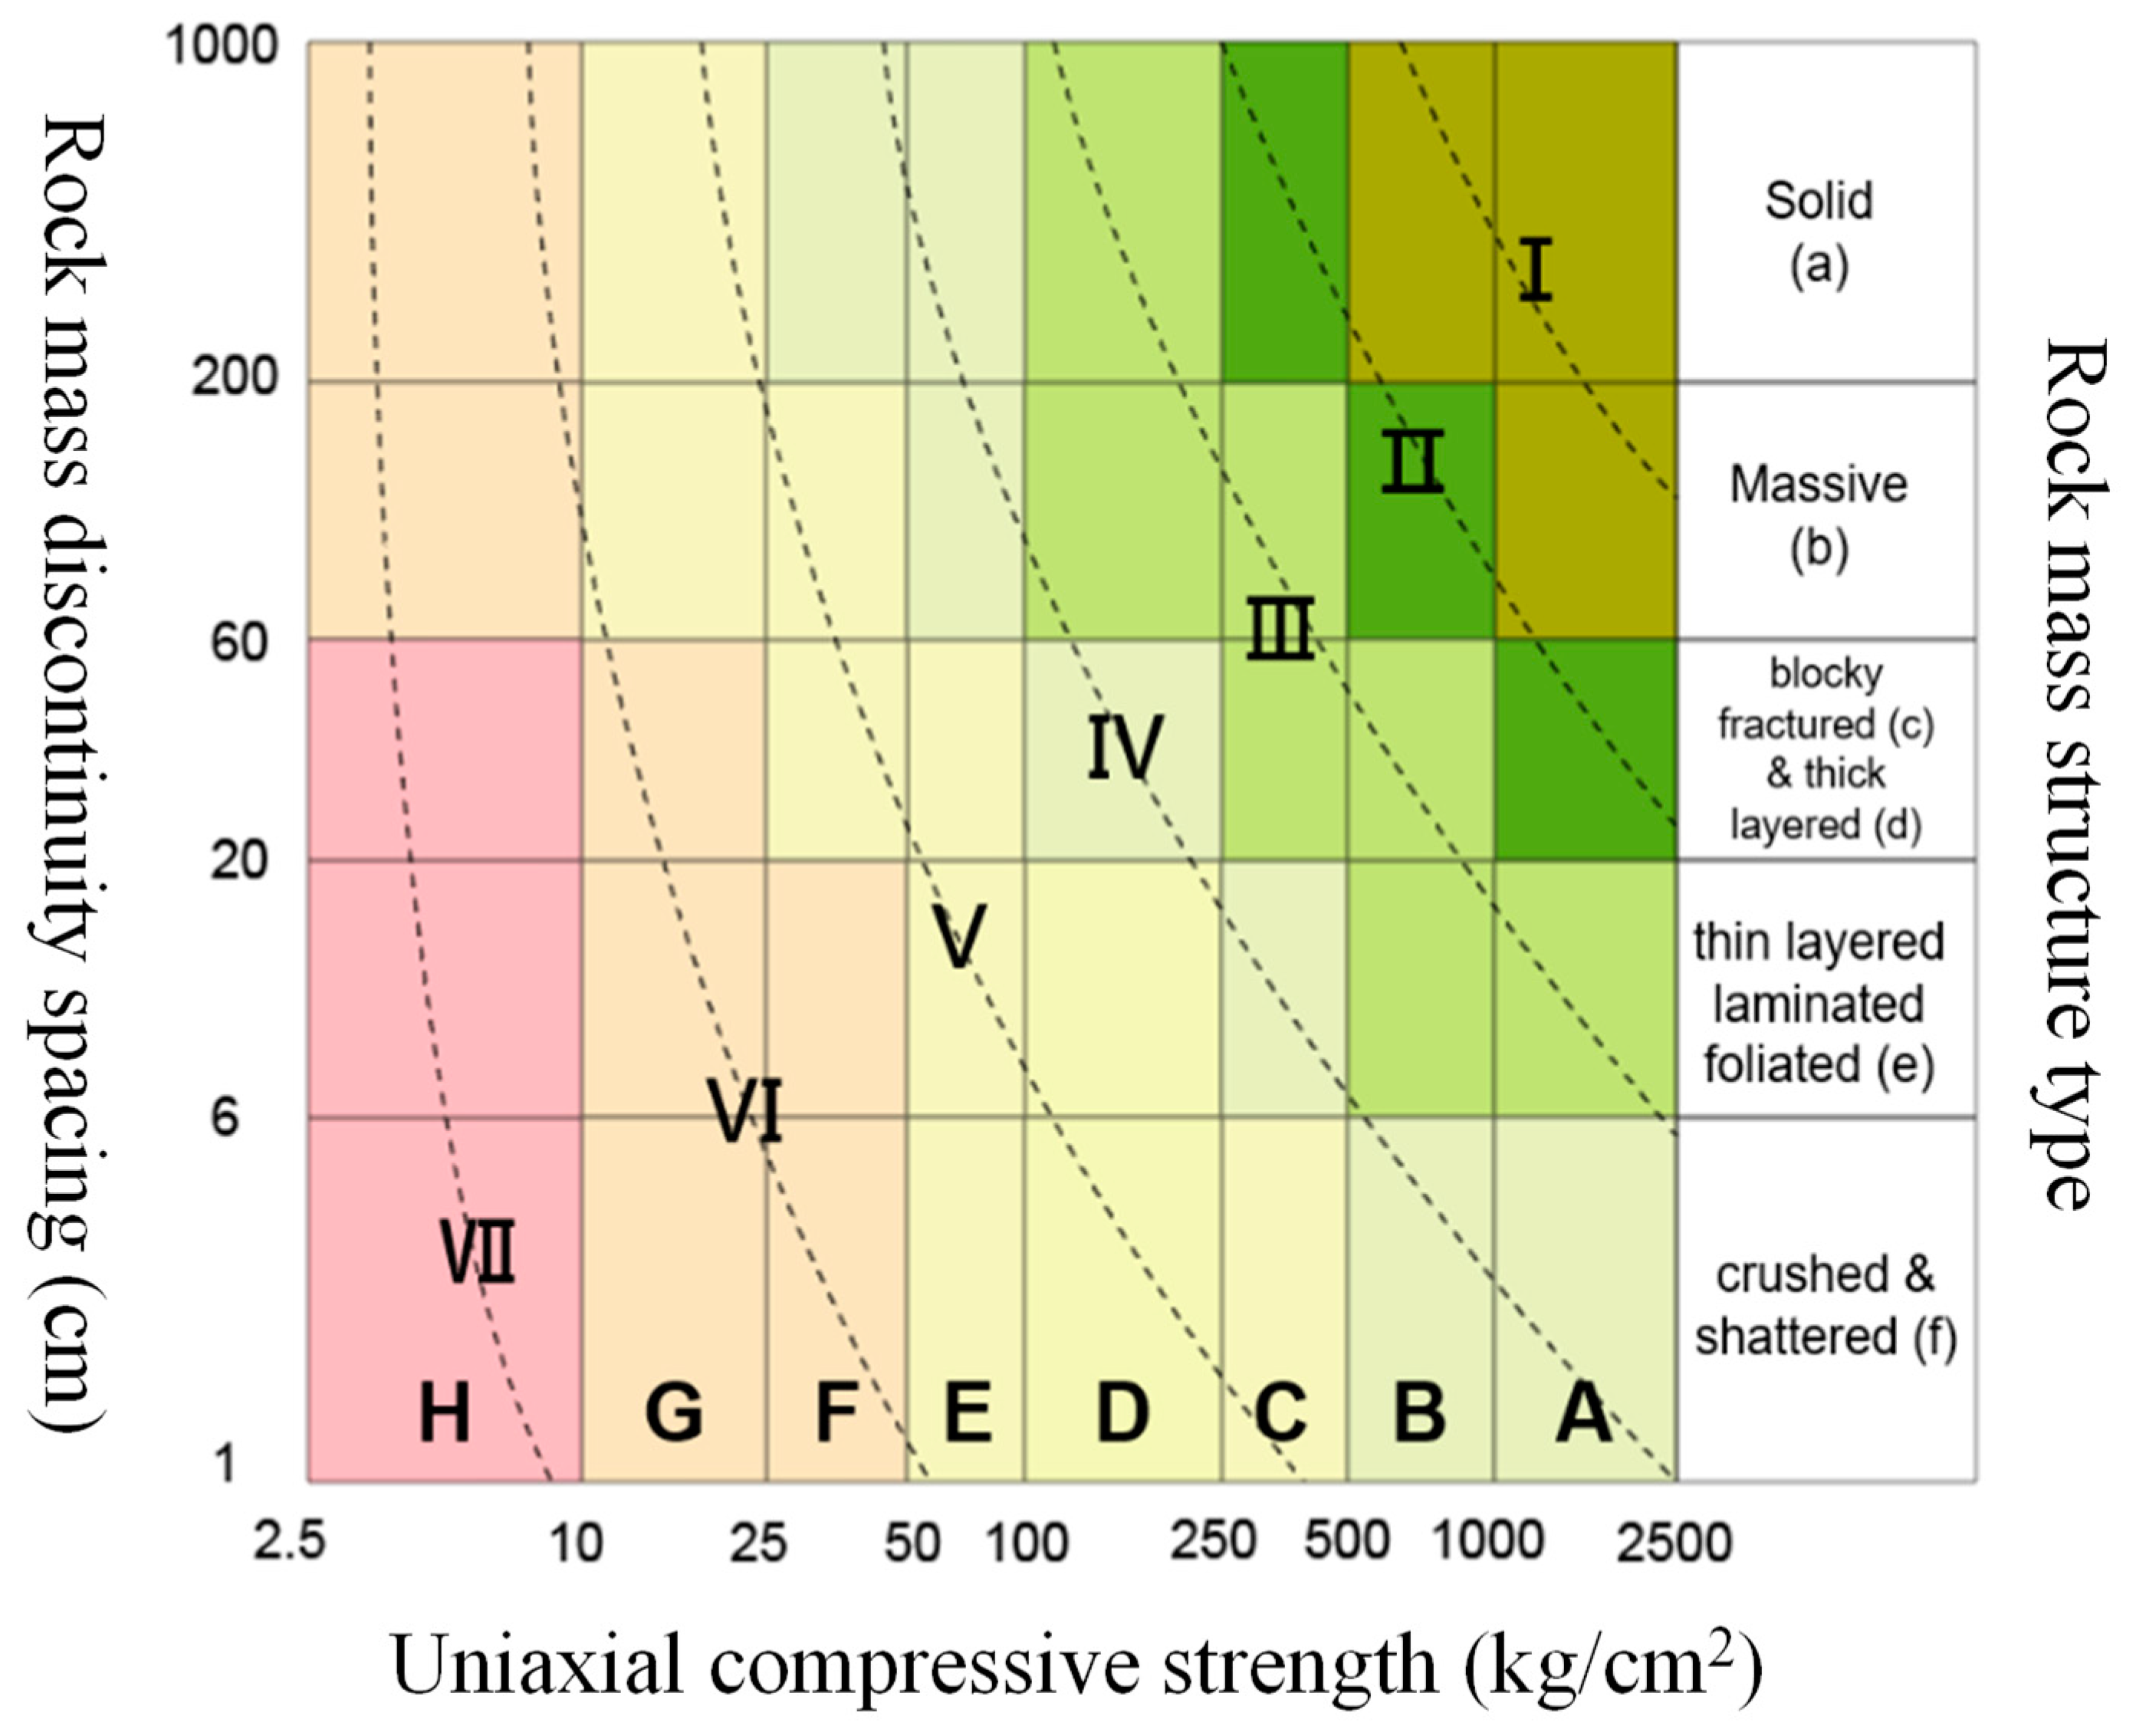
Regarding geology and rock characterization, the characterization of rocks in Antong shows that huge pieces of igneous rocks were sandwiched between young layers of deep-sea sedimentary rocks to form a mélange of rock layers due to frequent earthquake activities in the area. The geological diagram in
Figure 3 shows that the study area is characterized by the Paliwan formation, which is composed of conglomerate, mudstone, and interbedded sandstone and shale. A Yuli map report published by the CGS revealed that the formation, consisting of interbedded sandstone and mudstone, exhibits a thin stratum structure with a strength of 5–10 MPa, which is considered a Class V rock according to a modified [
26] rock mass strength–size classification diagram, as shown in
Figure 4. Class V rocks are characterized by well-developed masses of weak rocks and thin interbedded rocks, poor bonding force between layers, anisotropic rocks, and weak strength as a whole [
27]. According to in situ survey results, weathered andesite rocks that were greyish in color were found along the zigzag road stretching across the study area. These rocks shatter when peeled off by hand. Weathered andesite rocks are homogenous and soft geologic materials. After a deluge of rainfall penetrates the side slope of a main body, the slope forms a circular arc-shaped slide. The type of landslide that occurs in the study area is a circular arc-shaped slide, primarily because the weathering of bedrocks and the presence of hot springs in the study area caused wide cracks to form in the rock masses, thereby softening and weakening the rocks [
28].
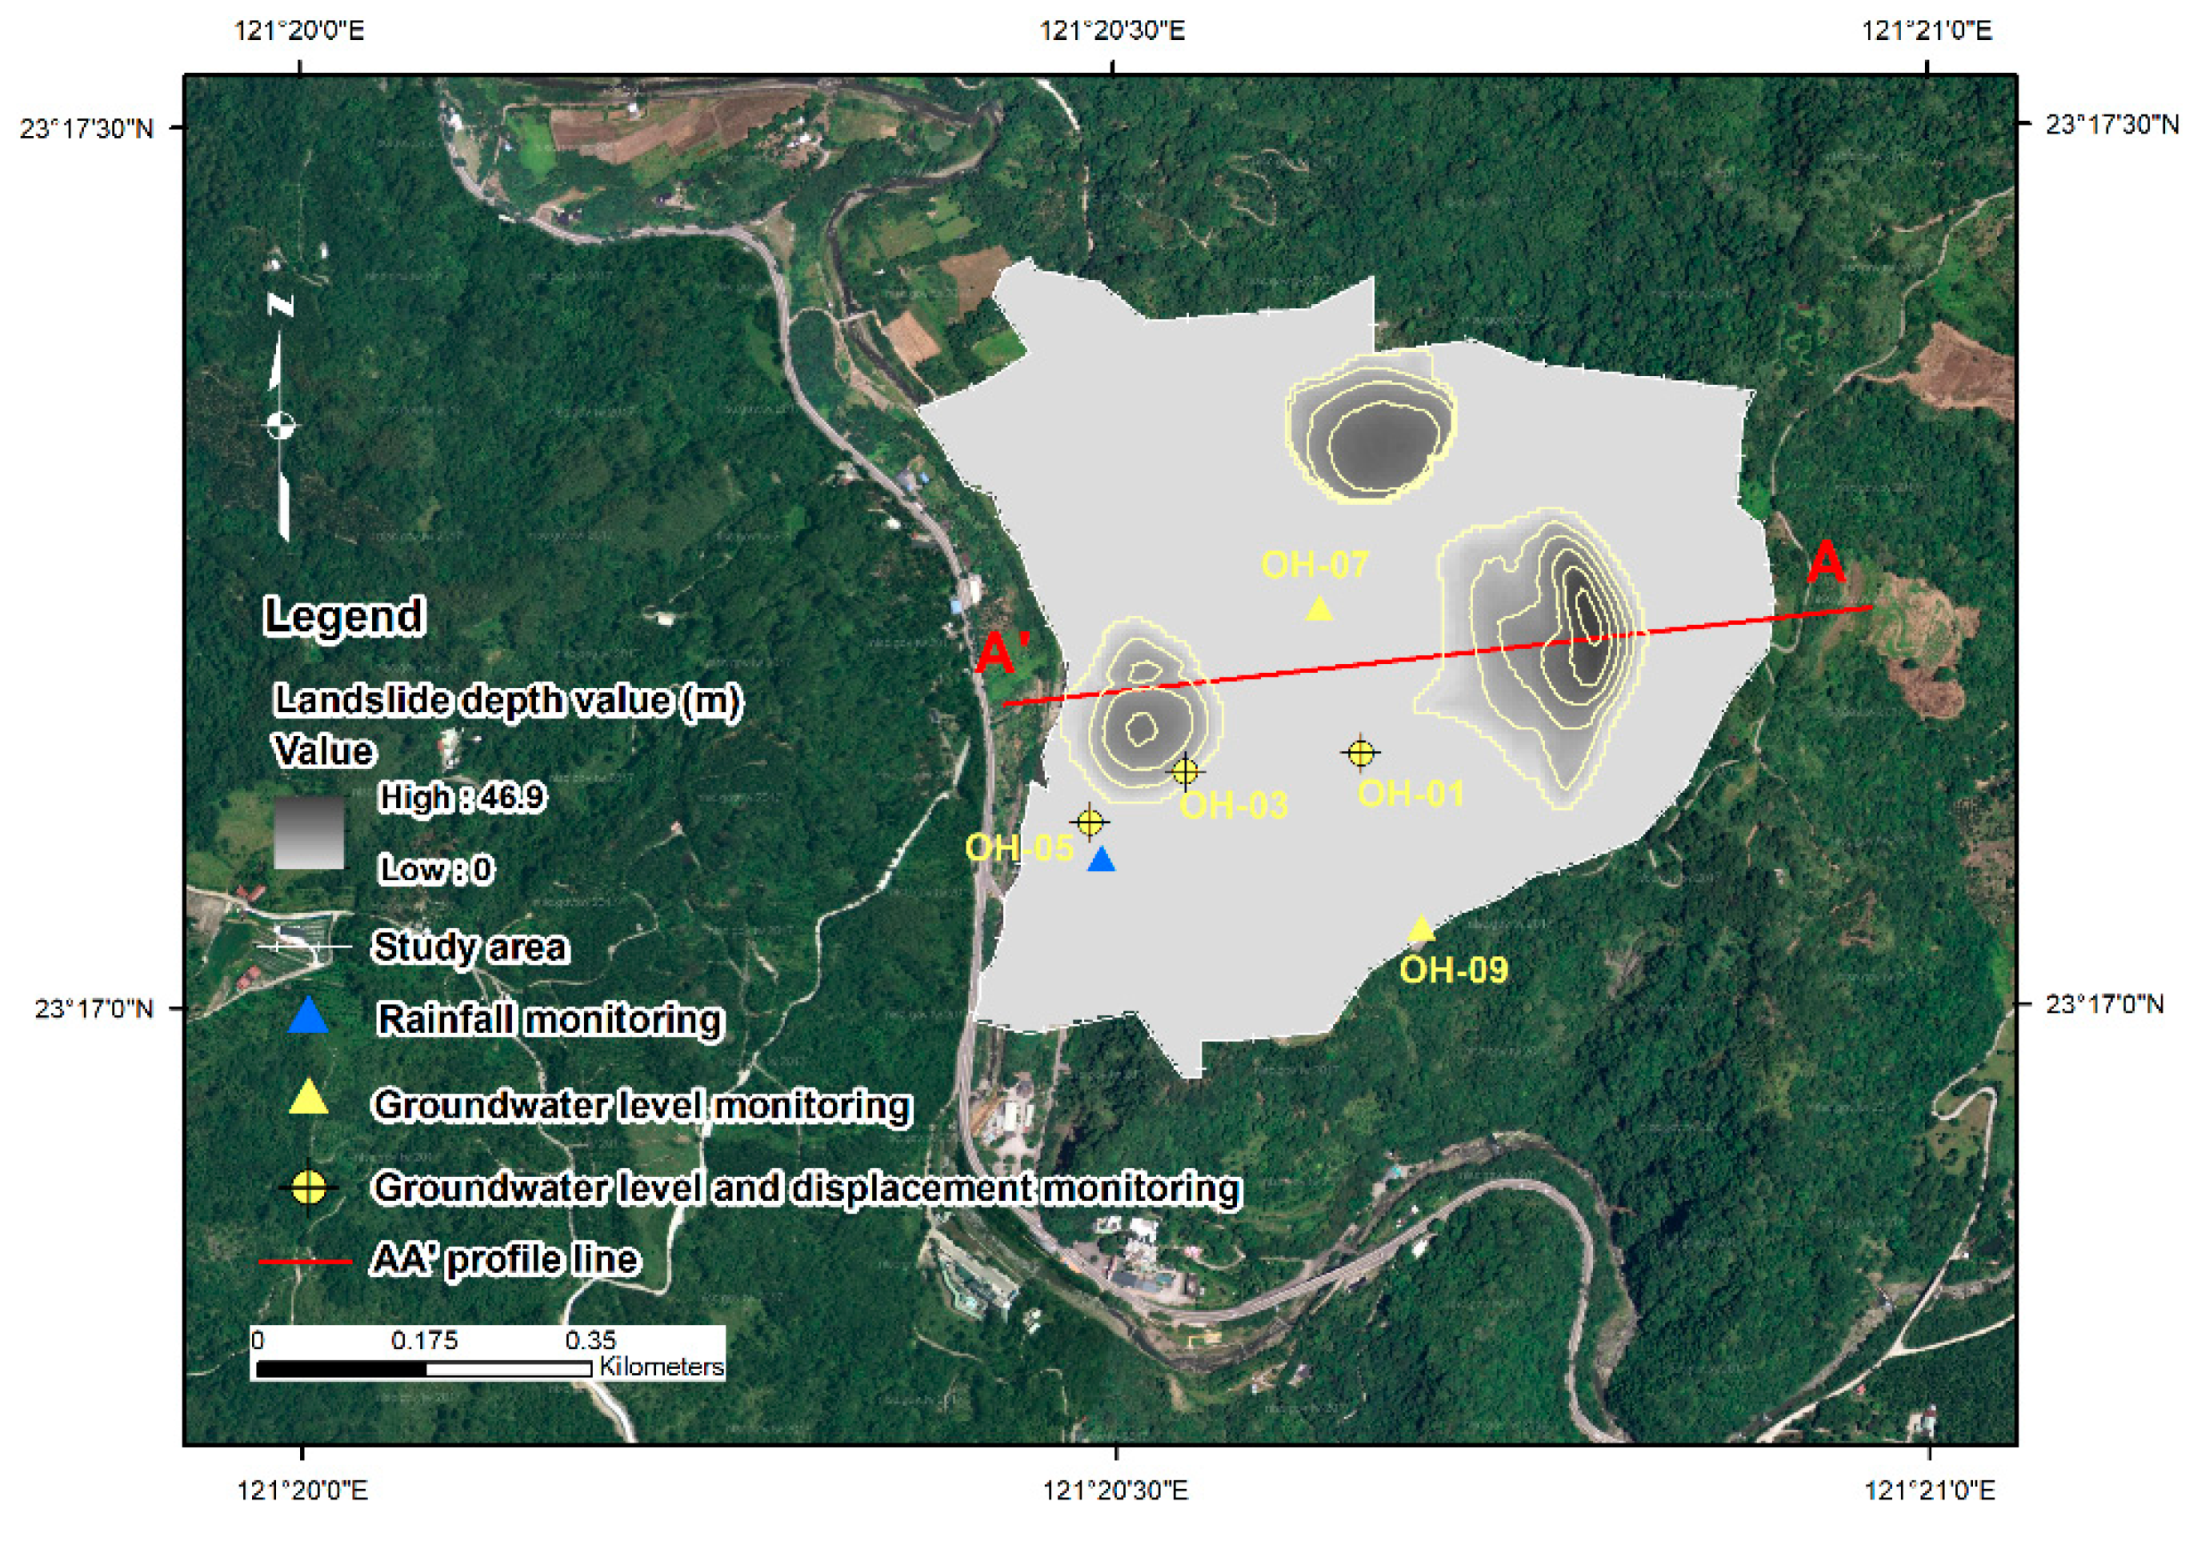
Regarding in situ monitoring, the monitoring instruments installed by the CGS in potential landslide areas include rain gauges, water gauges, inclinometers, and shape acceleration arrays. The locations of these instruments are shown in
Figure 5.
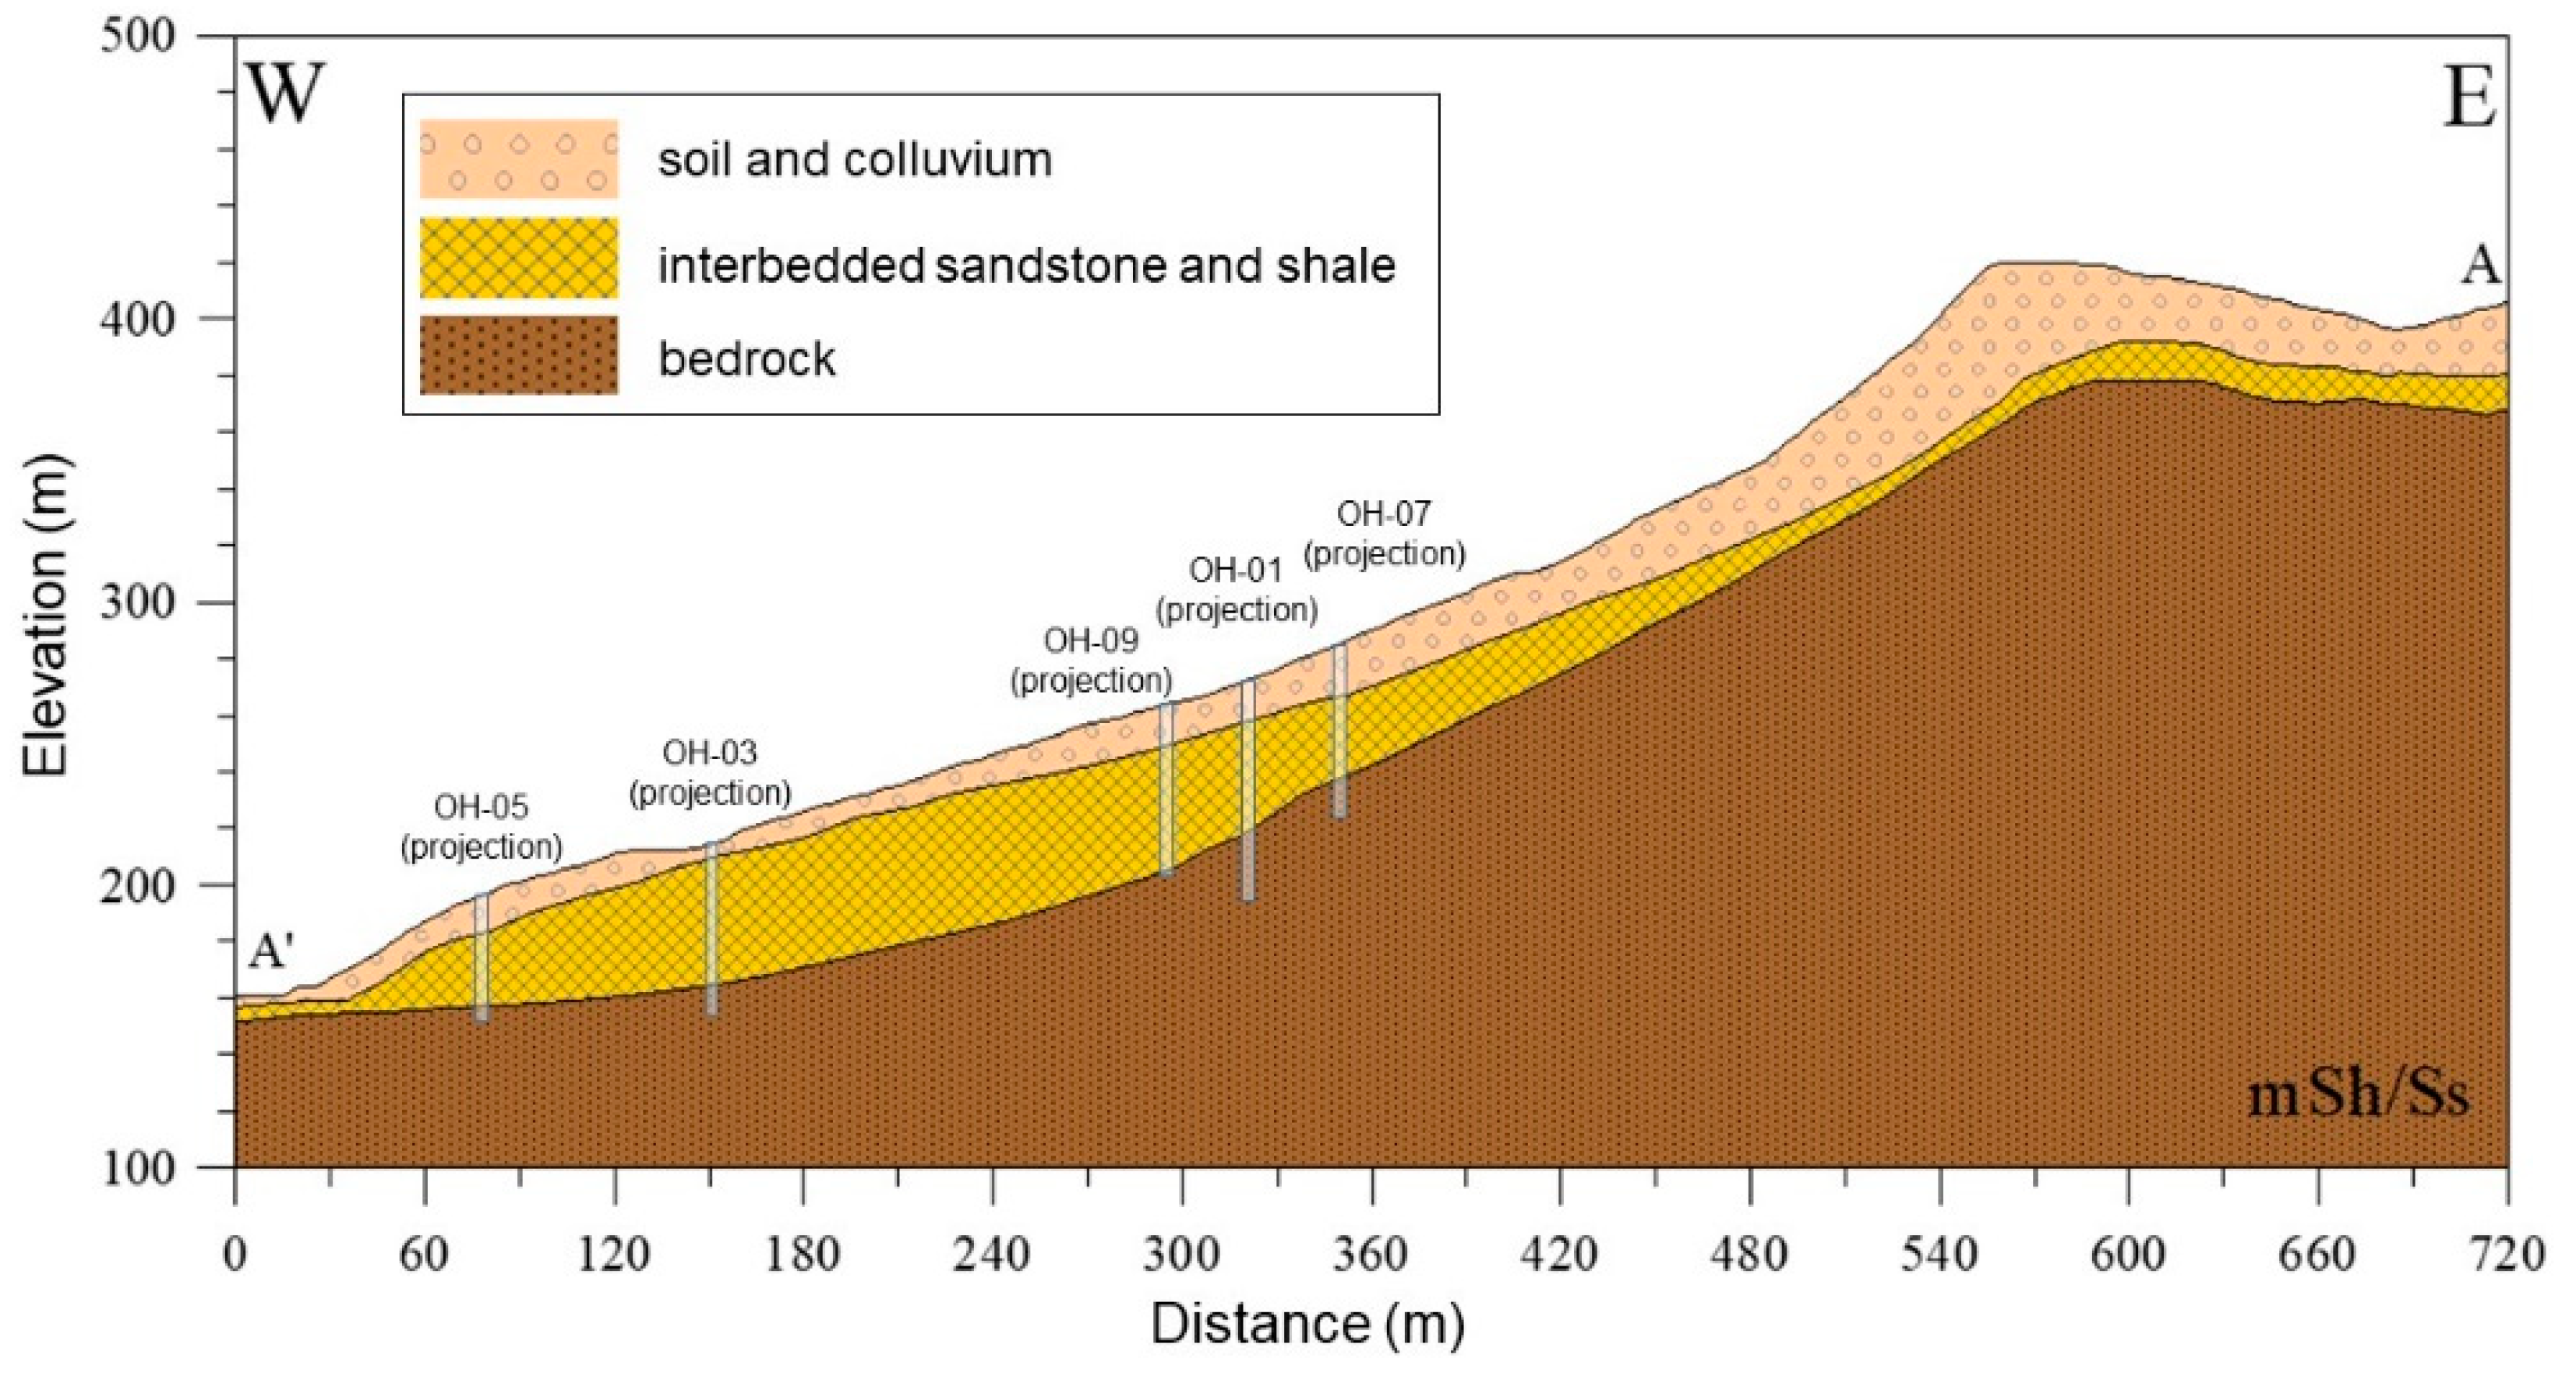
Figure 6 depicts a cross-section of the study area based on a geologic drilling survey and shows that the area has three layers (from top to bottom): Colluvium, an interbedded layer of crushed sandstone and shale, and an interbedded layer of intact sandstone and shale. Recent in situ monitoring results revealed that the level of underground water in the study area tends to rise because of rainfall, causing slopes to become unstable. Monitoring results for 2015 and 2016 showed that the sliding depth at the toe of the slope was approximately 22.5 m and displacement was 9.1 mm [
27]. The monitoring results for 2017 identified signs of continuous displacement during Typhoon Megi.
3. Methodology
In this study, potential landslide analysis was performed using the USGS Scoops3D slope stability analysis software program, which evaluates slope stability throughout a digital landscape represented by DEM. Scoops3D was used to evaluate the stability of volcano slopes, including Mount Rainer in Washington [
29], Volcan Casita in Nicaragua [
30], Augustine Volcano in Alaska [
31], and pre-landslide Mount St. Helens [
32]. The software program was also combined with a regional underground flow field model to analyze the stability of coastal cliffs in Seattle, Washington [
33,
34].
Scoops3D uses the 3D method of column limit-equilibrium to calculate potential failures on slopes with slip surfaces, thereby determining slope stability. The model accounts for the complex topography of a slope and full 3D configuration of parameters, such as underground stratum characteristics, pore water pressure, and simplified earthquake-loading effects [
35]. The level of slope stability is represented by a factor of safety, which is calculated using the model. The factor of slope stability safety is the ratio of the force of soil resisting sliding to the sliding force of the soil due to its own weight. Generally, the resisting force is greater than the sliding force, therefore, the analysis result for a slope is normally stable. However, when heavy rainfall increases underground water levels or influences seismic force, the resisting force of the soil gradually approximates the sliding force and eventually reaches a critical state in which the slope is theoretically unstable. The factor of safety (
FS) in the limit-equilibrium method is defined in (1) as the ratio of shear resistance (s) to shear stress (
).
FS < 1 indicates an unstable slope.
where shear resistance strength
s is calculated using (2), which is the linear Coulomb–Terzaghi failure rule [
33] where
c is cohesion,
is the angle of internal friction,
is normal stress, and
is pore-fluid pressure on the shear plane.
In the model, Bishop’s simplified method is used. When this method is used, the 3D limit-equilibrium analysis of
FS is shown in (3), where
i and
j are the corresponding columns represented by the coefficient of horizontal acceleration
multiplied by the weight of each column
if seismic force is considered,
is the horizontal torque of sliding force caused by seismic factors,
is the moment arm from the axis of rotation to the center of the base of a 3D column,
is the horizontal area of the base of a column,
is the included angle (true dip angle) of the column slip surface and horizontal surface, and
is the apparent dip angle in the direction of a slide.
Bishop’s simplified method was also developed from a 2D method of slices [
36]. Bishop’s simplified method determines the normal force acting on the slip surface by first computing the force equilibrium in the vertical direction on the base of each slice. The ordinary method of slices computes stability on a 2D slip circle divided into slices. In Scoops3D, this method is extended to 3D columns, and the capability to include earthquake-loading effects is added in a pseudostatic analysis. In the model, a 3D method is used, and a procedure similar to that presented in previous studies is followed to make assumptions regarding the forces of 3D columns in each direction [
35,
37,
38]. If the study area is not associated with geologic drilling or underground water monitoring information and only the topographic effect is analyzed without taking into consideration underground water, then (3) can be simplified into (5) as follows:
This study adopted in situ monitoring data of the piezometric surface of the underground water level to construct a complete analytical model. Thus, (3) can be adjusted to form (6), where
is the vertical distance from a piezometric surface to a slip surface.
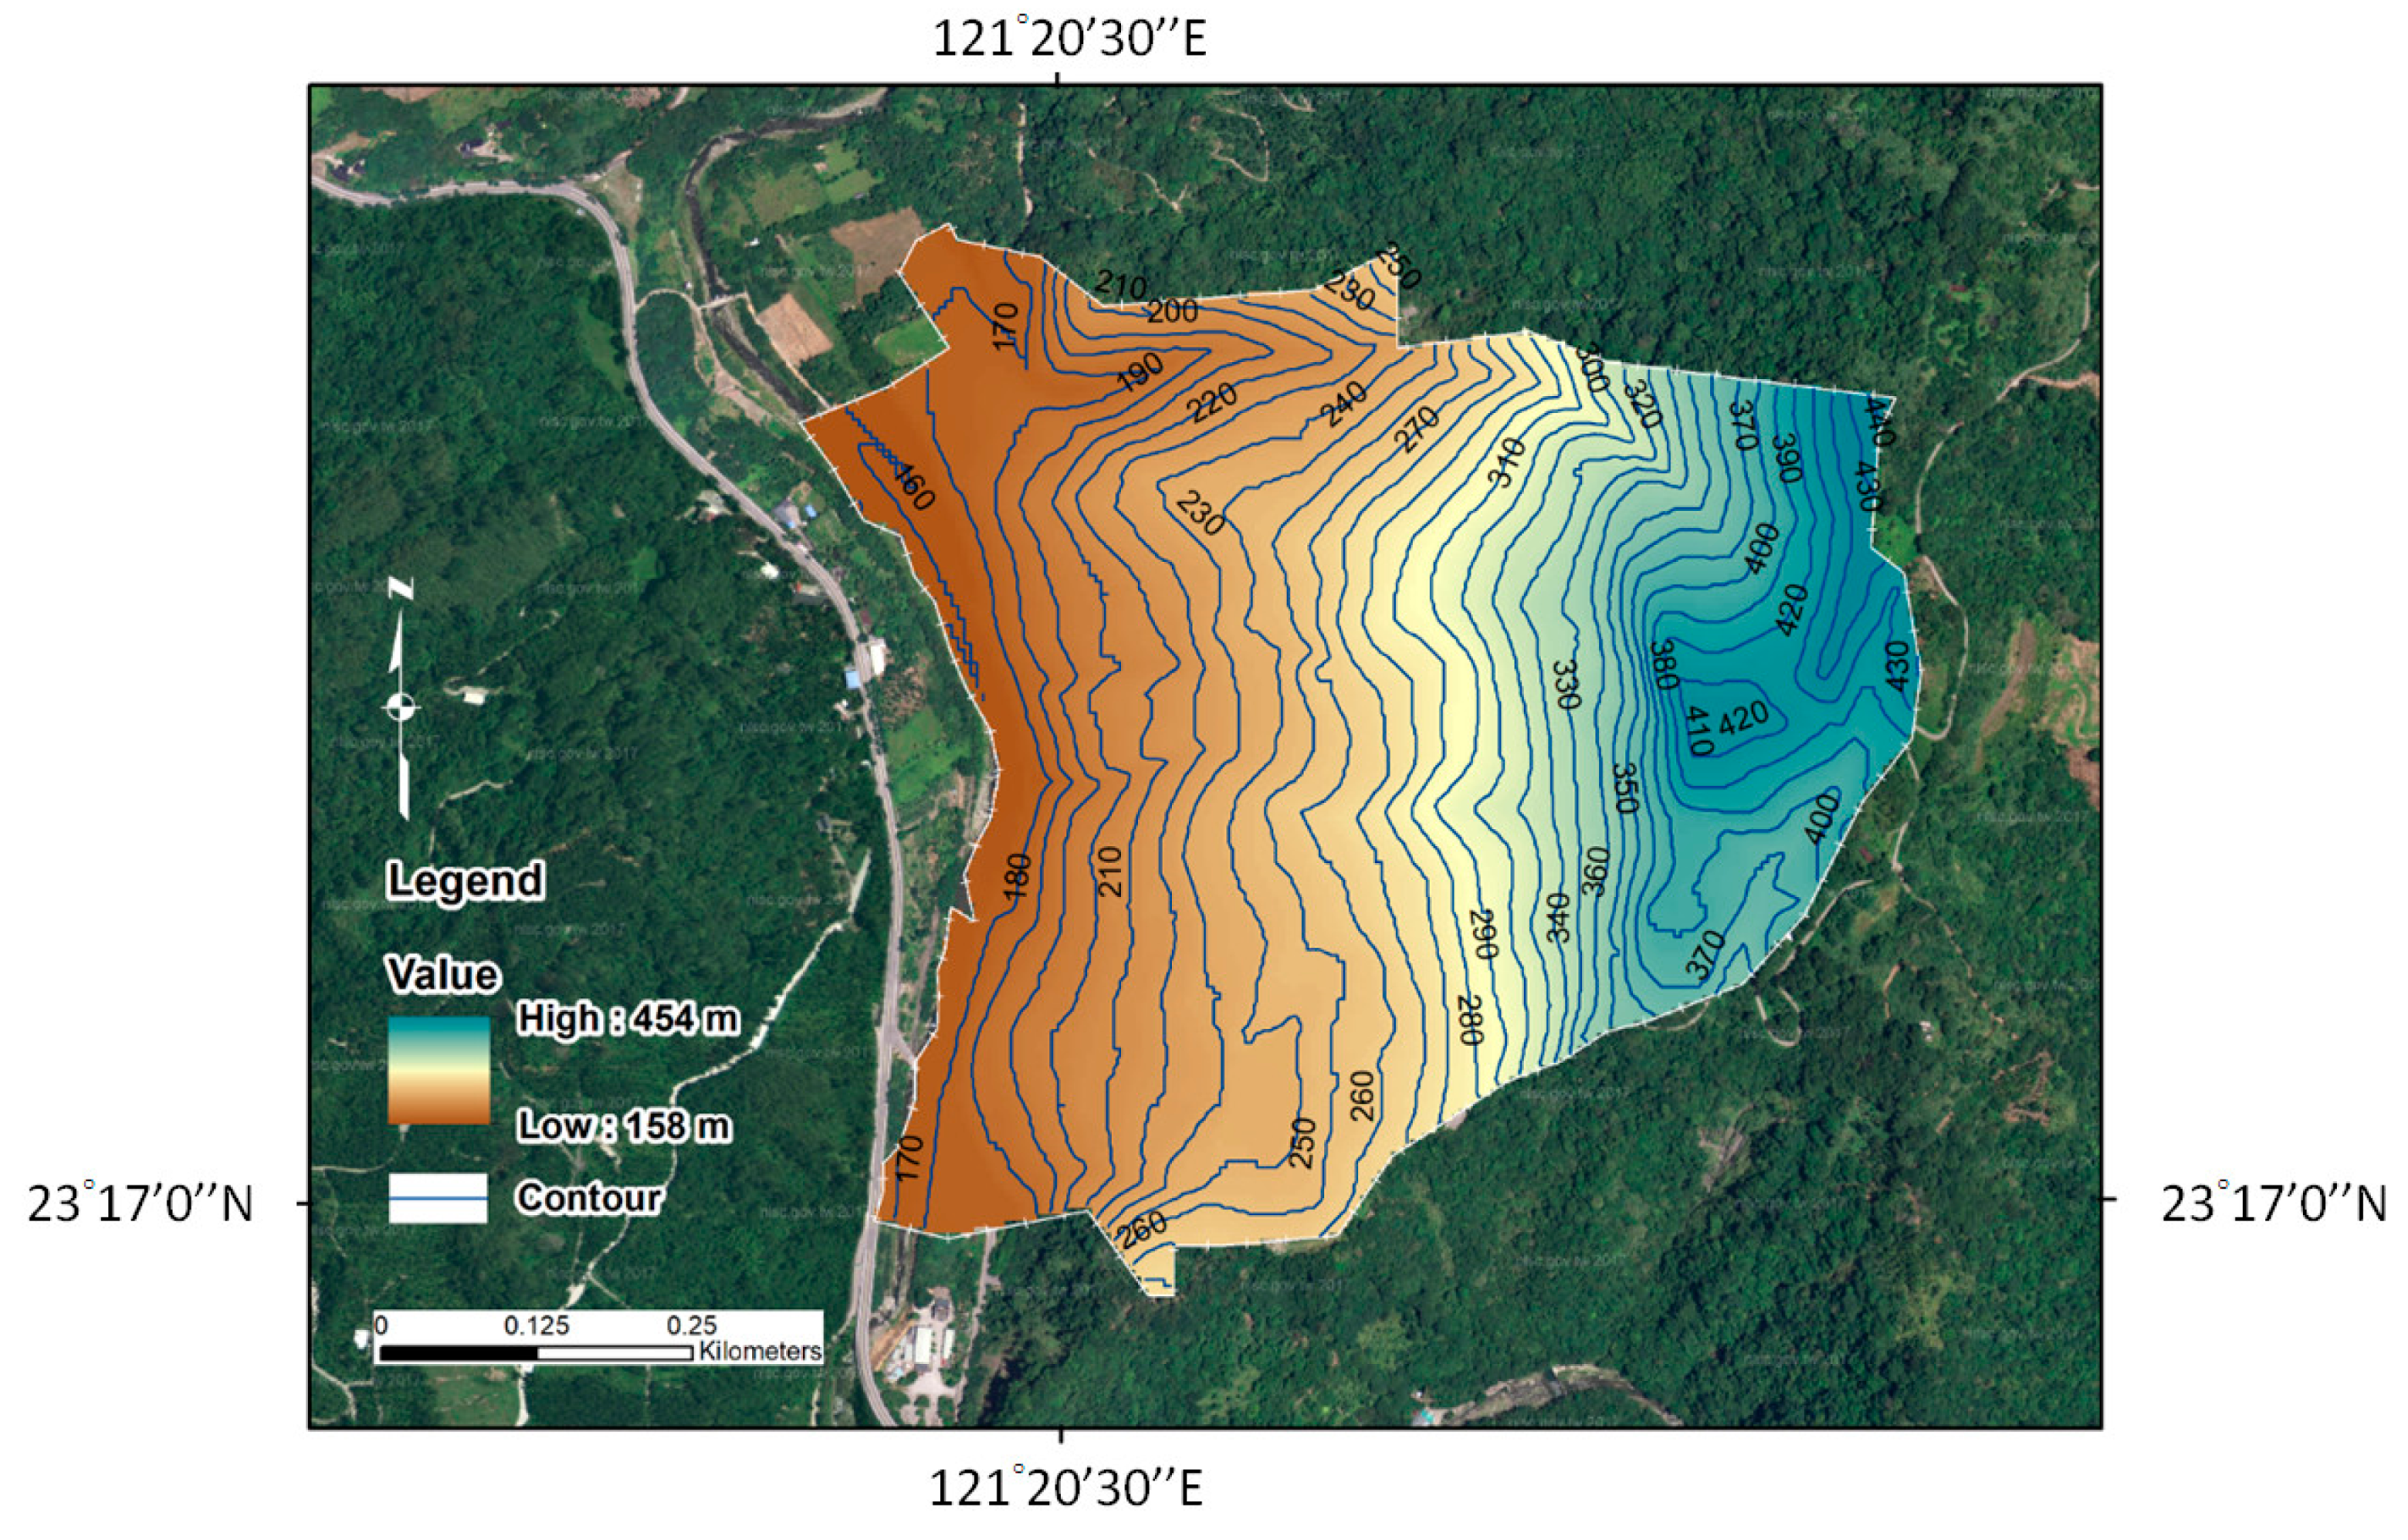
The various types of parameters used in the model in this study are described below. Detailed topographic information of the study area in Taiwan was required to perform the analysis. Digital elevation data set in a 5 m resolution was obtained from the aerial photographs provided by the Agricultural and Forestry Aerial Survey Institute of Taiwan (
Figure 7). The aforementioned geologic drilling and underground water monitoring results were used to construct a potential landslide analysis model. The stratum of the model was composed of three layers (from top to bottom): Colluvium, an interbedded layer of crushed sandstone and shale, and an interbedded layer of intact sandstone and shale. The mechanical parameters of each stratum layer were based on the Central Geological Survey’s geological survey report on the Paliwan Formation of Hualien River [
39].
Table 1 lists the cohesion, angle of friction, unit weight, and other parameters.
Regarding underground water levels,
Figure 5 shows the location of the observation points of underground water levels in the study area. The locations with drilled holes were equipped with a hydraulic gauge to continuously record the water level in the hole. Observation records from July 2013 to the present time revealed that underground water levels in holes OH-03 and OH-09 remained stable, exhibiting a degree of variation within 2 m. The underground water level in hole OH-05 was closer to the ground surface and is usually 5 m below the surface. The underground water level in hole OH-07 could rise by 8–10 m during a typhoon period. The underground water level in hole OH-01 was sensitive to change and could increase or decrease by 40 m at most, suggesting that the water level in this hole was easily affected by rainfall (CGS, 2016). During the observation period, the underground water level in hole OH-01 changed considerably, and instrument failure occurred for a period of time, meaning that the usual water level could not be observed. Therefore, the water level in this hole was not incorporated into the modeling of the underground water level; instead, it was replaced by the interpolated value of holes OH-09 and OH-07, which were located near OH-01.
Table 2 provides a list of reference values for the underground water levels in each hole.
4. Results of 3D Modeling of Study Area
As mentioned above, the analytical model of the Antong area in Hualien was constructed using the 5 m resolution DEM, underground stratum layers, and underground water data. The USGS Scoops3D model, which is based on the limit-equilibrium method, was used for analysis. The spatial nodes for searching the range of surface failure are shown in
Figure 8.
Figure 9 shows the distribution of the factor of safety in the study area, and the potential landslide zones are defined as Zone 1, Zone 2, and Zone 3, respectively. Zone 1 was located at the toe of the slope, and Zone 2 and Zone 3 were on the upward slope. The results indicated that factor of safety in Zone 1 was 1.37, Zone 2 was 0.92, and Zone 3 was 1.19.
Table 3 also indicated the detail of landslide simulation, such as the factor of safety, average landslide depth, maximum landslide depth, landslide area, and landslide volume in each Zone. As shown in
Figure 10, according to the AA’ profile, modeling and analysis yielded evaluation results of the simulated circular slip and slope failure. Zone 2 was more unstable than Zone 1; the average simulated landslide depth was 24.1 m, the maximum depth was 48.0 m, the area was 105,904 m
2, and the volume was 2,554,963 m
3. For Zone 1, the average simulated landslide depth was 13.9 m, the maximum depth was 21.8 m, the area was 26,314 m
2, and the volume was 364,616 m
3. Not only the landslide depth and volume were estimated, but also the direction of the slips in Zones 1 and 2, which were approximately 181.3° from the horizontal direction (X-axis) as obtained by the proposed model. This information was very important for the assessment of potential landslides in the study area.
Figure 11 presents the simulated value of the landslide depth in the study area. The yellow contour lines, which represented the landslide depth, showed that the depth of landslide in hole OH-03 was 20 m. Comparison with the MOEA’s monitoring result during Typhoon Aere in October 2016 showed signs of displacement at a depth of 22.5 m in hole OH-03. The incremental amount of displacement (in the A direction) was roughly 9.1 mm, which differed by approximately 2.5 m from the model simulation result. The results indicated the recorded and simulated landslide depths were in good agreement. According to Soil and Water Conservation Handbook, Technical Regulations for Soil and Water Conservation, Design Code and Specifications of Building Foundations, and the Design and Construction Code for Highway Slopes in Taiwan, the usual factor of safety must be 1.5 or above and 1.1 or 1.2 or above in the event of torrential rain or an earthquake [
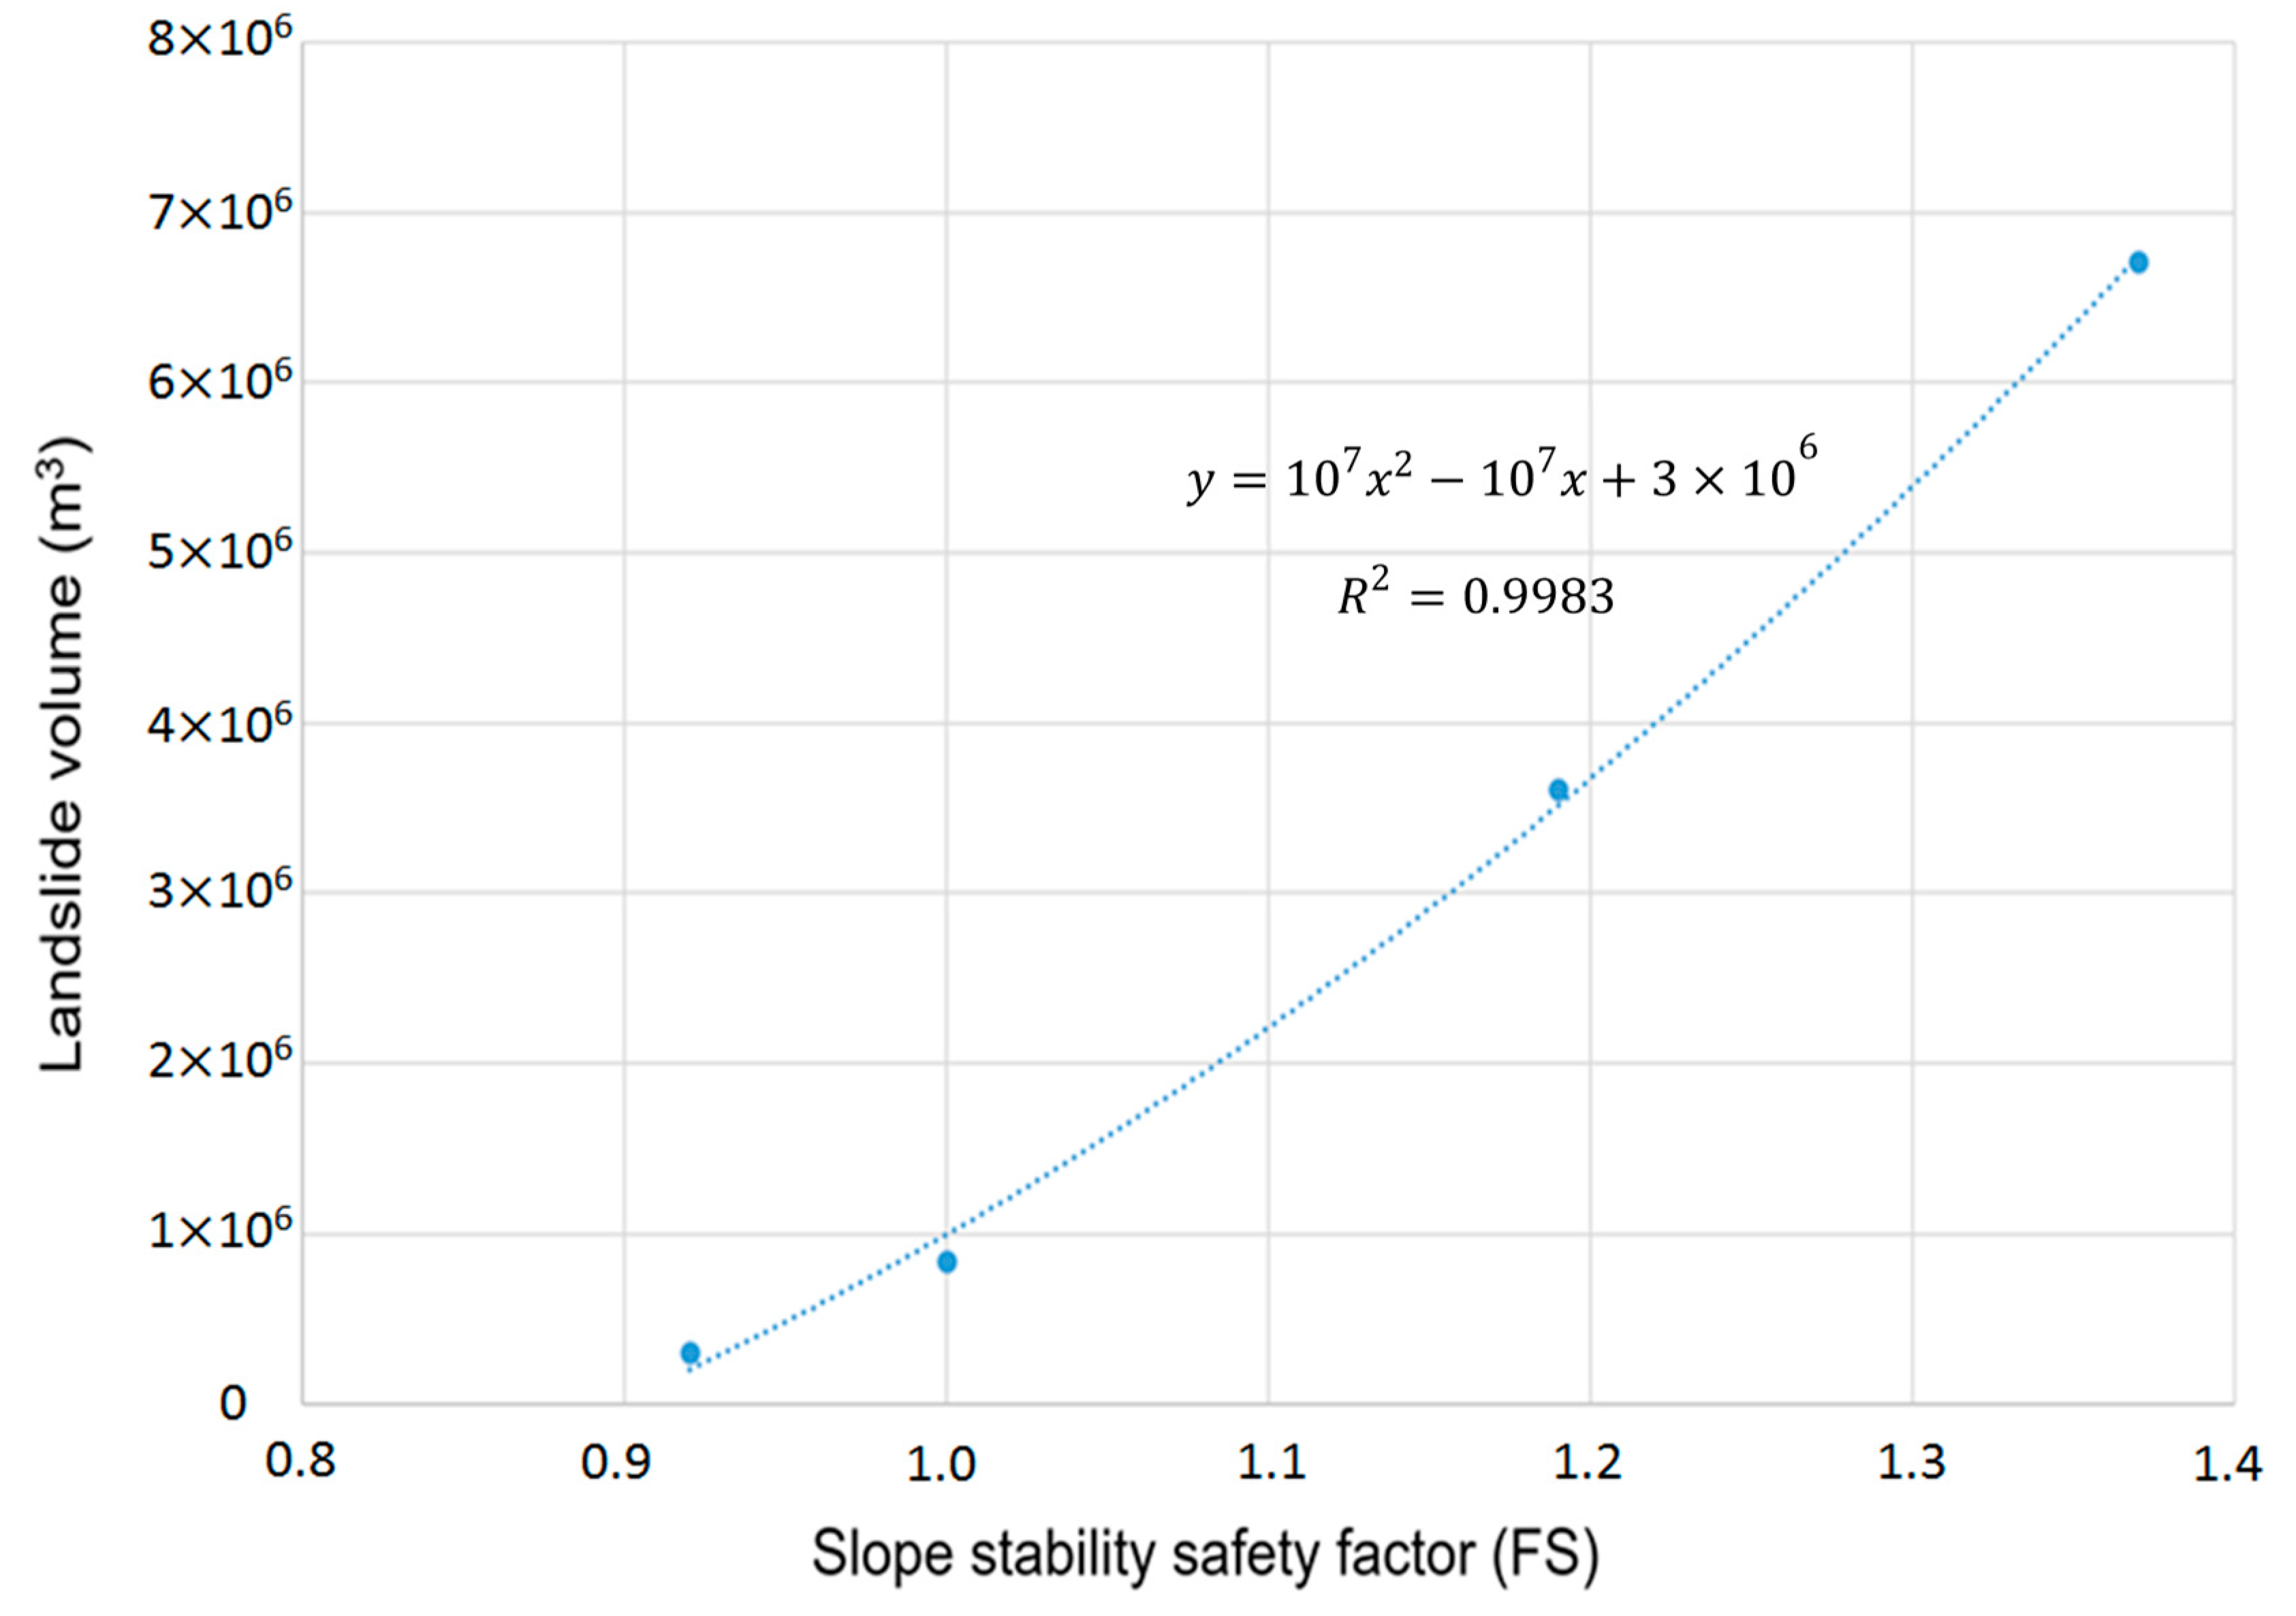
25]. Therefore, the analysis results of the analyzed region in Antong, Hualien under normal conditions did not meet the slope stability requirements indicated in the aforementioned regulations and codes. In other words, slope stability in this region still requires continuous observation. In addition, the relationship between the landslide volume and the factor of safety was developed according to the proposed model, as shown in
Figure 12 and
Table 4, to assess potential landslides.
The volume of landslides in Taiwan is typically estimated using the empirical equation of area–volume. The Soil and Water Conservation Bureau in Taiwan screened cases of large-scale landsides caused by Typhoon Morakot in 2009, adopted the topographic data produced by Lidar, and compared the topography of the two periods to estimate the area and volume of a landslide according to the empirical equation [
40].
Table 5 provides a list of the volumes of potential landslide zones at the toe of the slope (Zone 1) and on the upward slopes (Zones 2 and 3). The volumes were estimated using the physical model of landslides developed in this study. When compared with the empirical equation, which calculates the volume of the landslide, the two methods generated considerably different results, primarily because the empirical equation yields statistical results based on a large range of area and large number of landslide cases. Using an empirical equation to estimate the volume of a single landslide case inevitably generates large errors. For example, the analysis results of Zone 1 showed that the landslide size was calculated using the physical mode of analysis in this study, which was calibrated against the results of landslide depth and in situ monitoring. The results should therefore be reliable. In addition, the volume of landslides based on the empirical equation was 159,737 m
3, equating to 43.8% of the landslide volume calculated using the study model. The landslide depth calculated from the empirical equation was shallower than he proposed model and did not coincide with the in situ monitoring results.
5. Discussion and Conclusions
The case analysis results of this study revealed the distribution of slope stability safety factors, which were analyzed using the proposed model, showing that the toe of the slope (Zone 1) with abundant groundwater due to the nearby Antong river and the upward steep slope (Zones 2 and 3) were potential landslide areas. The upward slope exhibited a low slope stability safety factor and high potential for landslides. The simulated landslide depth values for the toe of the slope were similar to the in situ monitoring results obtained in October 2016. According to the various design and construction codes commonly used in Taiwan, the model analysis resulted in safety factors for the study area, including the potential landslide areas. Hence, slop stability in the study area still requires continuous observation.
Regarding the evaluation of landslide volume, the model analysis results were compared with the results of the empirical equation commonly used in Taiwan. The results showed that the empirical equation generated smaller landslide volumes, only approximately 38.5% (Zone 1), 42.9% (Zone 2), and 21.7% (Zone 3) of those generated by the proposed model. Because the result calculated using the model of this study was calibrated against the results of in situ monitoring, the results should be reliable. To calculate the volume of landslides according to the vast area of a drainage basin, the empirical equation quickly generates a rough estimate, but this must be used carefully when analyzing the volume of a single landslide case. If a single landslide case is analyzed using a mechanical model and verified against in situ monitoring or survey results, the obtained results should be superior to those calculated using a statistical model.
This study adopted the USGS Scoops3D slope stability model, which is based on the 3D column limit-equilibrium method. Subsequently, data on disaster history and results of in situ surveying and monitoring were integrated to assess potential landslides in large-scale landslide areas in Antong, Hualien. The model used the slope stability safety factor to evaluate landslide potential on a slope. According to the default evaluation criteria, the area, volume, and slip direction of landslides were calculated. Slice analysis in the limit-equilibrium method is a well-developed theory that has been extensively applied in geotechnical engineering. This method presents 3D analysis results clearly, making the model extremely suitable for analyzing and presenting cases of circular slope failure.
The potential landslide areas on a slope surface comprise the toe of the slope and the upward slope. Because in situ monitoring was conducted via holes at the toe of the slope and along roads, and the potential landslide areas on the upward slopes lacked monitoring points, the relationship between these two potential landslide zones and underground water changes could not be elucidated, except for changes in ground surface displacement. In the future, information on displacement beneath the ground surface in the potential landslide zone (i.e., the upward slope) should be used to illuminate the overall mechanism of slope landslides. Furthermore, the proposed landslide disaster assessment model did not consider the process of the post-failure model and run-out analysis. Hence, the proposed landslide model should be coupled with run-out analysis to delineate the impact area in the future.


