Twenty-First Century Streamflow and Climate Change in Forest Catchments of the Central Appalachian Mountains Region, US

Abstract
1. Introduction
2. Materials and Methods
2.1. Data
2.2. Quantifying Historical Streamflow Sensitivity to Climate
2.3. Modeling Future Streamflow
3. Results
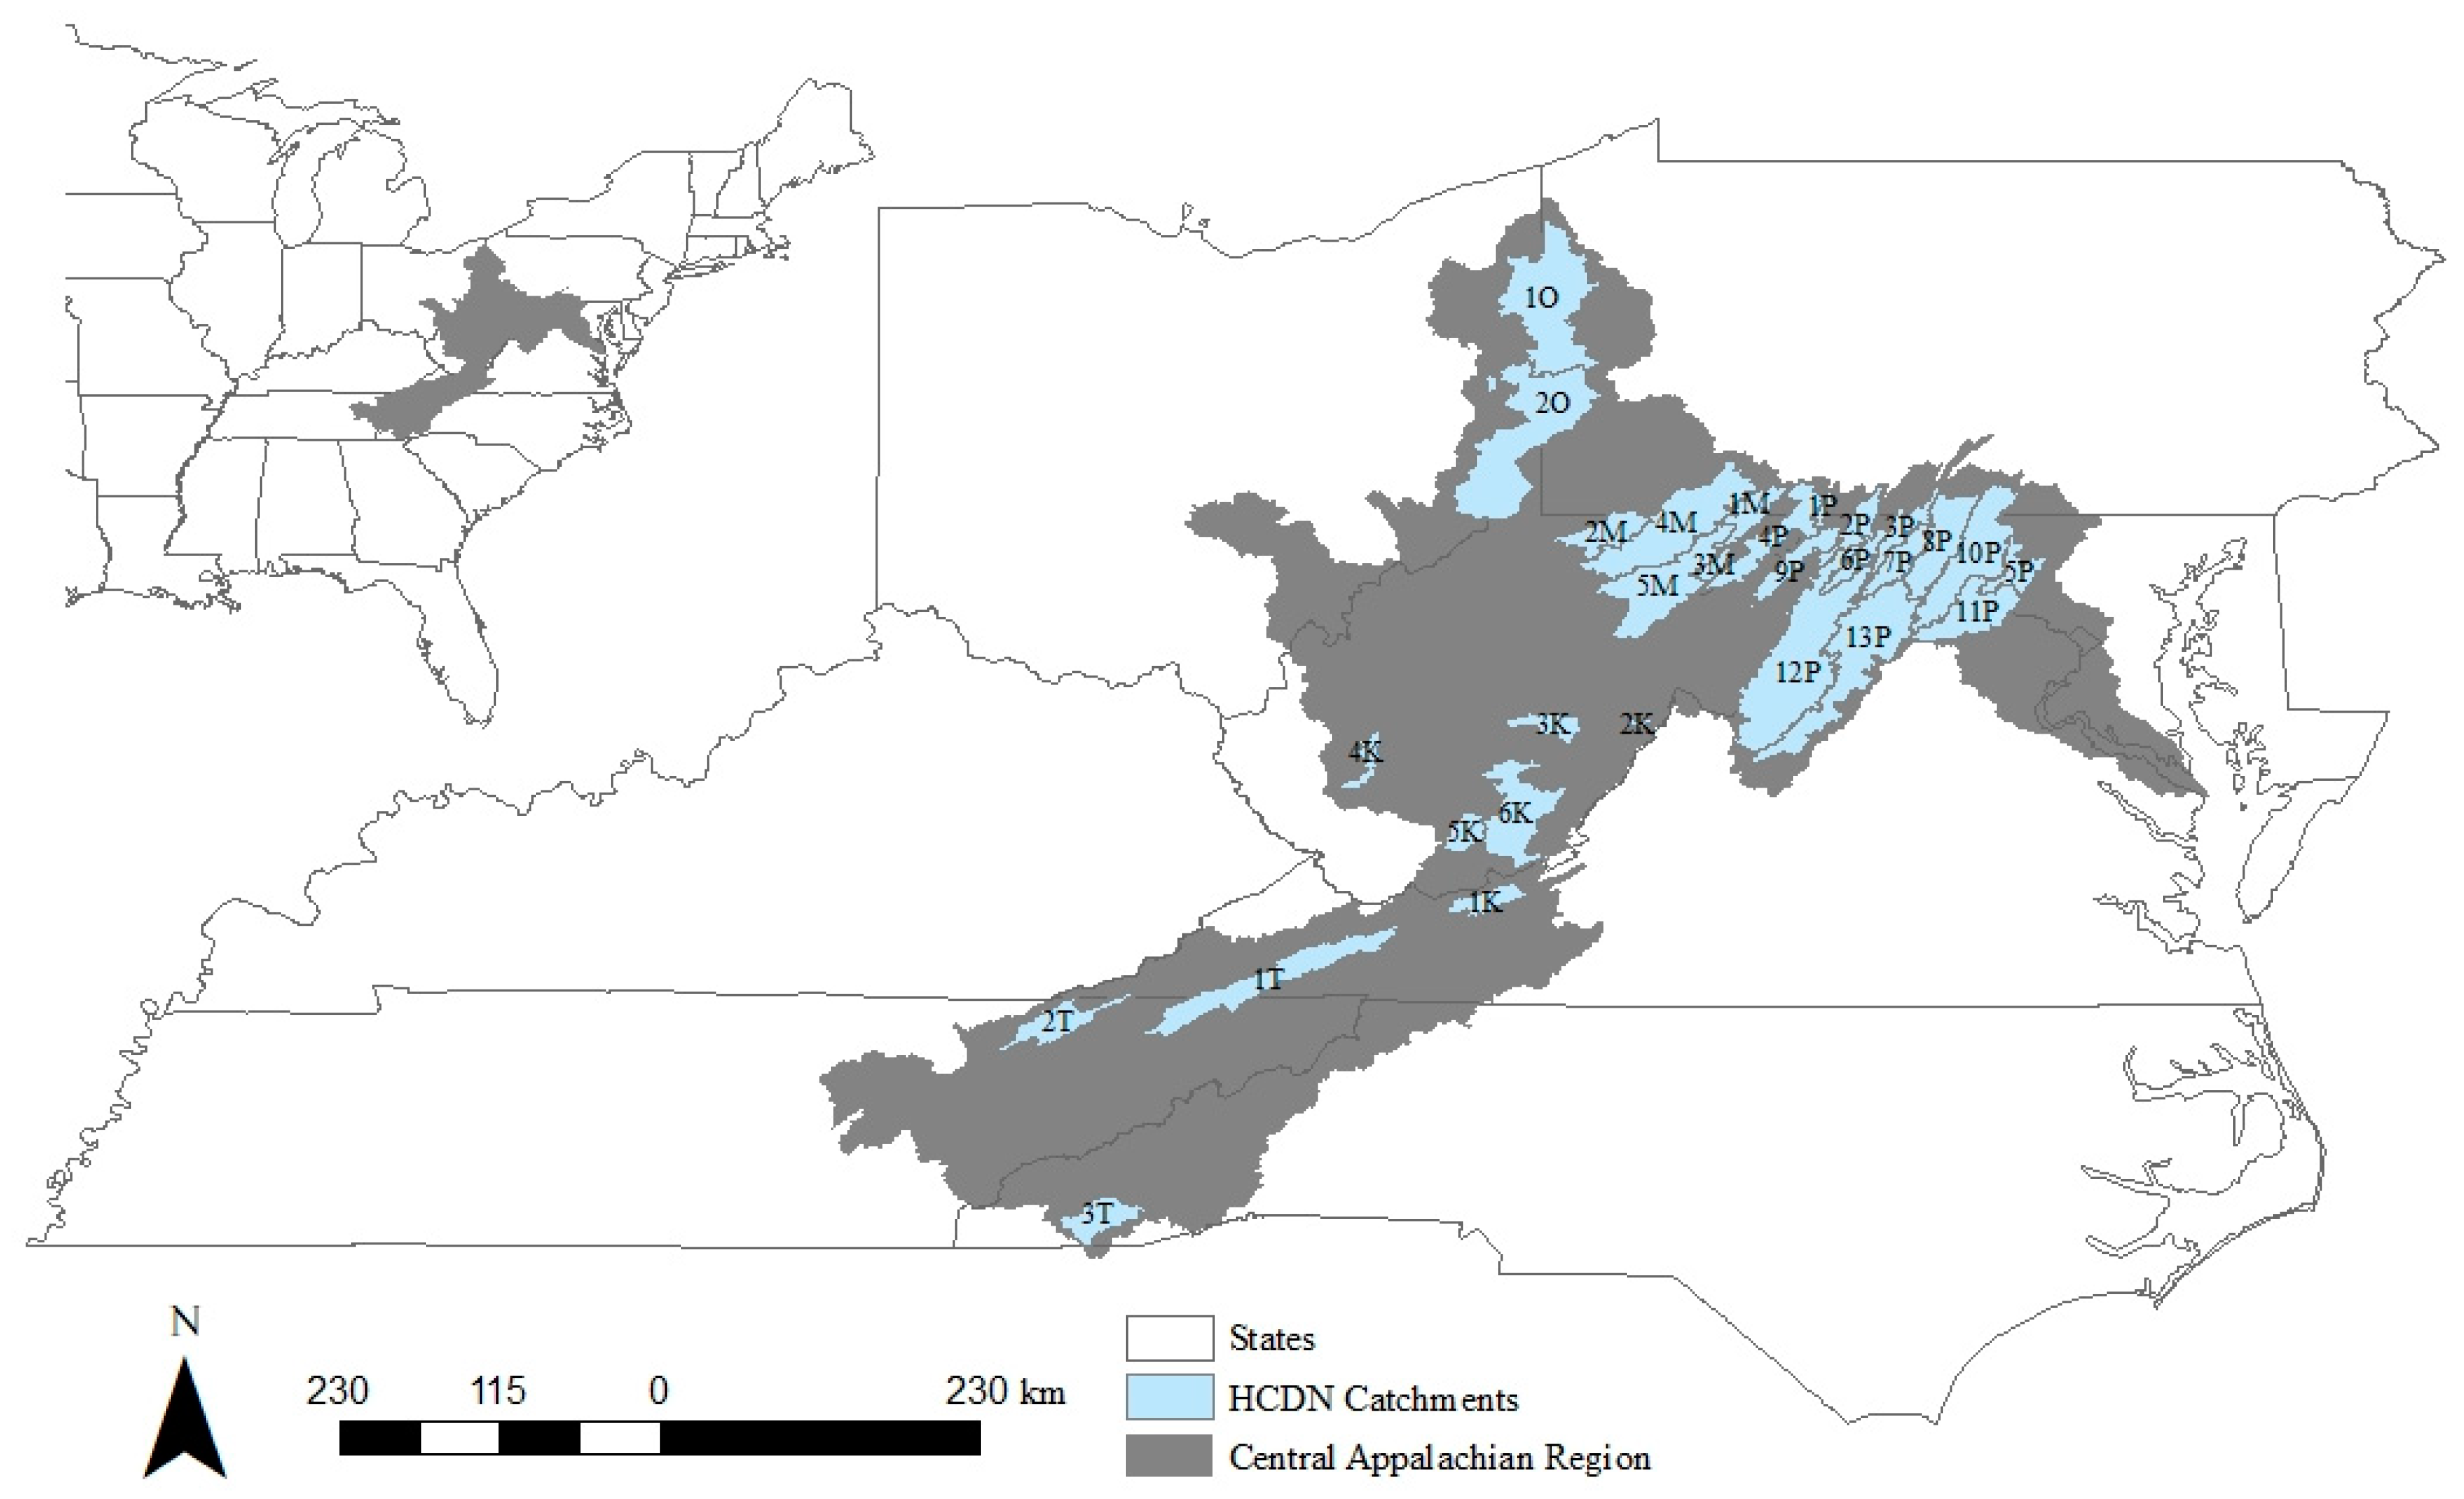
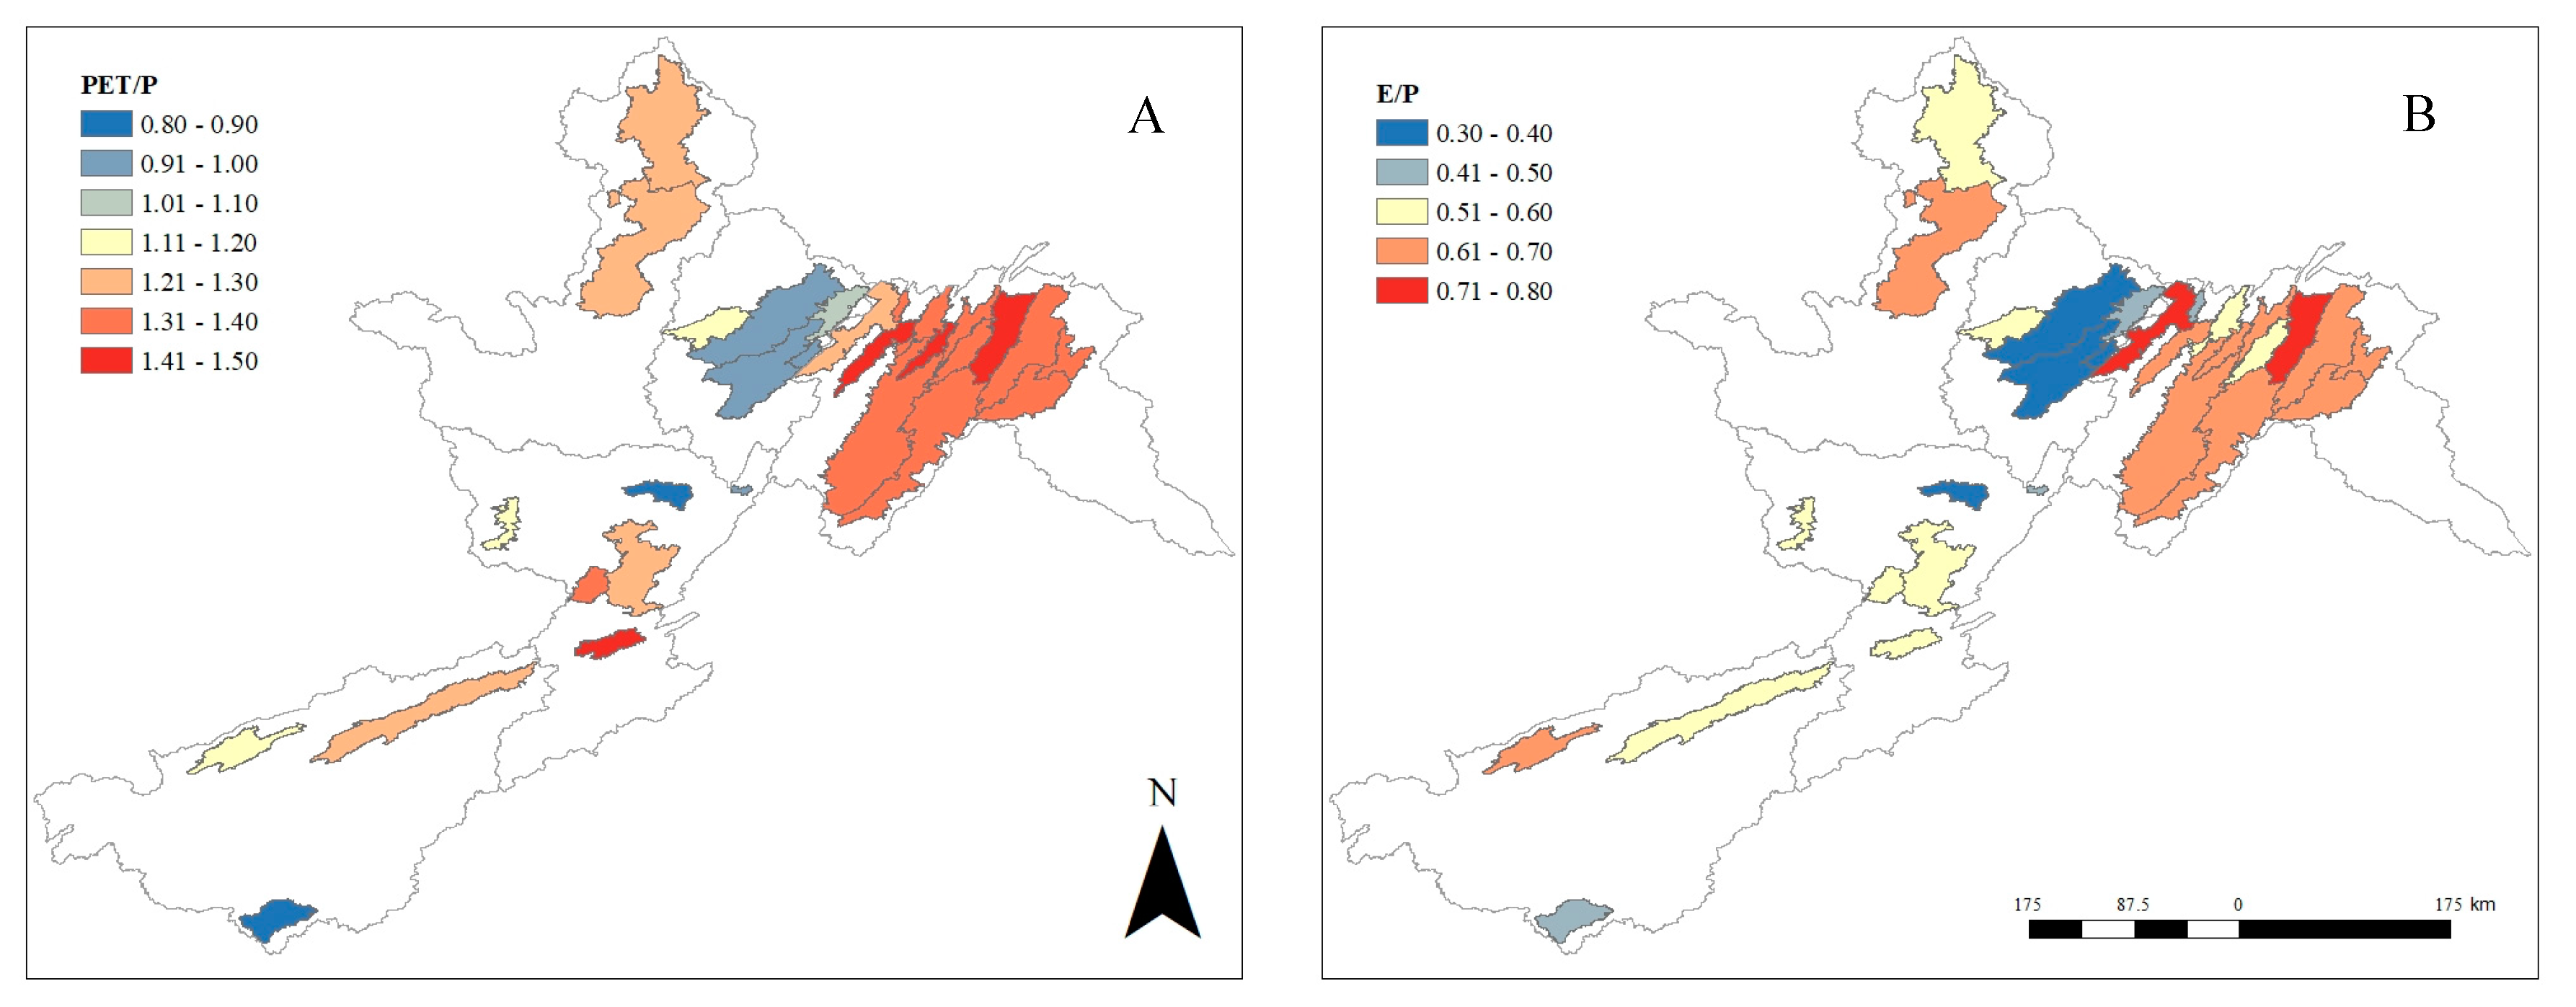
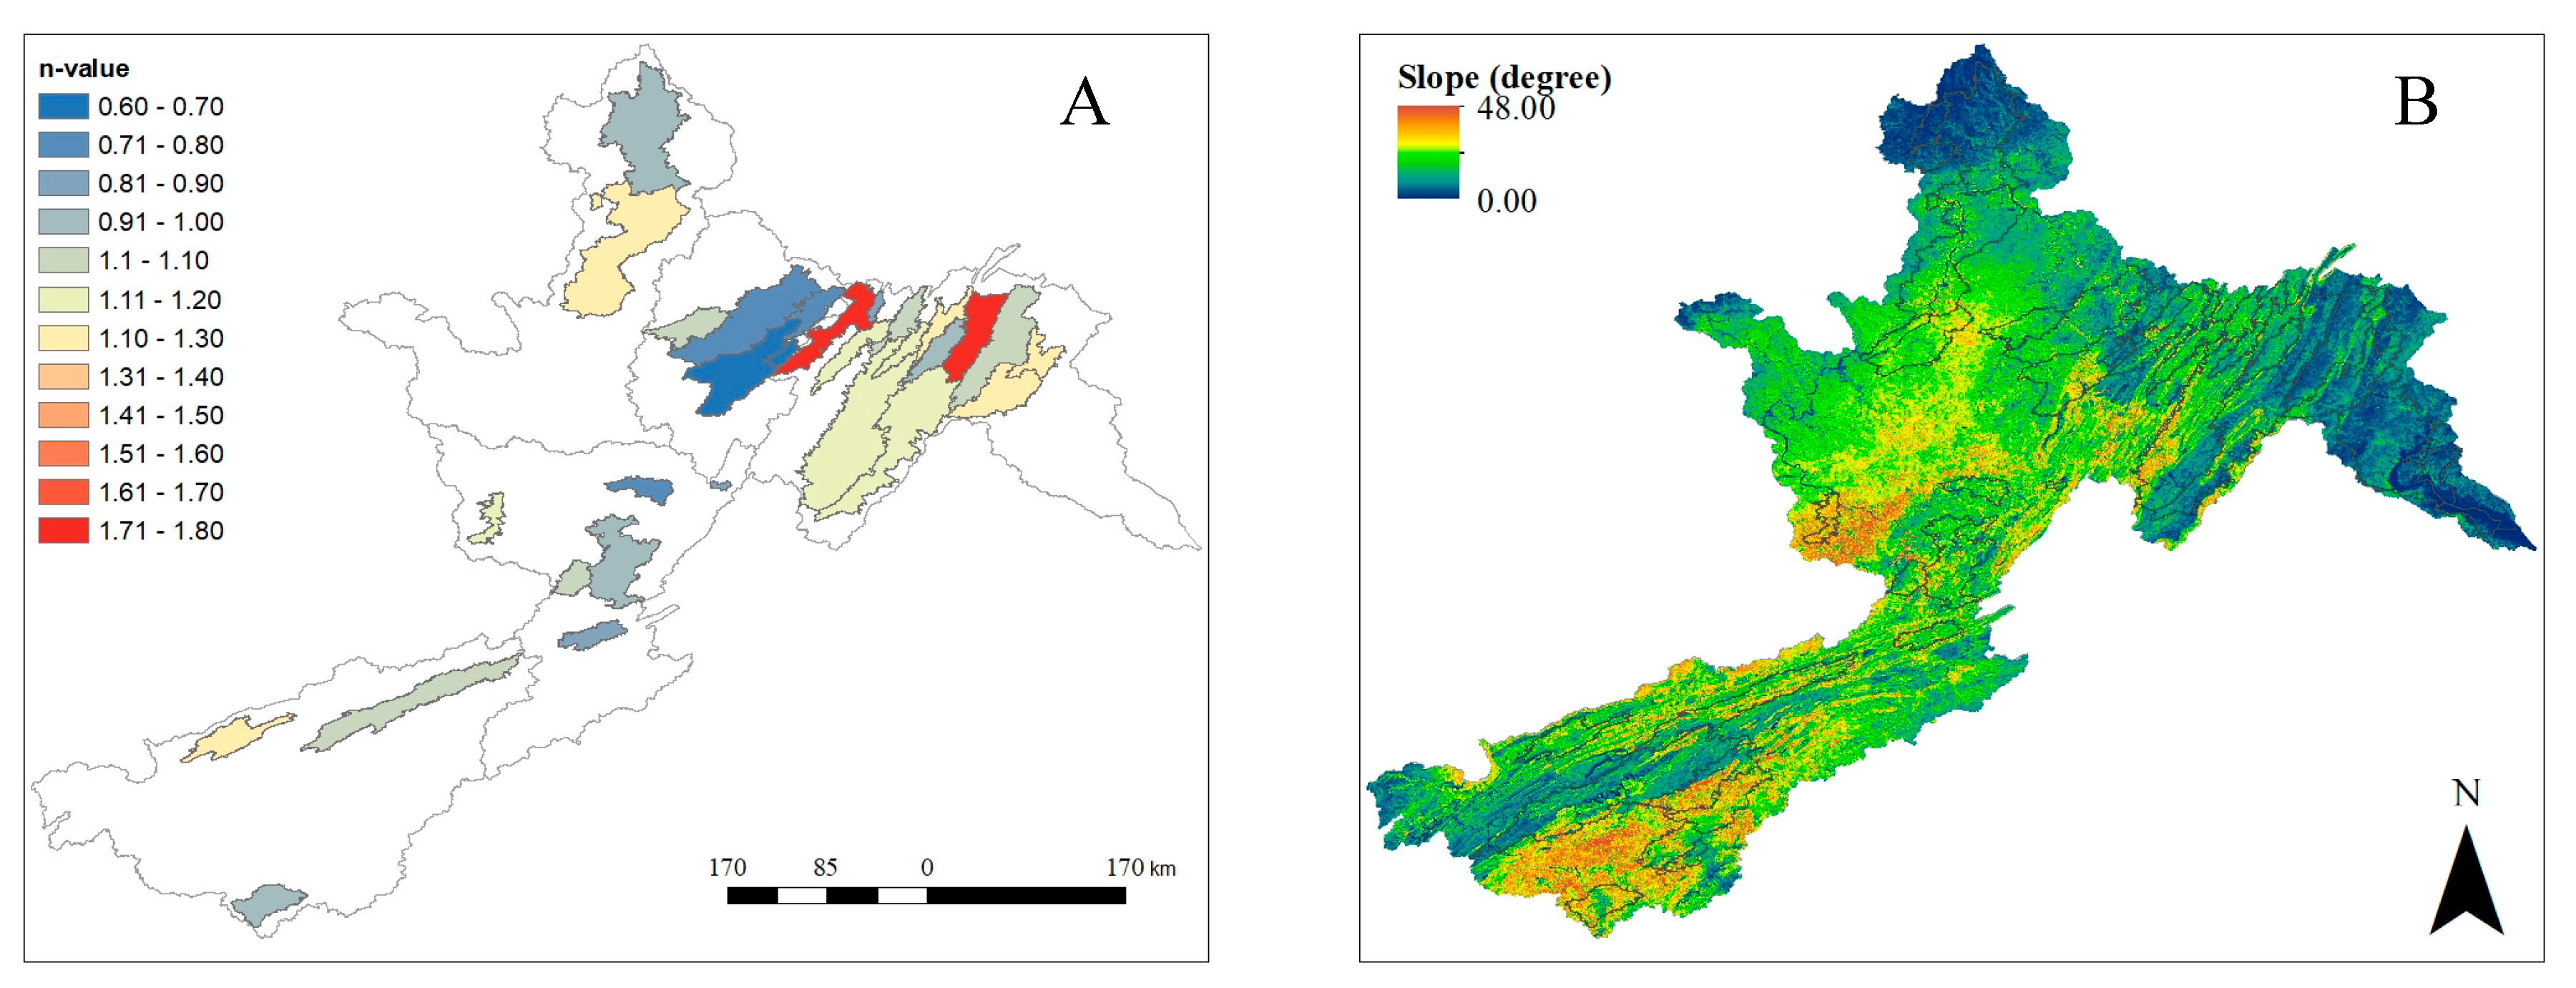
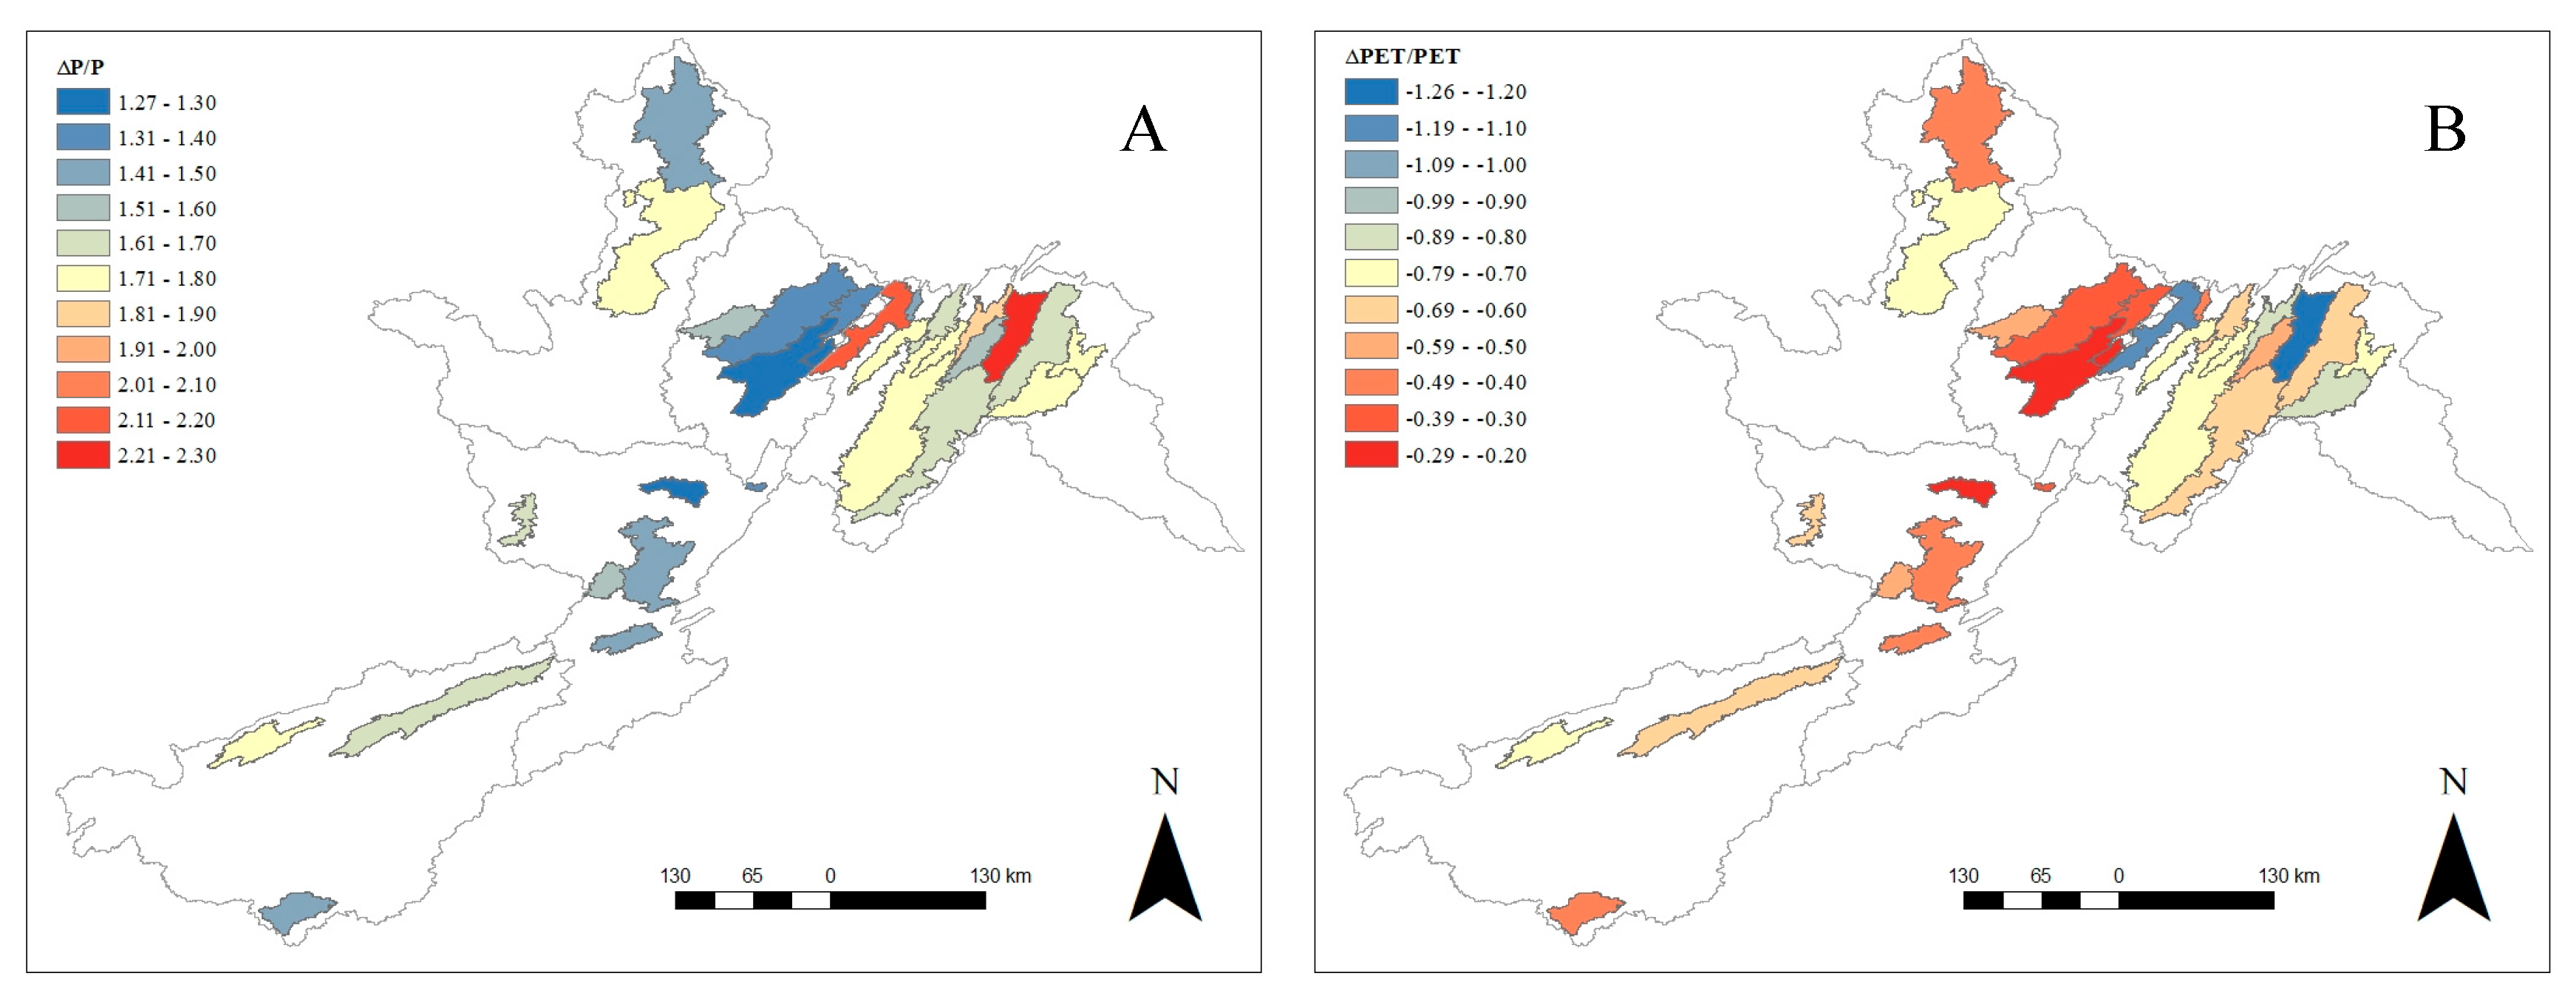
3.1. Historic Climate, Water Balance Components, and Streamflow Sensitivity throughout the Central Appalachian Mountains Region
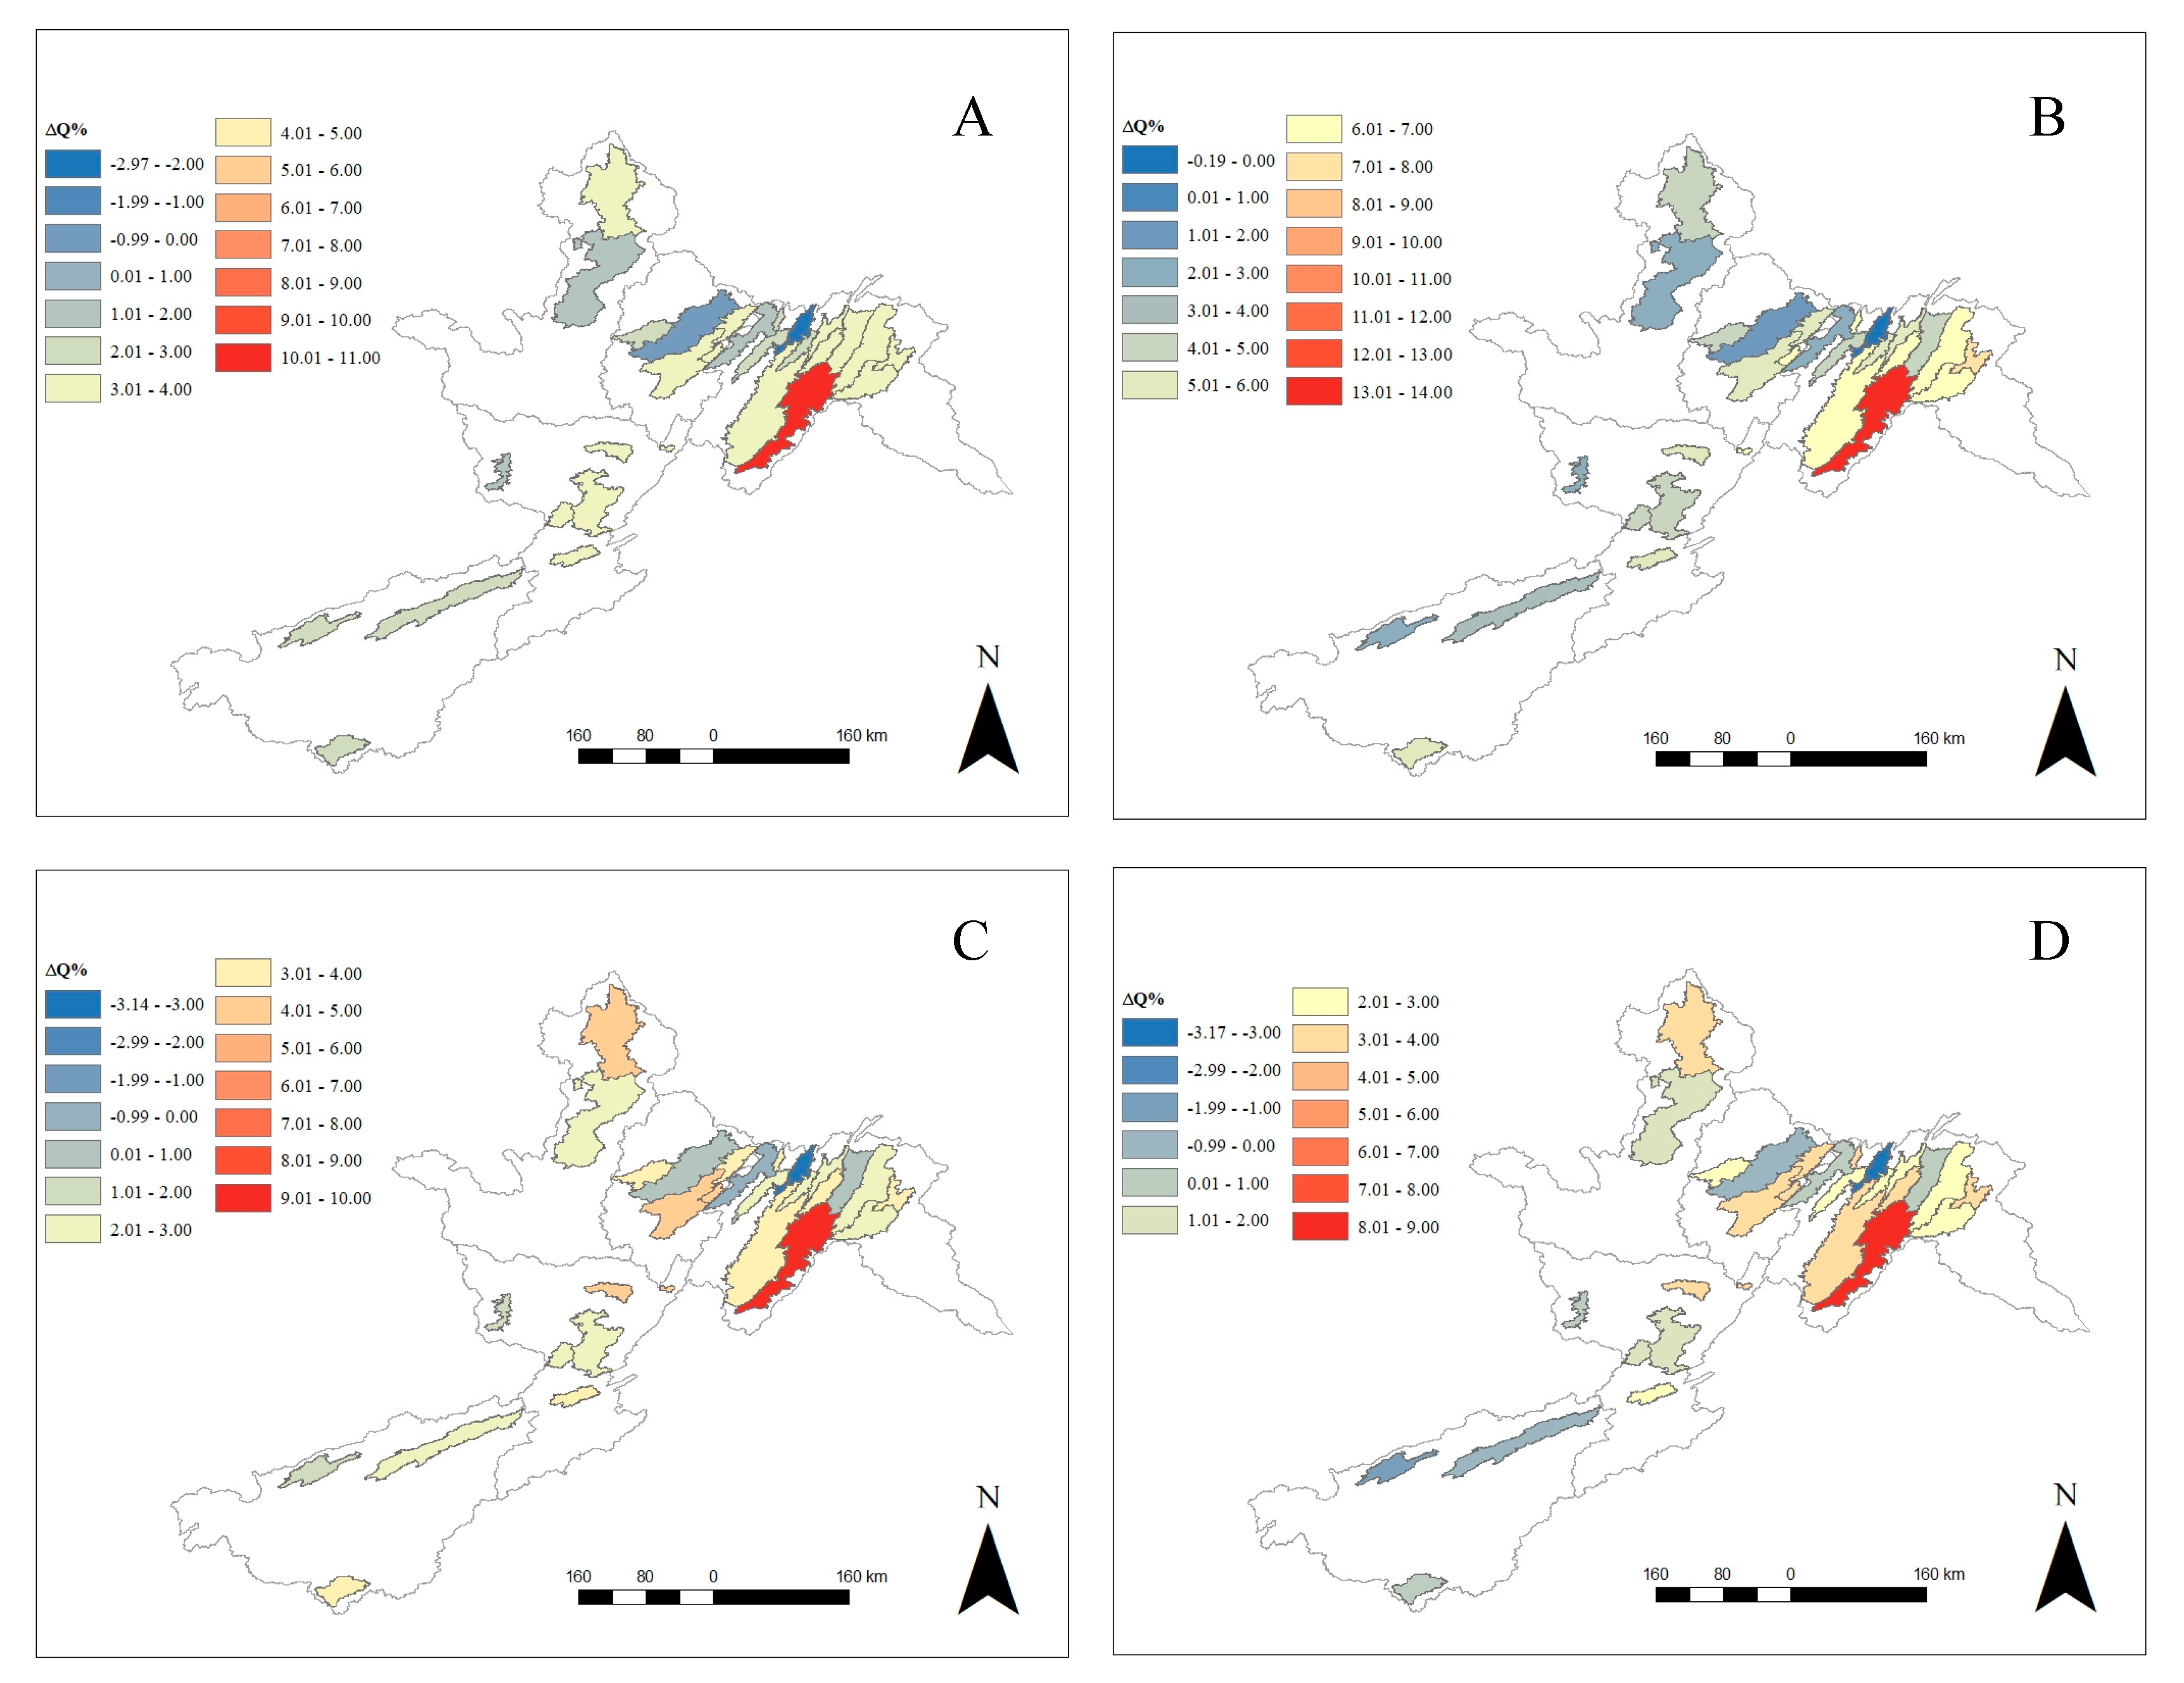
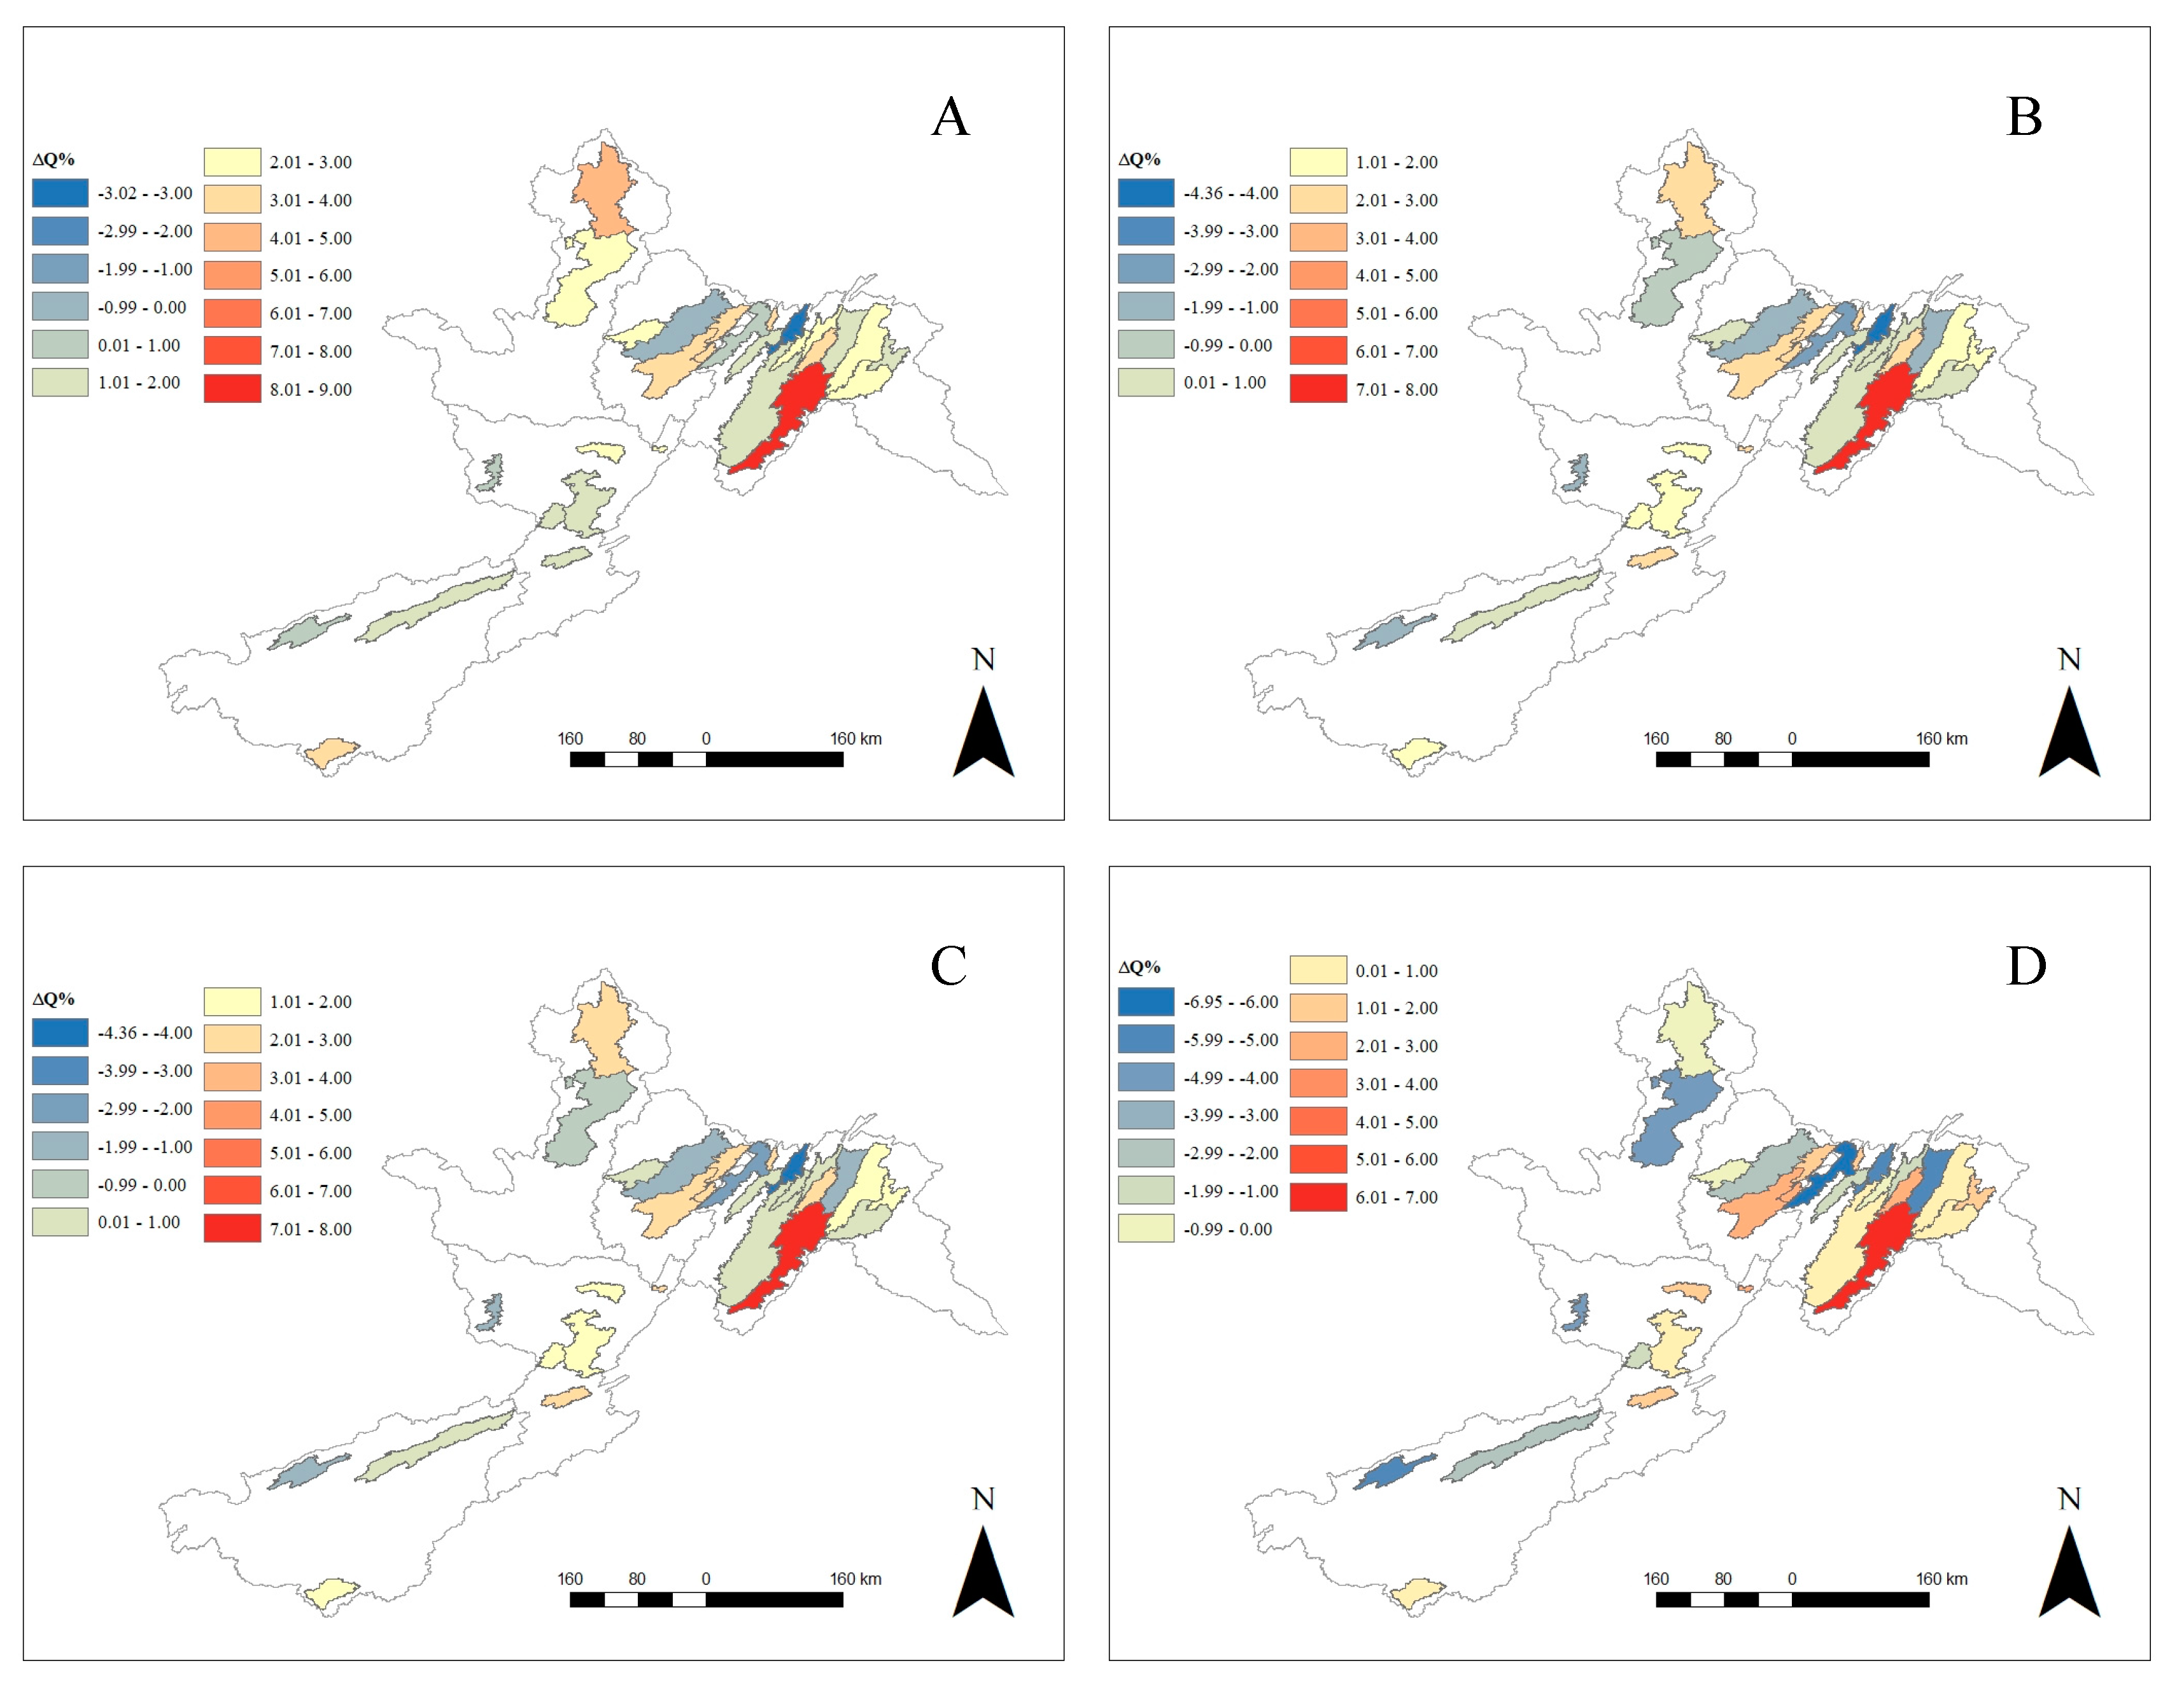
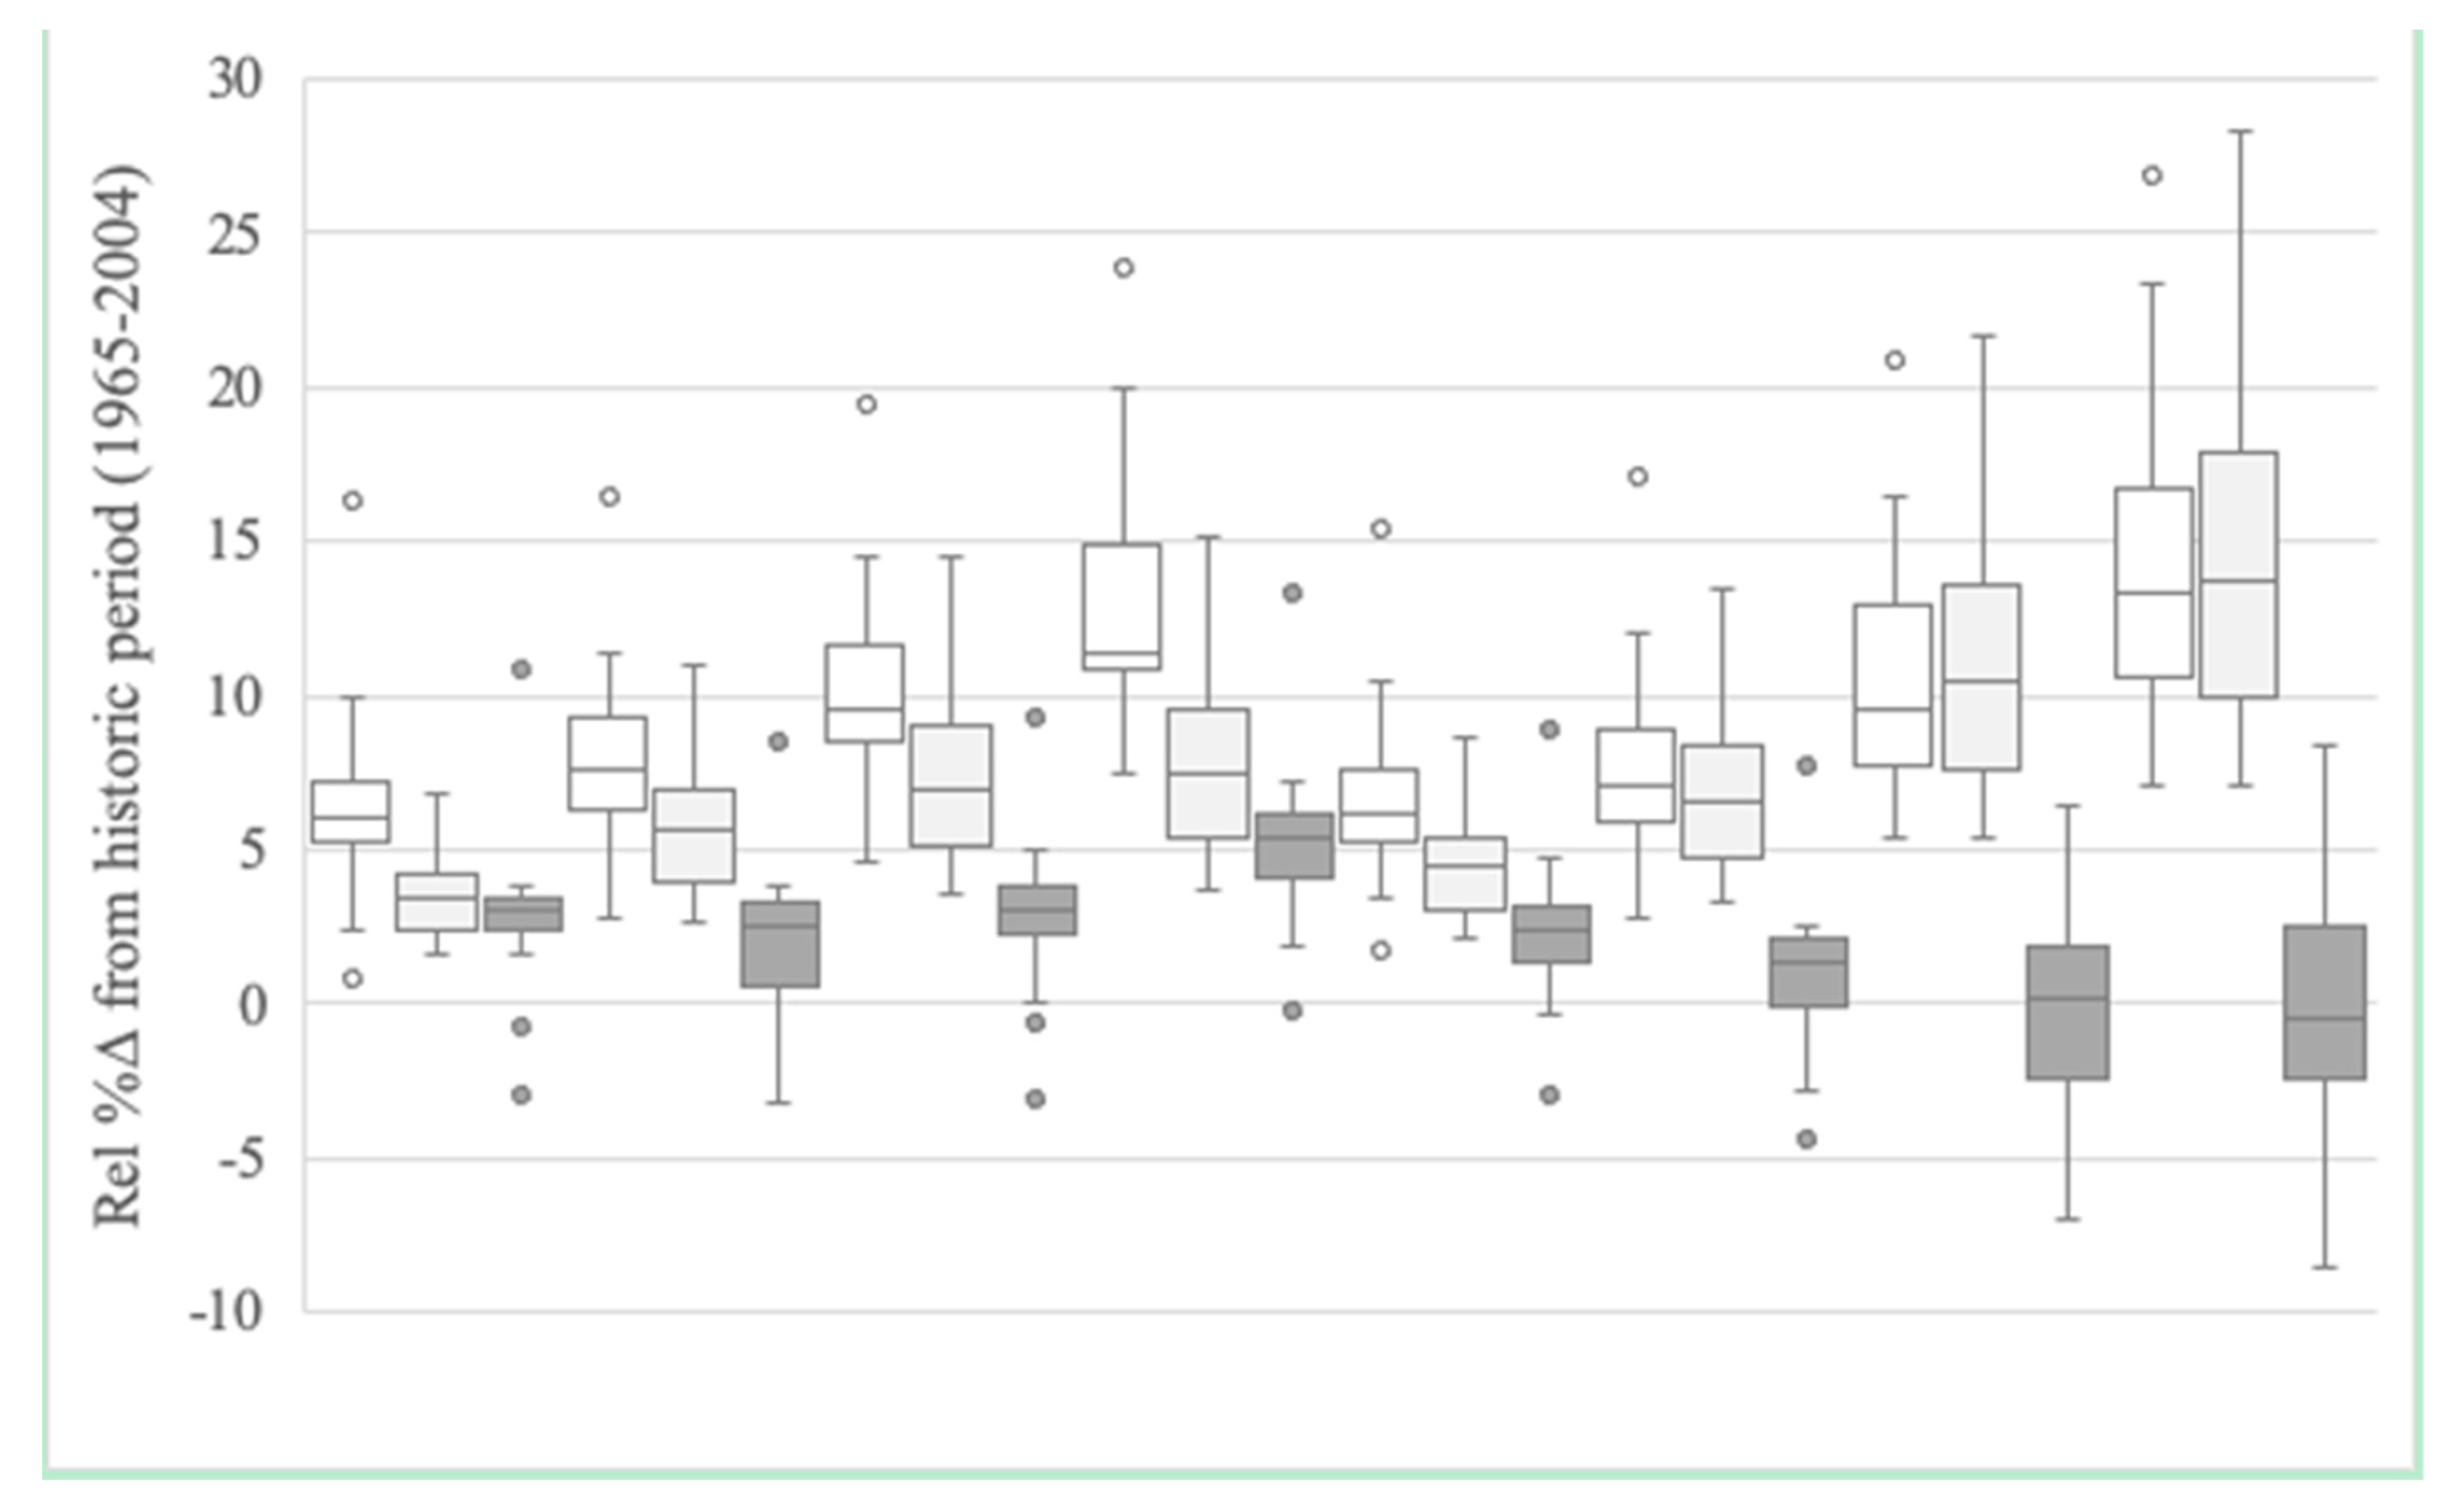
3.2. Twenty-First Century Climate and Streamflow
4. Discussion
4.1. Historic Climate, Water Balance Components, and Streamflow Sensitivity
4.2. Twenty-First Century Climate and Streamflow
5. Conclusions
Author Contributions
Funding
Conflicts of Interest
References
- Creed, I.F.; Jones, J.A.; Archer, E.; Claassen, M.; Ellison, D.; McNulty, S.G.; van Noordwijk, M.; Vira, B.; Wei, X.; Bishop, K.; et al. Managing Forests for Both Downstream and Downwind Water. Front. For. Glob. Chang. 2019, 2. [Google Scholar] [CrossRef]
- Duan, K.; Sun, G.; Caldwell, P.V.; McNulty, S.G.; Zhang, Y. Implications of Upstream Flow Availability for Watershed Surface Water Supply Across the Conterminous United States. JAWRA J. Am. Water Resour. Assoc. 2018, 54, 694–707. [Google Scholar] [CrossRef]
- Dudley, N.; Stolton, S. Running Pure: The Importance of Forest Protected Areas to Drinking Water; World Bank/WWF Alliance for Forest Conservation and Sustainable Use: Gland, Switzerland; Washington, DC, USA, 2003. [Google Scholar]
- Rodriguez-Iturbe, I.; Porporato, A. Ecohydrology of Water Controlled Ecosystems: Soil Moisture and Plant Dynamics; Cambridge University Press: Cambridge, UK, 2004. [Google Scholar]
- Viviroli, D.; Dürr, H.H.; Messerli, B.; Meybeck, M.; Weingartner, R. Mountains of the world, water towers for humanity: Typology, mapping, and global significance. Water Resour. Res. 2007, 43. [Google Scholar] [CrossRef]
- Viviroli, D.; Weingartner, R. The hydrological significance of mountains: from regional to global scale. Hydrol. Earth Syst. Sci. 2004, 8, 1017–1030. [Google Scholar] [CrossRef]
- Marston, L.; Ao, Y.; Konar, M.; Mekonnen Mesfin, M.; Hoekstra Arjen, Y. High-Resolution Water Footprints of Production of the United States. Water Resour. Res. 2018, 54, 2288–2316. [Google Scholar] [CrossRef]
- Hoekstra, A.Y.; Mekonnen, M.M. The water footprint of humanity. PNAS 2012, 109, 3232–3237. [Google Scholar] [CrossRef]
- Rushforth, R.R.; Ruddell, B.L. A spatially detailed blue water footprint of the United States economy. Hydrol. Earth Syst. Sci. 2018, 22, 3007–3032. [Google Scholar] [CrossRef]
- Brooks, R.P.; Limpisathian, P.W.; Gould, T.; Mazurczyk, T.; Sava, E.; Mitsch, W.J. Does the Ohio River Flow All the Way to New Orleans? JAWRA J. Am. Water Resour. Assoc. 2018, 54, 752–756. [Google Scholar] [CrossRef]
- Bates, B.; Kundzewicz, Z.W.; Wu, S.; Palutikof, J. Climate Change and Water: Technical Paper vi; Intergovernmental Panel on Climate Change (IPCC): Geneva, Switzerland, 2008. [Google Scholar]
- Vorosmarty, C.J.; Green, P.; Salisbury, J.; Lammers, R.B. Global Water Resources: Vulnerability from Climate Change and Population Growth. Science 2000, 289, 284–288. [Google Scholar] [CrossRef]
- Döll, P.; Fiedler, K.; Zhang, J. Global-scale analysis of river flow alterations due to water withdrawals and reservoirs. Hydrol. Earth Syst. Sci. 2009, 13, 2413–2432. [Google Scholar] [CrossRef]
- Budyko, M. Climate and Life; Academic: San Diego, CA, USA, 1974. [Google Scholar]
- Guo, D.; Westra, S.; Maier, H.R. Sensitivity of potential evapotranspiration to changes in climate variables for different Australian climatic zones. Hydrol. Earth Syst. Sci. 2017, 21, 2107–2126. [Google Scholar] [CrossRef]
- Fernandez, R.; Zegre, N. Seasonal Changes in Water and Energy Balances over the Appalachian Region and Beyond throughout the Twenty-First Century. J. Appl. Meteorol. Clim. 2019, 58, 1079–1102. [Google Scholar] [CrossRef]
- Milly, P.C.D.; Dunne, K.A. Potential evapotranspiration and continental drying. Nat. Clim. Chang. 2016, 6, 946–949. [Google Scholar] [CrossRef]
- Gudmundsson, L.; Greve, P.; Seneviratne, S.I. The sensitivity of water availability to changes in the aridity index and other factors—A probabilistic analysis in the Budyko space. Geophys. Res. Lett. 2016, 43, 6985–6994. [Google Scholar] [CrossRef]
- Arora, V.K. The use of the aridity index to assess climate change effect on annual runoff. J. Hydrol. 2002, 265, 164–177. [Google Scholar] [CrossRef]
- Huntington, T.G.; Richardson, A.D.; McGuire, K.J.; Hayhoe, K. Climate and hydrological changes in the northeastern United States: recent trends and implications for forested and aquatic ecosystemsThis article is one of a selection of papers from NE Forests 2100: A Synthesis of Climate Change Impacts on Forests of the Northeastern US and Eastern Canada. Can. J. For. Res. 2009, 39, 199–212. [Google Scholar]
- Hayhoe, K.; Wake, C.; Anderson, B.; Liang, X.-Z.; Maurer, E.; Zhu, J.; Bradbury, J.; DeGaetano, A.; Stoner, A.; Wuebbles, D. Regional climate change projections for the Northeast USA. Mitig. Adapt. Strateg. Glob. Chang. 2008, 13, 425–436. [Google Scholar] [CrossRef]
- Huntington, T.G. Evidence for intensification of the global water cycle: Review and synthesis. J. Hydrol. 2006, 319, 83–95. [Google Scholar] [CrossRef]
- Melillo, J.M.; Richmond, T.T.C.; Yohe, G. Chapter 16: Northeast; U.S. Global Change Research Program: Washington, DC, USA, 2014.
- Pachauri, R.K.; Allen, M.R.; Minx, J.C. Climate Change 2014: Synthesis Report; Cambridge University Press: Cambridge, UK, 2014. [Google Scholar]
- Walsh, K.J.E.; McBride, J.L.; Klotzbach, P.J.; Balachandran, S.; Camargo, S.J.; Holland, G.; Knutson, T.R.; Kossin, J.P.; Lee, T.-C.; Sobel, A.; et al. Tropical cyclones and climate change. Wiley Interdiscip. Rev. Clim. Chang. 2016, 7, 65–89. [Google Scholar] [CrossRef]
- Kutta, E.; Hubbart, J. Climatic Trends of West Virginia: A Representative Appalachian Microcosm. Water 2019, 11, 1117. [Google Scholar] [CrossRef]
- Douglas, E.M.; Vogel, R.M.; Kroll, C.N. Trends in floods and low flows in the United States: impact of spatial correlation. J. Hydrol. 2000, 240, 90–105. [Google Scholar] [CrossRef]
- McCabe, G.J.; Wolock, D.M. A step increase in streamflow in the conterminous United States. Geophys. Res. Lett. 2002, 29, 2185. [Google Scholar] [CrossRef]
- McCabe, G.J.; Wolock, D.M. Independent effects of temperature and precipitation on modeled runoff in the conterminous United States. Water Resour. Res. 2011, 47. [Google Scholar] [CrossRef]
- Gaertner, B.A.; Zegre, N.; Warner, T.; Fernandez, R.; He, Y.; Merriam, E.R. Climate, forest growing season, and evapotranspiration changes in the central Appalachian Mountains, USA. Sci. Total. Environ. 2019, 650, 1371–1381. [Google Scholar] [CrossRef] [PubMed]
- Hwang, T.; Band, L.E.; Miniat, C.F.; Song, C.; Bolstad, P.V.; Vose, J.M.; Love, J.P. Divergent phenological response to hydroclimate variability in forested mountain watersheds. Glob. Chang. Boil. 2014, 20, 2580–2595. [Google Scholar] [CrossRef] [PubMed]
- Hwang, T.; Martin, K.L.; Vose, J.M.; Wear, D.; Miles, B.; Kim, Y.; Band, L.E. Nonstationary Hydrologic Behavior in Forested Watersheds Is Mediated by Climate-Induced Changes in Growing Season Length and Subsequent Vegetation Growth. Water Resour. Res. 2018, 54, 5359–5375. [Google Scholar] [CrossRef]
- van Vuuren, D.P.; Edmonds, J.; Kainuma, M.; Riahi, K.; Thomson, A.; Hibbard, K.; Hurtt, G.C.; Kram, T.; Krey, V.; Lamarque, J.-F.; et al. The representative concentration pathways: an overview. Clim. Chang. 2011, 109, 5. [Google Scholar] [CrossRef]
- Donohue, R.J.; Roderick, M.L.; McVicar, T.R. Roots, storms and soil pores: Incorporating key ecohydrological processes into Budyko’s hydrological model. J. Hydrol. 2012, 436–437, 35–50. [Google Scholar] [CrossRef]
- Roderick, M.L.; Farquhar, G.D. A simple framework for relating variations in runoff to variations in climatic conditions and catchment properties. Water Resour. Res. 2011, 47, W00G07. [Google Scholar] [CrossRef]
- Devineni, N.; Lall, U.; Etienne, E.; Shi, D.; Xi, C. America’s water risk: Current demand and climate variability. Geophys. Res. Lett. 2015, 42, 2285–2293. [Google Scholar] [CrossRef]
- Baran, A.A.; Moglen, G.E.; Godrej, A.N. Quantifying Hydrological Impacts of Climate Change Uncertainties on a Watershed in Northern Virginia. J. Hydrol. Eng. 2019, 24, 05019030. [Google Scholar] [CrossRef]
- Demaria, E.M.C.; Palmer, R.N.; Roundy, J.K. Regional climate change projections of streamflow characteristics in the Northeast and Midwest U.S. J. Hydrol. Reg. Stud. 2016, 5, 309–323. [Google Scholar] [CrossRef]
- Stagge, J.H.; Moglen, G.E. Water Resources Adaptation to Climate and Demand Change in the Potomac River. J. Hydrol. Eng. 2017, 22, 04017050. [Google Scholar] [CrossRef]
- Wu, S.-Y. Potential impact of climate change on flooding in the Upper Great Miami River Watershed, Ohio, USA: a simulation-based approach. Hydrol. Sci. J. 2010, 55, 1251–1263. [Google Scholar] [CrossRef]
- Najjar, R.G.; Pyke, C.R.; Adams, M.B.; Breitburg, D.; Hershner, C.; Kemp, M.; Howarth, R.; Mulholland, M.R.; Paolisso, M.; Secor, D.; et al. Potential climate-change impacts on the Chesapeake Bay. Estuarine Coast. Shelf Sci. 2010, 86, 1–20. [Google Scholar] [CrossRef]
- Hayhoe, K.; Wake, C.; Huntington, T.; Luo, L.; Schwartz, M.; Sheffield, J.; Wood, E.; Anderson, B.; Bradbury, J.; DeGaetano, A.; et al. Past and future changes in climate and hydrological indicators in the US Northeast. Clim. Dyn. 2007, 28, 381–407. [Google Scholar] [CrossRef]
- Hawkins, T.W.; Austin, B.J. Simulating streamflow and the effects of projected climate change on the Savage River, Maryland, USA. J. Water Clim. Chang. 2012, 3, 28–43. [Google Scholar] [CrossRef]
- Lins, H.F. USGS Hydro-Climatic Data Network 2009 (HCDN–2009); U.S. Geologic Survey: Reston, VA, USA, 2012; 4p.
- Slack, J.R.; Landwehr, J.M. Hydro-climatic Data Network (HCDN): A U.S. Geological Survey Streamflow Data Set for the United States for the Study of Climate Variations, 1874–1988; U.S. Geological Survey: Reston, VA, USA, 1998.
- Wang, D.; Hejazi, M. Quantifying the relative contribution of the climate and direct human impacts on mean annual streamflow in the contiguous United States. Water Resour. Res. 2011, 47. [Google Scholar] [CrossRef]
- Sankarasubramanian, A.; Vogel, R.M.; Limbrunner, J.F. Climate elasticity of streamflow in the United States. Water Resour. Res. 2001, 37, 1771–1781. [Google Scholar] [CrossRef]
- Small, D.; Islam, S.; Vogel, R.M. Trends in precipitation and streamflow in the eastern US: Paradox or perception? Geophys. Res. Lett. 2006, 33. [Google Scholar] [CrossRef]
- Krakauer, N.; Fung, I. Mapping and attribution of change in streamflow in the coterminous United States. Hydrol. Earth Syst. Sci. 2008, 12, 1111–1120. [Google Scholar] [CrossRef]
- Luce, C.; Staab, B.; Kramer, M.; Wenger, S.; Isaak, D.; McConnell, C. Sensitivity of summer stream temperatures to climate variability in the Pacific Northwest. Water Resour. Res. 2014, 50, 3428–3443. [Google Scholar] [CrossRef]
- Patterson, L.A.; Lutz, B.; Doyle, M.W. Climate and direct human contributions to changes in mean annual streamflow in the South Atlantic, USA. Water Resour. Res. 2013, 49, 7278–7291. [Google Scholar] [CrossRef]
- Trewin, B.C. The Role of Climatological Normals in a Changing Climate; World Meteorological Organization: Geneva, Switzerland, 2007. [Google Scholar]
- Jones, J.A.; Creed, I.F.; Hatcher, K.L.; Warren, R.J.; Adams, M.B.; Benson, M.H.; Boose, E.; Brown, W.A.; Campbell, J.L.; Covich, A.; et al. Ecosystem processes and human influences regulate streamflow response to climate change at long-term ecological research sites. BioScience 2012, 62, 390–404. [Google Scholar] [CrossRef]
- Homer, C.; Dewitz, J.; Fry, J.; Coan, M.; Hossain, N.; Larson, C.; Herold, N.; McKerrow, A.; VanDriel, J.N.; Wickham, J. Completion of the 2001 national land cover database for the counterminous United States. Photogram. Eng. Remote Sens. 2007, 73, 337. [Google Scholar]
- Abatzoglou, J.T. Development of gridded surface meteorological data for ecological applications and modelling. Int. J. Clim. 2013, 33, 121–131. [Google Scholar] [CrossRef]
- Abatzoglou, J.T.; Brown, T.J. A comparison of statistical downscaling methods suited for wildfire applications. Int. J. Clim. 2012, 32, 772–780. [Google Scholar] [CrossRef]
- Meinshausen, M.; Smith, S.J.; Calvin, K.; Daniel, J.S.; Kainuma, M.; Lamarque, J.-F.; Matsumoto, K.; Montzka, S.; Raper, S.; Riahi, K. The RCP greenhouse gas concentrations and their extensions from 1765 to 2300. Clim. Chang. 2011, 109, 213. [Google Scholar] [CrossRef]
- Rocheta, E.; Sugiyanto, M.; Johnson, F.; Evans, J.; Sharma, A. How well do general circulation models represent low-frequency rainfall variability? Water Resour. Res. 2014, 50, 2108–2123. [Google Scholar] [CrossRef]
- Tamaddun, K.A.; Kalra, A.; Kumar, S.; Ahmad, S. CMIP5 Models’ Ability to Capture Observed Trends under the Influence of Shifts and Persistence: An In-Depth Study on the Colorado River Basin. J. Appl. Meteorol. Clim. 2019, 58, 1677–1688. [Google Scholar] [CrossRef]
- Tamaddun, K.A.; Kalra, A.; Ahmad, S. Spatiotemporal Variation in the Continental US Streamflow in Association with Large-Scale Climate Signals Across Multiple Spectral Bands. Water Resour. Manag. 2019, 33, 1947–1968. [Google Scholar] [CrossRef]
- Papadimitriou, L.V.; Koutroulis, A.G.; Grillakis, M.G.; Tsanis, I.K. The effect of GCM biases on global runoff simulations of a land surface model. Hydrol. Earth Syst. Sci. 2017, 21, 4379–4401. [Google Scholar] [CrossRef]
- Mote, P.; Brekke, L.; Duffy, P.B.; Maurer, E. Guidelines for constructing climate scenarios. Eos Trans. Am. Geophys. Union 2011, 92, 257–258. [Google Scholar] [CrossRef]
- Wang, X. Advances in separating effects of climate variability and human activity on stream discharge: An overview. Adv. Water Resour. 2014, 71, 209–218. [Google Scholar] [CrossRef]
- Choudhury, B. Evaluation of an empirical equation for annual evaporation using field observations and results from a biophysical model. J. Hydrol. 1999, 216, 99–110. [Google Scholar] [CrossRef]
- Padrón, R.S.; Gudmundsson, L.; Greve, P.; Seneviratne, S.I. Large-Scale Controls of the Surface Water Balance Over Land: Insights From a Systematic Review and Meta-Analysis. Water Resour. Res. 2017, 53, 9659–9678. [Google Scholar] [CrossRef]
- Budyko, M. Climate and Life, 508 pp; Academic Press: Cambridge, MA, USA, 1974; Volume 508, pp. 72–191. [Google Scholar]
- Li, L.J.; Zhang, L.; Wang, H.; Wang, J.; Yang, J.W.; Jiang, D.J.; Li, J.Y.; Qin, D.Y. Assessing the impact of climate variability and human activities on streamflow from the Wuding River basin in China. Hydrol. Process. 2007, 21, 3485–3491. [Google Scholar] [CrossRef]
- Roman, D.; Novick, K.; Brzostek, E.; Dragoni, D.; Rahman, F.; Phillips, R. The role of isohydric and anisohydric species in determining ecosystem-scale response to severe drought. Oecologia 2015, 179, 641–654. [Google Scholar] [CrossRef]
- Caldwell, P.V.; Miniat, C.F.; Elliott, K.J.; Swank, W.T.; Brantley, S.T.; Laseter, S.H. Declining water yield from forested mountain watersheds in response to climate change and forest mesophication. Glob. Chang. Boil. 2016, 22, 2997–3012. [Google Scholar] [CrossRef]
- Sankarasubramanian, A.; Vogel, R.M. Hydroclimatology of the continental United States. Geophys. Res. Lett. 2003, 30. [Google Scholar] [CrossRef]
- Gao, G.; Fu, B.; Wang, S.; Liang, W.; Jiang, X. Determining the hydrological responses to climate variability and land use/cover change in the Loess Plateau with the Budyko framework. Sci. Total. Environ. 2016, 557, 331–342. [Google Scholar] [CrossRef]
- Milly, P.C.D. Climate, soil water storage, and the average annual water balance. Water Resour. Res. 1994, 30, 2143–2156. [Google Scholar] [CrossRef]
- Cooper, M.G.; Schaperow, J.R.; Cooley, S.W.; Alam, S.; Smith, L.C.; Lettenmaier, D.P. Climate Elasticity of Low Flows in the Maritime Western U.S. Mountains. Water Resour. Res. 2018, 54, 5602–5619. [Google Scholar] [CrossRef]
- Kutta, E.; Hubbart, J.A. Changing Climatic Averages and Variance: Implications for Mesophication at the Eastern Edge of North America’s Eastern Deciduous Forest. Forests 2018, 9, 605. [Google Scholar] [CrossRef]
- Drohan, P.J.; Brittingham, M.; Bishop, J.; Yoder, K. Early Trends in Landcover Change and Forest Fragmentation Due to Shale-Gas Development in Pennsylvania: A Potential Outcome for the Northcentral Appalachians. Environ. Manag. 2012, 49, 1061–1075. [Google Scholar] [CrossRef]
- Miller, A.; Zégre, N. Landscape-Scale Disturbance: Insights into the Complexity of Catchment Hydrology in the Mountaintop Removal Mining Region of the Eastern United States. Land 2016, 5, 22. [Google Scholar] [CrossRef]
- Sayler, K.L. Land Cover Trends: Central Appalachians. Available online: https://pubs.usgs.gov/ds/844/pdf/ds844.pdf (accessed on 30 November 2019).
- Kochenderfer, J.N.; Adams, M.B.; Miller, G.W.; Helvey, D.J. Factors affecting large peakflows on Appalachian watersheds: lessons from the Fernow Experimental Forest; U.S. Department of Agriculture, Forest Service, Northern Research Station: Newtown Square, PA, USA, 2007.
- Kochenderfer, J.N.; Edwards, P.; Wood, F. Hydrologic Impacts of Logging an Appalachian Watershed Using West Virginia’s Best Management Practices. North. J. Appl. For. 1997, 14, 207–218. [Google Scholar]
- Messinger, T. Comparison of Storm Response of Streams in Small, Unmined and Valley-Filled Watersheds, 1999–2001, Ballard Fork, West Virginia; USGS: Reston, VA, USA, 2003.
- Roy, A.H.; Dybas, A.L.; Fritz, K.M.; Lubbers, H.R. Urbanization affects the extent and hydrologic permanence of headwater streams in a midwestern US metropolitan area. J. North Am. Benthol. Soc. 2009, 28, 911–928. [Google Scholar] [CrossRef]
- Bosch, J.M.; Hewlett, J.D. A review of catchment experiments to determine the effect of vegetation changes on water yield and evapotranspiration. J. Hydrol. 1982, 55, 3–23. [Google Scholar] [CrossRef]
- Evaristo, J.; McDonnell, J.J. Global analysis of streamflow response to forest management. Nature 2019, 570, 455–461. [Google Scholar] [CrossRef]
- Hornbeck, J.W.; Adams, M.B.; Corbett, E.S.; Verry, E.S.; Lynch, J.A. Long-term impacts of forest treatments on water yield: a summary for northeastern USA. J. Hydrol. 1993, 150, 323–344. [Google Scholar] [CrossRef]
- Wullschleger, S.D.; Hanson, P.J.; Todd, D.E. Transpiration from a multi-species deciduous forest as estimated by xylem sap flow techniques. For. Ecol. Manag. 2001, 143, 205–213. [Google Scholar] [CrossRef]
- Ford, C.R.; Laseter, S.H.; Swank, W.T.; Vose, J.M. Can forest management be used to sustain water-based ecosystem services in the face of climate change? Ecol. Appl. 2011, 21, 2049–2067. [Google Scholar] [CrossRef]
- Young, D.; Zégre, N.; Edwards, P.; Fernandez, R. Assessing streamflow sensitivity of forested headwater catchments to disturbance and climate change in the central Appalachian Mountains region, USA. Sci. Total. Environ. 2019. [Google Scholar] [CrossRef]
- Nowacki, G.J.; Abrams, M.D. The Demise of Fire and “Mesophication” of Forests in the Eastern United States. BioScience 2008, 58, 123–138. [Google Scholar] [CrossRef]
- Caldwell, P.; Muldoon, C.; Ford-Miniat, C.; Cohen, E.; Krieger, S.; Sun, G.; McNulty, S.; Bolstad, P.V. Quantifying the Role of National Forest System Lands in Providing Surface Drinking Water Supply for the Southern United States; U.S. Department of Agriculture Forest Service, Southern Research Station: Asheville, NC, USA, 2014.
- Brzostek, E.R.; Dragoni, D.; Schmid, H.P.; Rahman, A.F.; Sims, D.; Wayson, C.A.; Johnson, D.J.; Phillips, R.P. Chronic water stress reduces tree growth and the carbon sink of deciduous hardwood forests. Glob. Chang. Boil. 2014, 20, 2531–2539. [Google Scholar] [CrossRef]
- Schuler, T.M.; McGill, D.W. Long-Term Assessment of Financial Maturity, Diameter-Limit Selection in the Central Appalachians; USDA Forest Service: Washington, DC, USA, 2007; 16p.
- Kang, H.; Sridhar, V. Assessment of Future Drought Conditions in the Chesapeake Bay Watershed. JAWRA J. Am. Water Resour. Assoc. 2018, 54, 160–183. [Google Scholar] [CrossRef]
- Fernandez, R.; Sayama, T. Comparison of future runoff projections using Budyko framework and global hydrologic model: conceptual simplicity vs process complexity. Hydrol. Res. Lett. 2015, 9, 75–83. [Google Scholar] [CrossRef][Green Version]


| Basin/Station Name | Sensitivity Coefficeints | ||||||||||||
|---|---|---|---|---|---|---|---|---|---|---|---|---|---|
| ID | Station Number | Area | P | Q | E | PET | PET/P | E/P | n | ΔP/P | ΔPET/PET | Δn/n | |
| km2 | mm | mm | mm | mm | - | - | - | - | - | - | |||
| Monongahela | |||||||||||||
| Casselman River at Grantsville, MD | 1M | 3078000 | 163 | 1172 | 678 | 494 | 1228 | 1.05 | 0.42 | 0.78 | 1.36 | −0.36 | 0.65 |
| West Fork River at Enterprise, WV | 2M | 3061000 | 1965 | 1170 | 529 | 641 | 1310 | 1.12 | 0.55 | 1.06 | 1.57 | −0.57 | 0.79 |
| Youghiogheny River near Oakland, MD | 3M | 3075500 | 347 | 1275 | 824 | 451 | 1203 | 0.94 | 0.35 | 0.69 | 1.28 | −0.28 | 0.55 |
| Laurel Hill Creek at Ursina, PA | 4M | 3080000 | 313 | 1275 | 778 | 497 | 1203 | 0.94 | 0.39 | 0.76 | 1.33 | −0.33 | 0.58 |
| Cheat River near Parsons, WV | 5M | 3069500 | 1869 | 1329 | 870 | 459 | 1215 | 0.91 | 0.35 | 0.68 | 1.27 | −0.27 | 0.54 |
| Basin average | 932 | 1244 | 736 | 508 | 1232 | 0.99 | 0.41 | 0.79 | 1.36 | −0.36 | 0.62 | ||
| Ohio | |||||||||||||
| Little Shenango River at Greenville, PA | 1O | 3102500 | 269 | 1012 | 490 | 522 | 1253 | 1.24 | 0.52 | 0.91 | 1.48 | −0.48 | 0.81 |
| Little Beaver Creek near East Liverpool, OH | 2O | 3109500 | 1284 | 1047 | 376 | 671 | 1316 | 1.26 | 0.64 | 1.26 | 1.76 | −0.76 | 0.97 |
| Basin average | 777 | 1029 | 433 | 596 | 1285 | 1.25 | 0.58 | 1.08 | 1.62 | −0.62 | 0.89 | ||
| Kanawha | |||||||||||||
| Wolf Creek near Narrows, VA | 1K | 3175500 | 577 | 1002 | 481 | 520 | 1414 | 1.41 | 0.52 | 0.85 | 1.46 | −0.46 | 0.87 |
| Greenbrier River at Durbin, WV | 2K | 3180500 | 344 | 1246 | 719 | 527 | 1187 | 0.95 | 0.42 | 0.83 | 1.37 | −0.37 | 0.61 |
| Williams River at Dyer, WV | 3K | 3186500 | 331 | 1479 | 949 | 530 | 1224 | 0.83 | 0.36 | 0.75 | 1.30 | −0.30 | 0.52 |
| Big Coal River at Ashford, WV | 4K | 3198500 | 1012 | 1196 | 490 | 706 | 1376 | 1.15 | 0.59 | 1.17 | 1.66 | −0.66 | 0.85 |
| Bluestone River at Pipestem, WV | 5K | 3179000 | 1020 | 1018 | 423 | 595 | 1381 | 1.36 | 0.58 | 1.02 | 1.59 | −0.59 | 0.94 |
| Greenbrier River at Alderson, WV | 6K | 3183500 | 3531 | 1080 | 520 | 560 | 1304 | 1.21 | 0.52 | 0.93 | 1.49 | −0.49 | 0.80 |
| Basin average | 1136 | 1170 | 597 | 573 | 1314 | 1.15 | 0.50 | 0.92 | 1.48 | −0.48 | 0.76 | ||
| Tennessee | |||||||||||||
| North Fork Holston River near Saltsville, VA | 1T | 3488000 | 572 | 1155 | 481 | 674 | 1435 | 1.24 | 0.58 | 1.08 | 1.62 | −0.62 | 0.89 |
| Clinch River above Tazewell, TN | 2T | 3528000 | 3816 | 1275 | 485 | 791 | 1433 | 1.12 | 0.62 | 1.30 | 1.75 | −0.75 | 0.87 |
| Little Tennessee River near Prentiss, NC | 3T | 3500000 | 362 | 1695 | 960 | 735 | 1443 | 0.85 | 0.43 | 0.92 | 1.41 | −0.41 | 0.57 |
| Basin average | 1584 | 1375 | 642 | 733 | 1437 | 1.07 | 0.55 | 1.10 | 1.59 | −0.59 | 0.78 | ||
| Potomac | |||||||||||||
| Wills Creek near Cumberland, MD | 1P | 1601500 | 639 | 988 | 494 | 494 | 1352 | 1.37 | 0.50 | 0.82 | 1.44 | −0.44 | 0.83 |
| Pototmac River near at Paw Paw, WV | 2P | 1610000 | 8101 | 988 | 398 | 591 | 1352 | 1.37 | 0.60 | 1.05 | 1.62 | −0.62 | 0.96 |
| Cacapon River near Great Cacapon, WV | 3P | 1611500 | 1748 | 998 | 321 | 677 | 1387 | 1.39 | 0.68 | 1.29 | 1.84 | −0.83 | 1.09 |
| Patterson Creek near Headsville, WV | 4P | 1604500 | 572 | 1071 | 283 | 788 | 1303 | 1.22 | 0.74 | 1.75 | 2.16 | −1.16 | 1.08 |
| Bennett Creek at Park Mills, MD | 5P | 1634500 | 163 | 1040 | 399 | 641 | 1413 | 1.36 | 0.62 | 1.11 | 1.67 | −0.67 | 0.98 |
| South Branch Potoamc River near Springfield, WV | 6P | 1608500 | 3783 | 973 | 347 | 626 | 1364 | 1.40 | 0.64 | 1.17 | 1.73 | −0.73 | 1.04 |
| Conococheague Creek and Fairview, MD | 7P | 1614500 | 1279 | 1004 | 452 | 552 | 1404 | 1.40 | 0.55 | 0.92 | 1.52 | −0.52 | 0.90 |
| Marsh Run at Grimes, MD | 8P | 1617800 | 49 | 1014 | 223 | 791 | 1427 | 1.41 | 0.78 | 1.76 | 2.26 | −1.26 | 1.31 |
| North Branch Potomac River at Steyer, MD | 9P | 1595000 | 189 | 941 | 322 | 619 | 1342 | 1.43 | 0.66 | 1.20 | 1.76 | −0.76 | 1.08 |
| Catoctin Creek near Middletown, MD | 10P | 1637500 | 173 | 1063 | 419 | 644 | 1424 | 1.34 | 0.61 | 1.09 | 1.65 | −0.65 | 0.96 |
| Goose Creek near Leesburg, VA | 11P | 1644000 | 860 | 1081 | 366 | 715 | 1441 | 1.33 | 0.66 | 1.27 | 1.80 | −0.80 | 1.04 |
| North Fork Shenandoah River at Cootes Store, VA | 12P | 1632000 | 544 | 995 | 348 | 647 | 1382 | 1.39 | 0.65 | 1.20 | 1.75 | −0.75 | 1.05 |
| Cedar Creek near Winchester, VA | 13P | 1643500 | 264 | 1040 | 366 | 674 | 1413 | 1.36 | 0.65 | 1.22 | 1.76 | −0.76 | 1.03 |
| Basin average | 1413 | 1015 | 364 | 651 | 1385 | 1.37 | 0.64 | 1.22 | 1.76 | −0.76 | 1.03 | ||
| Regional average | 1246 | 1125 | 510 | 615 | 1342 | 1.22 | 0.56 | 1.06 | 1.61 | −0.61 | 0.87 | ||
| ±std. dev. | 1671 | 167 | 198 | 98 | 82 | 0.19 | 0.11 | 0.26 | 0.23 | 0.23 | 0.20 | ||
| RCP4.5 | Q1 (2005–2025) | Q2 (2026–2050) | Q3 (2051–2075) | Q4 (2076–2099) | ||||||||||||||||||||
|---|---|---|---|---|---|---|---|---|---|---|---|---|---|---|---|---|---|---|---|---|---|---|---|---|
| Basin/Station Name | P | DP | PET | DPET | AI | DAI | P | DP | PET | DPET | AI | DAI | P | DP | PET | DPET | AI | DAI | P | DP | PET | DPET | AI | DAI |
| mm | % | mm | % | - | % | mm | % | mm | % | - | % | mm | % | mm | % | - | % | mm | % | mm | % | - | % | |
| Monongahela | ||||||||||||||||||||||||
| Casselman River at Grantsville, MD | 1217 | 4 | 1302 | 6 | 1.07 | 2 | 1230 | 5 | 1349 | 10 | 1.10 | 5 | 1245 | 6 | 1389 | 13 | 1.12 | 7 | 1266 | 8 | 1396 | 14 | 1.10 | 5 |
| West Fork River at Enterprise, WV | 1212 | 4 | 1385 | 6 | 1.14 | 2 | 1228 | 5 | 1430 | 9 | 1.16 | 4 | 1247 | 7 | 1467 | 12 | 1.18 | 5 | 1260 | 8 | 1475 | 13 | 1.17 | 5 |
| Youghiogheny River near Oakland, MD | 1324 | 4 | 1275 | 6 | 0.96 | 2 | 1340 | 5 | 1321 | 10 | 0.99 | 5 | 1359 | 7 | 1359 | 13 | 1.00 | 6 | 1374 | 8 | 1367 | 14 | 0.99 | 5 |
| Laurel Hill Creek at Ursina, PA | 1298 | 2 | 1318 | 10 | 1.02 | 8 | 1313 | 3 | 1364 | 13 | 1.04 | 10 | 1331 | 4 | 1402 | 17 | 1.05 | 12 | 1347 | 6 | 1410 | 17 | 1.05 | 11 |
| Cheat River near Parsons, WV | 1379 | 4 | 1288 | 6 | 0.93 | 2 | 1394 | 5 | 1336 | 10 | 0.96 | 5 | 1418 | 7 | 1372 | 13 | 0.97 | 6 | 1430 | 8 | 1381 | 14 | 0.97 | 6 |
| Basin average | 1286 | 3 | 1314 | 7 | 1.03 | 3 | 1301 | 5 | 1360 | 10 | 1.05 | 6 | 1320 | 6 | 1398 | 14 | 1.06 | 7 | 1335 | 7 | 1406 | 14 | 1.06 | 6 |
| Ohio | ||||||||||||||||||||||||
| Little Shenango River at Greenville, PA | 1058 | 4 | 1328 | 6 | 1.26 | 1 | 1066 | 5 | 1372 | 10 | 1.29 | 4 | 1084 | 7 | 1412 | 13 | 1.30 | 5 | 1090 | 8 | 1421 | 13 | 1.30 | 5 |
| Little Beaver Creek near East Liverpool, OH | 1084 | 4 | 1394 | 6 | 1.29 | 2 | 1099 | 5 | 1438 | 9 | 1.31 | 4 | 1116 | 7 | 1476 | 12 | 1.32 | 5 | 1123 | 7 | 1485 | 13 | 1.32 | 5 |
| Basin average | 1071 | 4 | 1361 | 6 | 1.27 | 2 | 1083 | 5 | 1405 | 9 | 1.30 | 4 | 1100 | 7 | 1444 | 12 | 1.31 | 5 | 1106 | 7 | 1453 | 13 | 1.31 | 5 |
| Kanawha | ||||||||||||||||||||||||
| Wolf Creek near Narrows, VA | 1040 | 4 | 1486 | 5 | 1.43 | 1 | 1047 | 4 | 1537 | 9 | 1.47 | 4 | 1063 | 6 | 1570 | 11 | 1.48 | 5 | 1076 | 7 | 1579 | 12 | 1.47 | 4 |
| Greenbrier River at Durbin, WV | 1298 | 4 | 1259 | 6 | 0.97 | 2 | 1316 | 6 | 1309 | 10 | 0.99 | 4 | 1331 | 7 | 1345 | 13 | 1.01 | 6 | 1349 | 8 | 1354 | 14 | 1.00 | 5 |
| Williams River at Dyer, WV | 1533 | 4 | 1293 | 6 | 0.84 | 2 | 1548 | 5 | 1341 | 10 | 0.87 | 5 | 1569 | 6 | 1376 | 12 | 0.88 | 6 | 1586 | 7 | 1385 | 13 | 0.87 | 6 |
| Big Coal River at Ashford, WV | 1235 | 3 | 1451 | 5 | 1.18 | 2 | 1242 | 4 | 1500 | 9 | 1.21 | 5 | 1261 | 5 | 1531 | 11 | 1.21 | 6 | 1274 | 7 | 1543 | 12 | 1.21 | 5 |
| Bluestone River at Pipestem, WV | 1058 | 4 | 1453 | 5 | 1.37 | 1 | 1062 | 4 | 1504 | 9 | 1.42 | 4 | 1079 | 6 | 1537 | 11 | 1.42 | 5 | 1090 | 7 | 1547 | 12 | 1.42 | 5 |
| Greenbrier River at Alderson, WV | 1123 | 4 | 1373 | 5 | 1.22 | 1 | 1127 | 4 | 1422 | 9 | 1.26 | 5 | 1143 | 6 | 1455 | 12 | 1.27 | 6 | 1157 | 7 | 1465 | 12 | 1.27 | 5 |
| Basin average | 1214 | 4 | 1386 | 5 | 1.17 | 2 | 1223 | 5 | 1436 | 9 | 1.20 | 5 | 1241 | 6 | 1469 | 12 | 1.21 | 5 | 1255 | 7 | 1479 | 13 | 1.21 | 5 |
| Tennessee | ||||||||||||||||||||||||
| North Fork Holston River near Saltsville, VA | 1195 | 3 | 1516 | 6 | 1.27 | 2 | 1196 | 4 | 1569 | 9 | 1.31 | 6 | 1222 | 6 | 1597 | 11 | 1.31 | 5 | 1236 | 7 | 1608 | 12 | 1.30 | 5 |
| Clinch River above Tazewell, TN | 1319 | 3 | 1503 | 5 | 1.14 | 1 | 1309 | 3 | 1556 | 9 | 1.19 | 6 | 1342 | 5 | 1582 | 10 | 1.18 | 5 | 1354 | 6 | 1595 | 11 | 1.18 | 5 |
| Little Tennessee River near Prentiss, NC | 1753 | 3 | 1512 | 5 | 0.86 | 1 | 1745 | 3 | 1567 | 9 | 0.90 | 6 | 1793 | 6 | 1599 | 11 | 0.89 | 5 | 1819 | 7 | 1612 | 12 | 0.89 | 4 |
| Basin average | 1422 | 3 | 1510 | 5 | 1.09 | 2 | 1417 | 3 | 1564 | 9 | 1.13 | 6 | 1452 | 6 | 1593 | 11 | 1.13 | 5 | 1469 | 7 | 1605 | 12 | 1.12 | 5 |
| Potomac | ||||||||||||||||||||||||
| Wills Creek near Cumberland, MD | 1025 | 4 | 1429 | 6 | 1.39 | 2 | 1038 | 5 | 1475 | 9 | 1.42 | 4 | 1048 | 6 | 1515 | 12 | 1.44 | 6 | 1070 | 8 | 1522 | 13 | 1.42 | 4 |
| Pototmac River near at Paw Paw, WV | 994 | 1 | 1436 | 6 | 1.44 | 6 | 1005 | 2 | 1482 | 10 | 1.47 | 8 | 1017 | 3 | 1522 | 13 | 1.50 | 9 | 1037 | 5 | 1529 | 13 | 1.47 | 8 |
| Cacapon River near Great Cacapon, WV | 1040 | 4 | 1465 | 6 | 1.41 | 1 | 1049 | 5 | 1510 | 9 | 1.44 | 4 | 1062 | 6 | 1550 | 12 | 1.46 | 5 | 1084 | 9 | 1558 | 12 | 1.44 | 3 |
| Patterson Creek near Headsville, WV | 1112 | 4 | 1379 | 6 | 1.24 | 2 | 1126 | 5 | 1426 | 9 | 1.27 | 4 | 1139 | 6 | 1466 | 12 | 1.29 | 6 | 1156 | 8 | 1473 | 13 | 1.27 | 5 |
| Bennett Creek at Park Mills, MD | 1084 | 4 | 1489 | 5 | 1.37 | 1 | 1098 | 6 | 1538 | 9 | 1.40 | 3 | 1110 | 7 | 1576 | 12 | 1.42 | 5 | 1135 | 9 | 1584 | 12 | 1.40 | 3 |
| South Branch Potoamc River near Springfield, WV | 1013 | 4 | 1441 | 6 | 1.42 | 2 | 1025 | 5 | 1488 | 9 | 1.45 | 4 | 1036 | 7 | 1529 | 12 | 1.47 | 5 | 1057 | 9 | 1536 | 13 | 1.45 | 4 |
| Conococheague Creek and Fairview, MD | 1046 | 4 | 1481 | 5 | 1.42 | 1 | 1057 | 5 | 1527 | 9 | 1.45 | 3 | 1070 | 7 | 1567 | 12 | 1.46 | 5 | 1092 | 9 | 1575 | 12 | 1.44 | 3 |
| Marsh Run at Grimes, MD | 1059 | 4 | 1505 | 5 | 1.42 | 1 | 1066 | 5 | 1551 | 9 | 1.46 | 4 | 1080 | 6 | 1592 | 12 | 1.47 | 5 | 1104 | 9 | 1599 | 12 | 1.45 | 3 |
| North Branch Potomac River at Steyer, MD | 980 | 4 | 1419 | 6 | 1.45 | 2 | 992 | 5 | 1466 | 9 | 1.48 | 4 | 1003 | 7 | 1505 | 12 | 1.50 | 5 | 1019 | 8 | 1513 | 13 | 1.48 | 4 |
| Catoctin Creek near Middletown, MD | 1109 | 4 | 1501 | 5 | 1.35 | 1 | 1115 | 5 | 1548 | 9 | 1.39 | 4 | 1130 | 6 | 1589 | 12 | 1.41 | 5 | 1158 | 9 | 1597 | 12 | 1.38 | 3 |
| Goose Creek near Leesburg, VA | 1129 | 4 | 1518 | 5 | 1.34 | 1 | 1136 | 5 | 1566 | 9 | 1.38 | 3 | 1153 | 7 | 1606 | 11 | 1.39 | 5 | 1179 | 9 | 1614 | 12 | 1.37 | 3 |
| North Fork Shenandoah River at Cootes Store, VS | 1037 | 4 | 1458 | 6 | 1.41 | 1 | 1052 | 6 | 1509 | 9 | 1.43 | 3 | 1064 | 7 | 1548 | 12 | 1.45 | 5 | 1085 | 9 | 1556 | 13 | 1.44 | 3 |
| Cedar Creek near Winchester, VA | 1136 | 9 | 1513 | 7 | 1.33 | -2 | 1137 | 9 | 1560 | 10 | 1.37 | 1 | 1155 | 11 | 1600 | 13 | 1.39 | 2 | 1181 | 14 | 1609 | 14 | 1.36 | 0.2 |
| Basin average | 1059 | 4 | 1464 | 6 | 1.38 | 1.40 | 1069 | 5 | 1511 | 9 | 1.42 | 4 | 1082 | 7 | 1551 | 12 | 1.44 | 5 | 1104 | 9 | 1559 | 13 | 1.41 | 4 |
| Regional average | 1169 | 4 | 1420 | 6 | 1 | 2 | 1178 | 5 | 1468 | 9 | 1 | 4 | 1196 | 6 | 1505 | 12 | 1 | 6 | 1213 | 8 | 1513 | 13 | 1 | 5 |
| ±std. dev | 171 | 1.3 | 82 | 0.8 | 0.2 | 1.5 | 169 | 1.3 | 83 | 0.9 | 0.2 | 1.6 | 175 | 1.2 | 82 | 1.1 | 0.2 | 1.6 | 175 | 1.5 | 83 | 1.1 | 0.2 | 1.8 |
| RCP8.5 | Q1 (2005–2025) | Q2 (2026–2050) | Q3 (2051–2075) | Q4 (2076–2099) | ||||||||||||||||||||
|---|---|---|---|---|---|---|---|---|---|---|---|---|---|---|---|---|---|---|---|---|---|---|---|---|
| Basin/Station Name | P | DP | PET | DPET | AI | DAI | P | DP | PET | DPET | AI | DAI | P | DP | PET | DPET | AI | DAI | P | DP | PET | DPET | AI | DAI |
| mm | % | mm | % | - | % | mm | % | mm | % | - | % | mm | % | mm | % | - | % | mm | % | mm | % | - | % | |
| Monongahela | ||||||||||||||||||||||||
| Casselman River at Grantsville, MD | 1223 | 4 | 1322 | 8 | 1.08 | 3 | 1227 | 5 | 1375 | 12 | 1.12 | 7 | 1248 | 6 | 1471 | 20 | 1.18 | 12 | 1276 | 9 | 1547 | 26 | 1.21 | 15 |
| West Fork River at Enterprise, WV | 1223 | 5 | 1406 | 7 | 1.15 | 4 | 1223 | 5 | 1456 | 11 | 1.19 | 7 | 1241 | 6 | 1549 | 18 | 1.25 | 12 | 1272 | 9 | 1621 | 24 | 1.27 | 15 |
| Youghiogheny River near Oakland, MD | 1328 | 4 | 1295 | 8 | 0.97 | 4 | 1334 | 5 | 1345 | 12 | 1.01 | 7 | 1355 | 6 | 1437 | 20 | 1.06 | 13 | 1385 | 9 | 1510 | 26 | 1.09 | 16 |
| Laurel Hill Creek at Ursina, PA | 1308 | 3 | 1339 | 11 | 1.02 | 9 | 1309 | 3 | 1390 | 16 | 1.06 | 13 | 1327 | 4 | 1484 | 23 | 1.12 | 19 | 1358 | 7 | 1558 | 30 | 1.15 | 22 |
| Cheat River near Parsons, WV | 1386 | 4 | 1310 | 8 | 0.95 | 4 | 1390 | 5 | 1361 | 12 | 0.98 | 8 | 1409 | 6 | 1455 | 20 | 1.03 | 13 | 1438 | 8 | 1529 | 26 | 1.06 | 17 |
| Basin average | 1294 | 4 | 1334 | 8 | 1.03 | 5 | 1297 | 4 | 1385 | 13 | 1.07 | 8 | 1316 | 6 | 1479 | 20 | 1.13 | 14 | 1346 | 8 | 1553 | 26 | 1.16 | 17 |
| Ohio | ||||||||||||||||||||||||
| Little Shenango River at Greenville, PA | 1069 | 6 | 1346 | 7 | 1.26 | 2 | 1066 | 5 | 1399 | 12 | 1.31 | 6 | 1074 | 6 | 1495 | 19 | 1.39 | 13 | 1115 | 10 | 1571 | 25 | 1.41 | 14 |
| Little Beaver Creek near East Liverpool, OH | 1096 | 5 | 1413 | 7 | 1.29 | 2 | 1097 | 5 | 1465 | 11 | 1.34 | 6 | 1106 | 6 | 1561 | 19 | 1.41 | 12 | 1141 | 9 | 1635 | 24 | 1.43 | 14 |
| Basin average | 1083 | 5 | 1379 | 7 | 1.27 | 2 | 1082 | 5 | 1432 | 11 | 1.32 | 6 | 1090 | 6 | 1528 | 19 | 1.40 | 12 | 1128 | 10 | 1603 | 25 | 1.42 | 14 |
| Kanawha | ||||||||||||||||||||||||
| Wolf Creek near Narrows, VA | 1034 | 3 | 1507 | 7 | 1.46 | 3 | 1049 | 5 | 1558 | 10 | 1.49 | 5 | 1066 | 6 | 1646 | 16 | 1.54 | 9 | 1080 | 8 | 1725 | 22 | 1.60 | 13 |
| Greenbrier River at Durbin, WV | 1294 | 4 | 1280 | 8 | 0.99 | 4 | 1308 | 5 | 1332 | 12 | 1.02 | 7 | 1334 | 7 | 1424 | 20 | 1.07 | 12 | 1353 | 9 | 1500 | 26 | 1.11 | 16 |
| Williams River at Dyer, WV | 1536 | 4 | 1314 | 7 | 0.86 | 3 | 1541 | 4 | 1364 | 11 | 0.89 | 7 | 1561 | 6 | 1454 | 19 | 0.93 | 13 | 1586 | 7 | 1527 | 25 | 0.96 | 16 |
| Big Coal River at Ashford, WV | 1232 | 3 | 1477 | 7 | 1.20 | 4 | 1235 | 3 | 1525 | 11 | 1.23 | 7 | 1249 | 4 | 1616 | 17 | 1.29 | 13 | 1272 | 6 | 1690 | 23 | 1.33 | 16 |
| Bluestone River at Pipestem, WV | 1053 | 3 | 1476 | 7 | 1.40 | 3 | 1067 | 5 | 1526 | 11 | 1.43 | 6 | 1076 | 6 | 1619 | 17 | 1.50 | 11 | 1092 | 7 | 1699 | 23 | 1.56 | 15 |
| Greenbrier River at Alderson, WV | 1117 | 3 | 1395 | 7 | 1.25 | 4 | 1130 | 5 | 1444 | 11 | 1.28 | 6 | 1144 | 6 | 1531 | 17 | 1.34 | 11 | 1160 | 7 | 1605 | 23 | 1.38 | 15 |
| Basin average | 1211 | 3 | 1408 | 7 | 1.19 | 4 | 1222 | 4 | 1458 | 11 | 1.22 | 6 | 1238 | 6 | 1548 | 18 | 1.28 | 11 | 1257 | 7 | 1624 | 24 | 1.32 | 15 |
| Tennessee | ||||||||||||||||||||||||
| North Fork Holston River near Saltsville, VA | 1194 | 3 | 1539 | 7 | 1.29 | 4 | 1202 | 4 | 1588 | 11 | 1.32 | 6 | 1211 | 5 | 1676 | 17 | 1.38 | 11 | 1226 | 6 | 1753 | 22 | 1.43 | 15 |
| Clinch River above Tazewell, TN | 1318 | 3 | 1528 | 7 | 1.16 | 3 | 1316 | 3 | 1576 | 10 | 1.20 | 6 | 1322 | 4 | 1659 | 16 | 1.26 | 12 | 1343 | 5 | 1726 | 20 | 1.29 | 14 |
| Little Tennessee River near Prentiss, NC | 1766 | 4 | 1533 | 6 | 0.87 | 2 | 1765 | 4 | 1586 | 10 | 0.90 | 6 | 1780 | 5 | 1675 | 16 | 0.94 | 11 | 1780 | 5 | 1753 | 22 | 0.98 | 16 |
| Basin average | 1426 | 4 | 1533 | 7 | 1.11 | 3 | 1428 | 4 | 1583 | 10 | 1.14 | 6 | 1437 | 5 | 1670 | 16 | 1.19 | 11 | 1449 | 5 | 1744 | 21 | 1.23 | 15 |
| Potomac | ||||||||||||||||||||||||
| Wills Creek near Cumberland, MD | 1032 | 4 | 1449 | 7 | 1.40 | 3 | 1037 | 5 | 1501 | 11 | 1.45 | 6 | 1056 | 7 | 1595 | 18 | 1.51 | 10 | 1080 | 9 | 1669 | 23 | 1.55 | 13 |
| Pototmac River near Great Cacapon, WV | 999 | 1 | 1455 | 8 | 1.46 | 6 | 1005 | 2 | 1508 | 12 | 1.50 | 10 | 1023 | 4 | 1601 | 18 | 1.56 | 14 | 1046 | 6 | 1675 | 24 | 1.60 | 17 |
| Cacapon River near Great Cacapon, WV | 1044 | 5 | 1483 | 7 | 1.42 | 2 | 1050 | 5 | 1537 | 11 | 1.46 | 5 | 1069 | 7 | 1629 | 17 | 1.52 | 10 | 1096 | 10 | 1703 | 23 | 1.55 | 12 |
| Patterson Creek near Headsville, WV | 1116 | 4 | 1399 | 7 | 1.25 | 3 | 1122 | 5 | 1452 | 11 | 1.29 | 6 | 1143 | 7 | 1547 | 19 | 1.35 | 11 | 1168 | 9 | 1621 | 24 | 1.39 | 14 |
| Bennett Creek at Park Mills, MD | 1078 | 4 | 1509 | 7 | 1.40 | 3 | 1095 | 5 | 1564 | 11 | 1.43 | 5 | 1123 | 8 | 1656 | 17 | 1.47 | 9 | 1143 | 10 | 1733 | 23 | 1.52 | 12 |
| South Branch Potoamc River near Springfield, WV | 1017 | 4 | 1460 | 7 | 1.44 | 2 | 1024 | 5 | 1515 | 11 | 1.48 | 6 | 1043 | 7 | 1609 | 18 | 1.54 | 10 | 1066 | 10 | 1685 | 24 | 1.58 | 13 |
| Conococheague Creek and Fairview, MD | 1049 | 4 | 1500 | 7 | 1.43 | 2 | 1058 | 5 | 1554 | 11 | 1.47 | 5 | 1078 | 7 | 1647 | 17 | 1.53 | 9 | 1105 | 10 | 1722 | 23 | 1.56 | 12 |
| Marsh Run at Grimes, MD | 1061 | 5 | 1524 | 7 | 1.44 | 2 | 1068 | 5 | 1579 | 11 | 1.48 | 5 | 1088 | 7 | 1673 | 17 | 1.54 | 9 | 1119 | 10 | 1748 | 22 | 1.56 | 11 |
| North Branch Potomac River at Steyer, MD | 981 | 4 | 1439 | 7 | 1.47 | 3 | 989 | 5 | 1492 | 11 | 1.51 | 6 | 1009 | 7 | 1586 | 18 | 1.57 | 10 | 1030 | 9 | 1661 | 24 | 1.61 | 13 |
| Catoctin Creek near Middletown, MD | 1109 | 4 | 1521 | 7 | 1.37 | 2 | 1119 | 5 | 1577 | 11 | 1.41 | 5 | 1140 | 7 | 1669 | 17 | 1.46 | 9 | 1172 | 10 | 1745 | 23 | 1.49 | 11 |
| Goose Creek near Leesburg, VA | 1126 | 4 | 1538 | 7 | 1.37 | 2 | 1138 | 5 | 1594 | 11 | 1.40 | 5 | 1164 | 8 | 1686 | 17 | 1.45 | 9 | 1191 | 10 | 1763 | 22 | 1.48 | 11 |
| North Fork Shenandoah River at Cootes Store, VS | 1032 | 4 | 1480 | 7 | 1.43 | 3 | 1048 | 5 | 1536 | 11 | 1.47 | 6 | 1074 | 8 | 1631 | 18 | 1.52 | 9 | 1093 | 10 | 1710 | 24 | 1.56 | 13 |
| Cedar Creek near Winchester, VA | 1131 | 9 | 1532 | 8 | 1.35 | 0 | 1141 | 10 | 1589 | 12 | 1.39 | 2 | 1163 | 12 | 1680 | 19 | 1.44 | 6 | 1198 | 15 | 1755 | 24 | 1.46 | 8 |
| Basin average | 1060 | 4 | 1484 | 7 | 1.40 | 3 | 1069 | 5 | 1538 | 11 | 1.44 | 6 | 1090 | 7 | 1632 | 18 | 1.50 | 10 | 1116 | 10 | 1707 | 23 | 1.53 | 12 |
| Regional average | 1174 | 4 | 1441 | 7 | 1.25 | 3.2 | 1180 | 5 | 1493 | 11 | 1.29 | 6 | 1198 | 6 | 1585 | 18 | 1.35 | 11 | 1222 | 8 | 1659 | 24 | 1.38 | 14 |
| ±std. dev. | 167 | 1 | 83 | 1 | 0.18 | 1.5 | 165 | 1 | 84 | 1 | 0.19 | 2 | 165 | 2 | 83 | 2 | 0.19 | 2 | 162 | 2 | 83 | 2 | 0.19 | 3 |
| Q1 (2005–2025) | Q2 (2026–2050) | Q3 (2051–2075) | Q4 (2076–2099) | Q1 (2005–2025) | Q2 (2026–2050) | Q3 (2051–2075) | Q4 (2076–2099) | |||||||||||||||||
|---|---|---|---|---|---|---|---|---|---|---|---|---|---|---|---|---|---|---|---|---|---|---|---|---|
| Basin /Station Name | DQP | D QPET | DQ | DQP | D QPET | DQ | DQP | D QPET | DQ | DQP | D QPET | DQ | DQP | D QPET | DQ | DQP | D QPET | DQ | DQP | D QPET | DQ | DQP | D QPET | DQ |
| % | % | % | % | % | % | % | % | % | % | % | % | % | % | % | % | % | % | % | % | % | % | % | % | |
| Monongahela | ||||||||||||||||||||||||
| Casselman River at Grantsville, MD | 5 | −2 | 3 | 7 | −4 | 3 | 8 | −5 | 4 | 11 | −5 | 6 | 6 | −3 | 3 | 6 | −4 | 2 | 9 | −7 | 2 | 12 | −9 | 3 |
| West Fork River at Enterprise, WV | 6 | −3 | 2 | 8 | −5 | 3 | 10 | −7 | 4 | 12 | −7 | 5 | 7 | −4 | 3 | 7 | −6 | 1 | 10 | −10 | −1 | 14 | −14 | 0 |
| Youghiogheny River near Oakland, MD | 5 | −2 | 3 | 7 | −3 | 4 | 8 | −4 | 5 | 10 | −4 | 6 | 5 | −2 | 3 | 6 | −3 | 3 | 8 | −5 | 3 | 11 | −7 | 4 |
| Laurel Hill Creek at Ursina, PA | 2 | −3 | −1 | 4 | −4 | 0 | 6 | −5 | 0 | 7 | −6 | 2 | 3 | −4 | 0 | 4 | −5 | −2 | 5 | −8 | −2 | 9 | −10 | −1 |
| Cheat River near Parsons, WV | 5 | −2 | 3 | 6 | −3 | 4 | 9 | −4 | 5 | 10 | −4 | 6 | 5 | −2 | 3 | 6 | −3 | 3 | 8 | −5 | 2 | 10 | −7 | 3 |
| Basin average | 5 | −2 | 2 | 6 | −4 | 3 | 8 | −5 | 3 | 10 | −5 | 5 | 5 | −3 | 2 | 6 | −5 | 1 | 8 | −7 | 1 | 11 | −9 | 2 |
| Ohio | ||||||||||||||||||||||||
| Little Shenango River at Greenville, PA | 7 | −3 | 4 | 8 | −5 | 3 | 11 | −6 | 4 | 11 | −6 | 5 | 8 | −4 | 5 | 8 | −6 | 2 | 9 | −9 | 0 | 15 | −12 | 3 |
| Little Beaver Creek near East Liverpool, OH | 6 | −5 | 2 | 9 | −7 | 2 | 12 | −9 | 2 | 13 | −10 | 3 | 8 | −6 | 3 | 9 | −9 | 0 | 10 | −14 | −4 | 16 | −19 | −3 |
| Basin average | 6 | −4 | 3 | 8 | −6 | 3 | 11 | −8 | 3 | 12 | −8 | 4 | 8 | −5 | 4 | 8 | −7 | 1 | 9 | −12 | −2 | 16 | −15 | 0 |
| Kanawha | ||||||||||||||||||||||||
| Wolf Creek near Narrows, VA | 6 | −2 | 3 | 7 | −4 | 3 | 9 | −5 | 4 | 11 | −5 | 5 | 5 | −3 | 2 | 7 | −5 | 2 | 9 | −8 | 2 | 11 | −10 | 1 |
| Greenbrier River at Durbin, WV | 6 | −2 | 3 | 8 | −4 | 4 | 9 | −5 | 4 | 11 | −5 | 6 | 5 | −3 | 2 | 7 | −5 | 2 | 10 | −7 | 2 | 12 | −10 | 2 |
| Williams River at Dyer, WV | 5 | −2 | 3 | 6 | −3 | 3 | 8 | −4 | 4 | 9 | −4 | 5 | 5 | −2 | 3 | 5 | −3 | 2 | 7 | −6 | 2 | 9 | −7 | 2 |
| Big Coal River at Ashford, WV | 5 | −4 | 2 | 6 | −6 | 0 | 9 | −7 | 2 | 11 | −8 | 3 | 5 | −5 | 0 | 5 | −7 | −2 | 7 | −12 | −4 | 11 | −15 | −5 |
| Bluestone River at Pipestem, WV | 6 | −3 | 3 | 7 | −5 | 2 | 9 | −7 | 3 | 11 | −7 | 4 | 5 | −4 | 1 | 8 | −6 | 1 | 9 | −10 | −1 | 12 | −14 | −2 |
| Greenbrier River at Alderson, WV | 6 | −3 | 3 | 6 | −4 | 2 | 9 | −6 | 3 | 11 | −6 | 4 | 5 | −3 | 2 | 7 | −5 | 2 | 9 | −9 | 0 | 11 | −11 | 0 |
| Basin average | 6 | −3 | 3 | 7 | −4 | 2 | 9 | −6 | 3 | 11 | −6 | 5 | 5 | −3 | 2 | 6 | −5 | 1 | 9 | −9 | 0 | 11 | −11 | 0 |
| Tennessee | ||||||||||||||||||||||||
| North Fork Holston River near Saltsville, VA | 6 | −3 | 2 | 6 | −6 | 0 | 9 | −7 | 2 | 11 | −7 | 4 | 6 | −4 | 1 | 7 | −7 | 0 | 8 | −10 | −3 | 10 | −14 | −4 |
| Clinch River above Tazewell, TN | 6 | −4 | 2 | 5 | −6 | -2 | 9 | −8 | 1 | 11 | −9 | 2 | 6 | −5 | 1 | 6 | −7 | −2 | 6 | −12 | −5 | 9 | −15 | −6 |
| Little Tennessee River near Prentiss, NC | 5 | −2 | 3 | 4 | −4 | 1 | 8 | −4 | 4 | 10 | −5 | 5 | 6 | −3 | 3 | 6 | −4 | 2 | 7 | −7 | 0 | 7 | −9 | −2 |
| Basin average | 6 | −3 | 2 | 5 | −5 | 0 | 9 | −6 | 2 | 11 | −7 | 4 | 6 | −4 | 2 | 6 | −6 | 0 | 7 | −10 | −2 | 9 | −13 | −4 |
| Potomac | ||||||||||||||||||||||||
| Wills Creek near Cumberland, MD | 5 | −2 | 3 | 7 | −4 | 3 | 9 | −5 | 3 | 12 | −5 | 6 | 6 | −3 | 3 | 7 | −5 | 2 | 10 | −8 | 2 | 13 | −10 | 3 |
| Pototmac River near at Paw Paw, WV | 1 | −4 | -3 | 3 | −6 | -3 | 5 | −8 | −3 | 8 | −8 | 0 | 2 | −5 | −3 | 3 | −7 | −4 | 6 | −11 | −6 | 10 | −15 | −5 |
| Cacapon River near Great Cacapon, WV | 8 | −5 | 3 | 9 | −7 | 2 | 12 | −10 | 2 | 16 | −10 | 6 | 9 | −6 | 3 | 10 | −9 | 1 | 13 | −15 | −1 | 18 | −19 | −1 |
| Patterson Creek near Headsville, WV | 8 | −7 | 2 | 11 | −11 | 0 | 14 | −14 | −1 | 17 | −15 | 2 | 9 | −8 | 1 | 10 | −13 | −3 | 15 | −22 | −7 | 20 | −28 | −9 |
| Bennett Creek at Park Mills, MD | 7 | −4 | 3 | 9 | −6 | 3 | 11 | −8 | 4 | 15 | −8 | 7 | 6 | −5 | 2 | 9 | −7 | 2 | 13 | −12 | 2 | 16 | −15 | 1 |
| South Branch Potoamc River near Springfield, WV | 7 | −4 | 3 | 9 | −7 | 3 | 11 | −9 | 3 | 15 | −9 | 6 | 8 | −5 | 3 | 9 | −8 | 1 | 12 | −13 | −1 | 17 | −17 | −1 |
| Conococheague Creek and Fairview, MD | 6 | −3 | 3 | 8 | −5 | 3 | 10 | −6 | 4 | 13 | −6 | 7 | 7 | −4 | 3 | 8 | −6 | 2 | 11 | −9 | 2 | 15 | −12 | 3 |
| Marsh Run at Grimes, MD | 10 | −7 | 3 | 11 | −11 | 0 | 15 | −15 | 0 | 20 | −15 | 5 | 10 | −9 | 2 | 12 | −13 | −1 | 16 | −22 | −5 | 23 | −28 | −5 |
| North Branch Potomac River at Steyer, MD | 7 | −4 | 3 | 9 | −7 | 2 | 12 | −9 | 2 | 15 | −10 | 5 | 7 | −5 | 2 | 9 | −8 | 0 | 13 | −14 | −1 | 17 | −18 | −1 |
| Catoctin Creek near Middletown, MD | 7 | −4 | 4 | 8 | −6 | 2 | 10 | −8 | 3 | 15 | −8 | 7 | 7 | −4 | 3 | 9 | −7 | 2 | 12 | −11 | 1 | 17 | −15 | 2 |
| Goose Creek near Leesburg, VA | 8 | −4 | 4 | 9 | −7 | 2 | 12 | −9 | 3 | 16 | −10 | 7 | 8 | −5 | 2 | 9 | −9 | 1 | 14 | −14 | 0 | 18 | −18 | 0 |
| North Fork Shenandoah River at Cootes Store, VS | 7 | −4 | 3 | 10 | −7 | 3 | 12 | −9 | 3 | 16 | −9 | 6 | 6 | −5 | 1 | 9 | −8 | 1 | 14 | −13 | 0 | 17 | −18 | −1 |
| Cedar Creek near Winchester, VA | 16 | −5 | 11 | 16 | −8 | 9 | 19 | −10 | 9 | 24 | −11 | 13 | 15 | −6 | 9 | 17 | −9 | 8 | 21 | −14 | 6 | 27 | −18 | 8 |
| Basin average | 8 | −4 | 3 | 9 | −7 | 2 | 12 | −9 | 2 | 15 | −10 | 6 | 8 | −5 | 2 | 9 | −8 | 1 | 13 | −14 | −1 | 17 | −18 | 0 |
| Regional average | 6 | −3 | 3 | 8 | −6 | 2 | 10 | −7 | 3 | 13 | −8 | 5 | 7 | −4 | 2 | 8 | −7 | 1 | 10 | −11 | −1 | 14 | −14 | 0 |
| ±std. dev | 3 | 1 | 4 | 3 | 2 | 5 | 3 | 3 | 5 | 4 | 3 | 6 | 2 | 2 | 4 | 3 | 3 | 5 | 3 | 4 | 7 | 4 | 5 | 10 |
© 2020 by the authors. Licensee MDPI, Basel, Switzerland. This article is an open access article distributed under the terms and conditions of the Creative Commons Attribution (CC BY) license (http://creativecommons.org/licenses/by/4.0/).
Share and Cite
Gaertner, B.; Fernandez, R.; Zegre, N. Twenty-First Century Streamflow and Climate Change in Forest Catchments of the Central Appalachian Mountains Region, US. Water 2020, 12, 453. https://doi.org/10.3390/w12020453
Gaertner B, Fernandez R, Zegre N. Twenty-First Century Streamflow and Climate Change in Forest Catchments of the Central Appalachian Mountains Region, US. Water. 2020; 12(2):453. https://doi.org/10.3390/w12020453
Chicago/Turabian StyleGaertner, Brandi, Rodrigo Fernandez, and Nicolas Zegre. 2020. "Twenty-First Century Streamflow and Climate Change in Forest Catchments of the Central Appalachian Mountains Region, US" Water 12, no. 2: 453. https://doi.org/10.3390/w12020453
APA StyleGaertner, B., Fernandez, R., & Zegre, N. (2020). Twenty-First Century Streamflow and Climate Change in Forest Catchments of the Central Appalachian Mountains Region, US. Water, 12(2), 453. https://doi.org/10.3390/w12020453