3.1. Membrane Flux
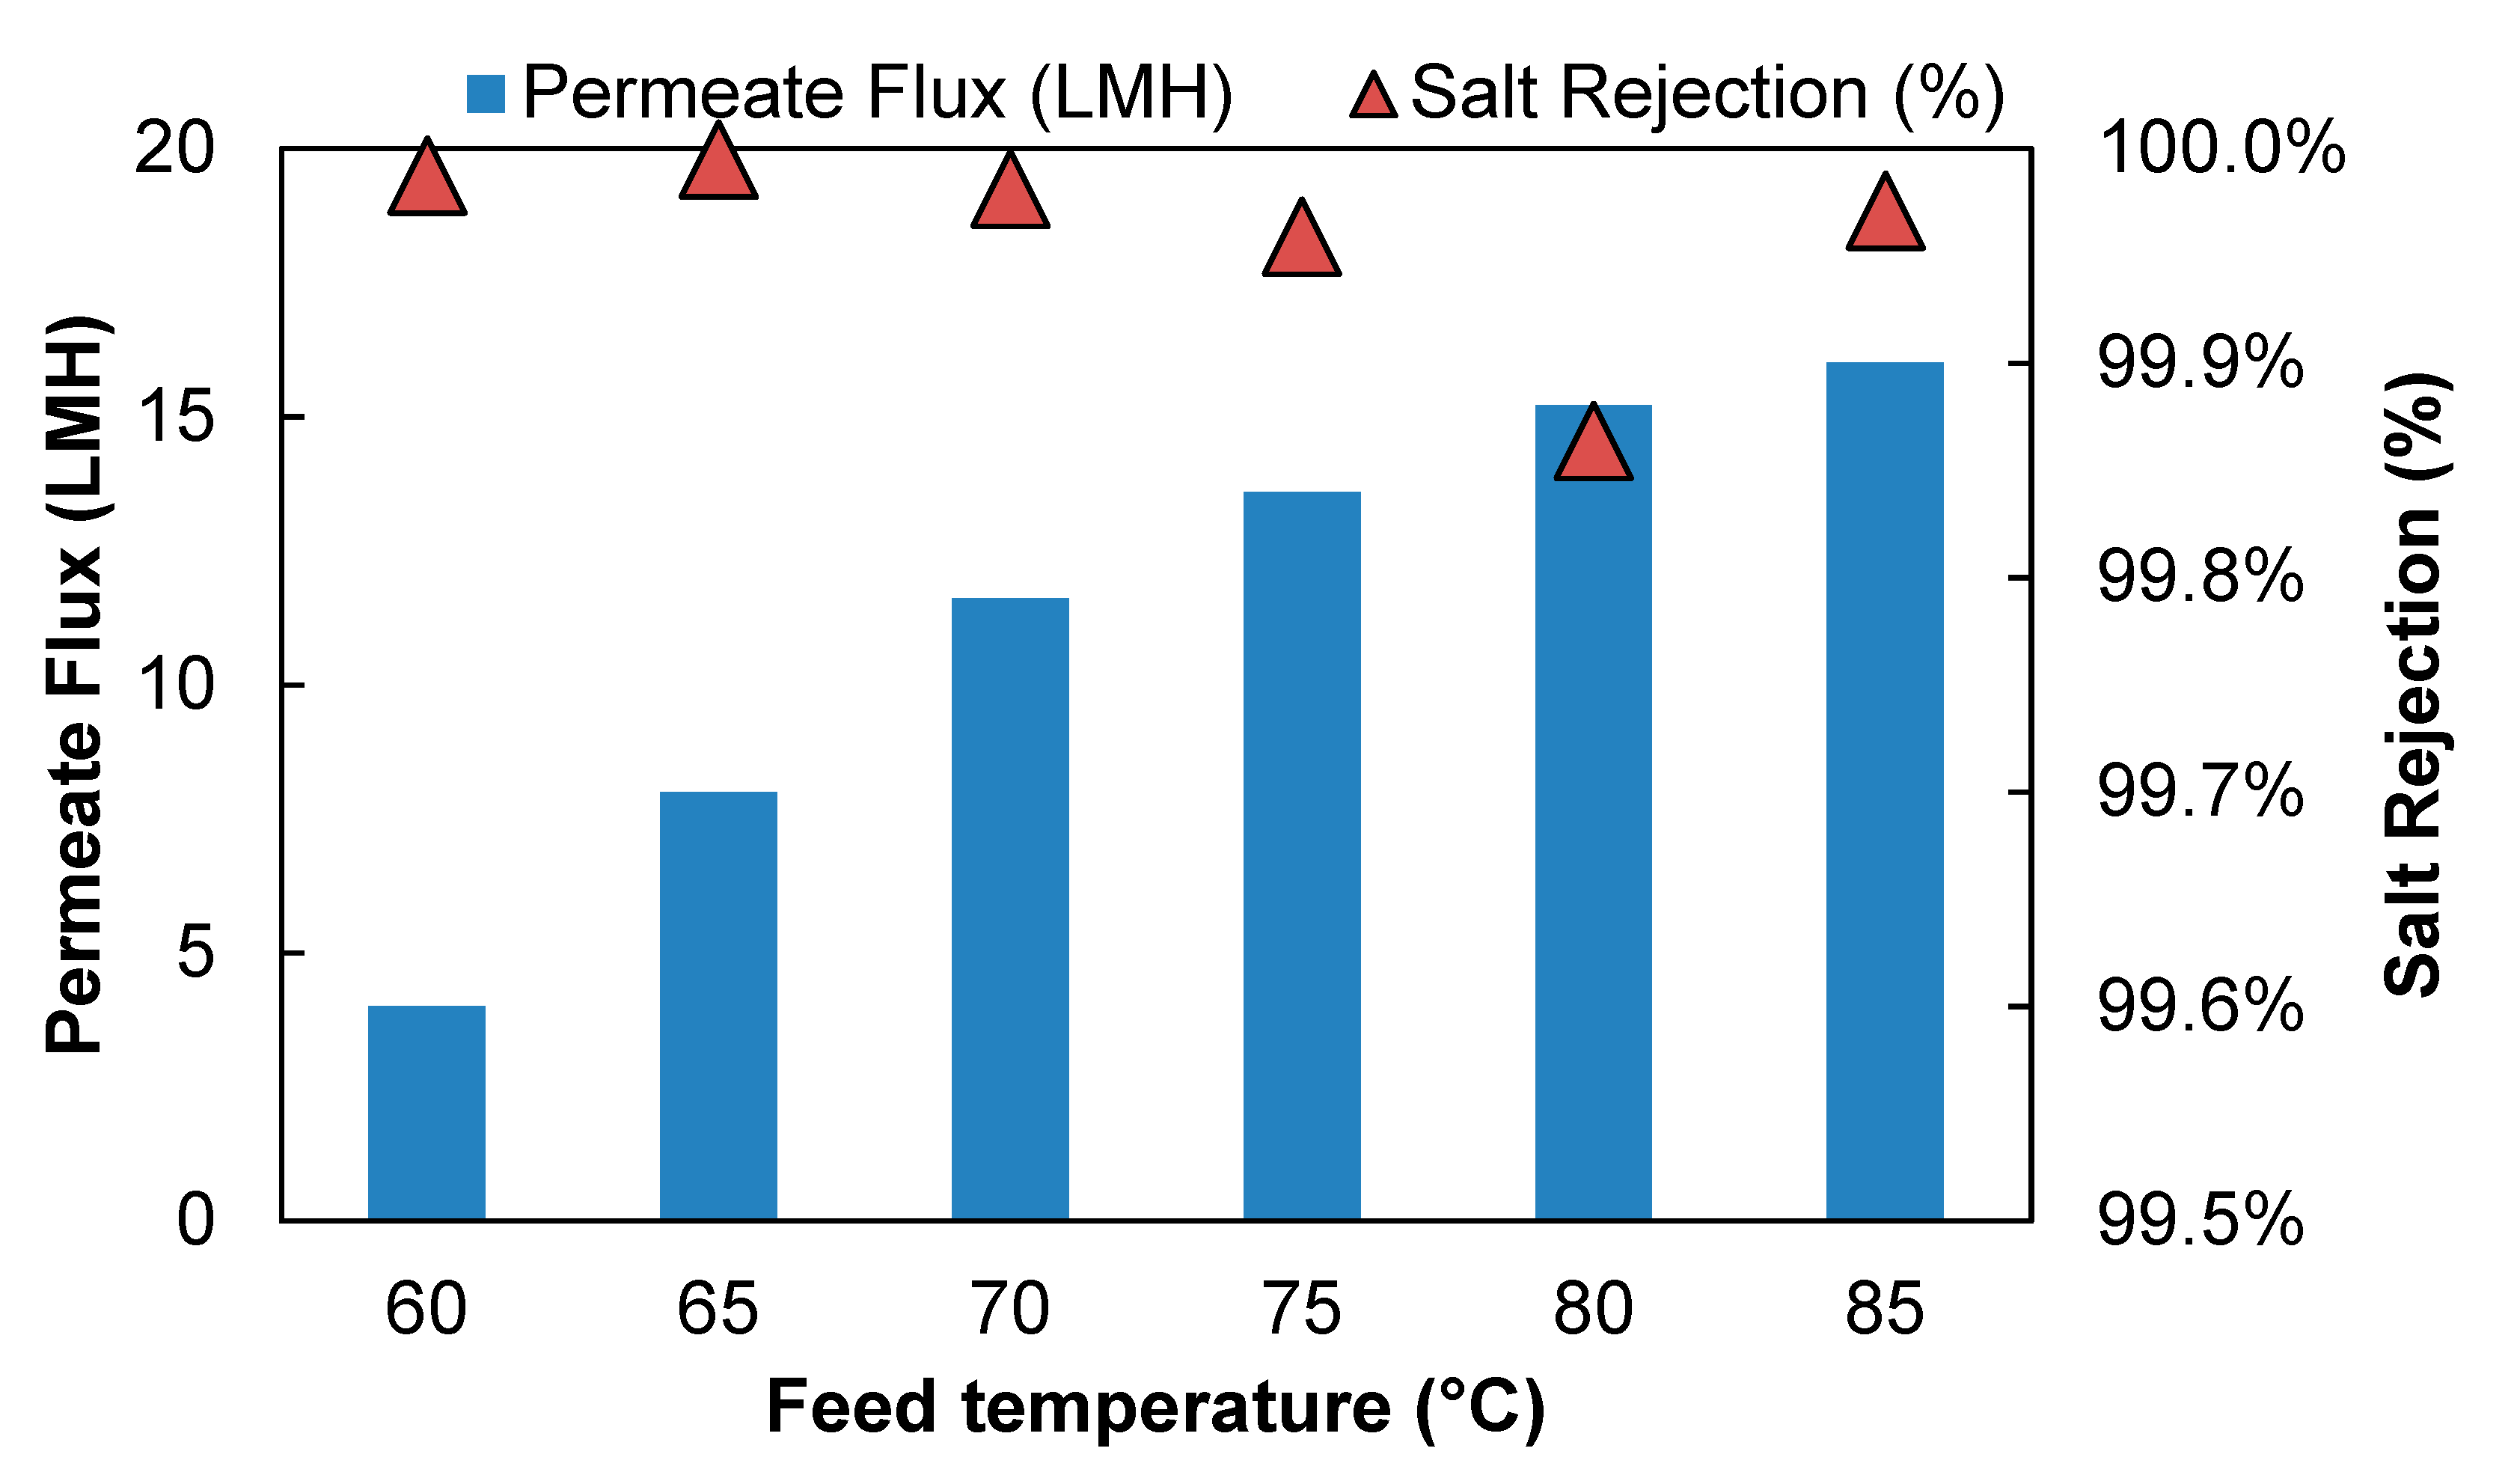
Figure 3 shows the effect of feed temperature on the PVD system performance desalinating 15 g/L NaCl solution. The feed flow rate was maintained at 0.56 L/min to keep the feed flow channel Reynolds number at 4800. As feed temperature increased from 60 °C to 85 °C, the water flux increases from 4.3 LMH to 16 LMH. A higher water flux was expected at a higher temperature, because the partial vapor pressure difference between the feed and permeate side, which is the driving force of a PVD process, is strongly affected by temperature. As the feed temperature increased, the water vapor pressure on the feed side increases, whereas the vapor pressure on the permeate side remains unchanged. As a result, the vapor pressure difference across the membrane increased which led to an increase in vapor flux.
In addition, the increase in temperature also increases water diffusion through the membrane, likely through a combination of higher bulk diffusivity and more swollen (open) membrane pore structure, resulting in higher water permeability (
Table 1). Based on free volume theory [
53], momentary free volumes are created by the thermal motion of polymer chains in an amorphous region; therefore, as the temperature increased, the free volume of the membranes could increase the higher frequency and amplitude of chain motion. When the polymer-free volumes increase, water molecules diffuse through with less resistance; combined with a higher bulk diffusivity, the apparent water permeability and observed water flux increased.
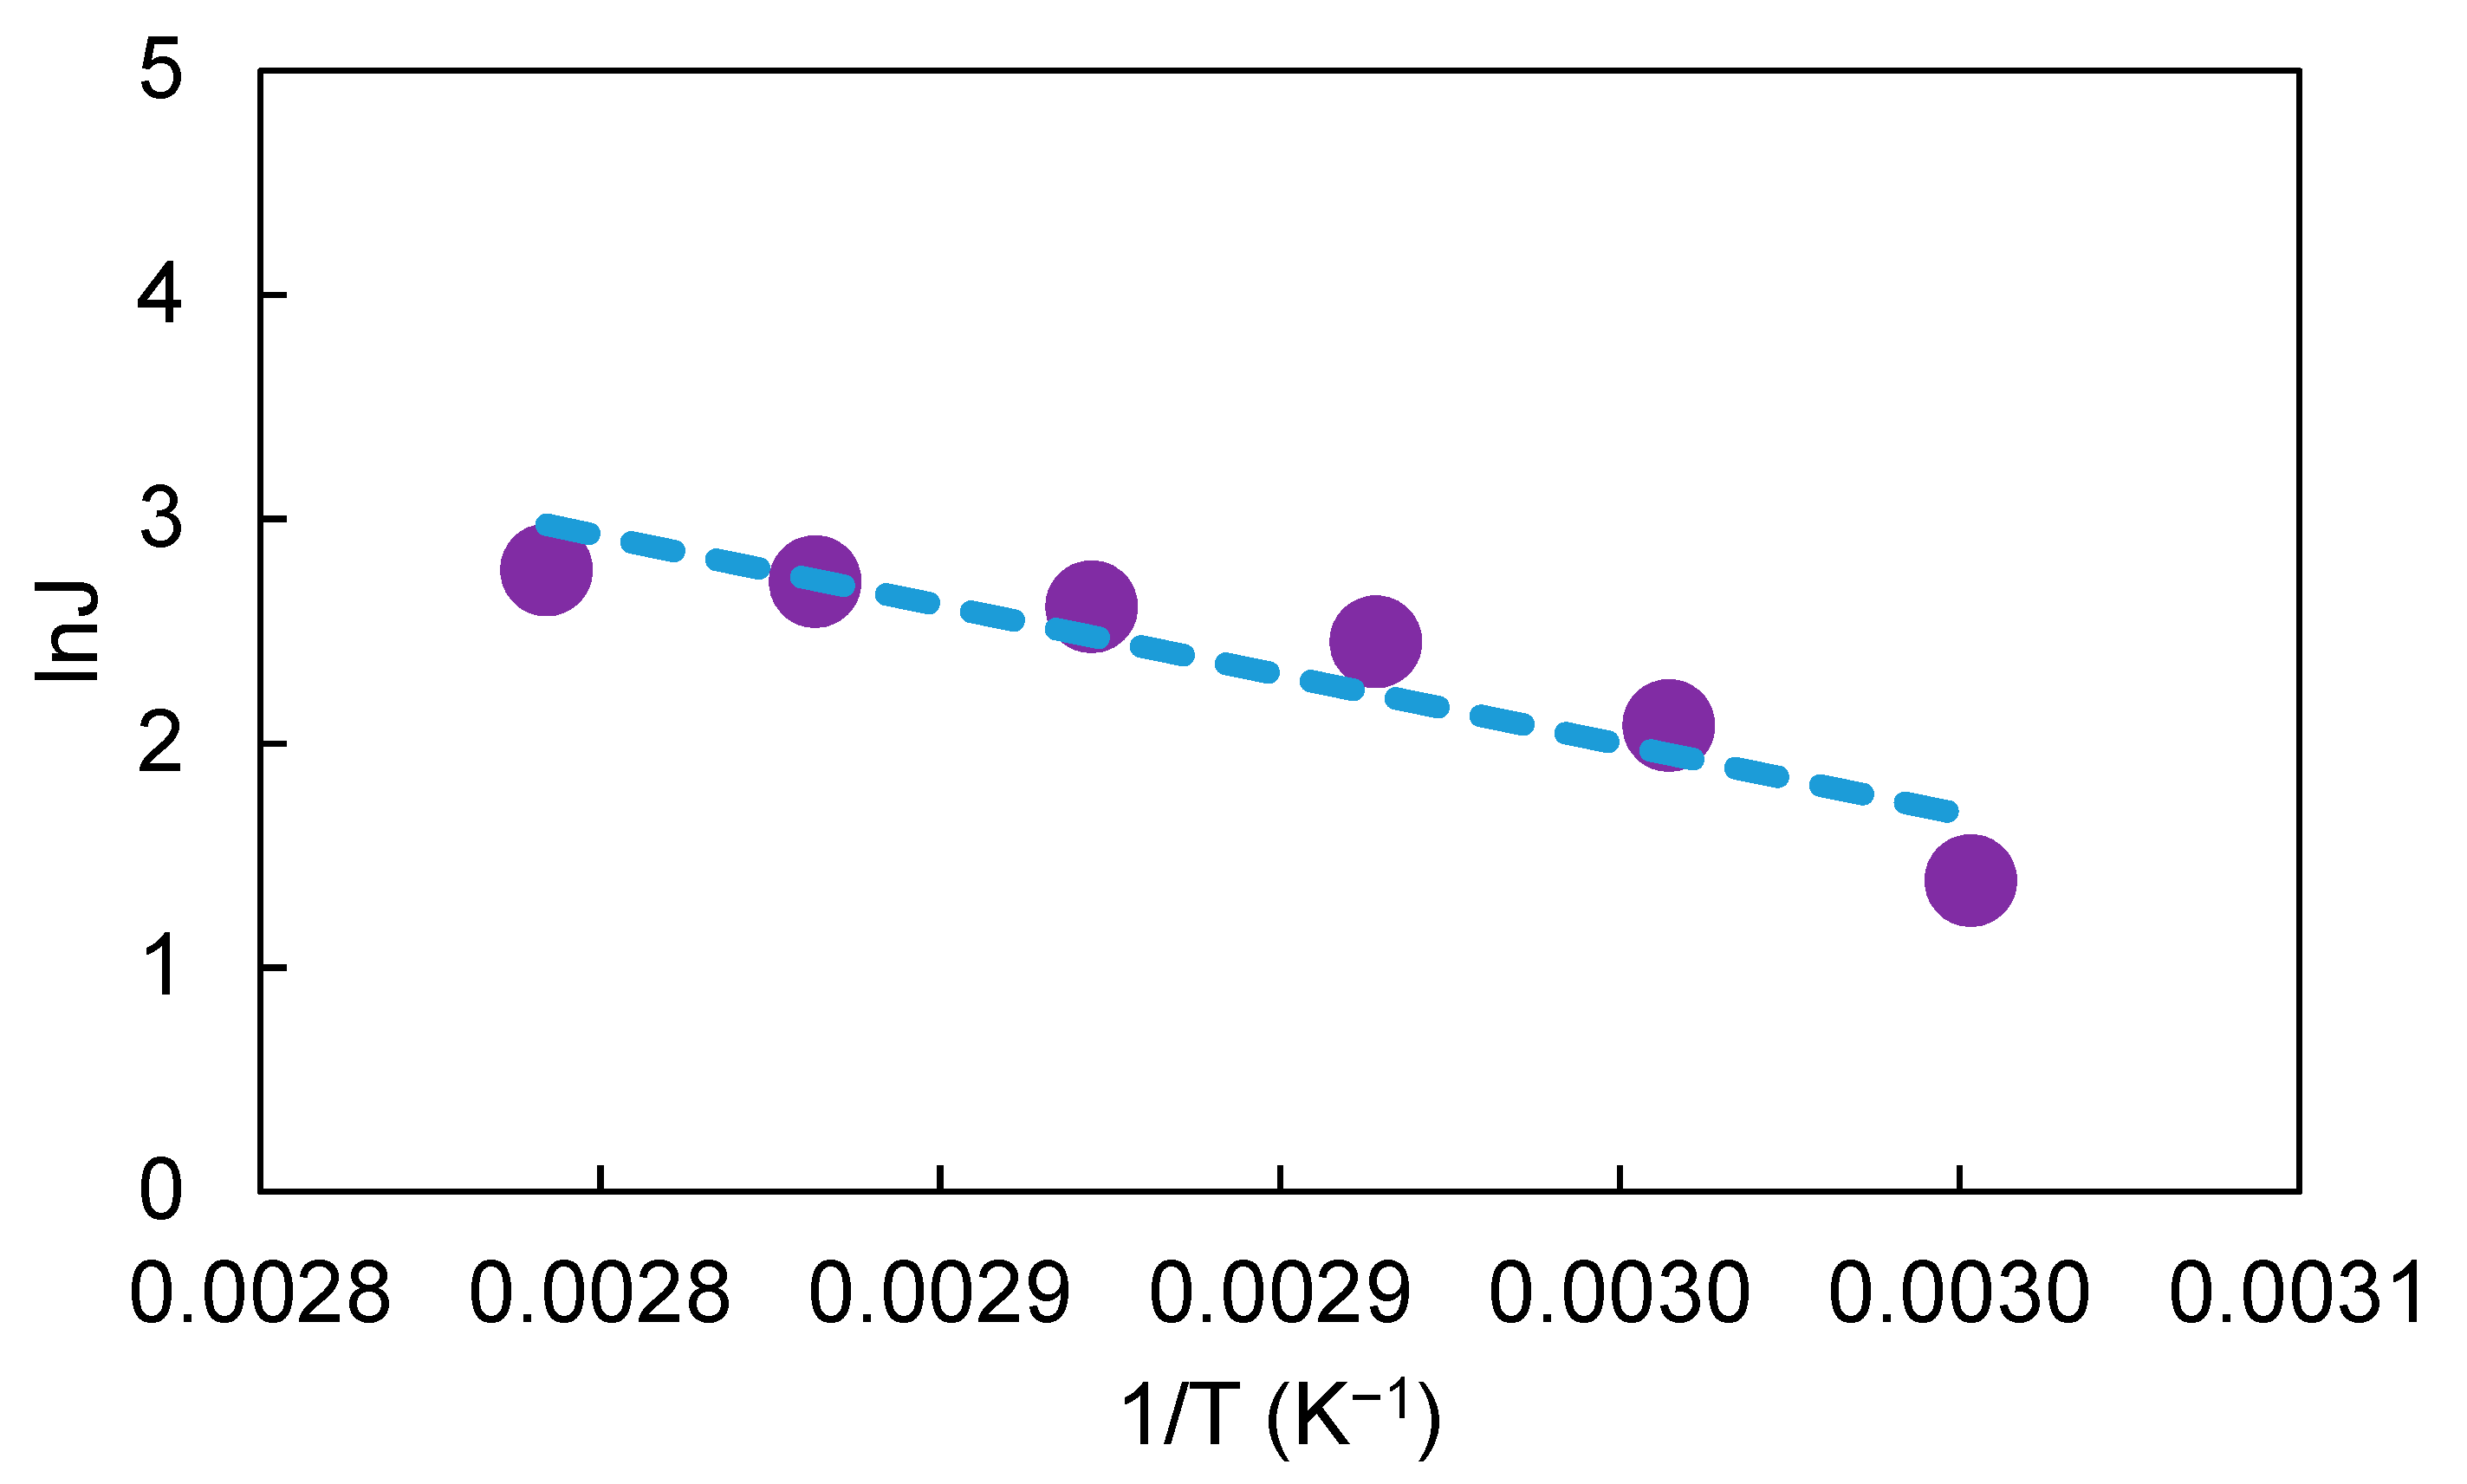
Figure 4 shows a linear Arrhenius plot of the natural logarithm of water flux versus reciprocal temperature. The apparent activation energy E
a of water in the membrane was determined to be 32.6 kJ/mol from the slope of the Arrhenius plot. Compare to other studies, the apparent activation energy of water in the Hybsi membrane is similar to other hybrid pervaporative membranes, where the activation energy in those membranes were reported to be in the range of 11.8–45 kJ/mol, depending on the different membrane materials and operating conditions [
25,
54,
55,
56,
57,
58]. The positive activation energy implies that permeation flux increases with increasing temperature [
25], as confirmed by the results shown in
Figure 3.
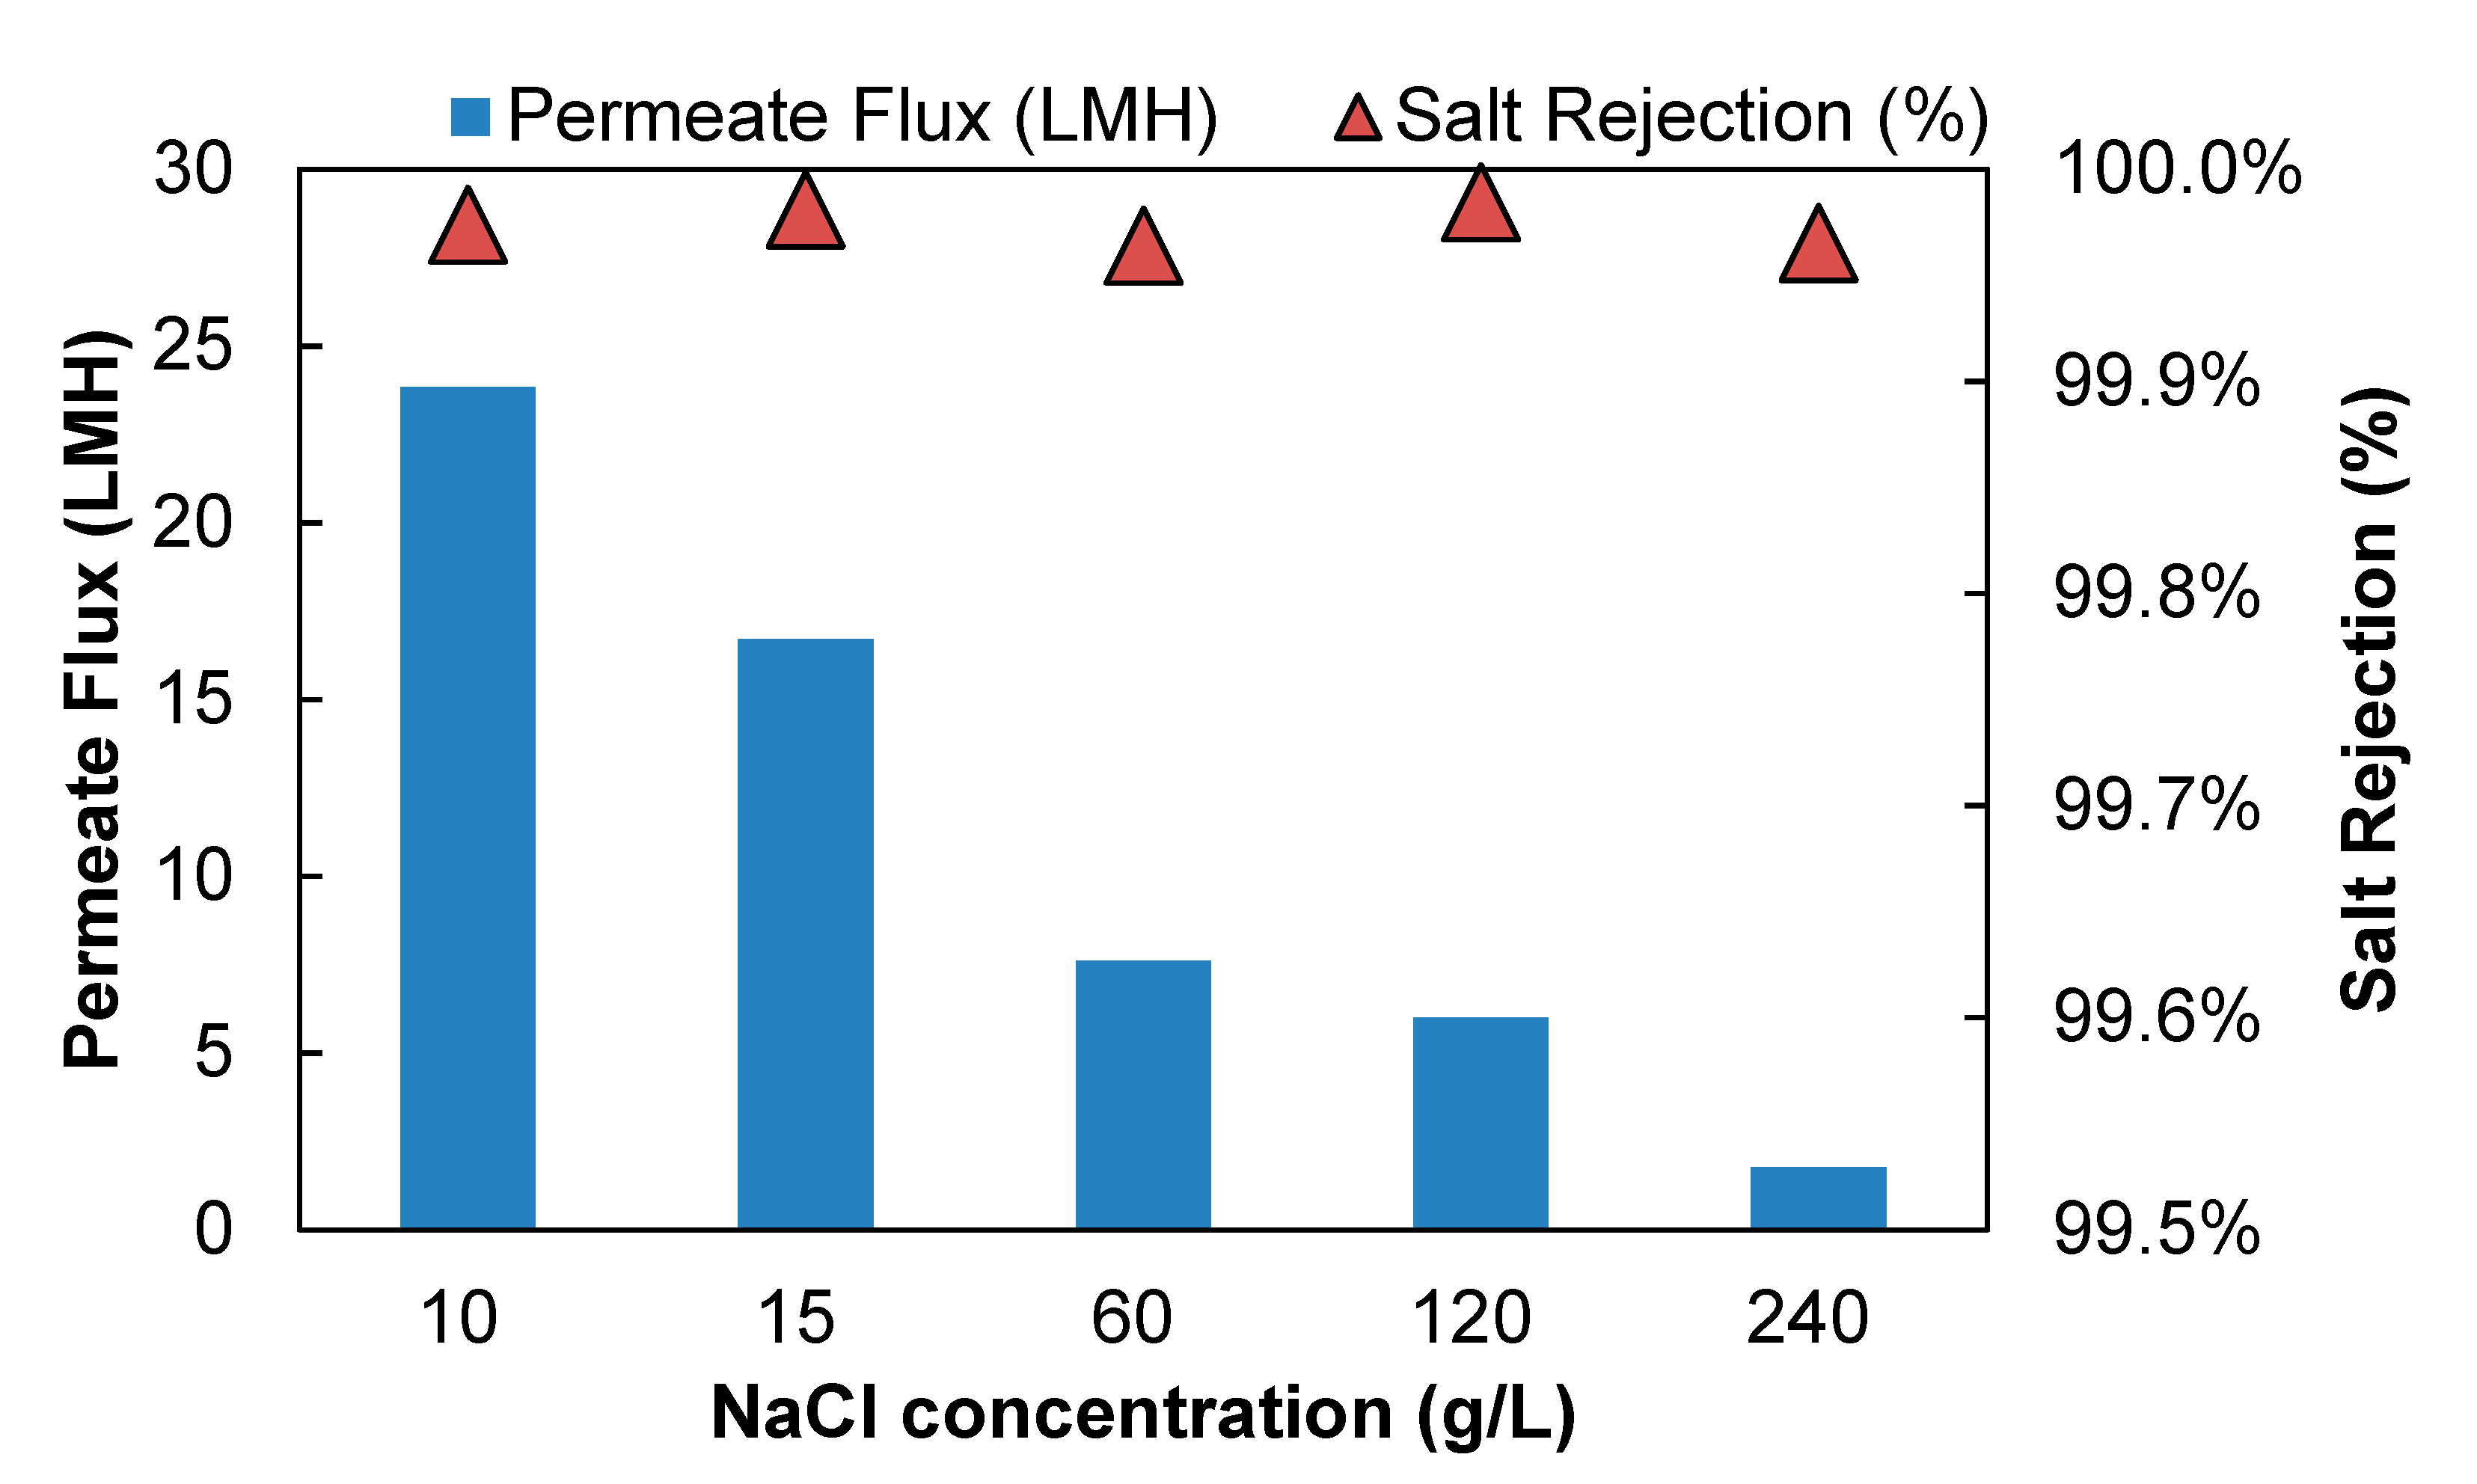
The impact of salt concentration on separation performance of aqueous salt solution is shown in
Figure 5. At the temperatures of 85 °C with crossflow Reynolds number of 4800, the water flux decreased from 23.84 LMH to 1.76 LMH when NaCl concentration in the feed increased from 10 g/L to 240 g/L.
Table 2 demonstrates the membrane surface temperature, surface salinity, and partial vapor pressure difference (i.e., the driving force) under different feed salt concentration calculated with the model described in
Section 2.6. The results show that as feed salt concentration increased, the concentration polarization got significantly worse (evidenced by more than 20 times of the membrane surface salt concentration at 240 g/L feed compared to 10 g/L feed concentration). The membrane surface temperature change with different feed concentration is minimal. The driving force for permeation (feed-side interfacial water partial pressure) decreased ~10% when NaCl concentration increased from 10 g/L to 240 g/L (
Table 2). Feed salt concentration is believed to directly affect the water sorption at the liquid/membrane interface [
25], because water concentration in the feed decreased as salt concentration increased, which led to the water concentration decrease in the membrane. The substantial change in membrane surface salinity could also change in membrane structure thus membrane permeability, which also plays a role decrease in flux with feed concentration (Equation (16)). These findings indicate that the mass transfer on the feed side was significantly limited by the extent of concentration polarization.
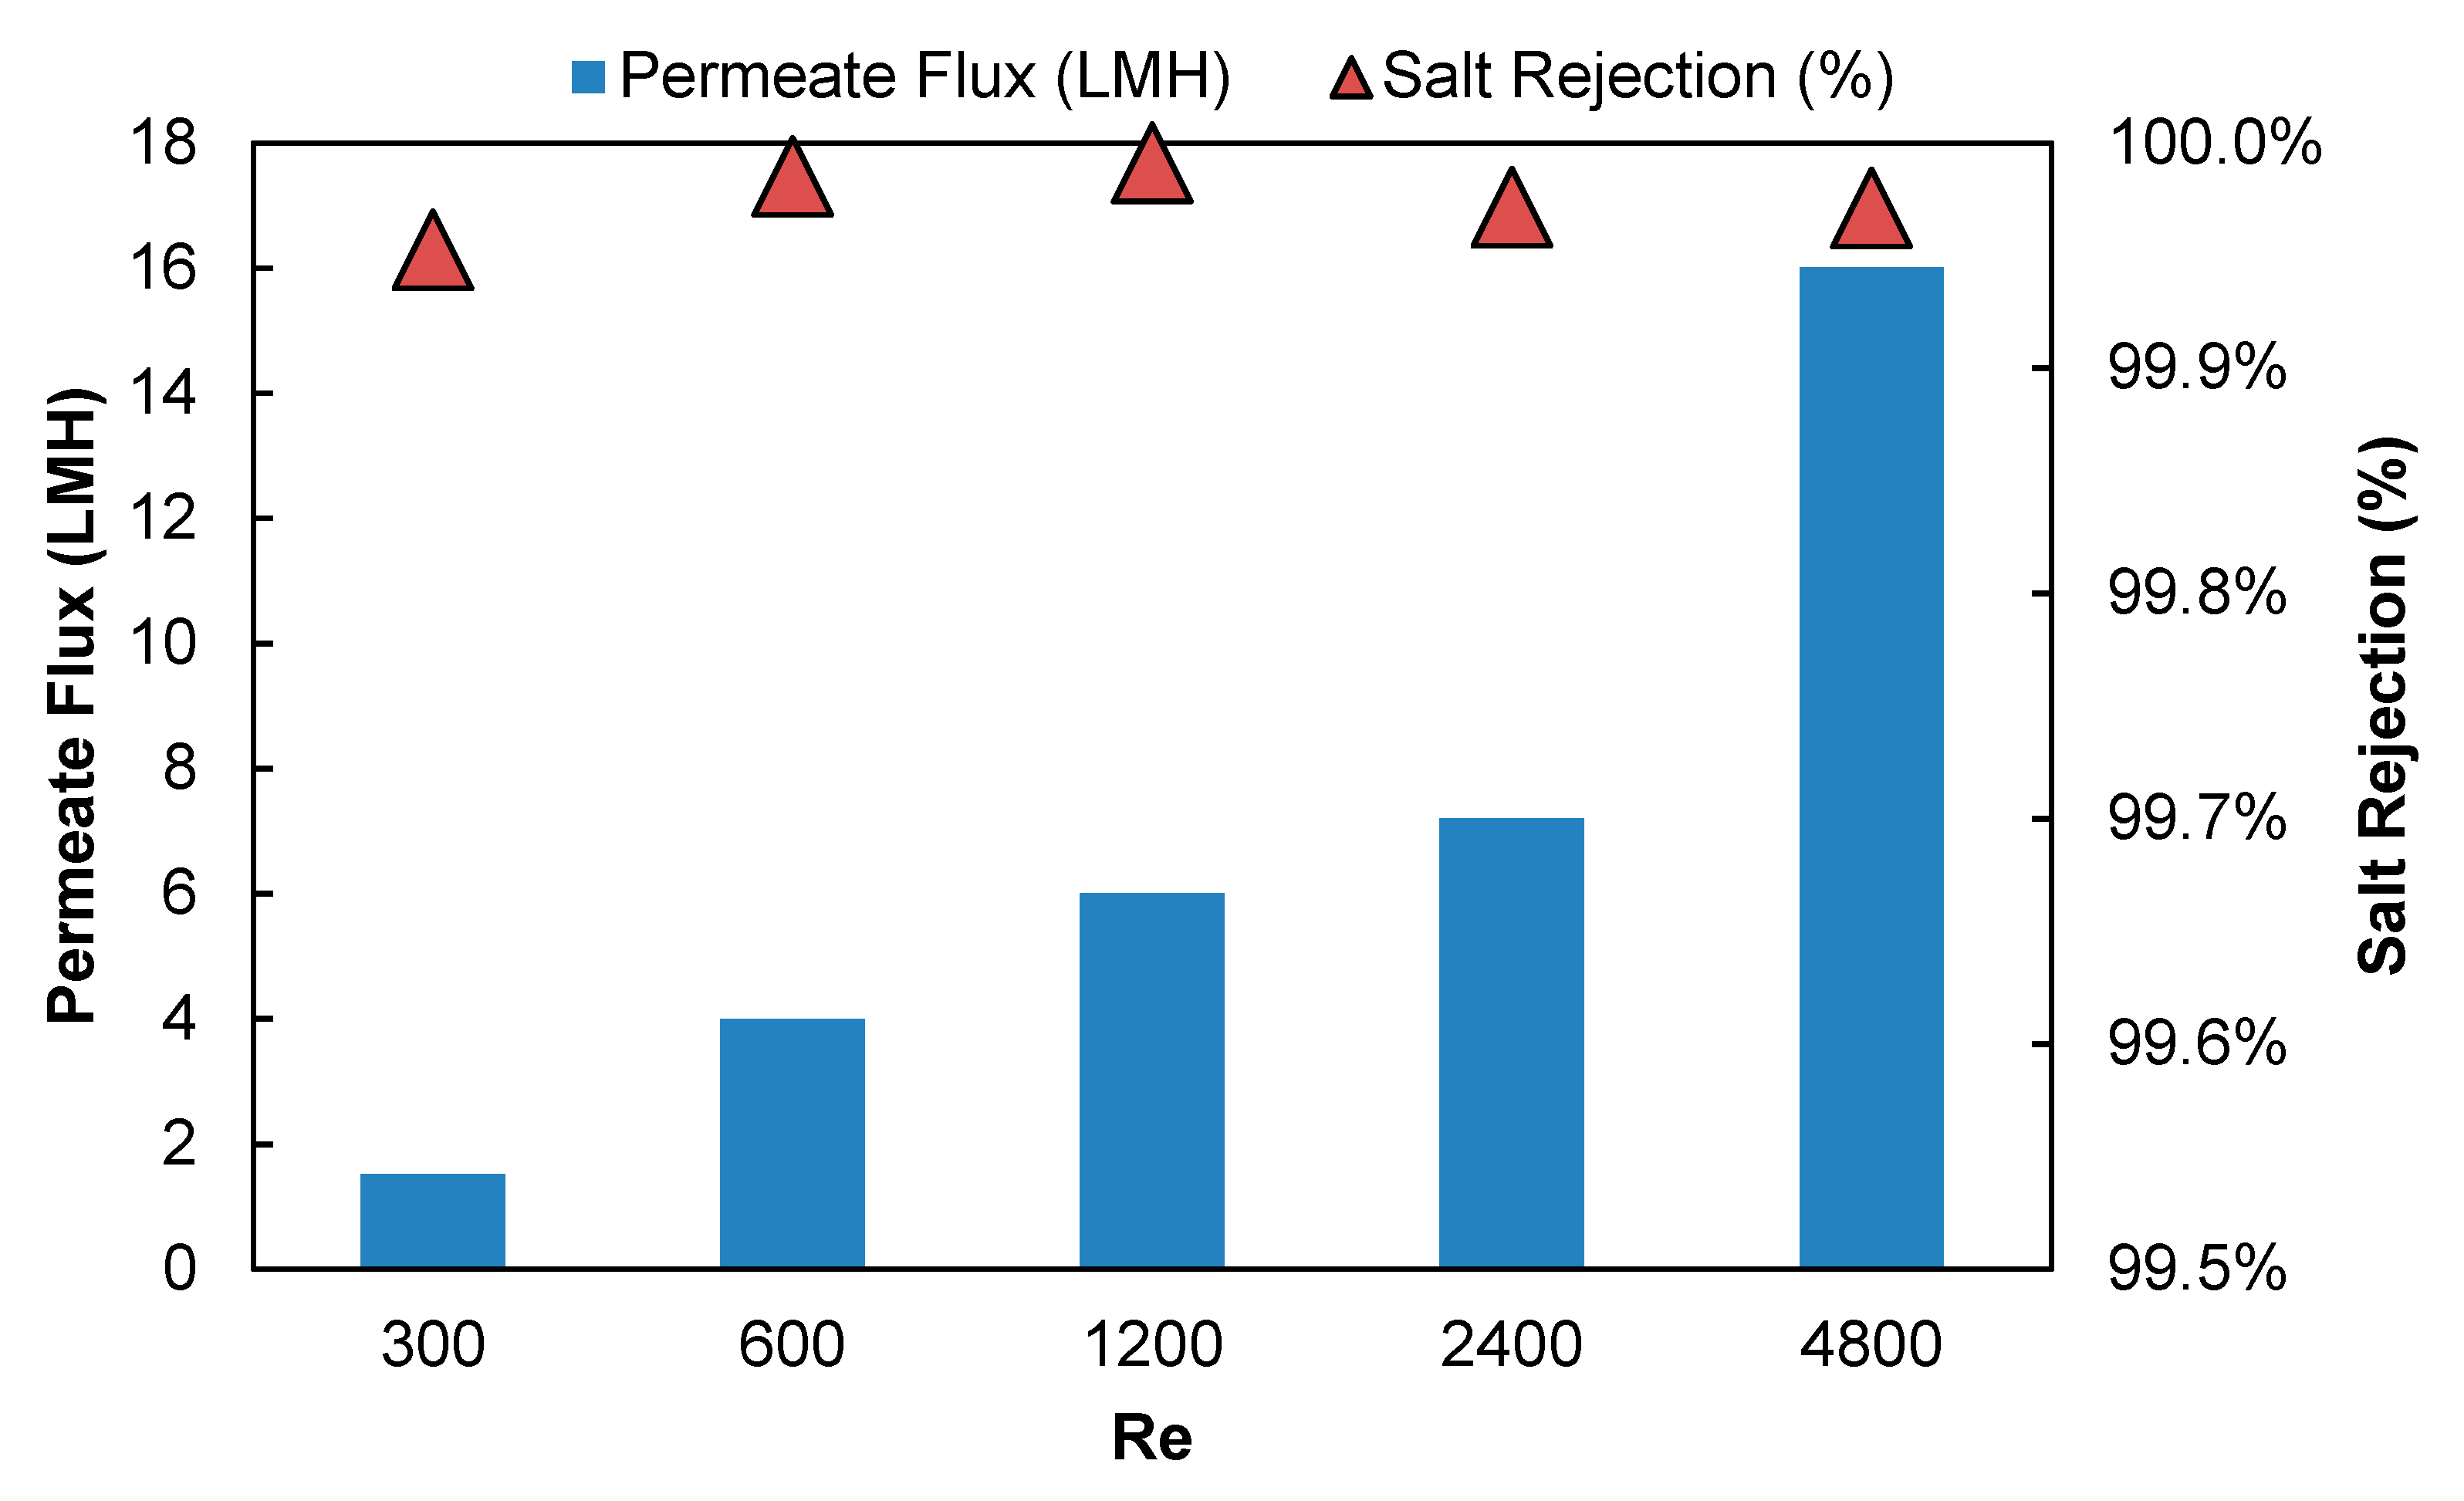
Figure 6 shows the effect of the feed crossflow Reynolds number on the pervaporation performance of the PVD system when the feed flow rate varied from 0.04 to 0.56 L/min at the feed concentration of 15 g/L and temperature of 85 °C. Permeate vapor flux substantially increased from 1.5 LMH to 16 LMH when the feed crossflow Reynolds number increased from 300 to 4800. As Re number increases, assuming the change in water diffusivity with temperature is directly proportional to T, the water diffusivity increase due to temperature increase is less than 3.6%. In
Table 3, we present the membrane surface temperature, surface salinity, and partial vapor pressure difference under different hydraulic conditions calculated with the model described in
Section 2.6. The results show that as feed flow rate increased, the flow regime in the feed channel changed from laminar flow to turbulent flow, which helped to reduce concentration polarization (evidenced by lower membrane surface salt concentration) and temperature polarization (evidenced by higher membrane surface temperature). In contrast, the driving force for permeation (feed-side interfacial water partial pressure) is almost three times higher at Re 4800 than for Re 300 (
Table 3). The change in membrane surface temperature and salinity could also change in membrane structure, which could account for the additional increase in flux with temperature (Equation (14)). These findings imply that the mass transfer on the feed side was significantly limited by the extent of concentration and/or temperature polarization, which is consistent with results from other studies [
25]. Therefore, both polarization phenomena need to be managed to enhance mass transfer in PVD systems.
3.2. Salt Rejection
The observed NaCl rejection of PVD system remained above 99.86% under all the tested operating conditions, which is similar to the typical rejections in conventional VMD processes [
28,
29,
30,
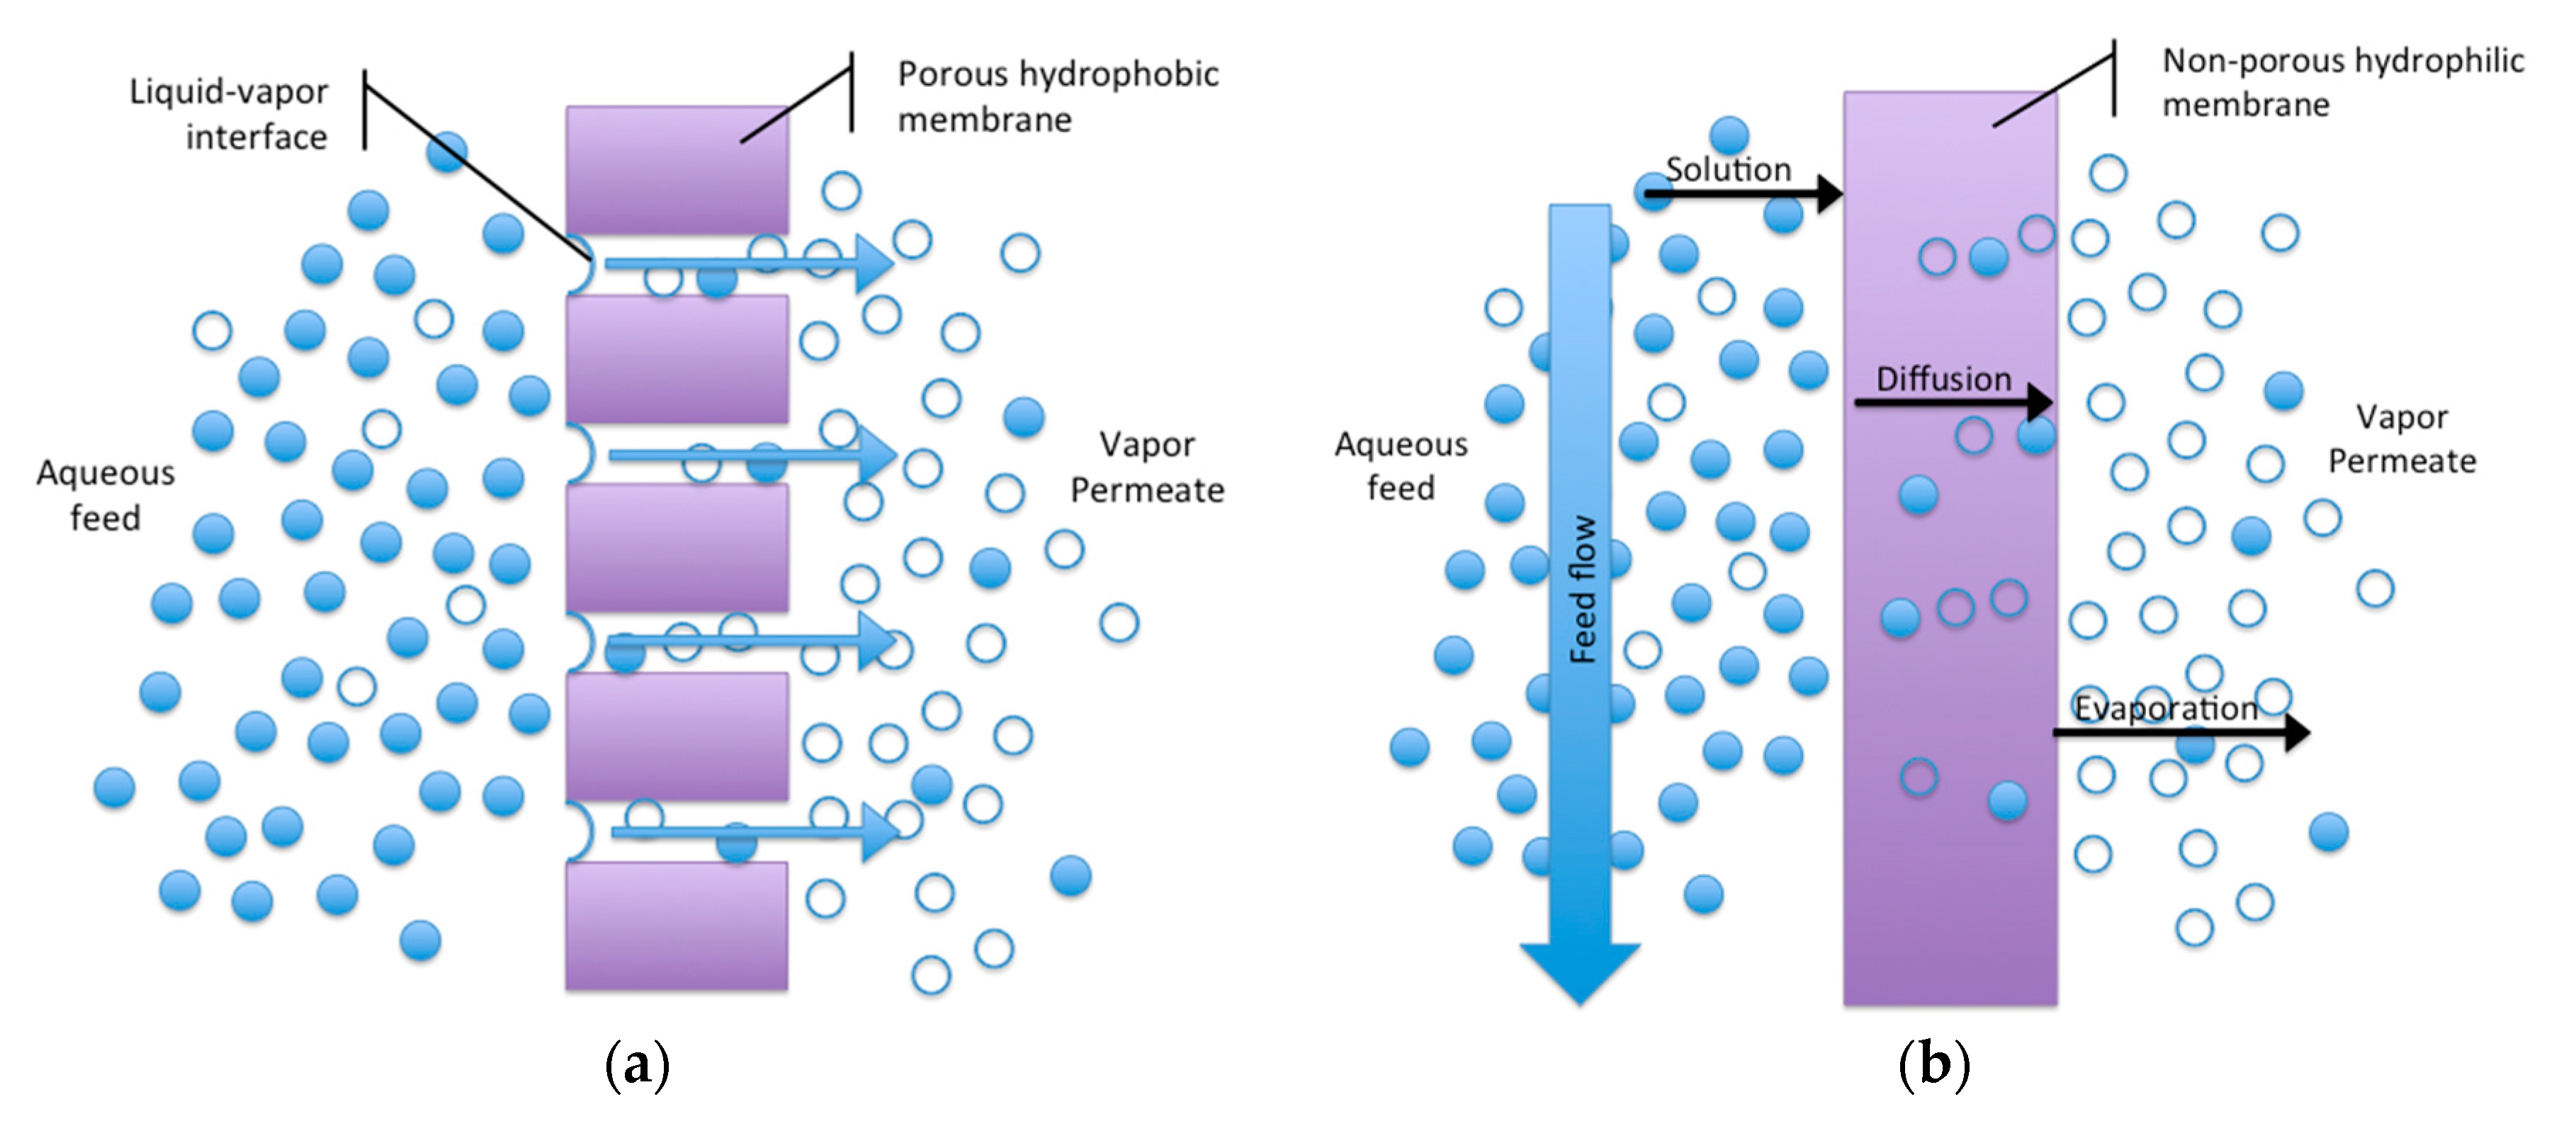
31]. The permeate salt concentrations were below 10 mg/L in all cases. The high salt rejection was expected because NaCl, as a non-volatile compound, is not likely to penetrate the dense PV membrane material and enter the vapor stream on the permeate side. The mass transfer in a PVD process can be described by solution-diffusion model, which indicates that sorption selectivity is more dependent on the affinity between the membrane active layer and the permeants in the solution [
8,
59]. As the Hybsi membrane used in the study is hydrophilic in nature [
60], the much smaller water molecules should preferentially partition into the membrane, diffuse across the dense coating film and evaporate through the porous ceramic support. While some salt uptake by the coating film is likely to occur, being non-volatile there is no obvious mechanism for NaCl to make its way into the distillate [
8,
25].
3.3. Synthetic Produced Water Treatment with PVD Process
Produced water ranges in dramatically in quality and composition depending on the geological formation as well as the oil & gas production method employed; a comprehensive review is beyond the scope of this study, but the reader is directed to other references for more details [
61,
62]. The water quality (after de-oiling) of an actual produced water provided by a large California oil & gas producer (anonymity requested) is reported in the third column from the left in
Table 4. According to this water quality, synthetic PW water was made (see recipe in
Table 5) and tested in the PVD process. The results from the OLI simulations are shown in the columns to the right in
Table 4. The fourth and fifth column represents the same ionic concentration at the temperature of 25 °C and 85 °C, respectively. As shown in
Table 4, the solid concentration increased from 8.64 mg/L at 25 °C to 1208 mg/L at 85 °C, which indicates that the synthetic produced water possessed an extremely high scaling potential at elevated operating temperatures. Therefore, warm lime softening and membrane filtration were integrated as pre-treatment to prevent scaling on the PV membranes. The last column shows the water quality after addition of slaked lime and soda ash to reduce scaling potential. The solids were filtered with 0.45-micron membrane at high temperature before feeding the produced water into the bench scale PVD system.
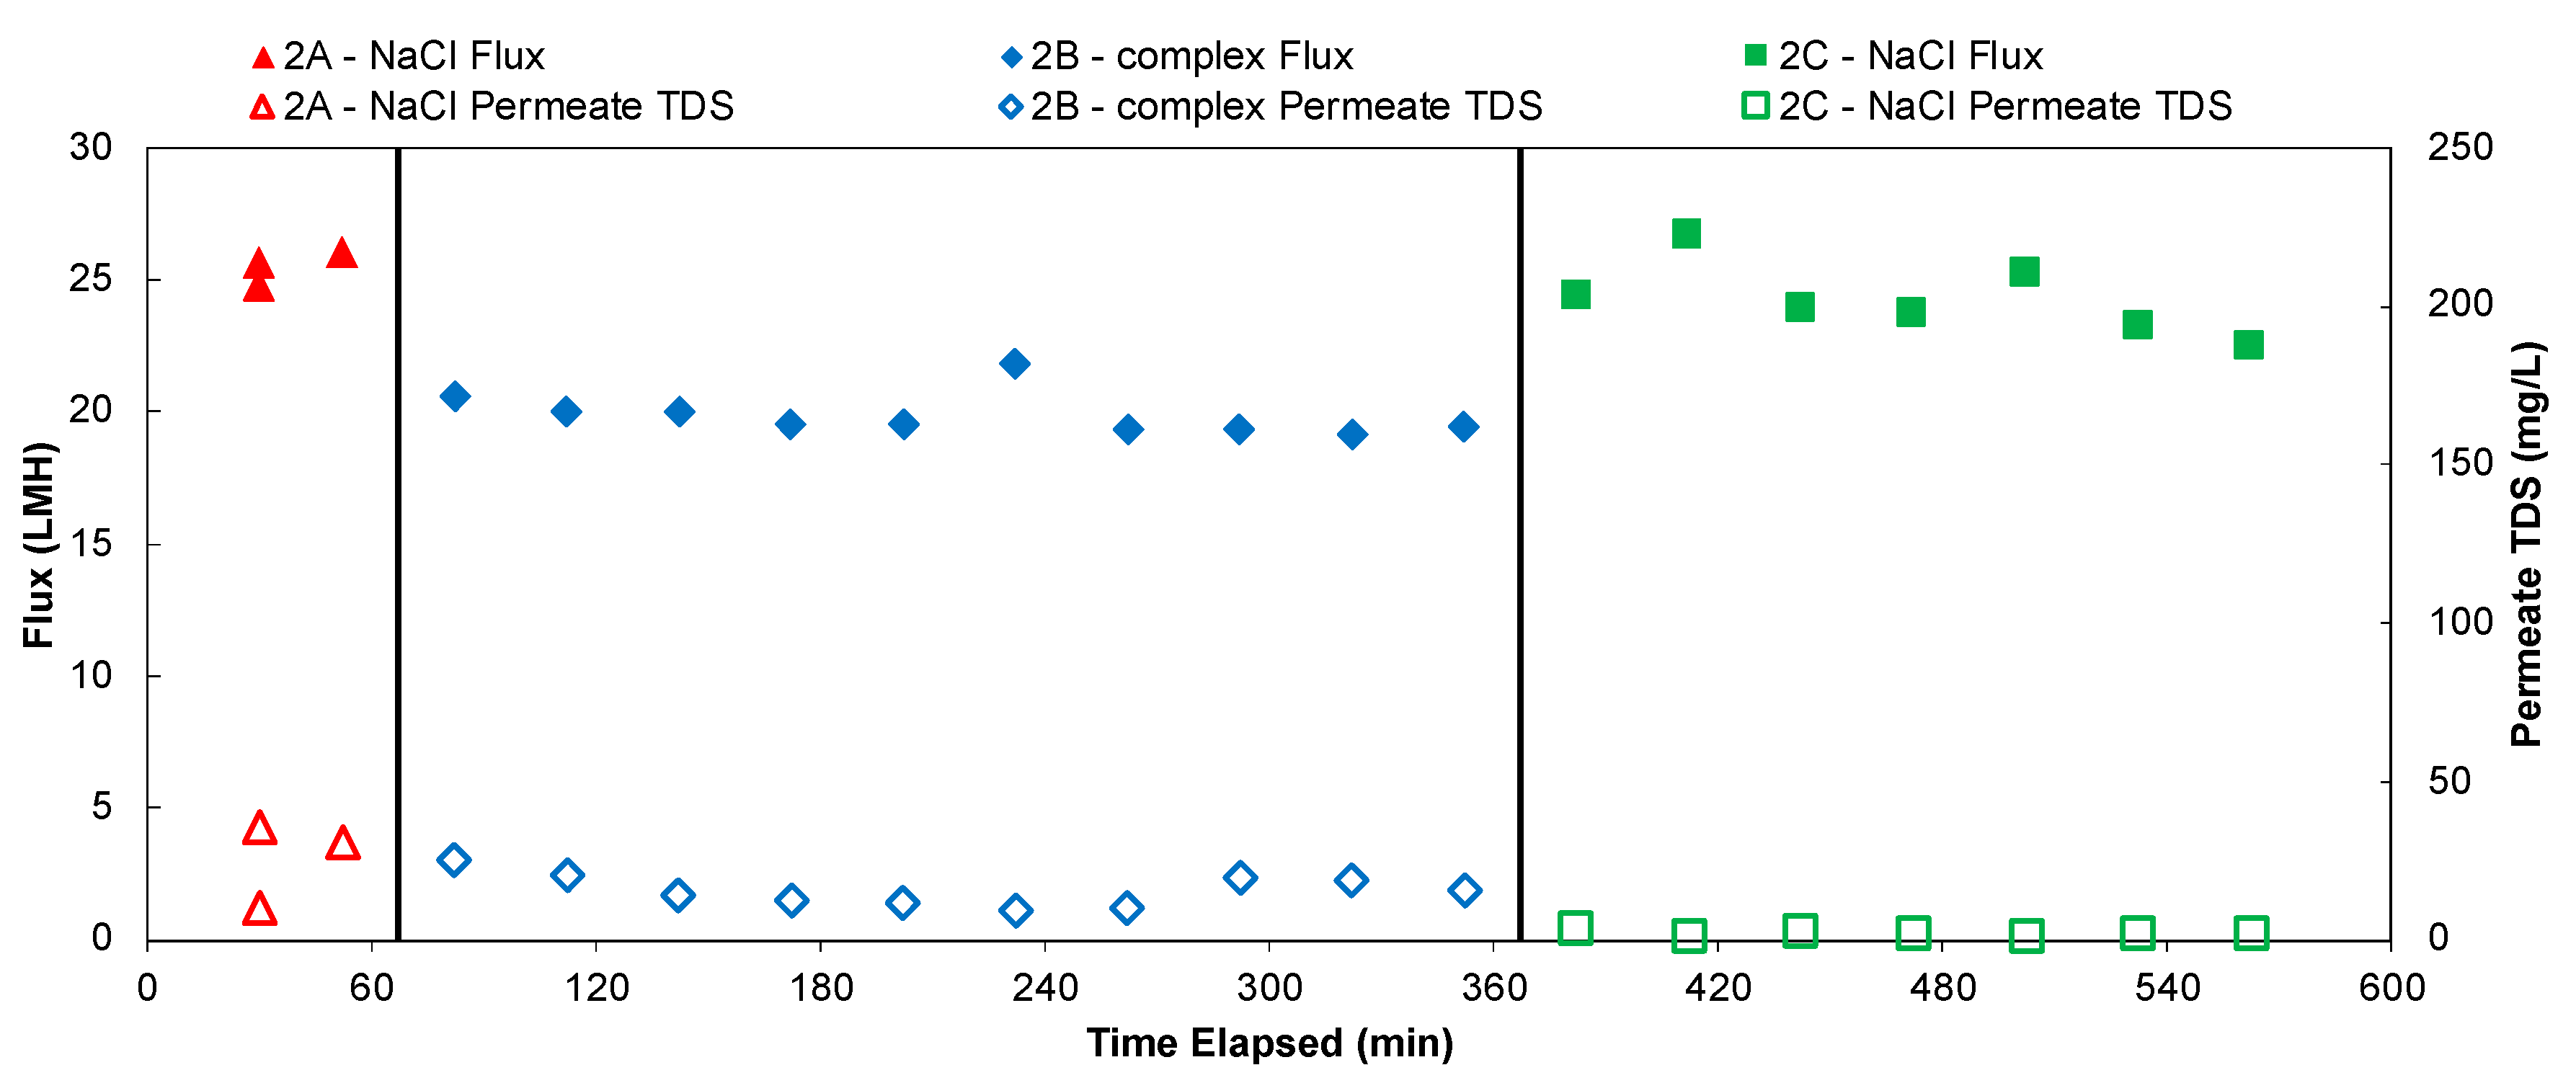
Figure 7 shows the flux and permeate water quality of a 10 h long experiment of desalinating feed solutions that contain 10 g/L TDS, with feed crossflow Reynolds number of 4800, feed water temperature of 85 °C and permeate vacuum of 0.85 bar. Permeate flux and TDS were monitored and recorded every 30 min. In the first ~1 h of the experiment, the feed solution to the system only contains 10 g/L NaCl. The feed water was changed to the softened produced water recipe (TDS = 10 g/L) in the second experiments that lasted for 5 h. Then the feed was changed back to 10 g/L NaCl for the final 4 h. The flux was relatively stable throughout, but water vapor flux declined slightly when the feed water was changed from NaCl solution to the softened produced water solution. The flux bounced back to similar level when the feed water was switched back to NaCl, therefore the effect appears reversible. This can be explained by the change in driving force on the feed side. Although the two feed solutions tested here had the same TDS, the difference in ion composition of the solution could lead to a difference in ionic strength, water activity, salt ion diffusivity and concentration polarization. Compared to NaCl solution, the synthetic produced water contains more multi-valent ions that lower the water activity of the solution, which essentially decreased water vapor pressure on the feed side [
63,
64,
65]. The impact of feed electrolyte composition on water flux through membranes have also been investigated in other studies and a similar trend was reported that the feed solution with multiple ions tend to show lower flux [
9,
55,
66,
67]. Regarding the permeate TDS values, it stayed at a fairly constant level despite the change in feed solutions.
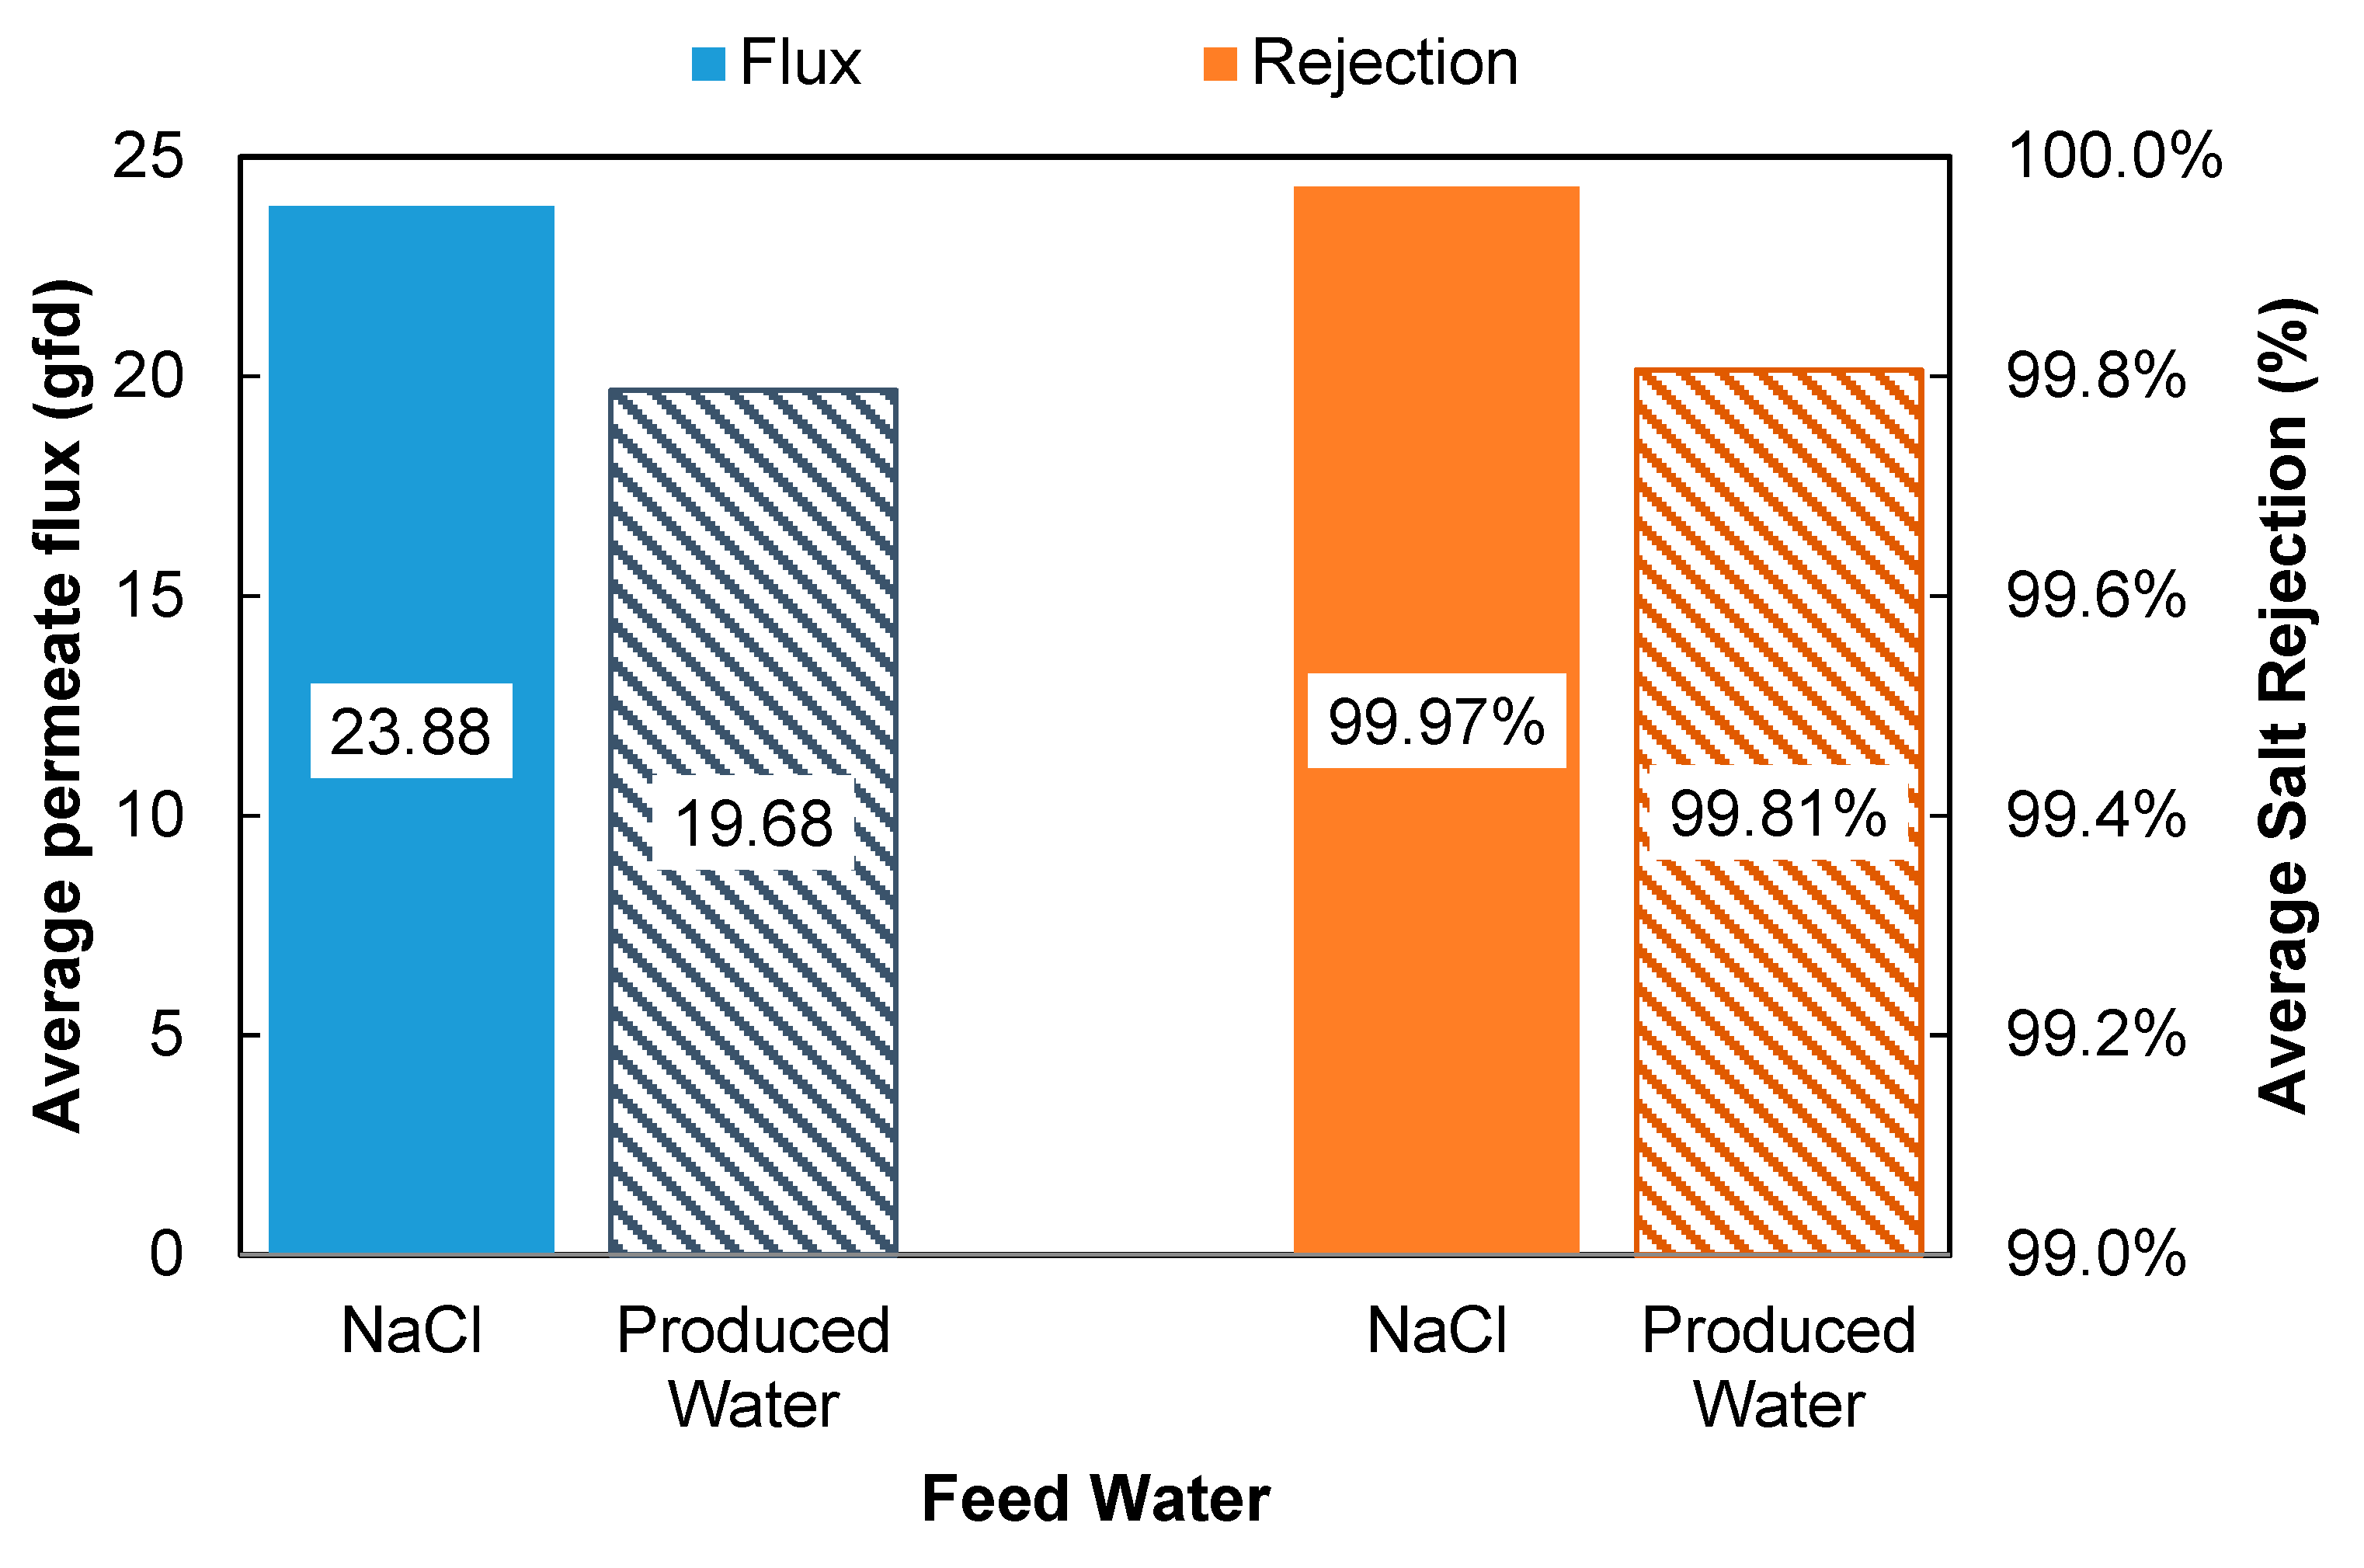
A side by side comparison of the performance data from the produced water and NaCl solution is shown in
Figure 8. The results indicate that the PVD process was able to produce high quality permeate (>99.8% rejection) at 19.7 LMH and 85 °C. Compare to other PVD processes with silica-based membranes reported in literature (
Table 6), the PVD system in this study has exhibited relatively high water vapor flux and salt rejection. More importantly, the PVD system in this study demonstrated stable performance when tested in extreme operating conditions, such as high feed concentration, temperature and cross-flow velocity.
3.4. PVD Process Energy Performance
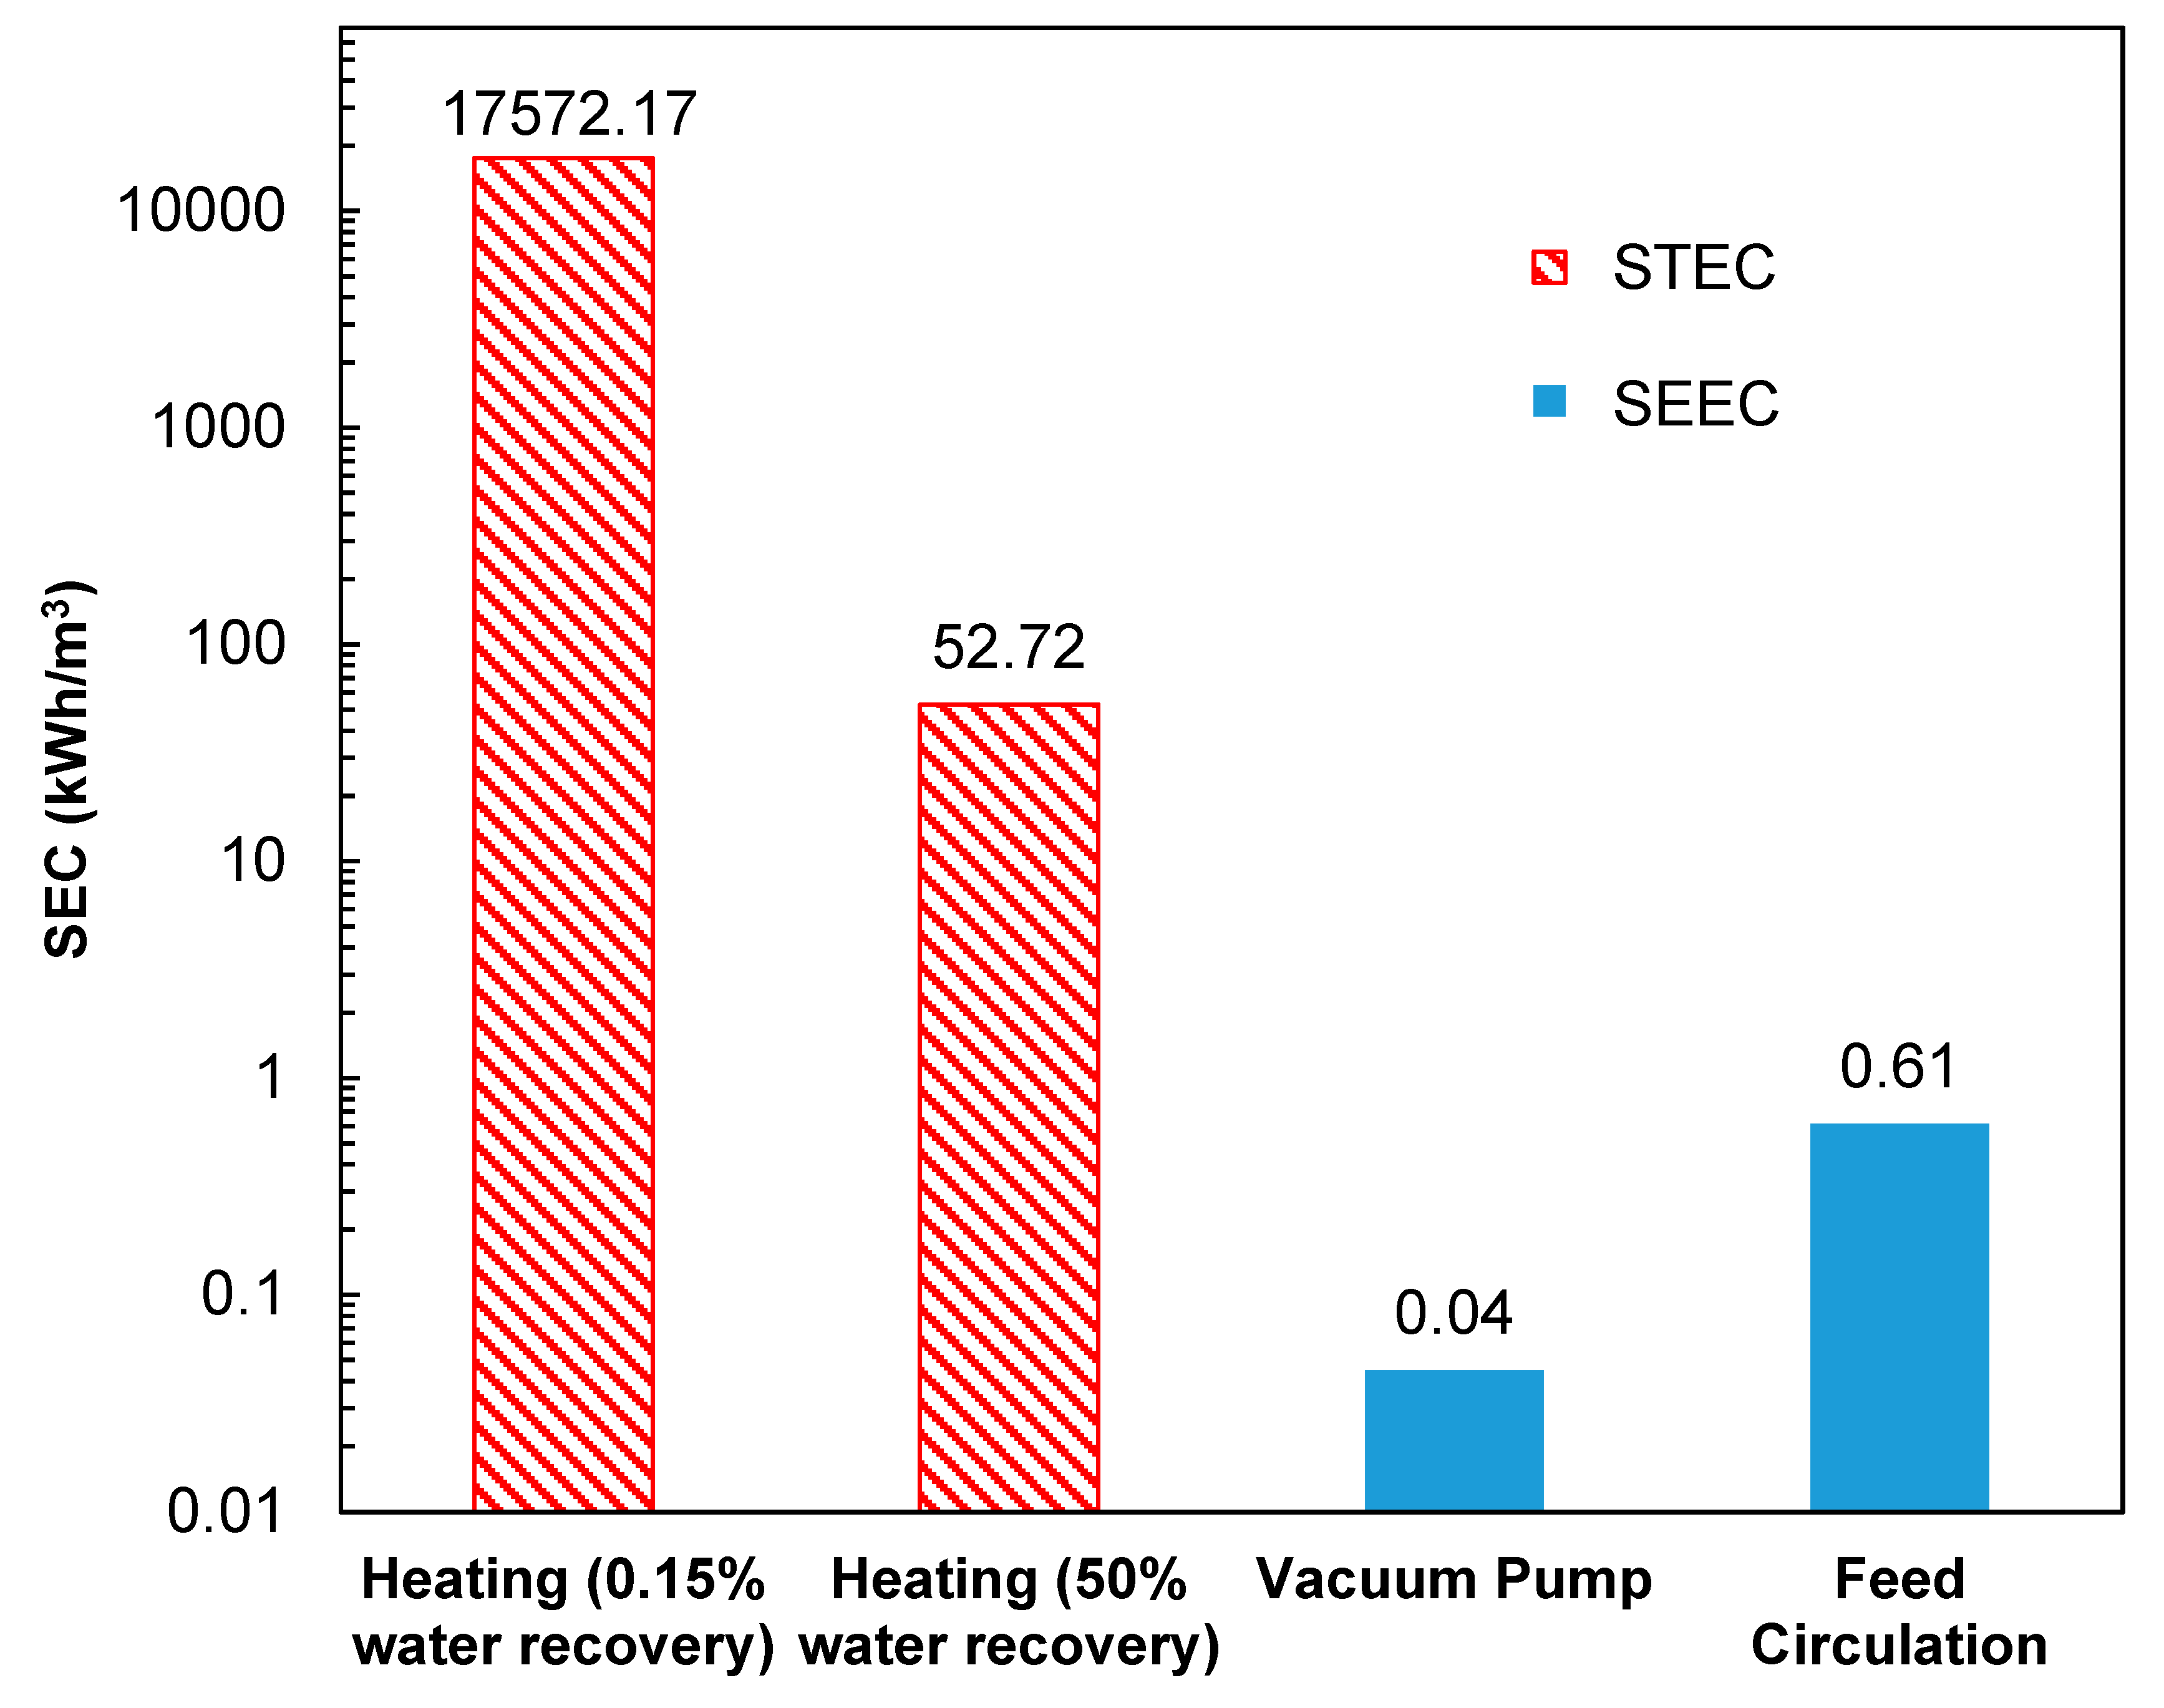
Herein, we chose a scenario to investigate the SEC of the PVD process when the system was operated to treat synthetic produced water (TDS = 10 g/L) at 85 °C with cross-flow Reynolds number of 4800 and permeate vacuum of 0.85 bar.
Figure 9 shows a breakdown of the different energy components for PVD of the produced water and the NaCl feed solution. It is clear that the specific thermal energy consumption dominants the overall SEC. In a lab-scale system with low water recovery such as the one demonstrated here (~0.15% recovery), a total amount of 17.6 MWh thermal energy was needed to heat up the feed from ambient temperature to 85 °C to generate permeate flux at the rate of 23.8 LMH. In a full-scale system with a much higher water recovery (
typ., 30 to 90%), the required thermal energy drops down to 52.7 kW·h/m
3 at 50% water recovery. Compared to thermal energy, the electrical energy remains negligible, as indicated by the small SEEC values in
Figure 8. Note that the SEC values are very sensitive to permeate flux, which could vary substantially as a function of recovery and other operating conditions.
Although the SEC values reported here only reflect the energy performance of one specific PVD system operating at a preset condition, the conclusion still holds that PVD would likely be more energy-intense at scale than other desalination processes such as reverse osmosis (RO), reverse electrodialysis (RED), multi-stage flush (MSF), multi-effect distillation (MED), and vapor compression (VC). The findings are consistent with other studies that PVD requires very little electricity, but consumes large amount of thermal energy [
8,
26,
78]. In fact, the electrical energy needed for PVD is the lowest compare to other desalination technologies (
Table 7) [
78,
79,
80]. If low grade or waste heat could be harvested and/or renewable energy such as solar thermal energy could be integrated to provide the thermal energy needed to drive a PVD process, the overall fossil fuel-derived energy consumption of PVD process could be dramatically lower [
21,
22,
23,
26]. Additionally, heat recovery could be considered as another strategy to lower thermal energy consumption.
The results showed that pervaporative desalination cannot compete with other desalination technologies directly from the perspective of specific energy consumption. However, PVD process still possesses some advantages that might make it attractive in some applications. First of all, PVD process is capable of desalinating hypersaline feed (up to 240 g/L from this study) such as oil and gas hydraulic fracturing produced water; thus, it can be implemented to concentrate wastewater on-site and facilitate minimal liquid discharge, directly, and if combined with a crystallizer, zero liquid discharge. Second, when waste heat or solar heat is integrated to provide “free” thermal energy, PVD requires much less electrical energy compared to other thermal process such as MSF and MED. In addition, PVD is more robust and less prone to system failure compare to traditional porous membrane-based MD processes, which suffer from pore-wetting related process failure.

 ,
, 


