Article

The Horizontal Distribution of Siliceous Planktonic Radiolarian Community in the Eastern Indian Ocean

1
Research Centre for Indian Ocean Ecosystem, Tianjin University of Science and Technology, Tianjin 300457, China
2
Research School of Earth Sciences, Australian National University, Acton 2601, Australia
3
Department of Ocean Science, Hong Kong University of Science and Technology, Kowloon, Hong Kong
4
College of Biotechnology, Tianjin University of Science and Technology, Tianjin 300457, China
5
College of Marine Science and Technology, China University of Geosciences, Wuhan 430074, China
*
Author to whom correspondence should be addressed.
Water 2020, 12(12), 3502; https://doi.org/10.3390/w12123502
Submission received: 9 October 2020 / Revised: 2 December 2020 / Accepted: 3 December 2020 / Published: 13 December 2020
(This article belongs to the Special Issue Microbial Communities in Water Environments: Dynamics and Interaction)

Abstract

:
The plankton radiolarian community was investigated in the spring season during the two-month cruise ‘Shiyan1’ (10 April–13 May 2014) in the Eastern Indian Ocean. This is the first comprehensive plankton tow study to be carried out from 44 sampling stations across the entire area (80.00°–96.10° E, 10.08° N–6.00° S) of the Eastern Indian Ocean. The plankton tow samples were collected from a vertical haul from a depth 200 m to the surface. During the cruise, conductivity–temperature–depth (CTD) measurements were taken of temperature, salinity and chlorophyll a from the surface to 200 m depth. Shannon–Wiener’s diversity index (H’) and the dominance index (Y) were used to analyze community structure. There was a total of 168 plankton species, composed of Acantharia, Phaeodaria, Polycystina, Collodaria and Taxopodida (monospecific—Sticholonche zanclea, Hertwig is the only recognized species). Hence, it included both celestine-based and siliceous organisms, which are also described here for the first time from this region. Total radiolarians ranged from 5 to 5500 ind/m−3, dominated by co-occurrences of Sphaerozoum punctatum and Stichonche zanclea species at the south-equator zone (SEQ)-transect 80° E and equator zone (EQ)-transect Lati-0. The possible environmental variables were tested through RDA analysis; although no result was obtained for the full species dataset, the samples from the equatorial transect related strongly to mixed-layer chlorophyll a concentration and those of a north–south transect to surface silicate concentrations or mixed-layer nitrate were significantly correlated (p < 0.01) to the radiolarian community. Our results indicate that the silicate and chlorophyll-a concentrations are the two major factors affecting the radiolarian distribution along two of the investigated transects (southern equator and equator) in the study area.

Highlights:
-
First comprehensive plankton-net sampling of Eastern Indian Ocean.
-
Apparent dependence of some observed taxa of particular oceanic environmental variables.
-
Explanatory environmental variables for plankton abundances in two cruise transects.

1. Introduction

Radiolaria are the siliceous-shelled, single-cell, planktonic organisms frequently studied for palaeoceanographic and environmental reconstruction. They are globally distributed and widely collected from plankton tow and sediment samples around the world’s oceans [1]. They are one of the most diverse group found in all water depths of the ocean [2] and a good indicator of water masses [3,4]. Radiolarian protists have opaline silica (SiO2-nH2O), strontium sulfate or calcium carbonate skeletons and are characterized by central capsule shells and axopodia spines [5]. They also contribute significantly to the deposition of silicate from the ocean’s upper layer to the bottom sediments [6,7]. They are the second most important producers of biogenic opal and siliceous oozes in the oceans, exceeding the effect of diatoms in equatorial regions [8]. Usually, they contribute 14 to 31% of the total bSiO2 export in the Ocean [9,10].
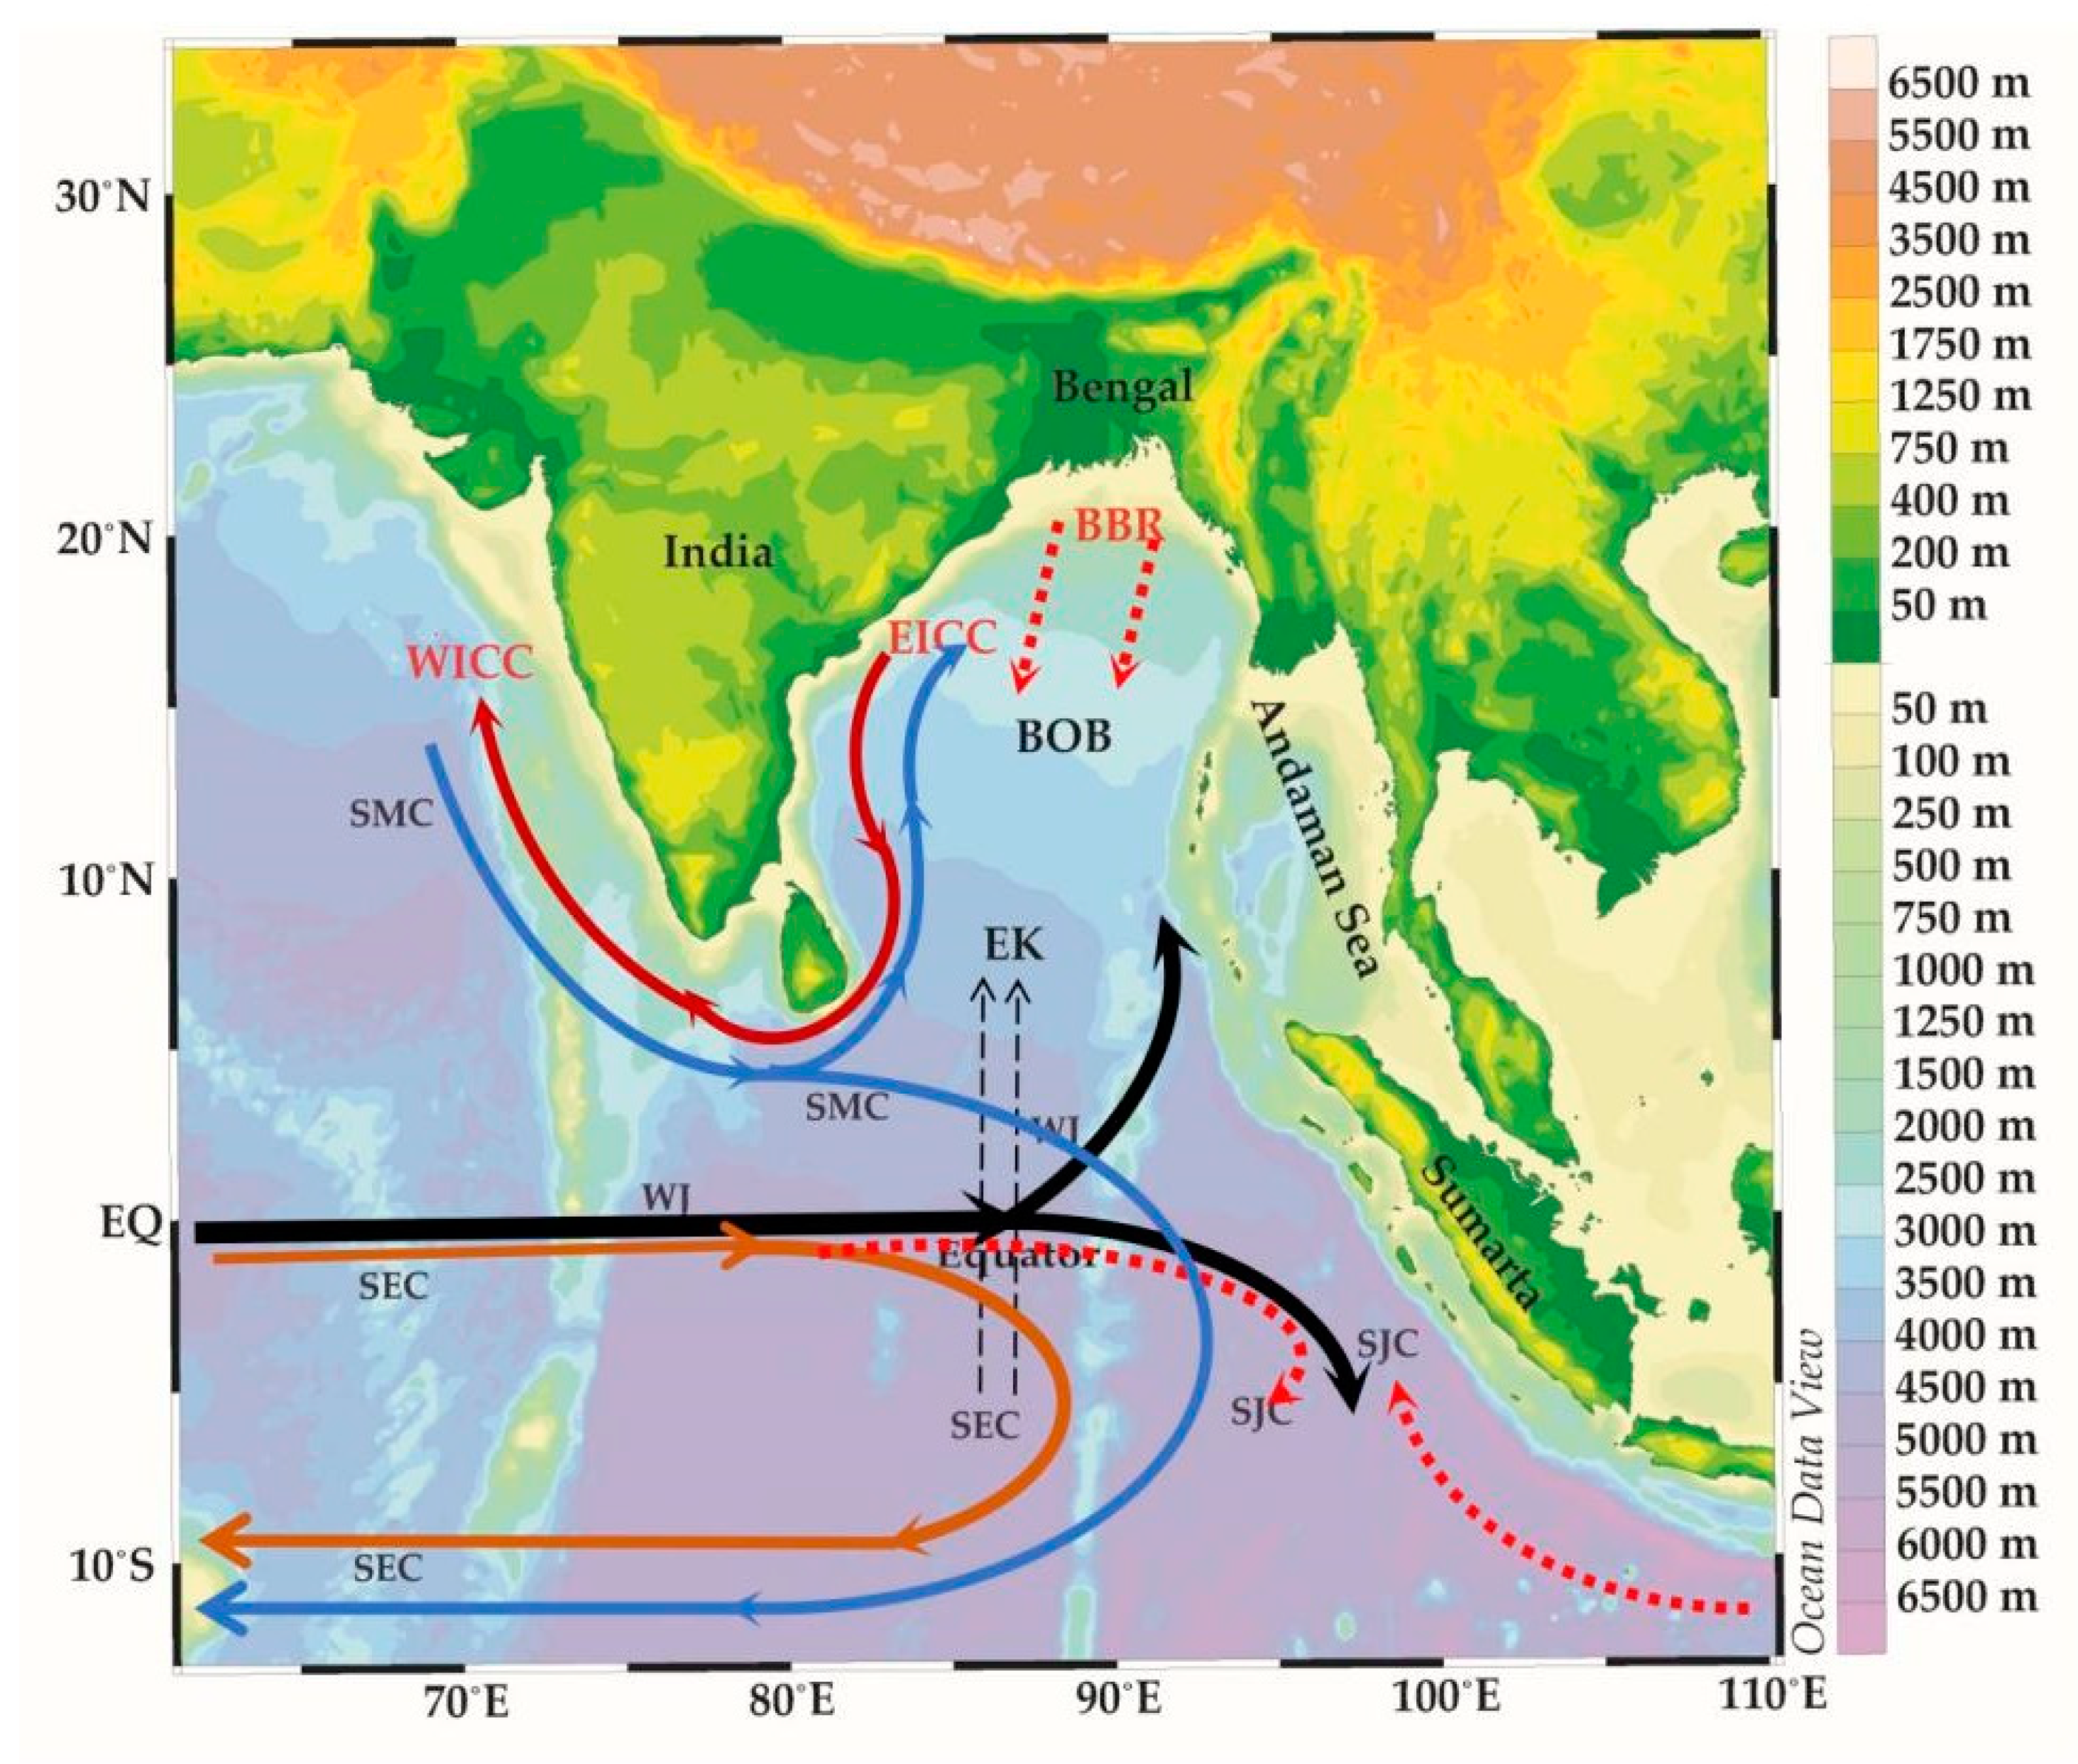
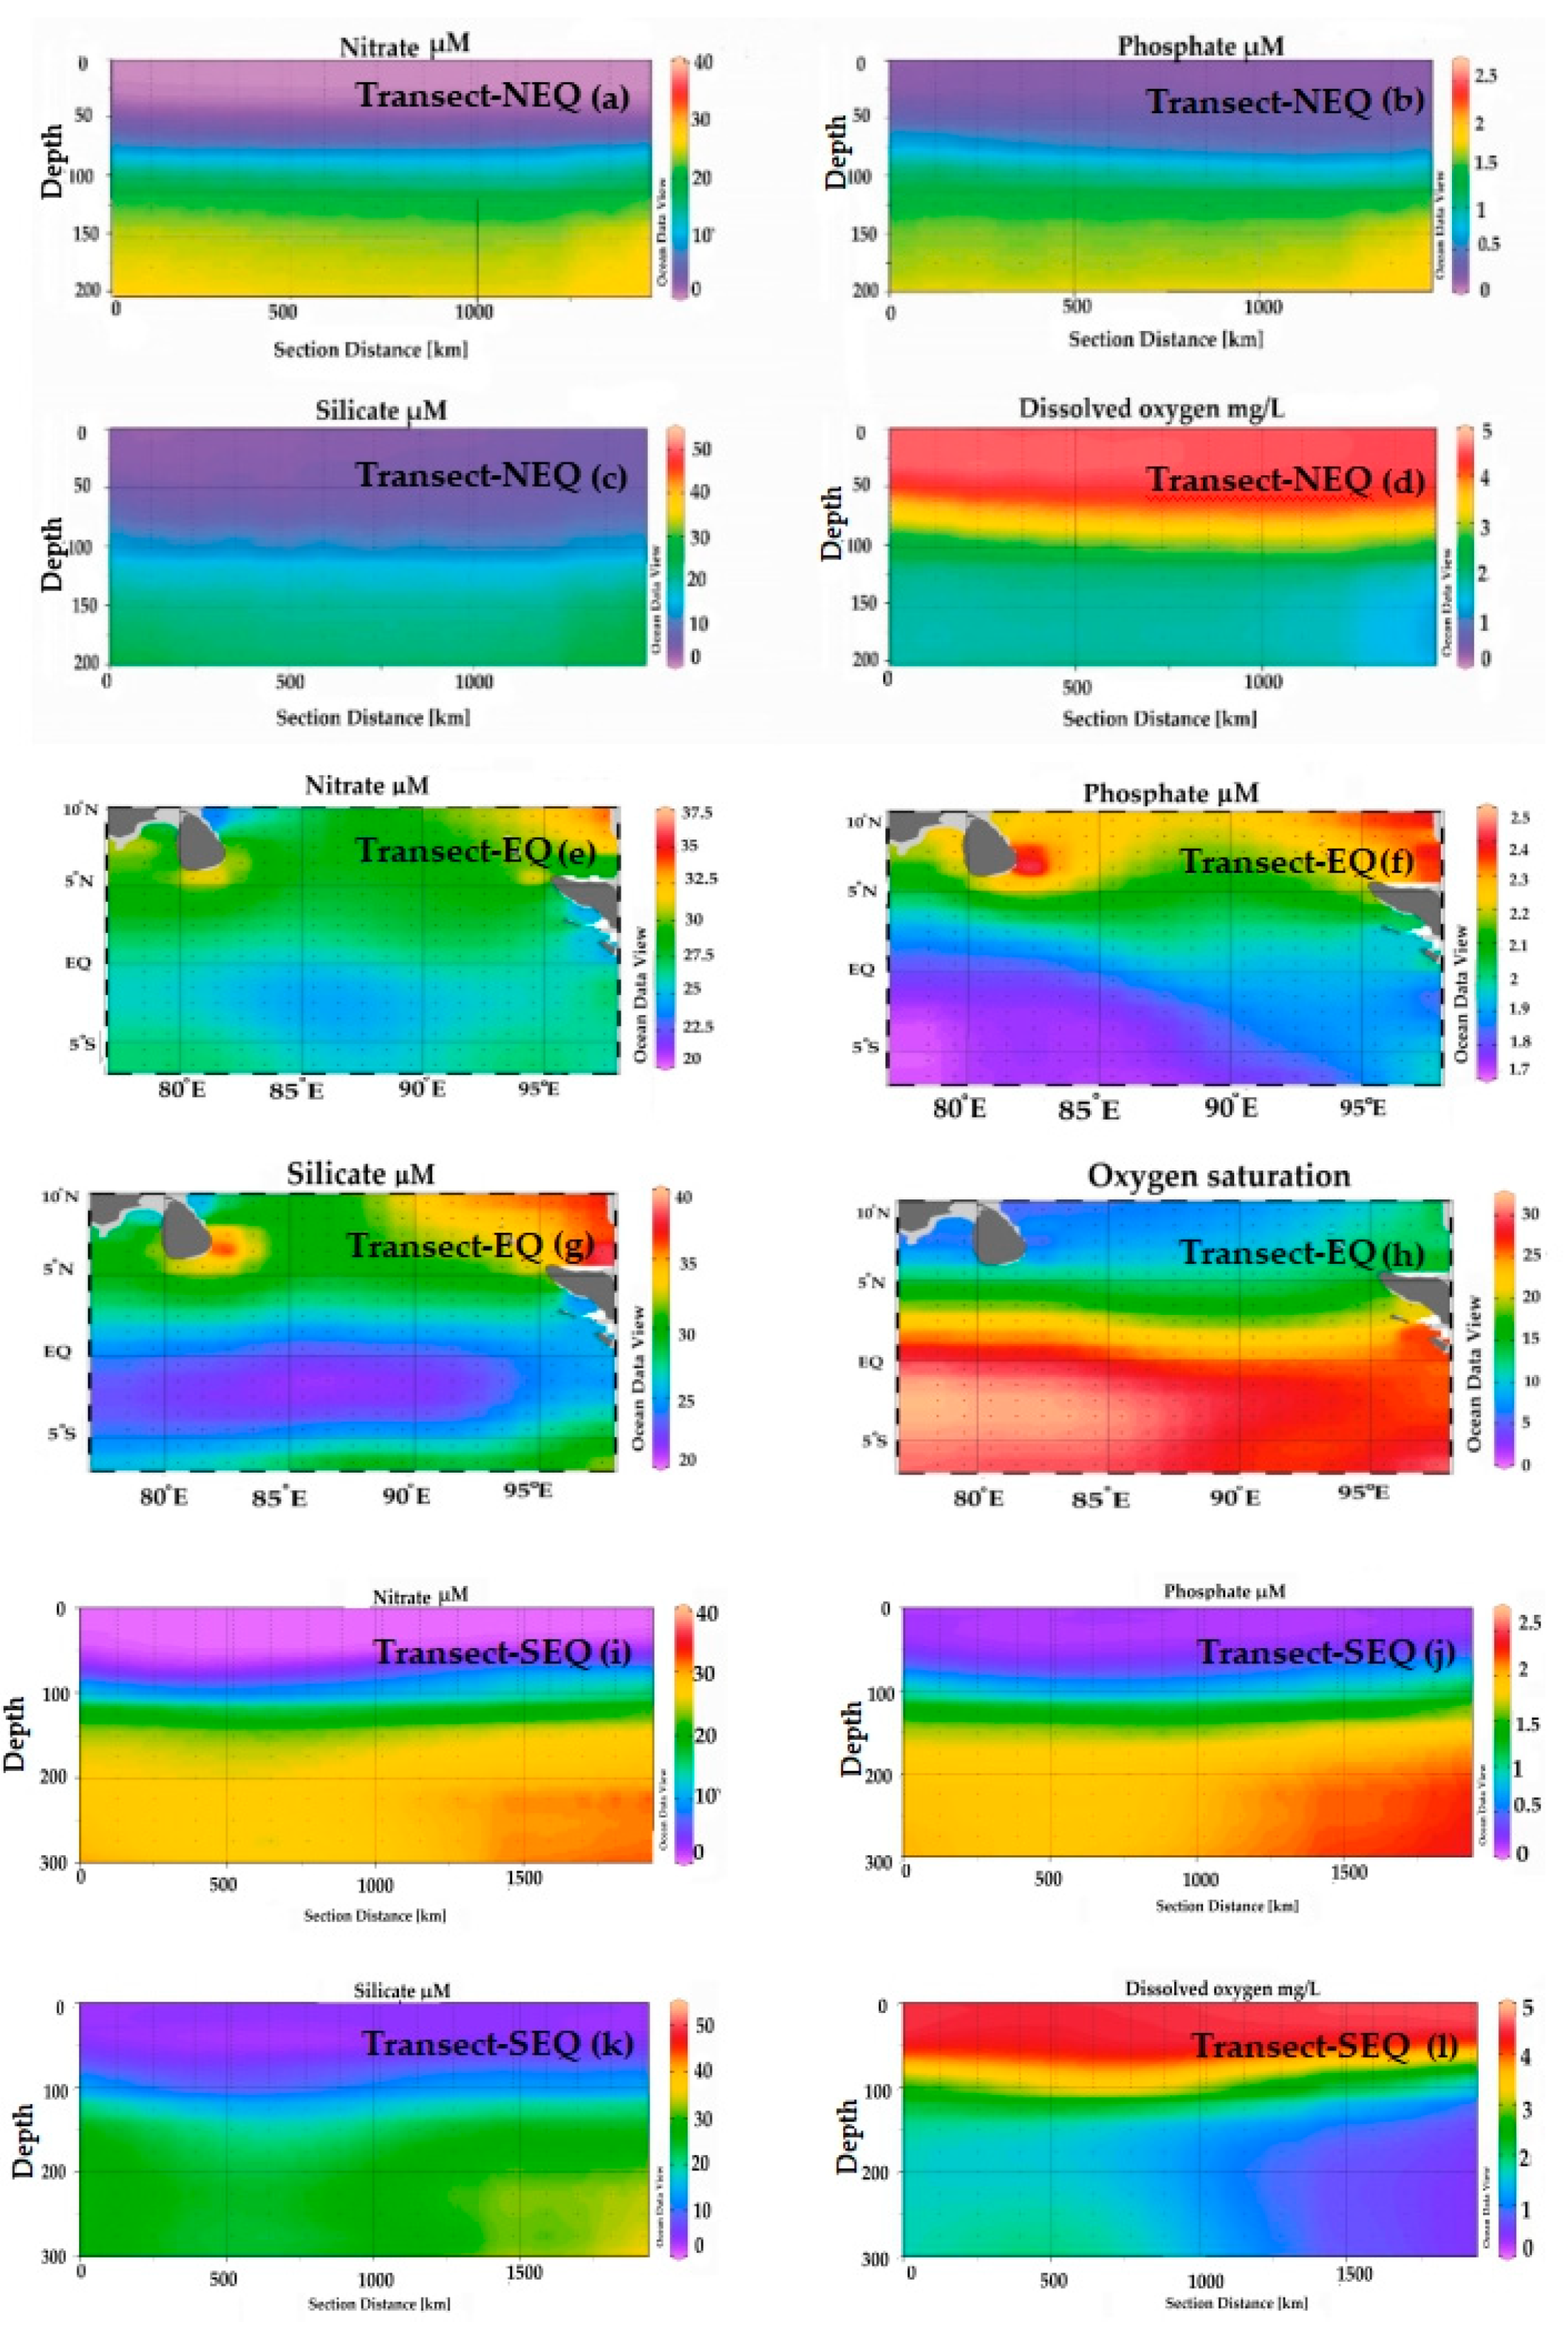
The biogeographical distribution of radiolaria has been reported from the Atlantic Ocean [11,12,13,14], the Pacific Ocean [15,16,17,18,19,20,21,22], the Arctic Sea [23] and the Indian Ocean [24,25,26,27]. The Eastern Indian Ocean (EIO) is part of one of the three largest oceans globally and is geographically located at the equator, covering 1000 km2–5000 km2 area [28,29]. It is divided into two semi-enclosed basins from the Bay of Bengal (BOB) and the Arabian Sea [28]. The Eastern Indian Ocean has complex oceanography due to semiannual prevailing currents [28,30]. It is characterized by four mainstream ocean currents (Figure 1), which are known as BBR (Bay of Bengal runoffs), EICC (east India coastal current), WICC (west India coastal currents), EK (Ekman transport), SEC (south equatorial counter-current), SJS (south Java current), SMC (northeast and southwest monsoon currents) and WJ (Wyrtki jets) currents [28,29,31,32]. The EICC flows equatorward along the western boundary of the BOB before crossing to the east of Sri Lanka. Along the Sri-Lankan coast, high nutrient concentrations are entrained in the EICC [31]. The WJs are eastward surface currents that only occur in the equatorial EIO during the spring (April–May) and result in a deep upper mixed layer [33,34]. On the eastern side of the basin, the WJs cause a decline in the thermocline and nitracline, leading to decreases in phytoplankton primary production in May [33,34,35]. The conductivity–temperature–depth (CTD) profiles from 0 to 200 m and nutrients from the World Ocean Atlas (WOA13) during the boreal spring season (April–May) in the Eastern the Indian Ocean, described from the three transect areas, south-equator zone (SEQ), north-equator zone (NEQ) and equator zone (EQ) (Figure 2 and Figure 3a–l). The temperatures ranged from 15 to 30 °C and salinity varied from 35.0 to 36.8 psu, maximum SST and SSS are reached in the south-equator during this season, compared to the northern BOB and Sumatran coastal area [29], which becomes stratified. The nitrate and silicate concentrations are 6.09 µM to 40.38 µM, which has no obvious different distribution trend (Figure 3). The concentrations of nitrite and silicate are higher in the northern part of the NEQ transect area (Figure 3a,c), while the concentration near the equator is low (Figure 3e,g). Phosphate values are 0.38 to 2.5 µM and the maximum is reached in the equator and Sumatran station (Figure 3b,f). The dissolved oxygen (DO) values are 0.1–4.50 mg/L and the maximum also occurs in the equatorial region (Figure 3h).
Only a few studies have been conducted in the Eastern Indian Ocean and most of them are based on surface sediment samples and the investigation of polycystine radiolarians [24,25,27]. This is the first comprehensive plankton tow sampling study in the Eastern Indian Ocean. The research objectives were to estimate the diversity and horizontal distribution of the radiolarian community from 200 m to the surface of the Eastern Indian Ocean and find out the possible explanatory environmental factors between three transects; NEQ in the north; SEQ in the south-equator and EQ in the central region of the Eastern Indian Ocean. Radiolarian are key players in biogeochemical processes such as transformation of silica and carbon. Their composition and distribution characteristics in the EIO are of great significance for future ecological and molecular diversity research.

2. Materials and Methods

2.1. Sampling Sites and Collections

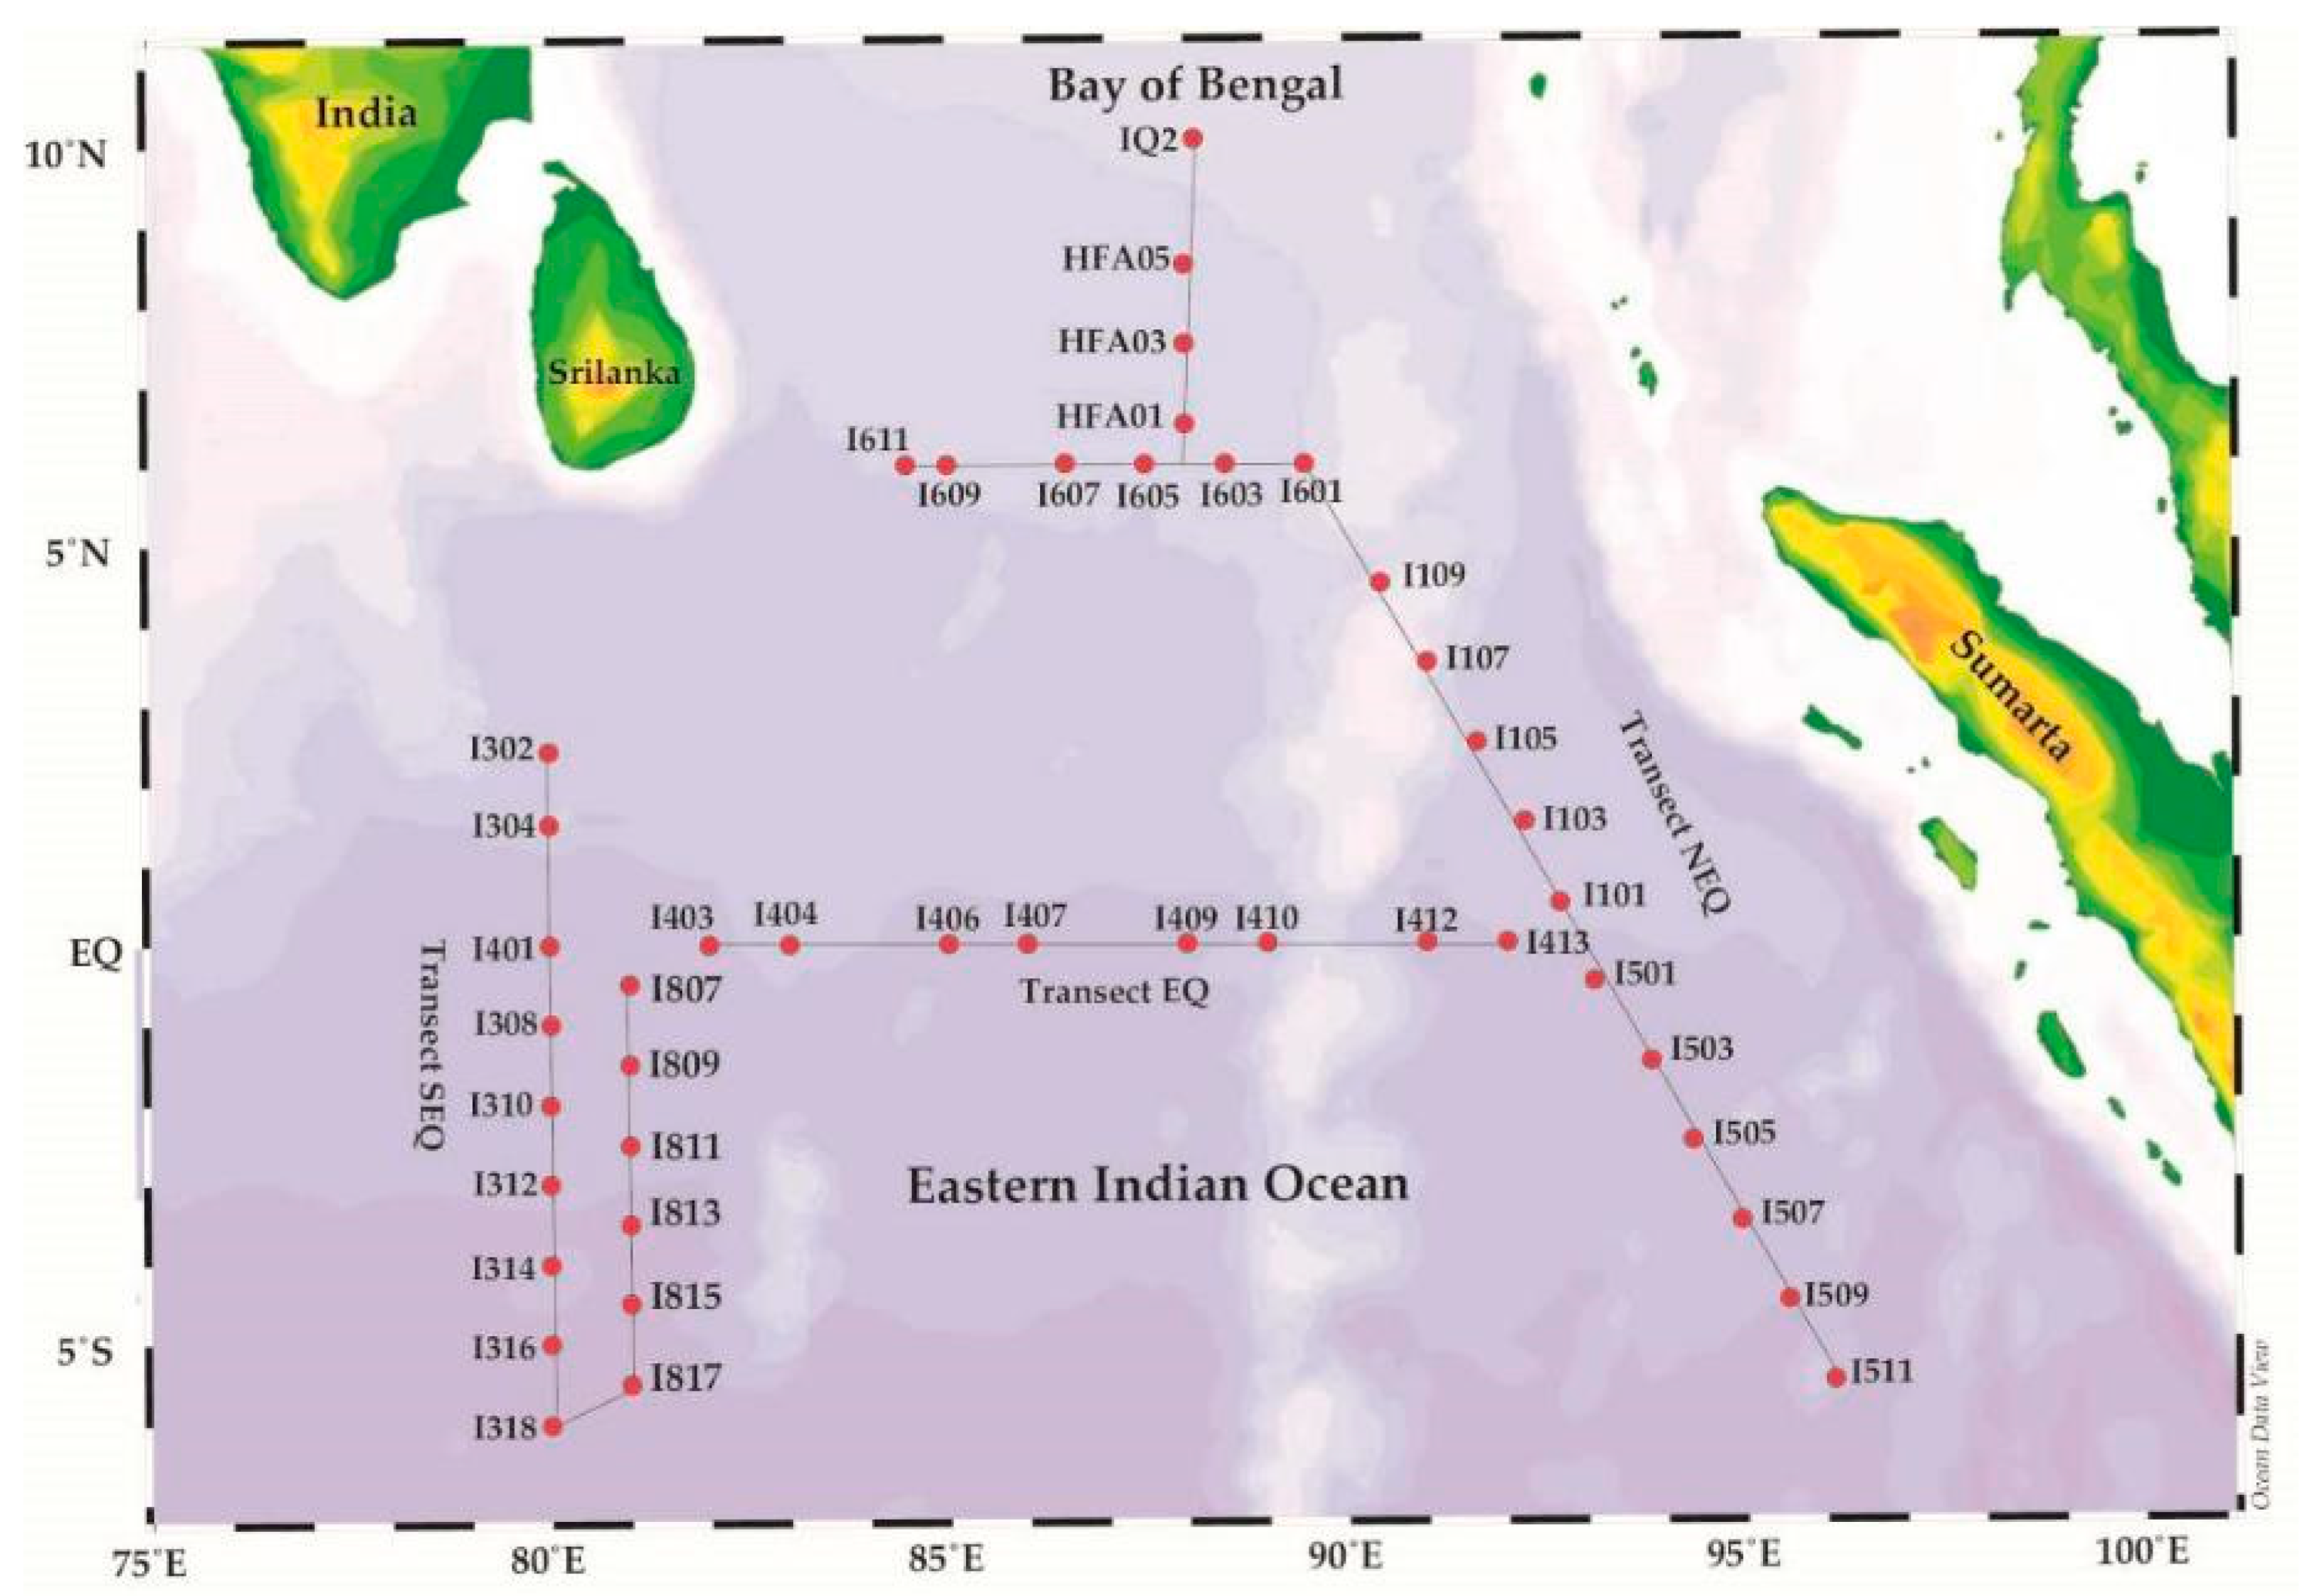
Plankton-net tow sampling was conducted in the Eastern Indian Ocean (80.00°–96.10° E, 10.08° N–6.00° S). The study area covered the ca. 1000–1500 km distance from the Bay of Bengal (BOB) and parallel to the Sumatran coast of Indonesia to equatorial section and southern equatorial zone (Figure 2). The first transect (hereafter “Long-90”) consisting of the 17 stations along the NNW line from 5.5° S, 96.1° E (station I511) to 10.08° N 88.1° E (station IQ2), the second (hereafter, “Long-80”) of 15 stations along two adjacent north–south lines from 2.42° N, 80.0° E (station I302) to 6.0° S 80.0° E (station I318) and the third, which partially overlapped the other two 11 stations (hereafter “Lat-0”), closely followed the equator (Table 1).
Using a modified Indian Ocean Standard Net (20 µm mesh size, 0.57-m diameter, 470 cm, with a mechanical flow meter), samples were collected from a vertical haul from a depth 200 m to the surface. About 1000 mL of sample was collected in each PM bottle and fixed with 2% formalin preservative. Preserved samples in the PM bottles were returned to Dr. Sun’s laboratory (Tianjin University of Marine Science and Technology, China) for analyses.

2.2. CTD Data Collection

Temperature and salinity data were collected using a Seabird conductivity–temperature–depth (CTD) system (SeaBird SBE 911 plus V2). Using the Strickland and Parson [36] method, a standard protocol to measure the chlorophyll a, was employed using 500 mL of seawater filtered through a 25-mm diameter Whatman filter paper and kept in 5 mL of acetone (93%) at 20 °C for 24 h, then analyzed using a fluorometer (Trilogy, Turner Designs, Sunnyvale, CA) for estimation of chlorophyll a.

2.3. Satellite Data

Satellite remote sensing on sea-surface chlorophyll a data (MODIS-aqua level 5 km resolution) was obtained during the spring season (April–May 2014) to evaluated evidence for Eastern Indian Ocean from NASA’s World view center (NASA’s Worldview website); (https://worldview.earthdata.nasa.gov?v=57.9508133990794216.300628602547988,126.0113303398581,17.116840099466998;t=2014-04-23-T15%3A13%3A42Z;l=MODIS_Aqua_Chlorophyll_A,MODIS_Terra_Chlorophyll_A).

2.4. Nutrients Concentration

The nutrients, silicate, nitrate, phosphate and dissolved oxygen values were derived from the interpolation of the objectively-analyzed values during boreal Spring data (April to June) collected by World Ocean Atlas 2013 (https://www.nodc.noaa.gov/OC5/woa13/woa13data.html) at the 25 m, 50 m, 75 m, 100 m, 150 m and 200 m below sea level (Figure 3a–l). The concentration of nitrate ranged from 6.9 to 16.7 µM), silicate 0.1–11.7 µM, phosphate 0.1–1.69 µM, dissolved oxygen 0.1–4.50 mg/L (Figure 3). The maximum concentrations of nitrate and silicate was observed at the BOB stations (HFA01; I601) at 90° E (Figure 3a,c) which decreases to the equator at stations (I312, I409, I101) (Figure 3e,g) and the maximum phosphate concentration was also found from the equator—EQ station (I410) (Figure 3f), Sumatran station (I511) and BOB stations (I607, HFA-01) (Figure 3b). The dissolved oxygen (DO) was maximum in two transects at 80° E and 90° E (Figure 3d,l) but the oxygen saturation was high 34 mg/L recorded in the equator-EQ (Figure 3h).

2.5. Community Analysis and Microscopic Observation

To enumerate the community structure and for primary identification, fixed samples were examined at 20× and 40× magnification under an inverted light microscope (Motic, AE 2000, Xiamen, China) which was equipped with a digital Camera (Moticam 2506, 5.0 m, Pixel, Xiamen, China). About 2 mL of each sample were examined to count cells in a settling chamber using a modified Utermöhl method [37]. Species identification was confirmed by the use of scanning electron microscopy (SEM). Samples were pre-screened through a net again to remove large zooplanktons and subsamples were filtered on 0.6 µm, pore-size Millipore filters and air-dried for 24 h, then mounted on a stub, sputter-coated and examined under the SEM microscope (JEOL JSM-IT300LV, Hitachi, Japan) at Biological building (13), Tianjin University of science and Technology, TEDA, China. Species were identified using published taxonomic references [13,38,39,40].

2.6. Data Analysis and Statistical Methods

Shannon–Wiener diversity index ( H ), Pielou evenness index (J) and Dominance index (Y) has been used by the modified equation [37] to analyze the composition and richness.
H = i = 1 S P i log 2 P i
Y = n i N f i
J = H / log 2 S
where S is the phytoplankton species of each sample [41]. N is the total number of cells of all species counted; ni is the cell number of species i; Pi = ni/N represents the relative abundance of a given species; fi is the frequency of occurrence of species i in each sample. Species with Y > 0.02 was defined as dominant species [42].

2.7. Correspondence Statistical Analysis

The Hellinger-transformed Legendre and Gallagher [43] of species data were investigated by redundancy analysis (“RDA”) using the R software [44] RDA was chosen to allow the use of ordiR2step (Blanchet et al. [45] and an equivalent of Canoco (ter Braak and Šmilauer, [46] for the coefficient freedom value plus Pearson correlation values)).

3. Results

3.1. Environmental Dataset of Spring 2014 in Eastern Indian Ocean

An environmental dataset was constructed comprising the values for temperature, salinity and chlorophyll a measured during the cruise at the depths (0 m, 50 m, 75 m, 100 m and 200 m) were derived from CTD data (Figure 4a–i).

3.2. Vertical and Horizontal Profile of Temperature and Salinity

The vertical distribution of temperature and salinity in the three transects are summarized in Figure 4). The temperature and salinity in the depth 0–50 m ranged from 12.82 and 32.55 psu and in the depth 100–200 m ranged from 31.82 °C and 32.5 to 35.5 psu, respectively (Figure 4). Horizontally, maximum temperature value (>31.82 °C) was observed in the BOB samples (HFA01, HFA05, I601, I603, IQ2) and (<30 °C) was observed in the equator samples (I401-I413) (Figure 5a). The maximum salinity was observed also in the equator stations (I308, I401, I403, I406) at the transect 80° E and minimum value of salinity (>32 psu) was observed in BOB sampling areas (IQ2, HFA01-HFA05) (Figure 5b). The low salinity values in the BOB could be influenced by riverine runoff inputs and aggravate stratification. However, the salinity remains steady in the area nearby the Sumatran coast of Indonesia (Figure 4b and Figure 5b), which probably contributed to an increase in salinity gradients due to riverine influences from these coastal locales.

3.3. Vertical and Horizontal Profile of Chlorophyll a

The vertical distribution of Chlorophyll a in the Eastern Indian Ocean are shown in (Figure 4g–i). Chl-a ranged from 0.005 to 0.89 µg/L, which was higher at the 50 m and 75 m depth and minimum Chl- a was observed at 200 m (Figure 4c,f,i). Horizontally, the high chlorophyll a was observed in the equator region at the stations (I403, I308, I410-I412) and the Sumatran coast at the stations (I501, I503) (Figure 5c) respectively.

3.4. Community Structure and Diversity Pattern

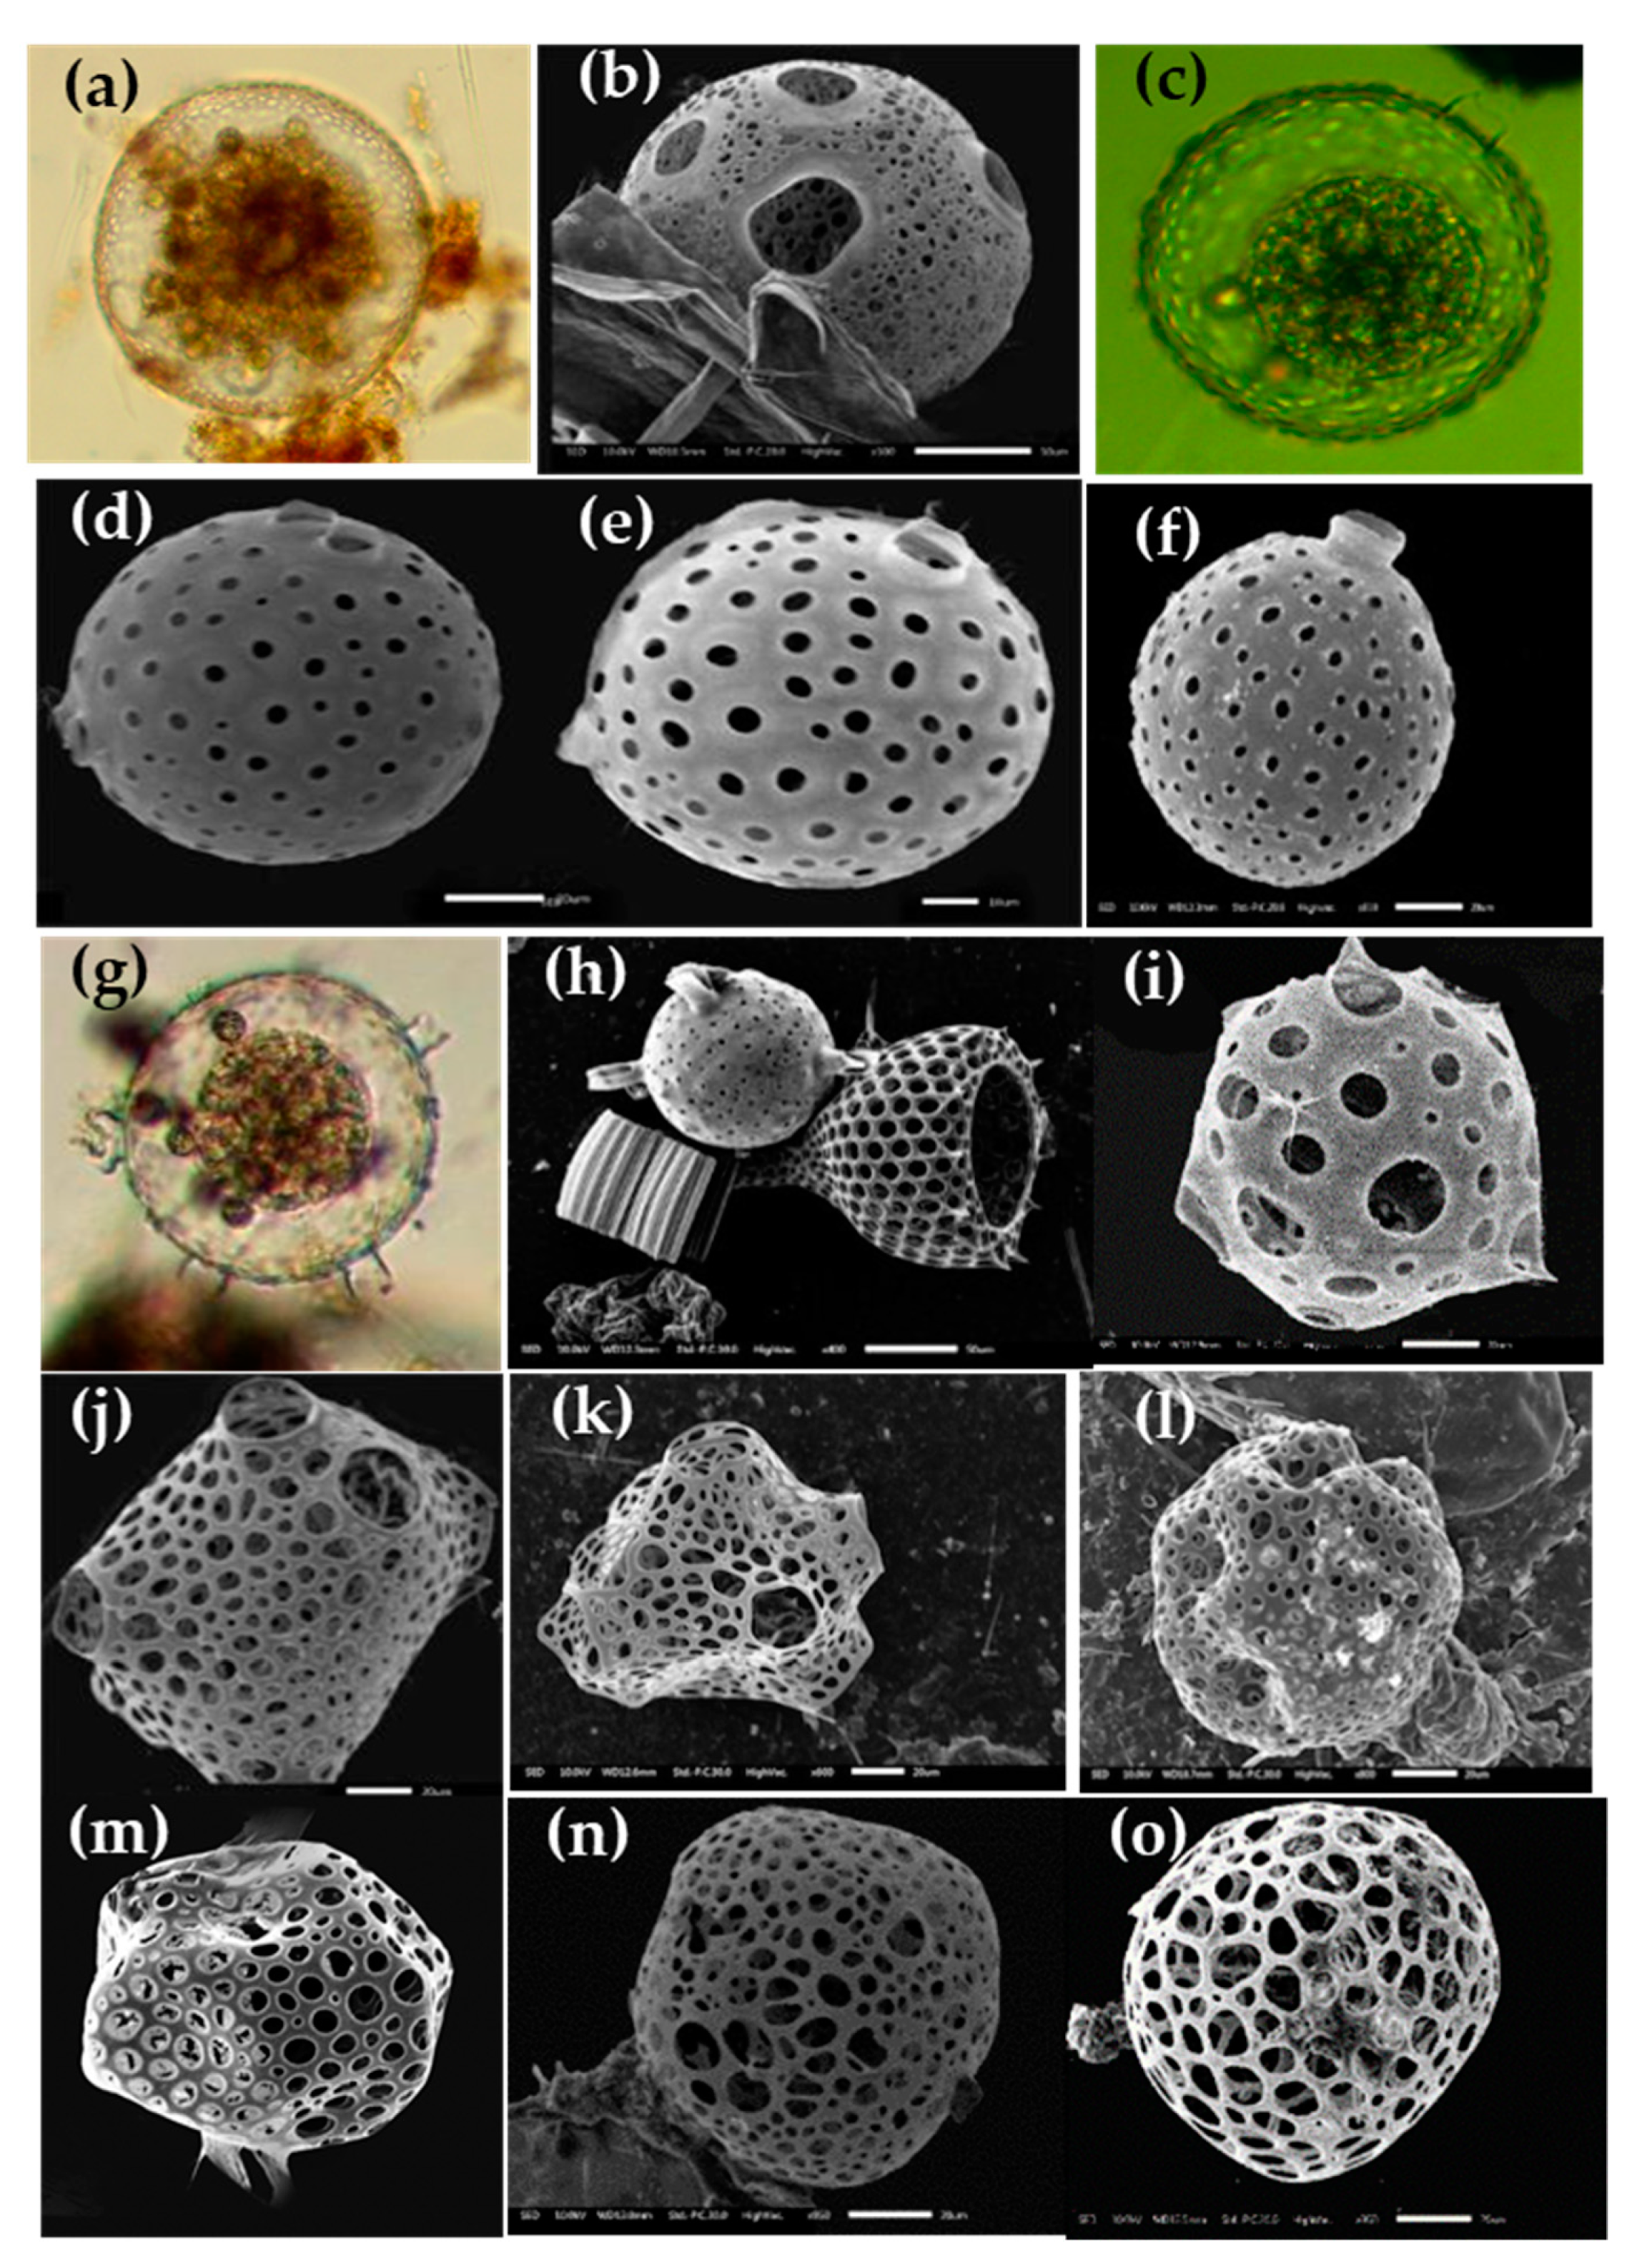
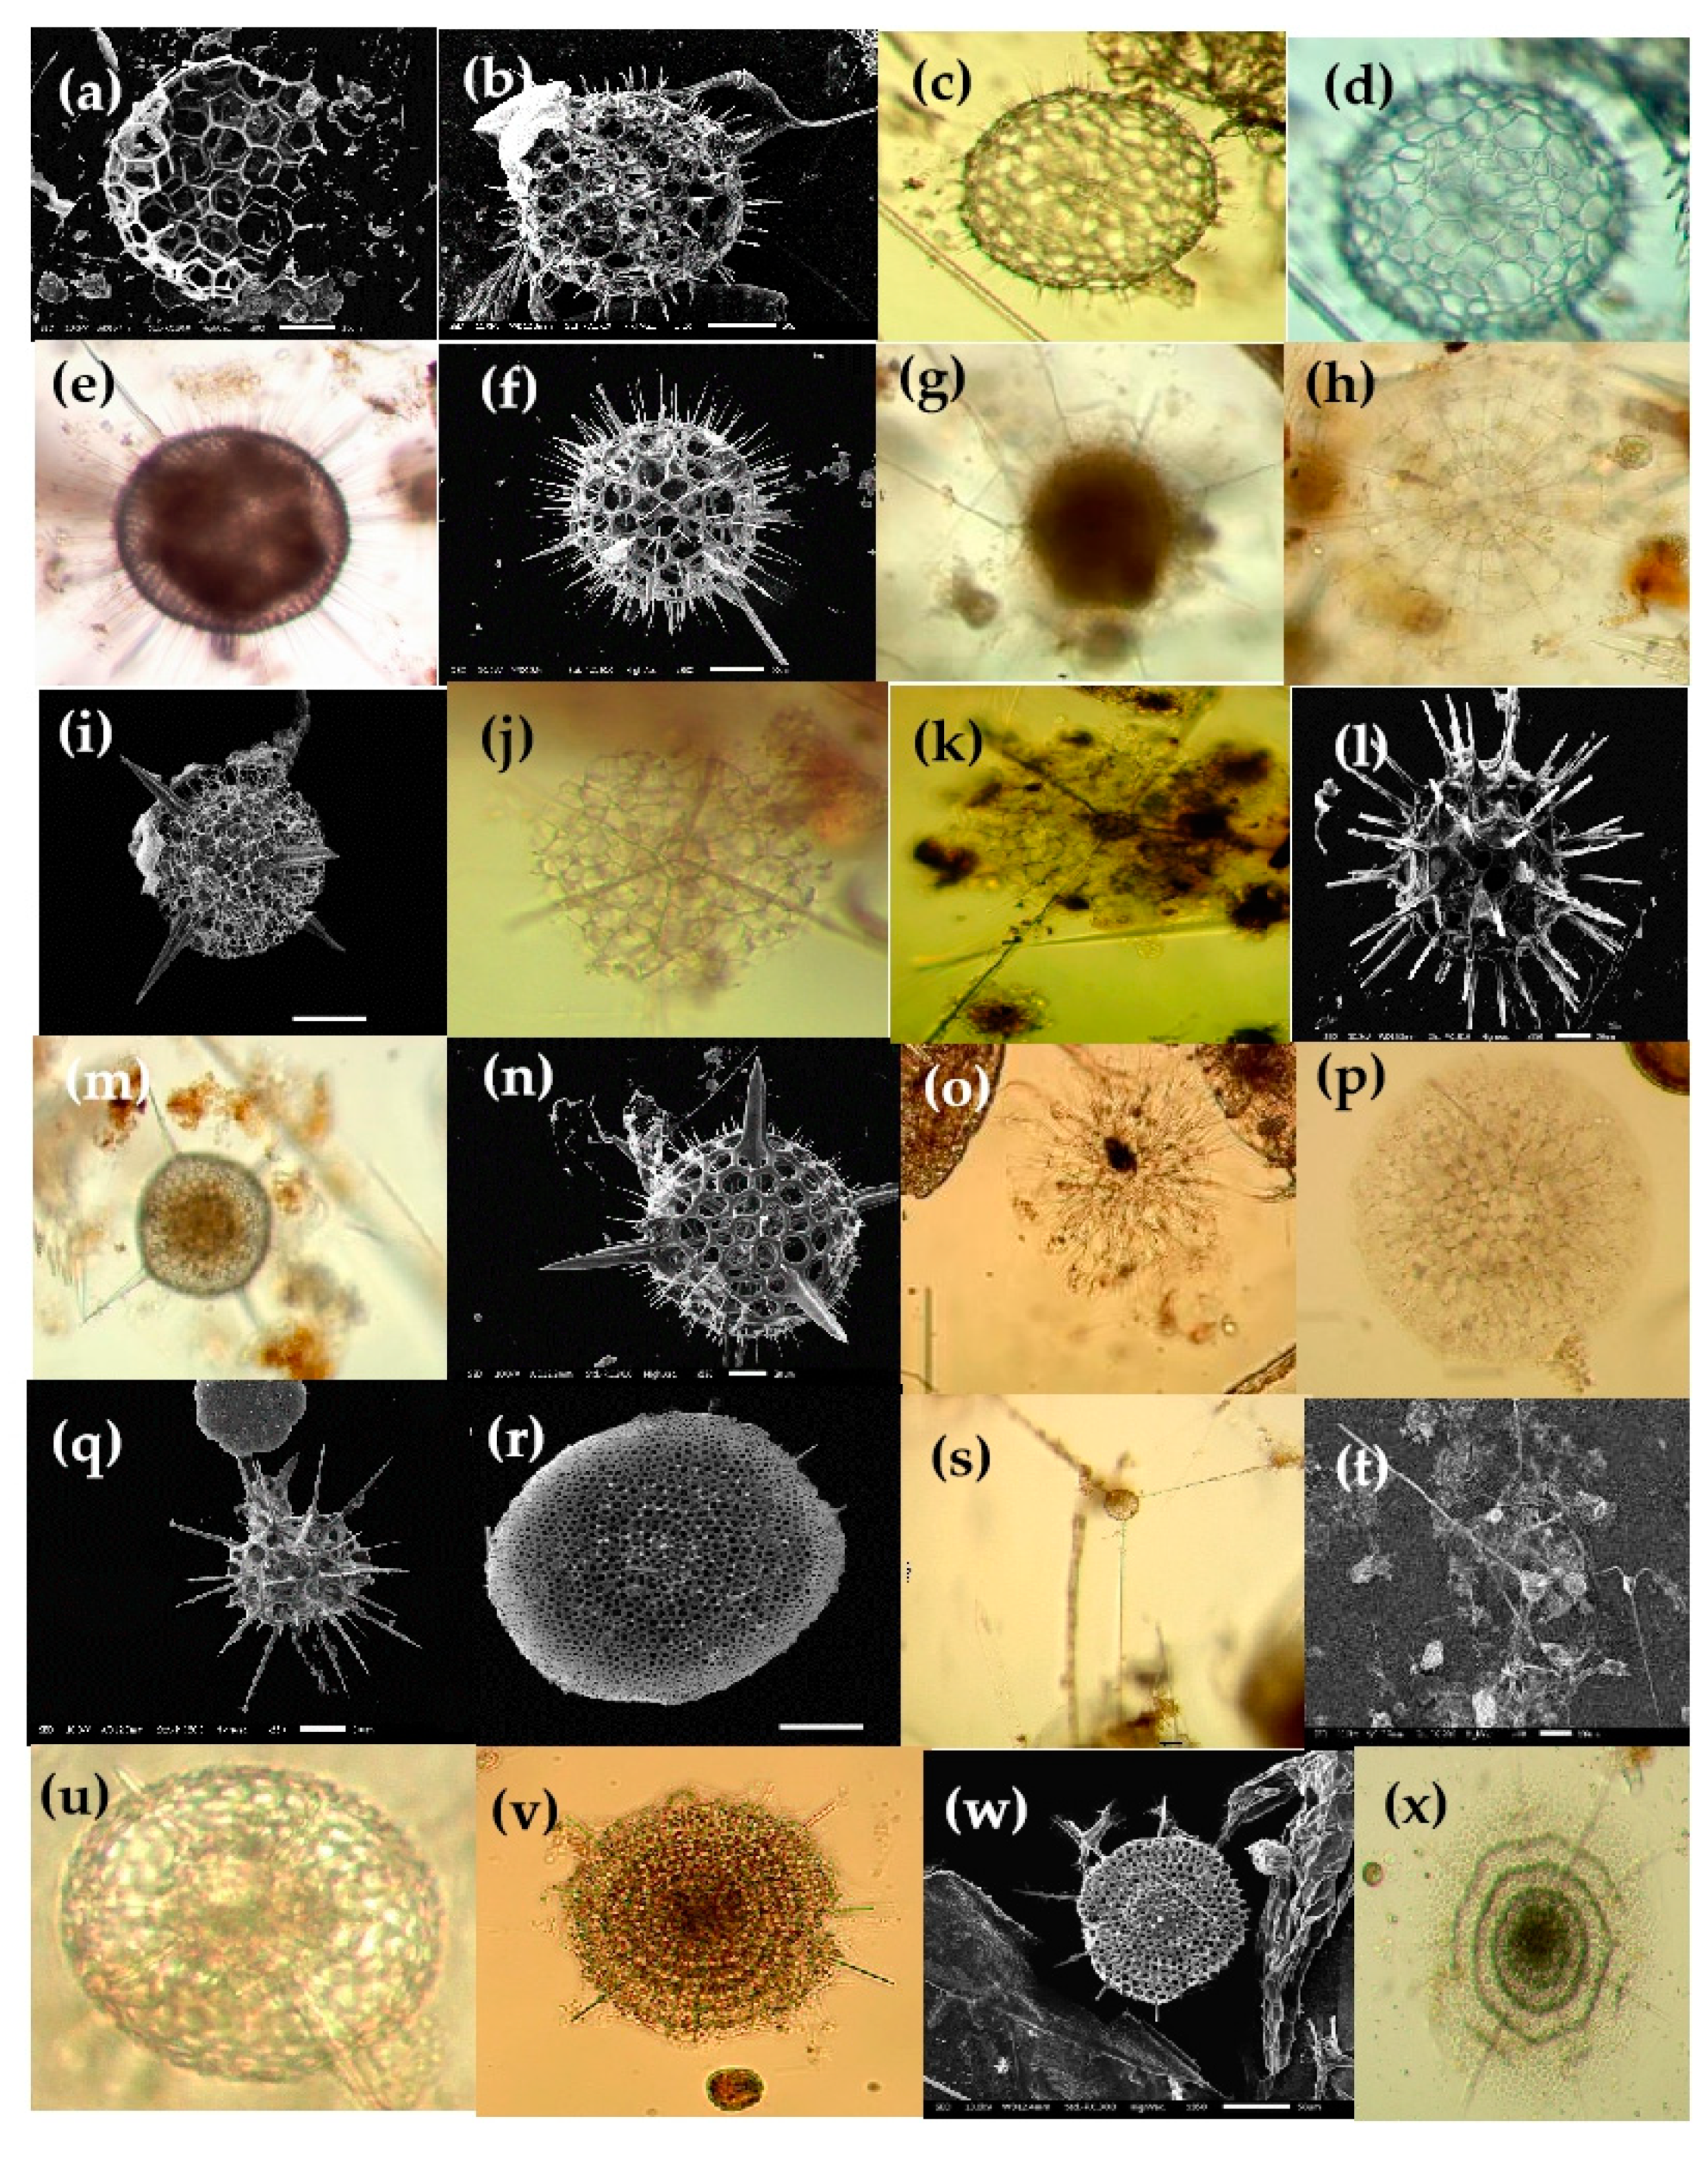
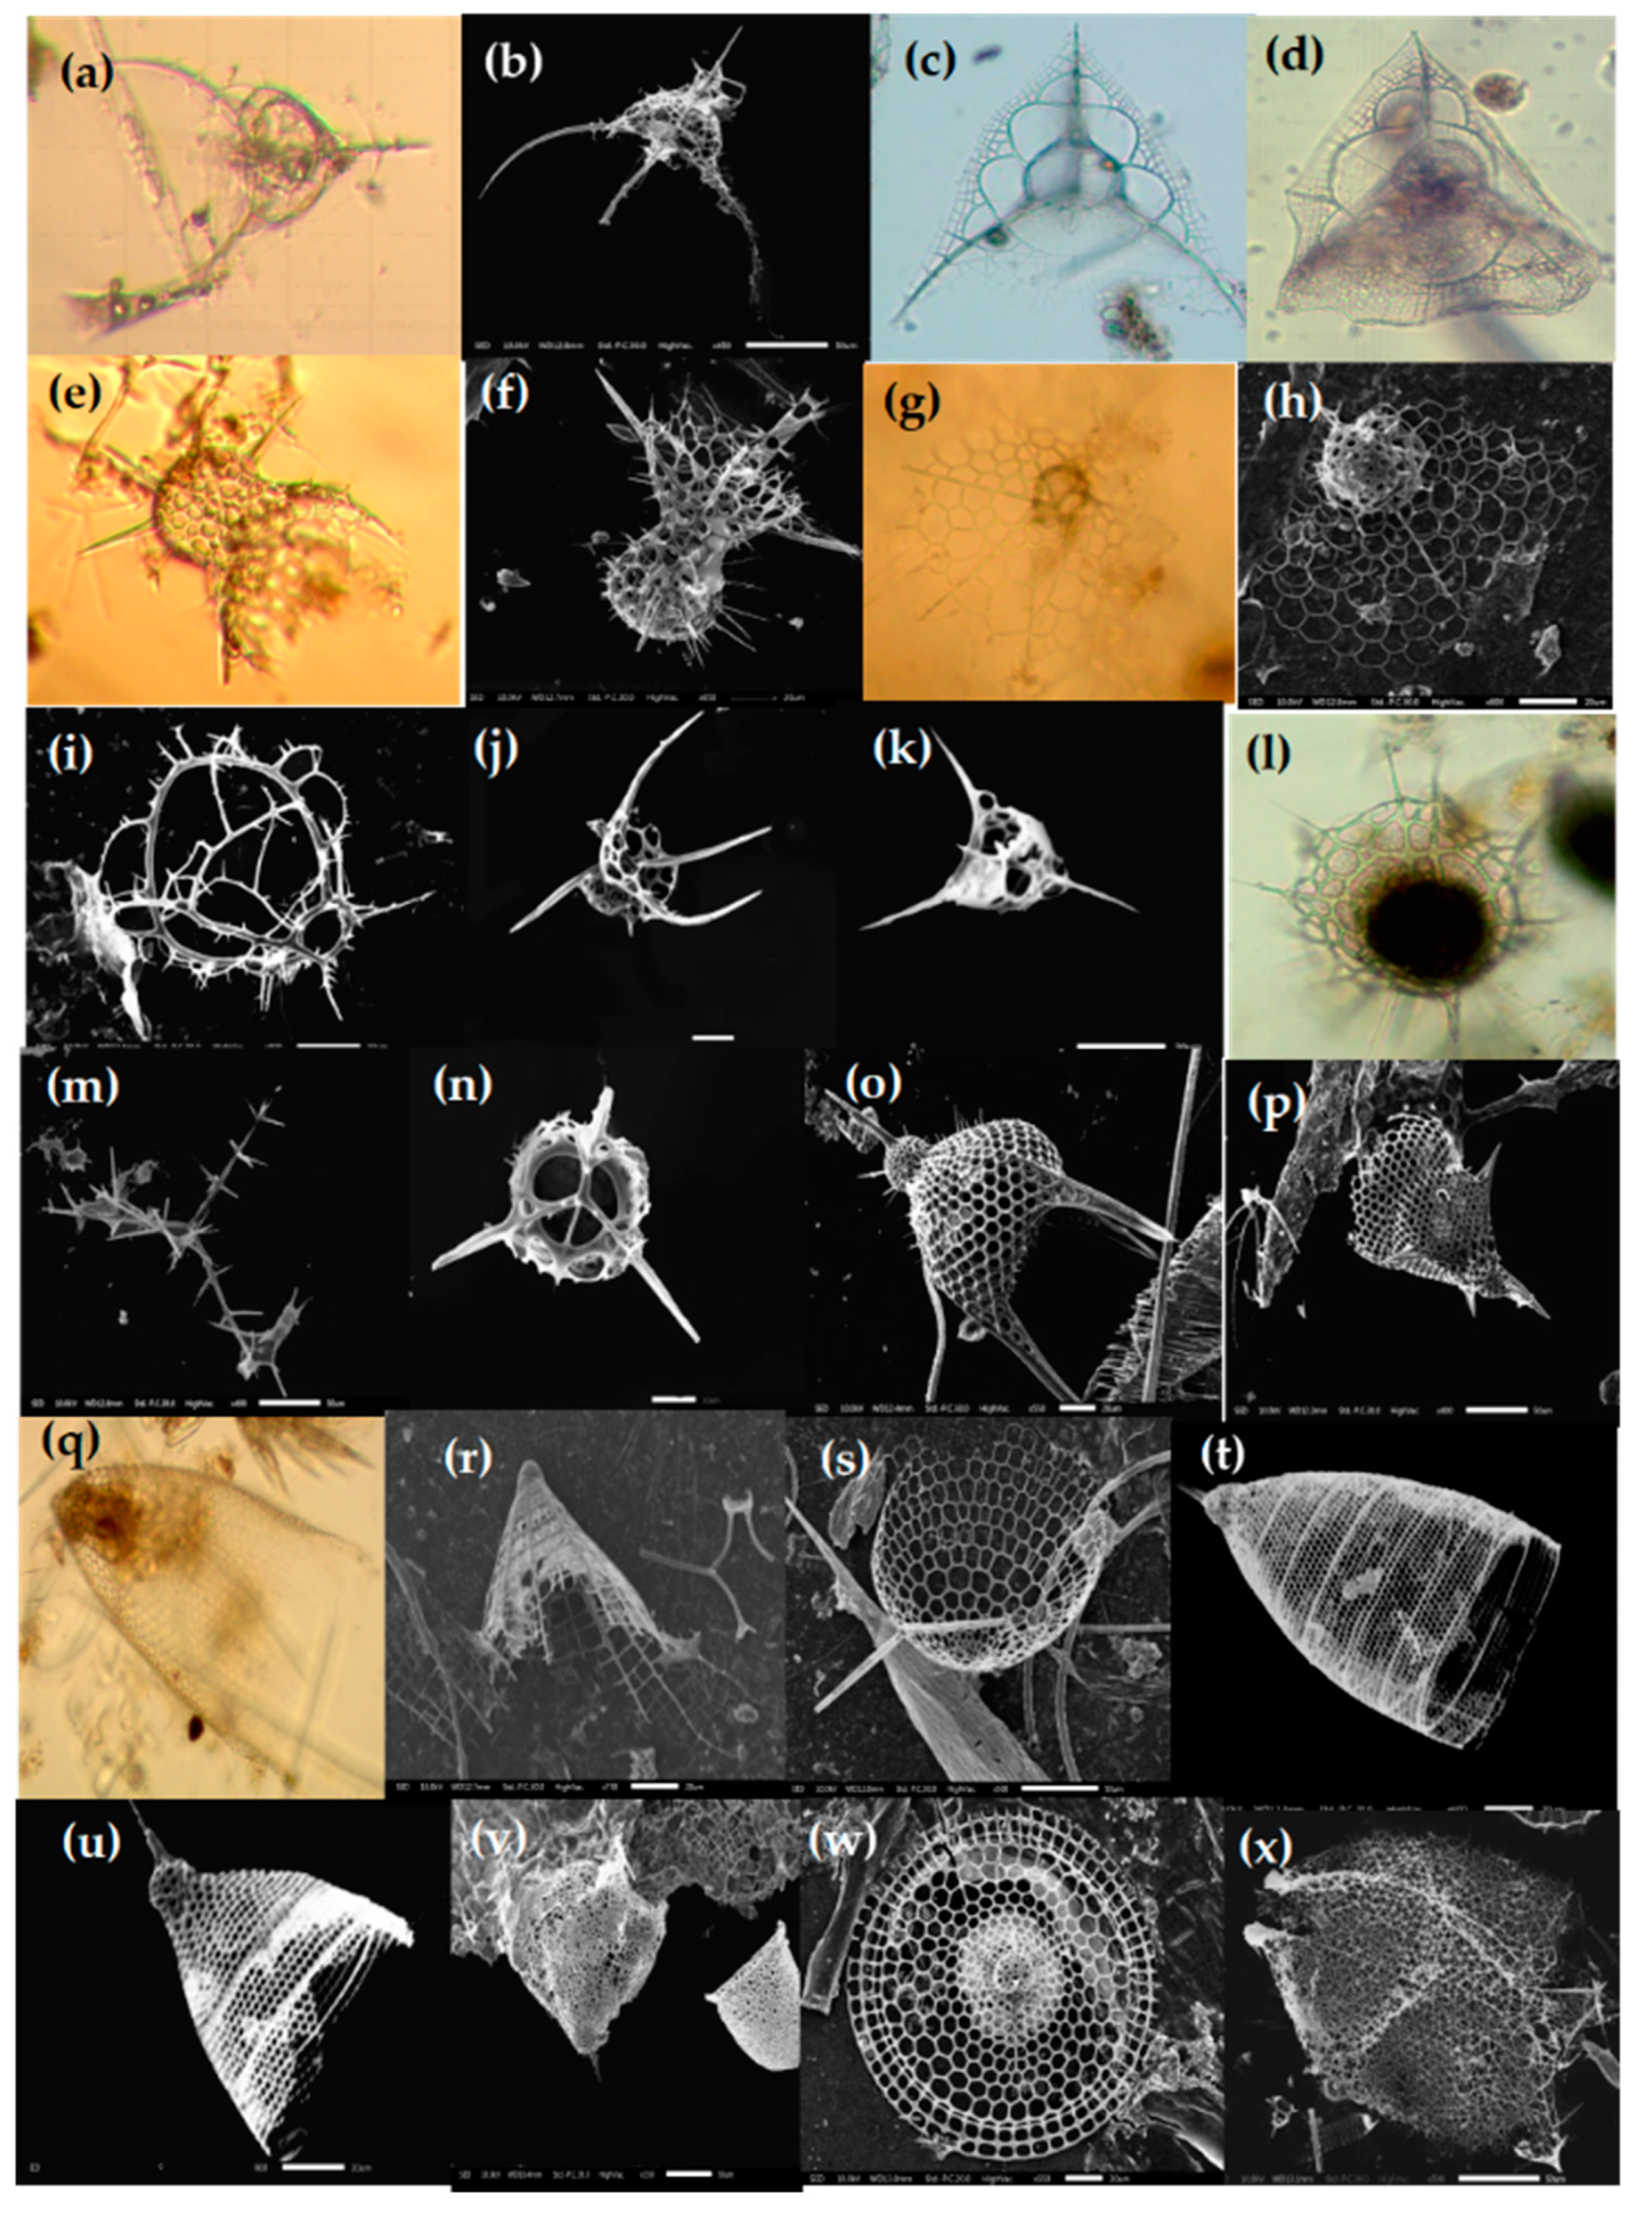
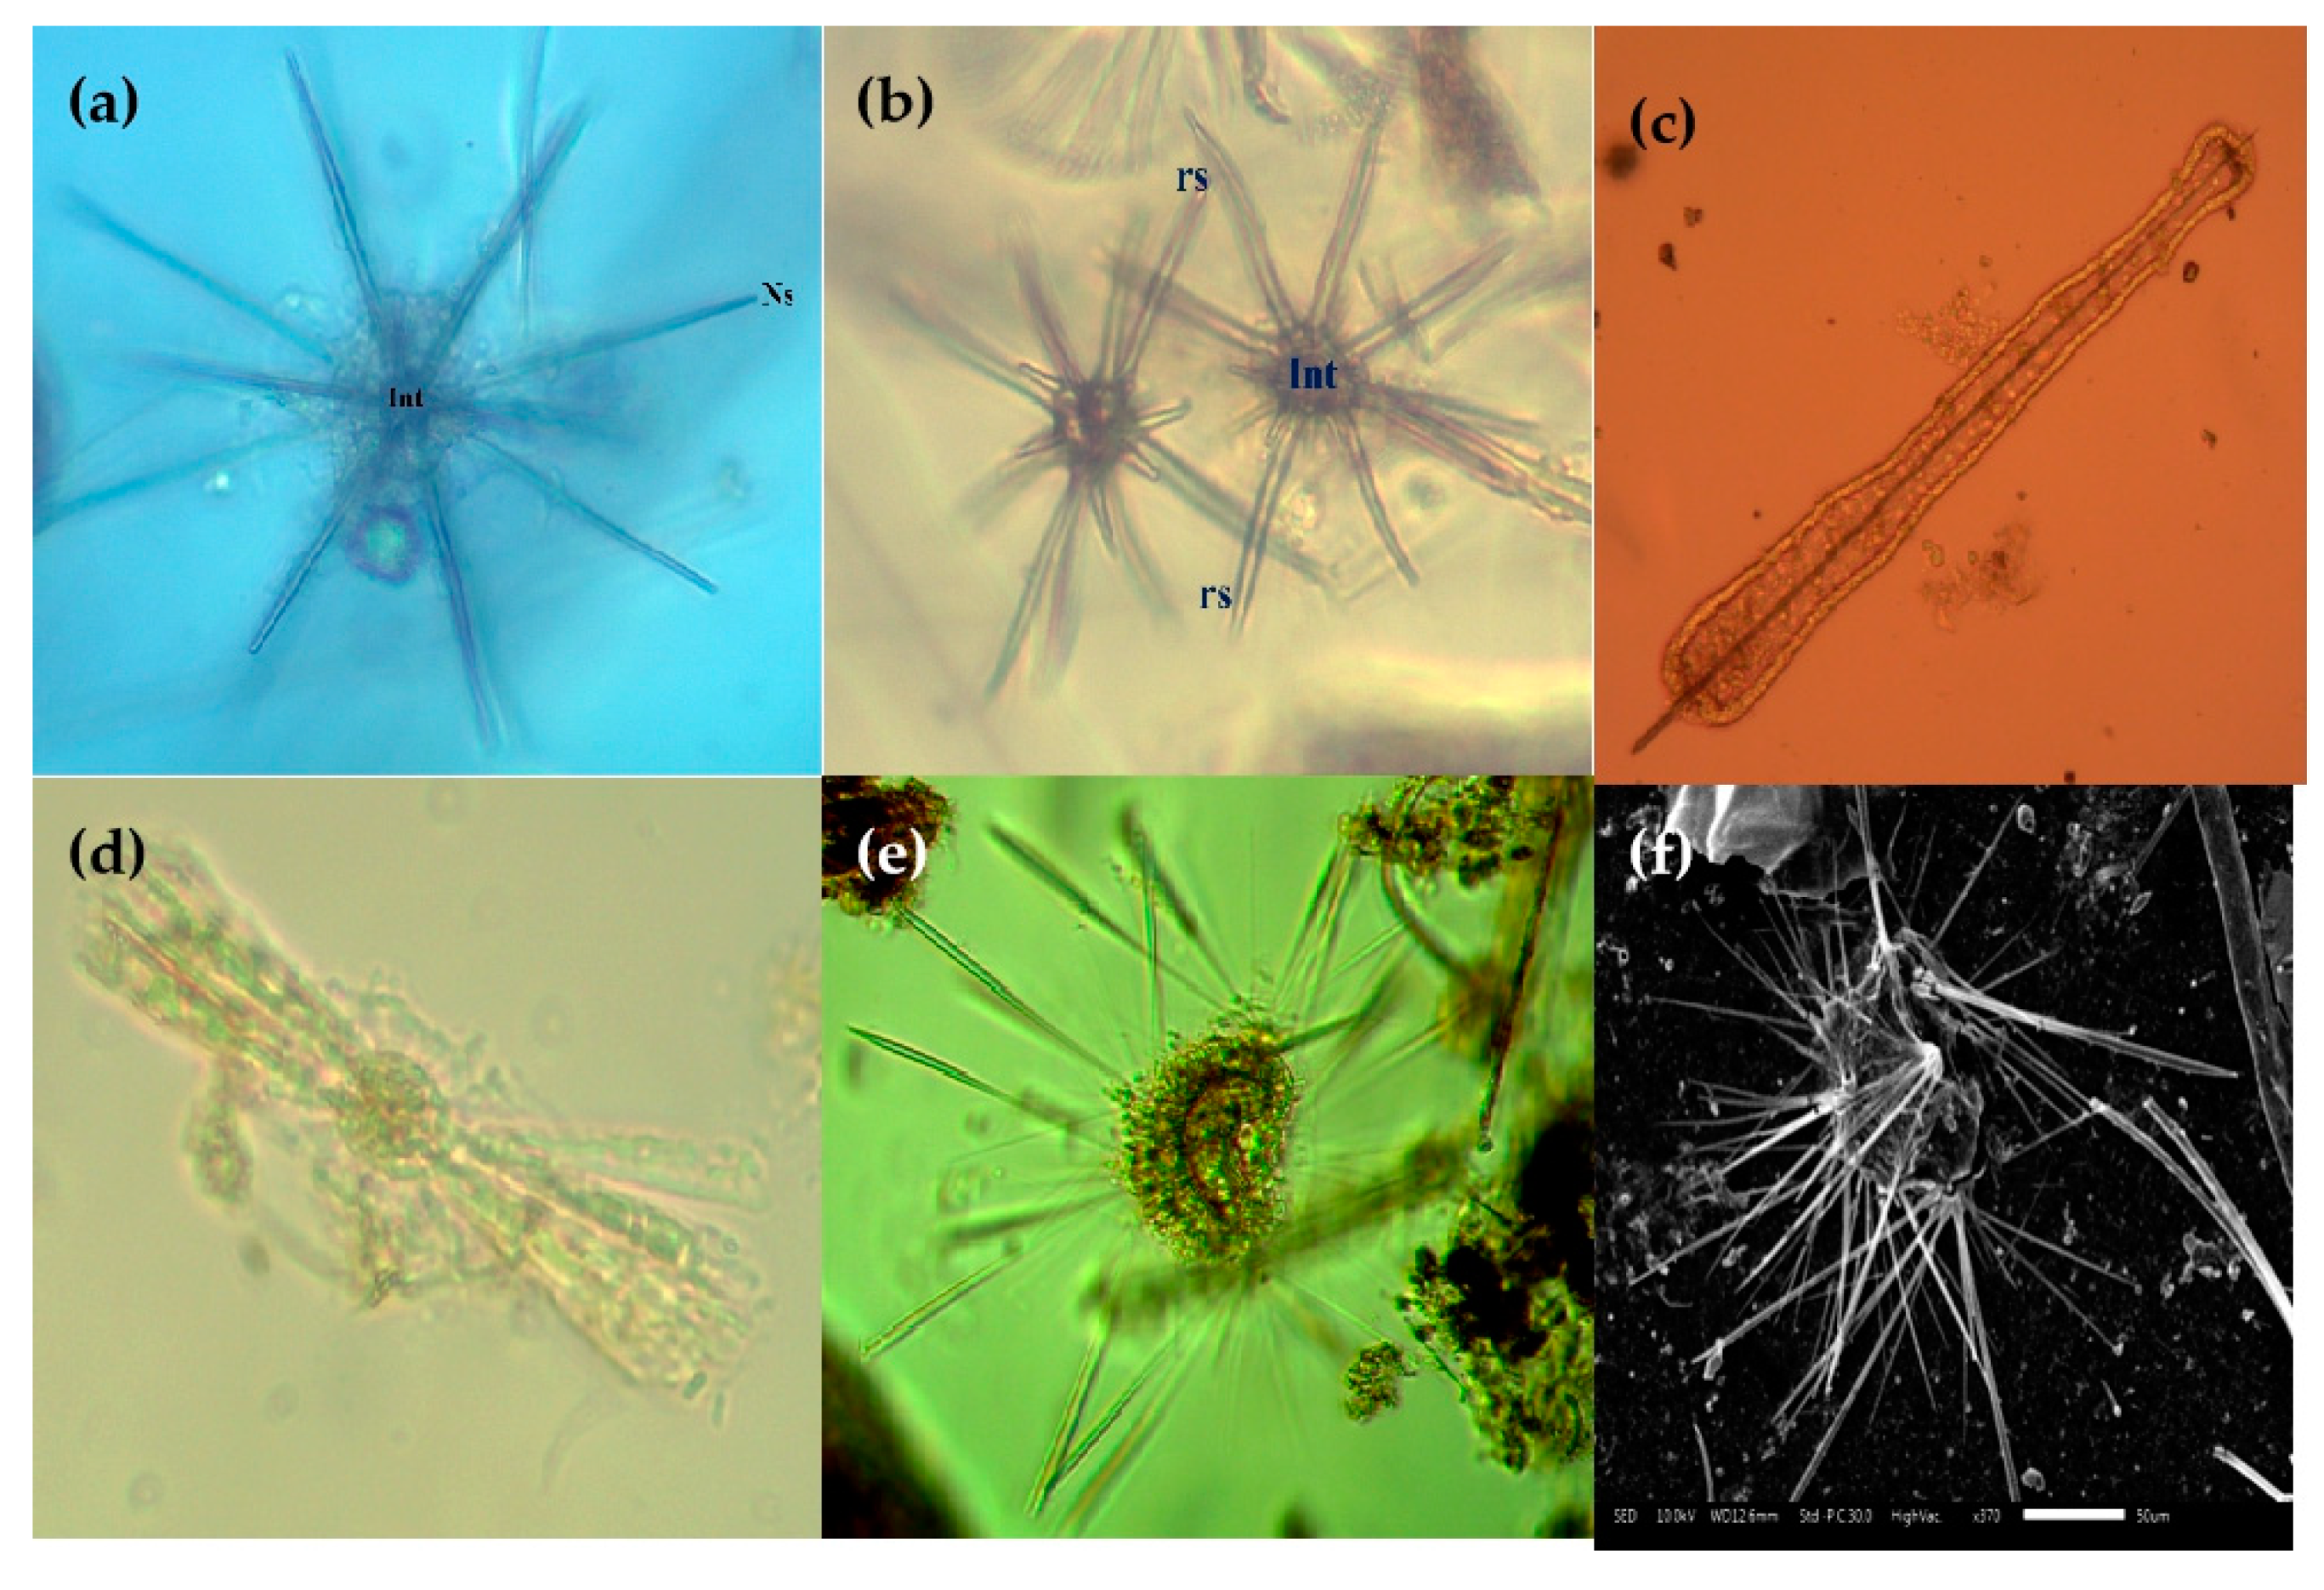
In total, 168 taxa were identified and classified into 28 families and four orders (Table S1). Table S1 includes the number of individual (ind/m−3) of each species/sample. The identified taxa were composed of Polycystinea groups, e.g., Collodaria (15 spp.; Figure 6 and Figure 7), Spumellaria (44 spp.; Figure 8), Nassellaria (75 spp.; Figure 9), followed by Acantharia (8 spp.) and Taxopodida (1 spp.; Figure 10) and Phaeodaria; (7 spp.; Figure 11).
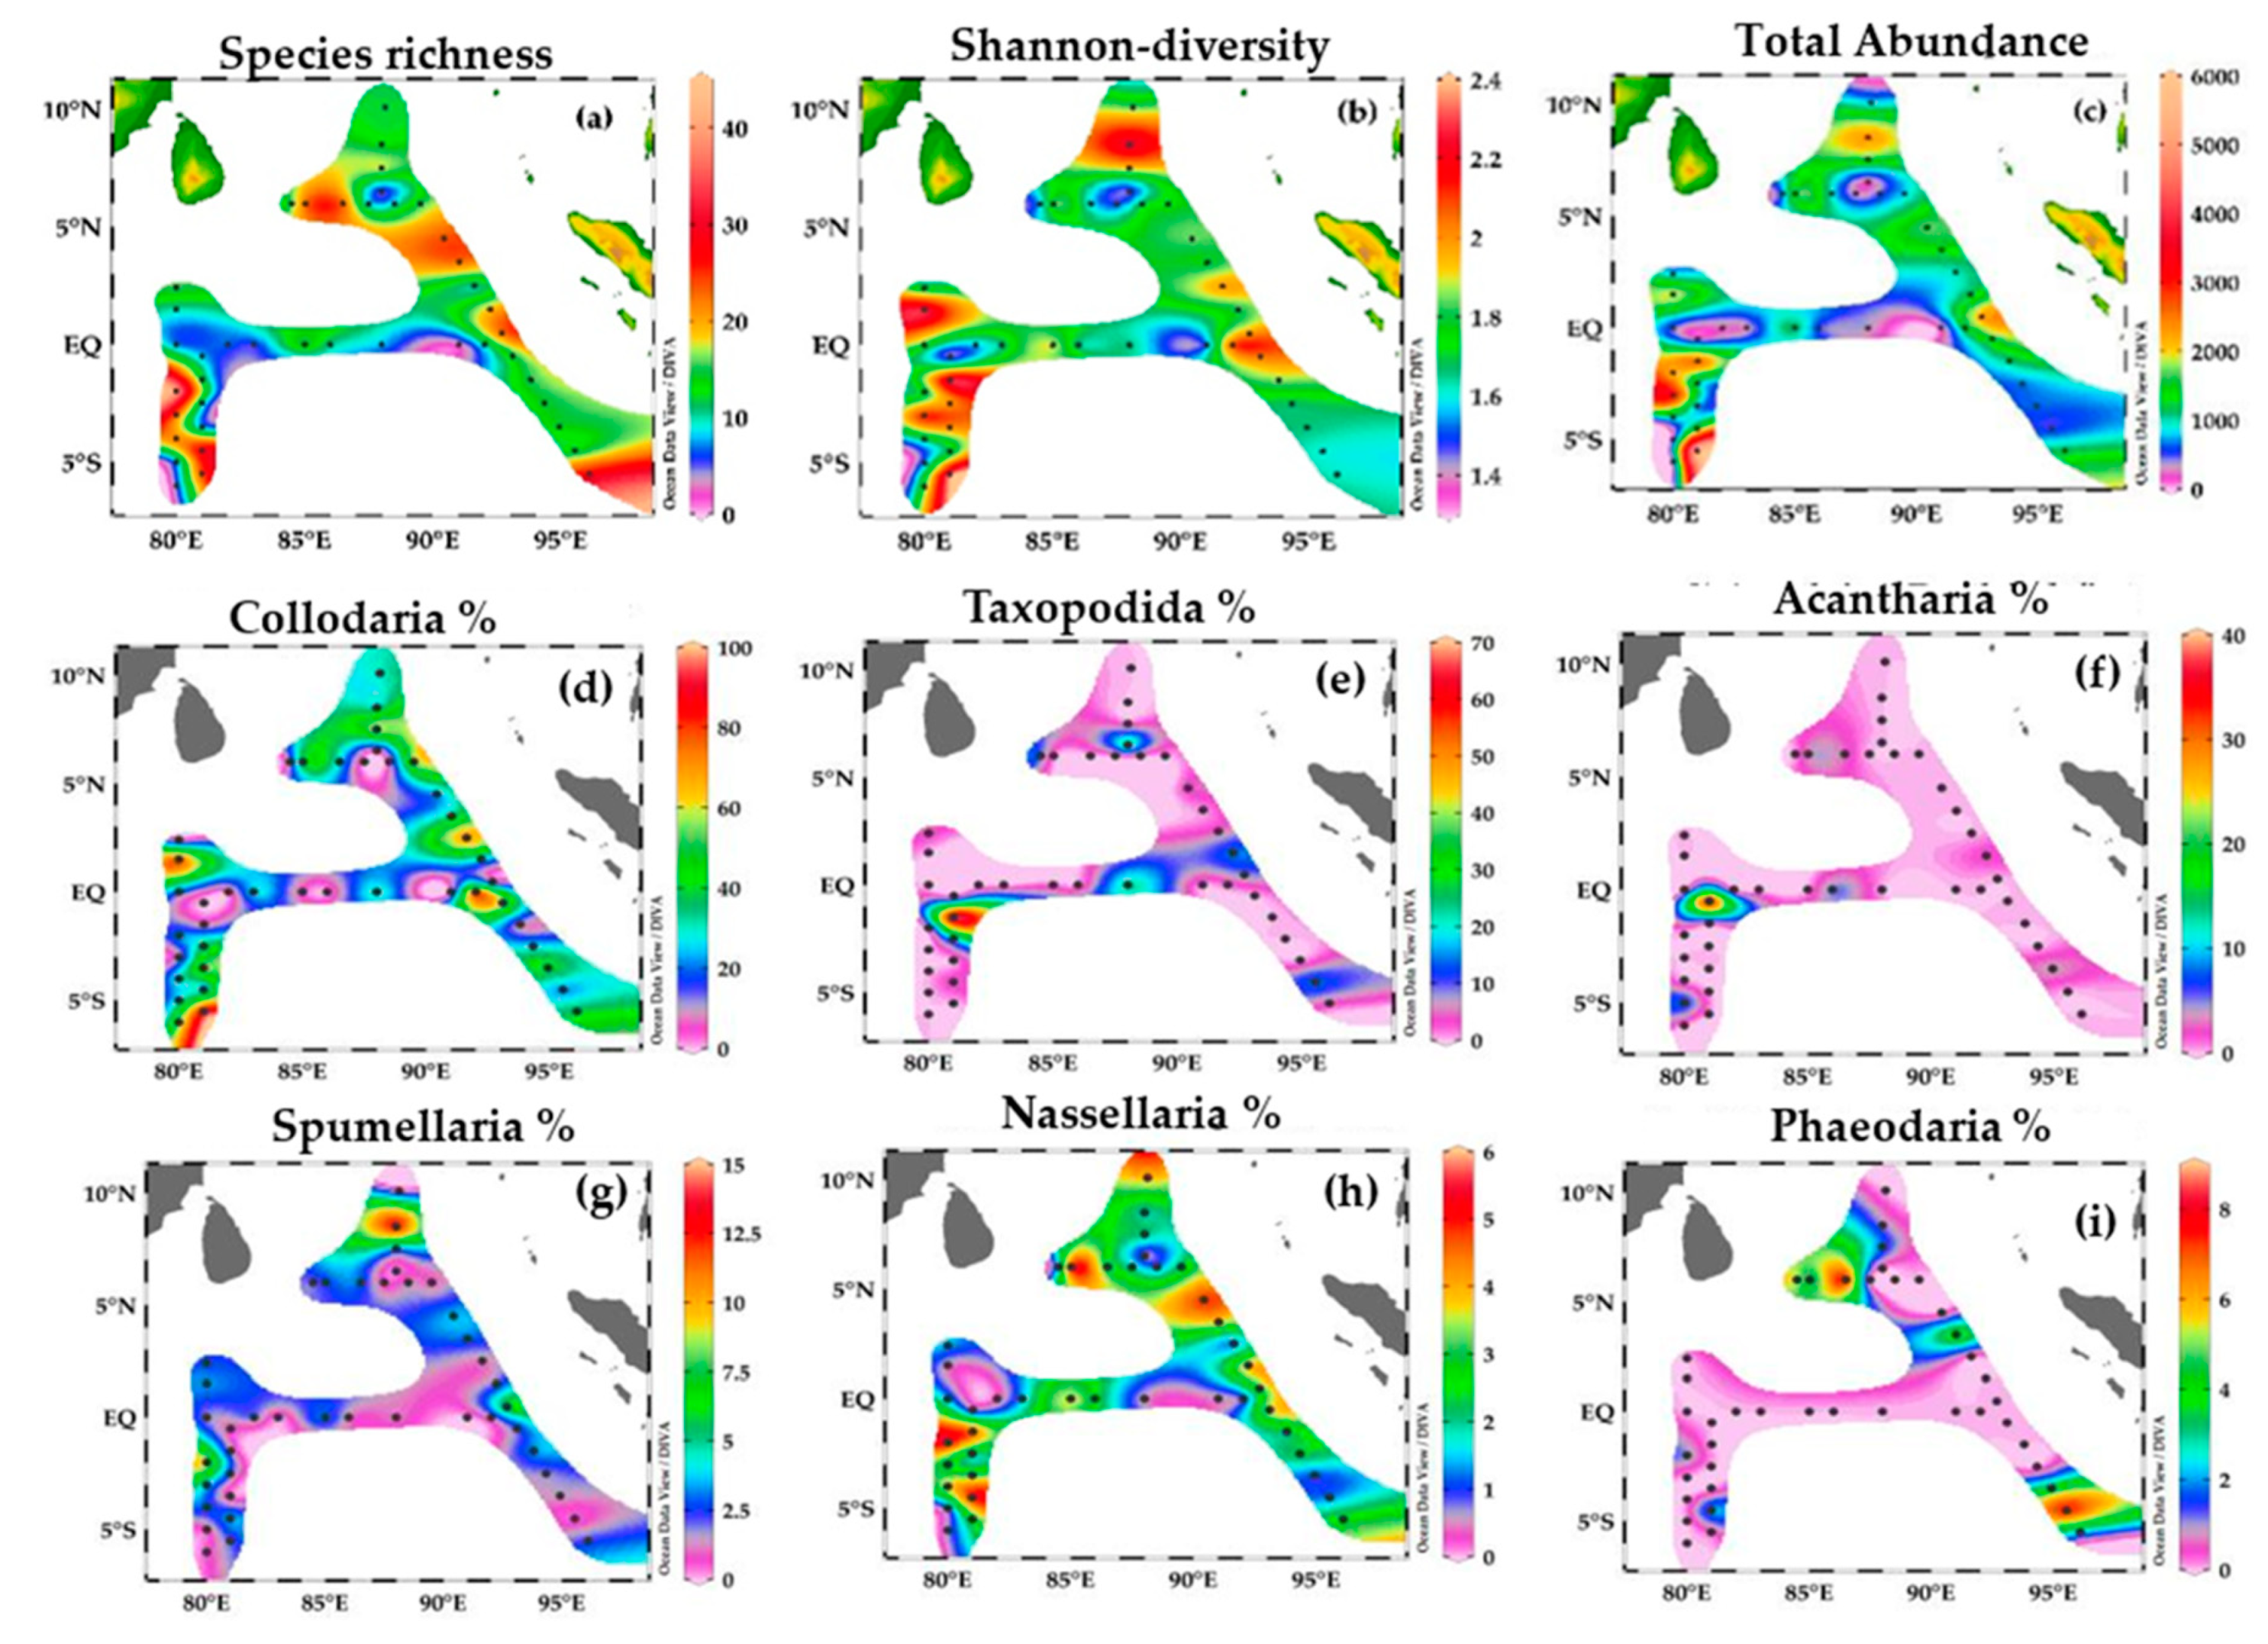
Out of 168 taxa, the 5 to 40 species were horizontally distributed in the study area (Figure 12a). The species richness was highest at stations (I308, I815, I817) and (I509, I607, I609) between the two transects area at the 80° E and 90° E (Figure 12a). A high diversity index (2.5 H’) was observed in stations (I304, I310, I412, I413, I809, I813, I817) at the transect 80° E and (HF-05) at the BOB zone. The low diversity (1–1.5 H’) was observed in the stations (I410, I807, I611, HF-01) (Figure 12b).

3.5. Plankton-Net Tows Abundance of Radiolarian

Radiolarian abundance varied from 5 to 5838 ind/m−3 across the sampling area. The highest abundance was observed at the station (I815), followed by (2200 ind/m−3) at stations (I310, I308) and low abundance (247 ind/m−3) at station (I410), (174 ind/m−3) at station (I312), (168 ind/ m−3) at station (HFA03), (157 ind/m−3) at station (I506) and (109–102 ind/m−3) at stations (I609, I306, I815), respectively (Figure 12c). Collodaria and Taxopodida were the most abundant group (90% and 70% of the total radiolarian abundance), respectively (Figure 12d,e), followed by Acantharia (35%) (Figure 12f), Spumellaria and Nassellaria (15% and 6%) (Figure 12g,h) and Phaeodaria (8%) (Figure 12i), respectively. The top three species, S. punctatum, S. fuscum, S. zanclea contributed 56.6% and other fifteen species contributed 10–25% to total radiolarian (Table 2).

3.6. Horizontal Distribution of Radiolarian in EIO

The abundance, diversity and taxonomic patterns within the three transect zone show the following characteristics.
  • NEQ transect—90° E: Radiolarian abundance ranged from 6 to 1080 ind/m−3 which recorded from 17 stations at transect 90° E (Figure 12c). These samples contained a total of 89 species. Each species has heterogeneous distribution, 2–23 species were found from each station and maximum assemblage occurred at the stations (I609) (Figure 12b). The maximum abundance was recorded at the BOB stations (AH-05), followed by 661 ind/m−3 at stations (I109, I609) which were dominated by the occurrences of Stylodictya multispina, C. inerme and Siphonosphaera polysiphonia (Figure 13; Table 2) and low abundance <250 ind/m−3 was recorded by the occurrences of S. punctatum and Callimitra sociliatorchia, <190 ind/m−3 by the occurrences of S. zanclea and Didymocyrtis tetrathalamus (Figure 13), respectively.
  • Equatorial transect—0°: The abundance of radiolarian in the equatorial samples area ranged from 14 to 996 ind/m−3 and collected from 11 stations (Figure 12c). These samples contain total of (39 species) and approximately, 2–15 species were found from each station (Figure 12b). The diversity increases maximum of 15 species at stations (I403, I412, I413) but subsequently drops to two species at other stations. The assemblage in the equatorial region is dominated by S. punctatum, S. cf ovodimare, L. pentagona pentagone and S. zanclea species (Figure 13).
  • SEQ transect—80° E. The abundance of radiolarian in the transect 80° E (SEQ) ranged from 1000 to 5257 ind/m−3 and recorded from 15 stations (Figure 12c). The high species richness numbers (41 species) occurred at station (I308) and is immediately followed by low species numbers (27 species) at station (I509) and (23–21 species) occurred at stations (I310, I312) (Figure 12b), respectively. The maximum abundance >5257 ind/m−3 was observed at the station (I817) and assemblages are dominated by S. punctatum, followed by >1900–1780 ind/m−3 observed at stations (I310, I807) dominated by S. fuscum and S. zanclea (Figure 13), respectively.

3.7. Selected Dominant Taxa in the Eastern Indian Ocean

We selected 20 dominant species which identified by dominant index (Y) and frequency distribution (fi) (Table 2). Overall, relative contribution of S. punctatum (22%), S. fuscum (15%), D. tetrathalamus (3.5%), S. zanclea (7%), S. polysiphonia (2.3%), L. pentagona pentagone (2.3%), Eucytidium hexastichum (32%), C. sociliatorchia (2%), Pterocanium pretextum (1.2%), Hexacontium armatum-hostile, E. gegenbauri, Anthocyrtidium cineraria and Arachnocorys circumtexta (0.8%), Lophophaena dodecantha (0.7%), Amphirrhopalum ypsilon, Acanthsphaera actinote, Euchitonia elegans and Spongodiscus resurgens (0.6%) (Table 2), respectively.

4. Canonical Ordination Analysis

4.1. Identification of Potentially Explanatory Environmental Variables

The RDA-generated inertia and the first ten eigenvalues appear as Table 3.
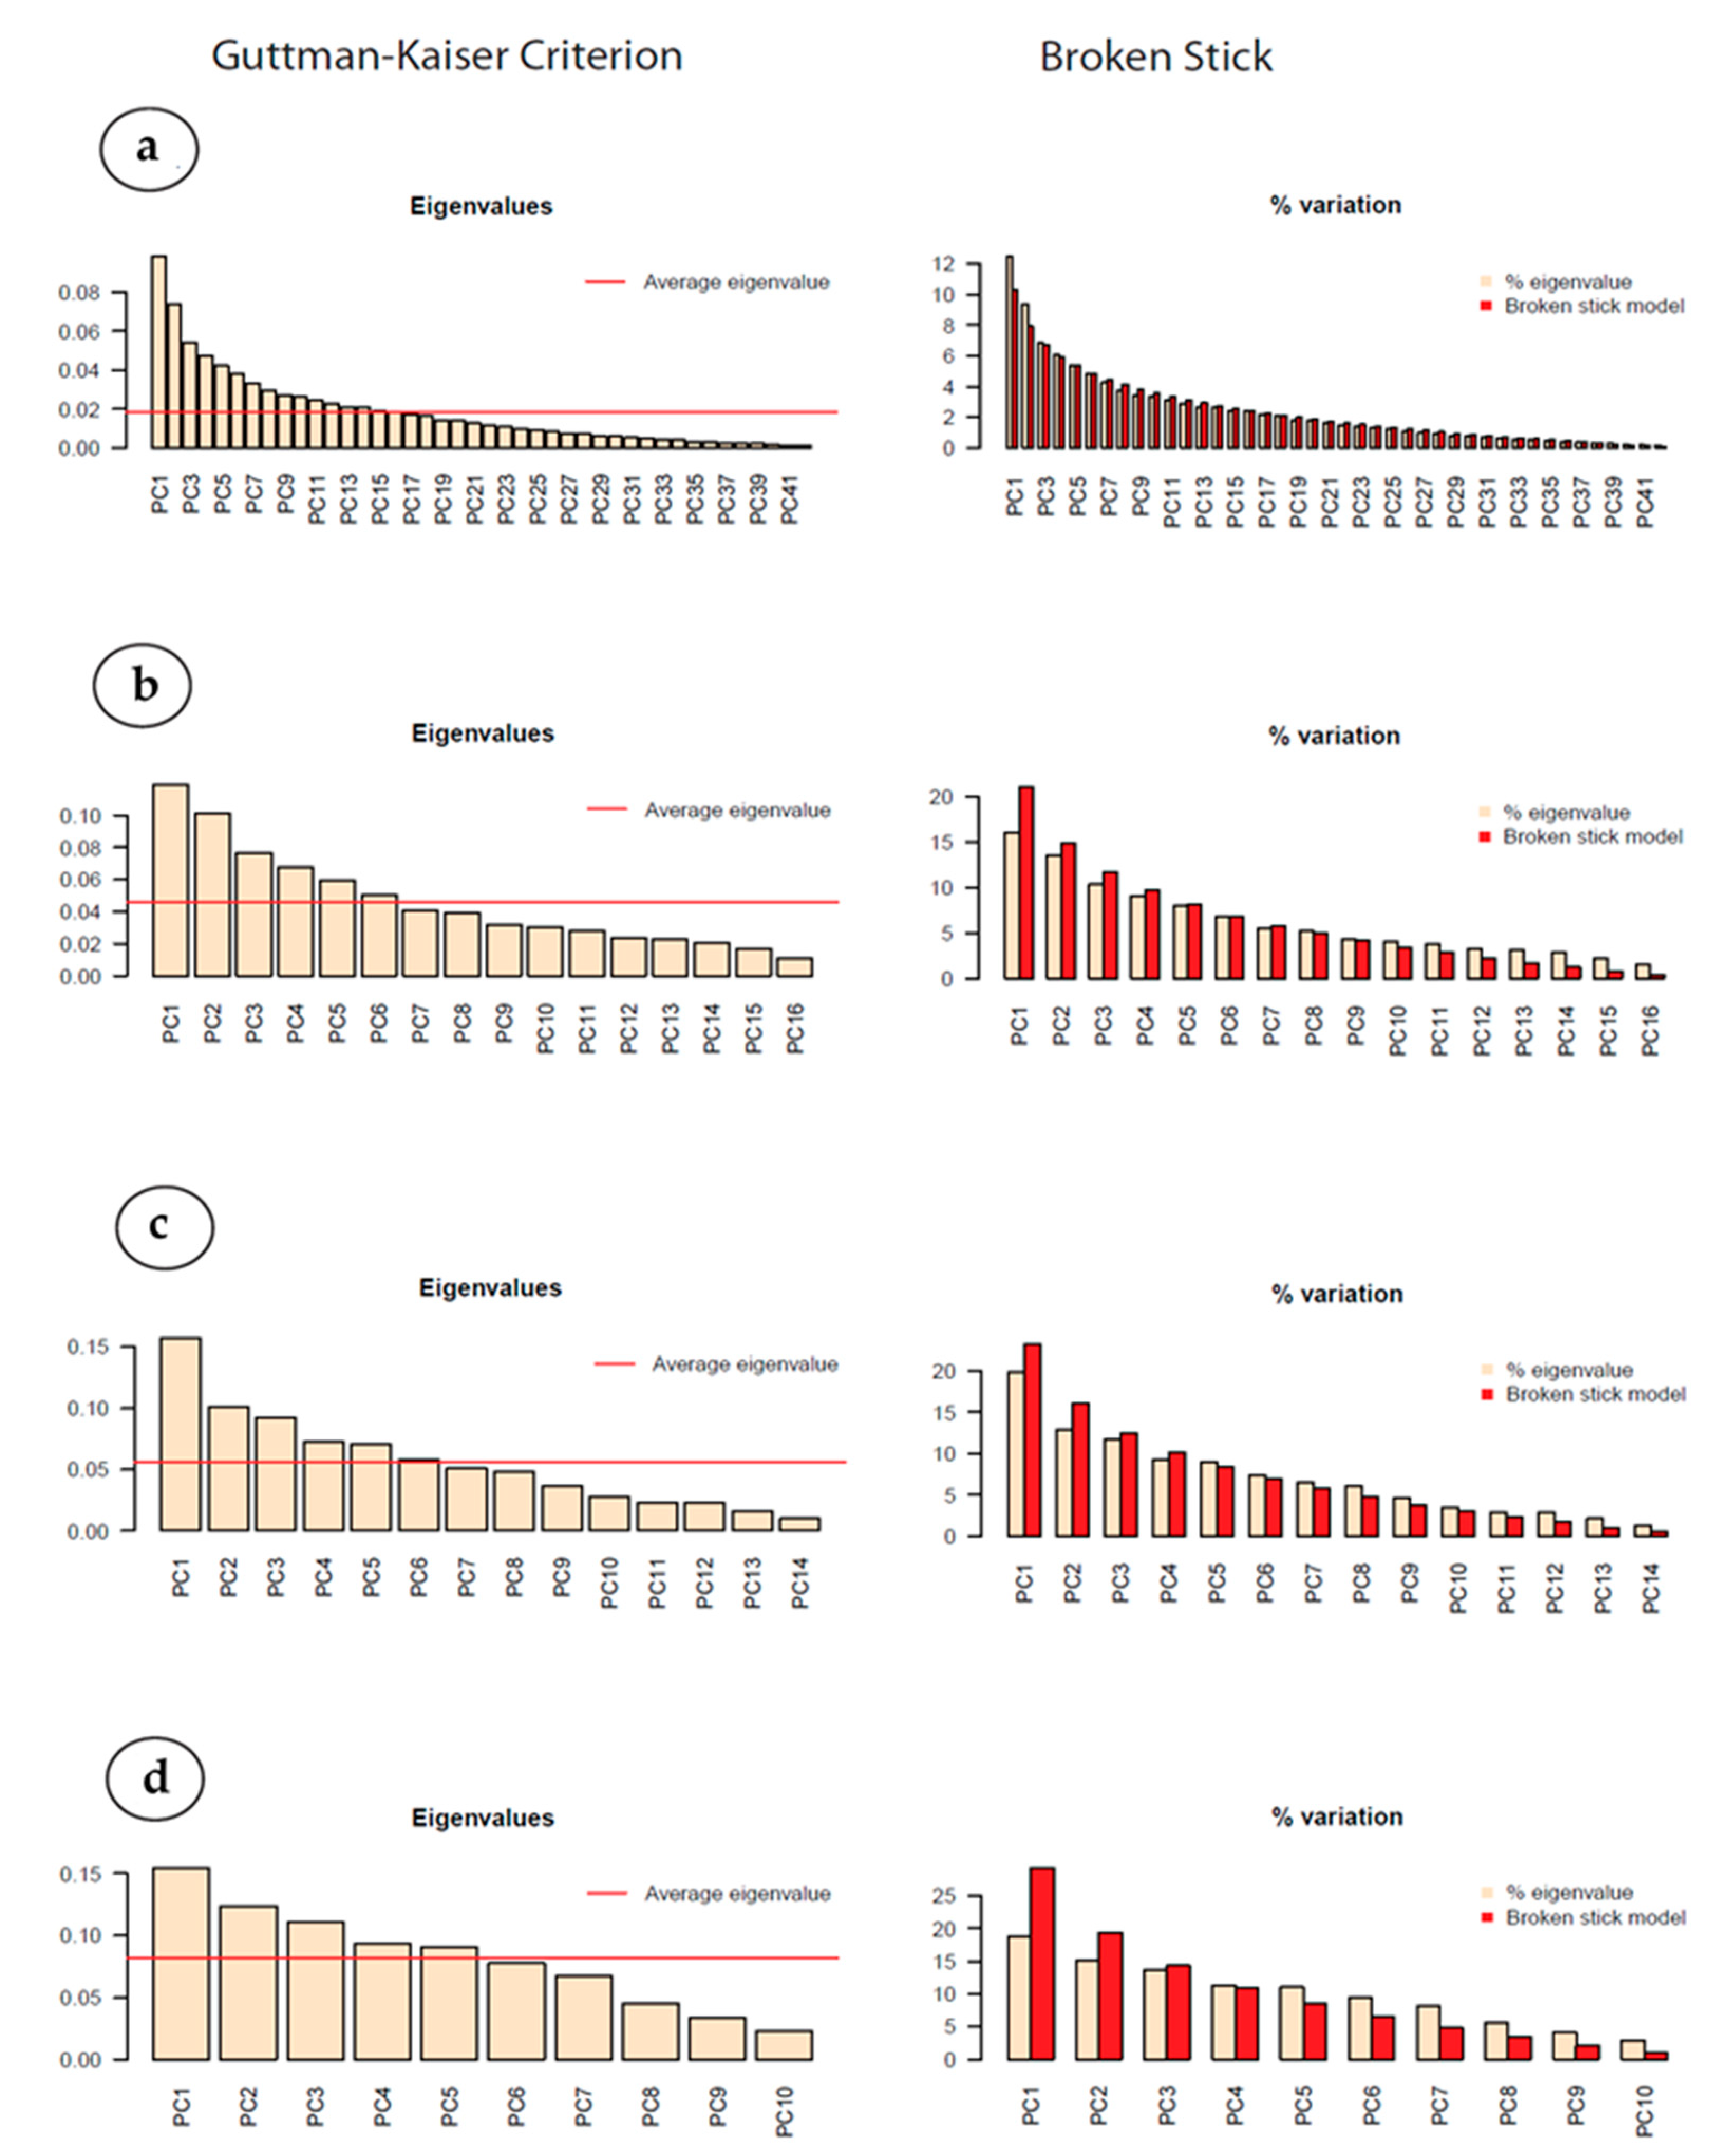
Two tests were employed to determine how many, if any, variables the eigenvalues from the species dataset might explain. The first test used the Guttman–Kaiser Criterion (“GKC”) (Yeomans and Golder [47]): Fourteen eigenvalues exceeded the mean eigenvalue, although two only marginally, suggesting many explanatory variables. The second, more stringent, test employed the “Broken Stick” Model (“BSM”) Jackson [48] and this indicated that there might be about two explanatory variable. The test results are plotted as Figure 14a.
An environmental dataset was constructed comprising the values for temperature, salinity and chlorophyll measured during the cruise at the ocean’s surface and depths of 25, 50, 75, 100, 150 and 200 m below sea level (bsl) plus the World Ocean Atlas 2013 objectively-analysed values for nitrate, phosphate, silicate and dissolved oxygen for the season April–June at the same depths [49,50]. RDA was applied to the species data and each variable in the environment dataset in turn and Analysis of Variance (ANOVA) run on the output: Those environmental variables where the probability of the F statistic was greater than 0.005 and the ratio of the first RDA axis to the first unconstrained axis was greater than one was to be published. No significant results were found. Because the species data were drawn from a relatively large ocean region with a range of environmental conditions, three transects were selected to examine whether plankton abundances were affected by different environmental variables in different parts of the study area (Figure 2 and Table 1).
Application of the GKC to the transect species data suggested that Long-90 and Long-80 might each have about four explanatory variables and Lat-0 three. The BSM indicated that no explanatory variable would be revealed. RDA and ANOVA were applied to each of the transects with the same publication criteria as for the full species dataset. Transect Long-80 gave five and Lat-0 gave two results significant at the 0.1% level; Long-90 yields no significant results—See Table 4.
An R program was written to use ordiR2step to find the most likely additional explanatory environmental variables given the five already found for transect Long-80 and the two for Lat-0. The program’s results suggested some secondary explanatory variables but, when strongly correlated pairs (see Table 5) were eliminated, none remained. The most likely explanatory environmental variables (based on the Pr(>F) statistic) are, therefore, for the Long-80 transect is silicate and for Lat-0 chlorophyll a, both at the sea surface.

4.2. Selected Dominant Taxa and Environmental Factor

The dominant species were explained by RDA analysis with six environmental variables (Figure 15; Table 6). The species showed the positively correlation to temperature and salinity, e.g., S. zanclea, S. polysiphonia, S. fuscum, H. armatum-hostile, D. tetrathalamus, E. elegans, S. resurgens and C. sociliatorchia (Table 6). The species, S. zanclea, D. tetrathalamus, A. hexagonalis, E. elegans, L. pentagona pentagona and L. dodecantha were positively correlated to chlorophyll a (Figure 15; Table 6), but only L. pentagona pentagona was significantly correlated (p < 0.05). The species, S. zanclea, S. polysiphonia, S. punctatum, A. actinote, H. armatum-hostile, A. ypsilon and E. elegans was positively correlated to phosphate (Figure 15; Table 6) and only S. polysiphonia was significantly correlated (p < 0.05) (Table 6). The species, S. zanclea, S. polysiphonia, S. punctatum, E. elegans, A. circumtexta, C. sociliatorchia and L. pentagona pentagone were also positively correlated to silicate (Figure 15; Table 6) and S. polysiphonia showed the significance level (p < 0.01) (Table 6).

5. Discussion

There are only a few sediment sampling studies of radiolaria have been conducted in the Eastern Indian Ocean so far [24,25,26]. We describe a comprehensive study of the planktonic radiolarian community and its horizontal distribution on the three transects in the Eastern Indian Ocean. We made no distinction between living and dead radiolarian specimens, the samples were immediately fixed with formalin after collection and no evidence was gathered to determine how many were living at the time of collection, therefore our samples represent both the living and dead individuals that were in the water column from sea surface to 200 m depth at the time of plankton net sampling.

5.1. Radiolarian Communities in the Eastern Indian Ocean

Preliminary studies reported only the 35 taxa from the Western Indian Ocean [24], 74–261 taxa from the Eastern Indian Ocean [25,27], 40 taxa from the BOB [26]. In this study about 168 taxa of the major radiolaria group, such as Polycystinea, Acantharia, Collodaria, Taxopodida and Phaeodaria were collected from plankton tow samples from the surface to euphotic zone of EIO (Figure 6, Figure 7, Figure 8, Figure 9, Figure 10 and Figure 11).
Most of these groups were tropical or sub-tropical Pacific and Atlantic Ocean dwelling species [3,16]. On the base of previous geographical records, the distribution of radiolarian species in the EIO does not reflect their Pacific and Atlantic counterparts, was described here for the first time in the EIO (Table 7). However, the species of Polycystinea group were also retrieved, which were occasionally important (Supplemental Table S1; Figure 8 and Figure 9). The Collodaria and Taxopodida group were mainly represented by the high frequency distribution 70–90% which were dominant in our samples (Figure 12d,e), have a widespread distribution and contribute high fluxes within phytoplankton communities in open waters [51]. Nonetheless, this is the first report on the co-occurrence of Collodaria and Taxopodida in the Eastern Indian Ocean. However, variations of Collodarian contribution to the radiolarians were lower in the Antarctic and Indian Ocean [51]. The species of Spumellaria (15%) and Nassellaria (6%) were found in relatively low abundance in all samples (Figure 12g,h). The Spumellaria and Nassellaria species were highly abundant in the BOB [26] and in the Indian Ocean [1]. Spumellaria and Nassellaria have a global distribution in the surface and sediments waters of the Atlantic and Pacific Ocean [1]. More recently, a high percentage of Spumellaria were correlated with a low percentage of Collodaria and Nassellaria in the South China Sea [52]. We additionally found the Acantharia and Phaeodarian in low numbers in our samples, contributing only about 8–13% to the total radiolarian population (Figure 12f,i) and notably occurred in the twilight zones of the Ocean [51]. Acantharia are usually found in the tropical region of the Atlantic Ocean and East China Sea (Table 7) and Phaeodarian are predominantly found in the Adriatic Sea and Arctic Sea [53]. However, Gupta et al. [26] reported the few Phaeodarian species from sediments of BOB. Despite their low abundances, they are a significant component because they are celestine and opaline silica protists. We can conclude that more work is needed to examine the sampling depth per station and to distinguish between living and dead radiolaria in the Eastern Indian Ocean.

5.2. Characteristics of Radiolarian Abundance, Horizontal Distribution and Environmental Factor

Diversity indices and abundance was higher around the equator and SEQ transect regions (Figure 12). One of the reasons for high diversity was the occurrence of two species, S. punctatum and S. zanclea, in these two transect area. The diversity of Collodaria species such as S. punctatum and S. polysiphonia can be influenced by the trophic status of oceanic provinces and increased towards more oligotrophic regions [51]. As a result, high abundance in the equatorial region at stations (I815, I310, I312) can be predicted by the Wyrtki jets in spring season when WJs carries the high salinity and high nutrient waters from west to eastward [34]. However, low diversity was observed at the northern BOB and near Sumatran coastal area due to less saline waters due to runoff from the Ganges river and southwest upwelling region from these coastal locales. Radiolaria are rare in coastal areas, bays, estuarine and fjord areas due to less saline water [21,25]. This result is contrary to recent research in the Pacific Ocean, the radiolarian abundance and distribution in the continental shelf area of the Pacific Ocean was reported under low salinity and high temperature [66].
Radiolarian abundance in the Eastern Indian Ocean during this study was ranged from 5 to 5850 ind/m−3 (Figure 12). The high abundance at the one station (I815) from the south equator transect, where the colonies of S. punctatum and S. fuscum were very abundant (Figure 6d,f). Over all, abundance was below the 1500 ind/m−3. Our results generally agree with previous information that radiolarian densities are higher in the shallow water [1,16]. Plankton net-studies in the Pacific and Atlantic Ocean also show that the highest abundance of radiolarian occurs in the upper ocean layer [21]. The abundance of radiolarians was similar to the other studies from the Atlantic Ocean [13] and Indian Ocean [1]. It ranged from 1 to 100 m−3 and 500 m−3 and polycytinea radiolarian numbers are ~1200 times greater at 0–150 m than at 500–1000 m [13]. At the depths (100 m), the maximum densities such as (1400 specimen/m−3) and low densities (250–500 ind/m−3) can be observed and reported from the Pacific Ocean [4,16]. Boltovoskoy and Correa, [16] also recorded the maximum abundance such as (~200,000 specimens/m−2) at 200 m and (~300,000 specimens/m−2) at 0–400 m from 30° N to 30° S. Our results recorded the Taxopodida species, S. zanclea at maximum abundance (1780 ind/m−3) and Collodarian species, S. punctatum (5500 ind/m−3) and S. polysiphonia (661 ind/m−3) are the most dominant species from integrated depth 0 to 200 m (Figure 13a–c). S. punctatum and S. polysiphonia are the cosmopolitan species form large colonies in surface waters to 100 m depth, estimated at 30 to 20,000 colonies m−3 [67]. However, S. polysiphonia species are only encountered along the transect longitude-90° E (Figure 13c) and are restricted to shallow photic layers of the ocean [5].
The radiolarian assemblage in our data consisted of a high abundance of photosynthetic symbionts species and subtropical species such as S. punctatum, S. zanclea, E. hexastichum, D. tetrathalamus, A. circumtexta, L. pentagona pentagone, A. actinote, A. cineraria, H. armatum-hostile, E. gegenbauri. Most of the polycystinea radiolarian species are the common dominant species in the EIO [24,25,26], the Pacific Ocean [1,16,66]. Among of them, the S. punctatum and S. zanclea has new geographical distribution records in the EIO. High percentages of S. punctatum, S. zanclea, D. tetrathalamus, are common in the modern tropical-subtropical the Pacific Ocean and Atlantic Ocean [2,18,21,68]. The horizontal distribution of S. punctatum, S. fuscum and S. zanclea, with high abundance and L. pentagona pentagone, D. tetrathalamus, E. hexastichum, C. sociliatorchia low abundance were present in the transect 80° E region which can be indicator of the SCM (SEC: South Equatorial Countercurrent) (Figure 13), while S. punctatum L. pentagona pentagone and S. zanclea dominated in the equator region (Figure 13a–c,e–i) and are the indicator species of WJs (Wyrtki jets currents), While S. polysiphonia, S. punctatum, C. sociliatorchia, H. armatum-hostile, A. hexagonalis, S. zanclea and D. tetrathalamus were commonly found in the transect 90° E (Figure 13a,b), are the indicator species of BBR (Bay of Bengal Runoffs) and SJC: South Java Current. Our RDA results show that the abundances of S. punctatum and A. cineraria are positively correlated to temperature (Pearson rank correlation coefficient r > 0.31, p < 0.05), S. polysiphonia negatively correlated with salinity (r > −0.431, p < 0.001) and with phosphate (r > −0.431, p < 0.001) and L. dodocantha with Chl a concentration (r > 0.004, p < 0.005). D. tetrathalamus and H. armatum-hostile, abundance was negatively correlated with silicate concentration (r = −0.318, p < 0.005) and (r = −0.045, p < 0.005) (Table 6).

5.3. Factors Influencing on the Radiolarian Distribution

The vertical water structure of 0–50 m has the characteristic of high temperature and low salinity and high nutrients. At the depth below 100–200 m, it is characterized by high salinity and low temperature as shown in Figure 4. BOB is located in the north which has the characteristics of intrusive river runoff with low salinity and high temperature in the EIO [31], Sumatra is open coastal zone with conjunction of the BOB, characterized by low salinity and oxygenated water and the equator area is characterized by warm water and mixed layer of Chlorophyll a [30].
In our study area, the temperature and salinity of the equator are high and the boreal-spring nutrient (WOA13) data shows that the equatorial-nutrient concentration is low (Figure 3e–g). The RDA analysis gave most of the negative but significant correlation values between the environmental variables (Table 5). RDA explains the positive correlation at level (p < 0.05) between the Chlorophyll a, nitrate and temperature and between the salinity, silicate and phosphate (Table 5). Dissolved Oxygen was negatively correlated, indicating the minimum OMZ condition. This suggests that more than one variable, e.g., Chlorophyll a, temperature and silicate can shape the radiolarian community in the EIO [69,70].

5.4. Factor Influence on Radiolarian in Three Transect Area, EIO

Salinity and temperature are two significant factors that are closely related to the radiolarian community at the depth of 200 m [25,26,27,52,70,71]. High temperature can be associated with high radiolarian diversity [52]. Rogers and De Deccker, [27] clearly demonstrate that, temperature and salinity between the 100 m and 300 m and nutrients at the 100 m in the Eastern and Southern Indian Ocean, have strongly impacted on the distribution of the radiolarian community. In the present study, the relationships between the all species dataset, within each transect, with seven environmental variables often did not provide any significant correlations (Figure 14a), but significant relationships were also found with the dominant taxa at the transect 80° E and equator (Figure 14). The ratio of first RDA axis to the first unconstrained axis was greater than 1 and probability of F statistic was significant 0.005, but they did not provide a significant correlation at the transect long-90° E. The difference between the initial and subsequent unconstrained eigenvalues was not great, an attempt was made to strengthen the effect by excluding those species with an RDA score of less than two standard deviations from the mean score in any of the first six components—That is using only the dominant species. The ratio of the first to the second unconstrained eigenvalues did increase (Table 3—labelled “Dominant”) but application of GKC, BSM and RDA failed to produce any better results than using all the species data. It was noted that the species data matrix was very sparse (approximately 90% of the cells contained zeros). A dense species dataset was generated by deleting the sparsest species records and the battery of tests described above applied. No significant results were obtained. The variance in the full species data cannot be explained by a small number of variables probably because the study area is large enough to cover a number of ocean environments. Analysis of two sections of the total species data revealed possible explanatory variables: (a) The variance in species from a north–south transect at approximately 80° E (“Long-80”) could be due to the surface silicate concentrations but, alternatively, might result from nitrate concentrations or dissolved oxygen in the mixed layer. Silicate, nitrate and oxygen are necessary for radiolarian growth so the connection with the variance is likely to be causal. (b) The variance in an equatorial transect (“Lat-0”) is strongly related to the chlorophyll a level in the mixed layer but it is not certain that chlorophyll a is necessary for radiolarian growth. Thus, the connection may be indirect such as radiolarians may consume chlorophyll-producing organisms or may simply require a similar environment. However, neither temperature nor salinity showed significant correlations with the radiolarian distribution (Table 4). As salinity and temperature enable radiolarians to thrive in different water masses [16]; its effect on the vertical distribution is greater than that on the horizontal distribution [23].

5.5. Factors Influencing the Radiolarian Communities

Temperature and salinity are not sufficient explanatory variables: Chlorophyll a and nutrients and dissolved organic matter (DOM) can stimulate heterotrophic communities such as the radiolarian [4,27,71,72], tintinnid [29] and diazotroph communities [73,74]. These environmental variables play an important role in circulatory changes of EIO in the spring season. The nutrients (silicate, phosphate and nitrate) may be depleted throughout the EIO, except in coastal areas, when coastal upwelling cause nutrients to elevate [31]. In this study, the Chlorophyll a concentration in the surface layer ranged from 0.005 to 0.89 µg/L, which is similar to the remote sensing Chlorophyll-a data and high chlorophyll a of the same period can be seen in this region (Figure 4; Supplemantry Figure S1). The Chlorophyll a value is significantly higher in spring season in same region [75]. This strengthens the possibility of using Chl-a remote sensing data to estimate the geographic distributions of radiolarian in the Ocean. These concentration values often lead to low nutrients in the DCM layer in spring [29,31]. Our findings also confirmed earlier reports that low nutrients at the equator correspond to the DCM (deep Chl a concentration maximum) layer from 50 to 100 m in a same study area [29]. This DCM chlorophyll a maximum has caused the dominance of nano and picoplankton biomass [29,31] including some heterotrophs bacteria [73] in the region. The silicate, nitrate or oxygen concentrations including chlorophyll a in surface water are mostly highly correlated at the transects of 80° E and equator (Table 4). Among environmental variables, the only significant positive correlation was observed between the S. punctatum and A. cineraria with temperature and L. dodecantha with Chl a concentration (p < 0.005) (Table 6). Differently, a negative correlation was observed for S. polysiphonia with phosphate at a high significant value (p < 0.001) and salinity, D. tetrathalamus and H. armatum-hostile, with silicate concentration (Table 6). The significant correlation between radiolarian species with SST and SSS also has been reported from the Pacific Ocean [66].
These were the major environmental factors affecting on the distribution of silicified dominant species including Collodarian in the EIO (Figure 15). This finding supports previous research in Australia [76], which suggested that the symbionts of such protists can take up nutrients from their hosts, so nutrients affecting their distribution in that area and so their presence at low latitudes and absence from high ones are to be expected. The symbiotic species of Collodarian were dominant in the study area, which is associated with high radiolarian densities in numerous studies of the tropical ocean [2,5]. The symbiotic radiolarians are key player for the carbon export from nutrient-poor and subtropical marine areas [2,10]. Recently, radiolarian is contributing 29% to the meso-zooplankton in the ocean, cause the high biomass 0.089 pg C in the upper column 200 m depth and about 5.2% of total carbon biomass [2]. Photosymbiotic Collodarian species often found with the high abundant at the 100 m depths and with Acantharia contributed only 0.18% primary production in the oligotrophic waters [2]. However, Polycystinea radiolarian at the 200–400 m constituted of high biomass to the total Rhizarian [4]. The energy obtained by their primary production can enhance carbon uptake and increase carbon fluxes due to the high rates of primary production (1400–41,000 ng carbohydrate colony−1 h−1) and result in high carbon fixation (91.16 µg) [77,78]. Earlier studies indicated that colonial radiolarians in the subsurface have a strong correlation with chlorophyll a maximum at the subsurface layers (25–75 m) and cause high fluxes in the Gulf of Mexico [76] and also in the Pacific Ocean [4].
Our studies suggest that gelatinous packed species belonging to Collodarian were abundant in the euphotic zone and dominate the radiolarian community. Many species occurring in the surface areas are particularly herbivorous and omnivorous planktons which can be indirectly related to chlorophyll a, similar to other studies [72,79]. Recently, bacteria [28], tintinnids [29], coccolithophores [30], phytoplankton studies [31] have been conducted at the same sampling area and these can be nutrient source of radiolarian [23]. The radiolarian depicting in the surface for feeding the chlorophyll a producing organism such as bacterial feeders or crustaceans or it is possible that the species may be required similar environment.

6. Conclusions

The results presented here describe the first comprehensive plankton-net sampling of the Eastern Indian Ocean. Planktonic radiolarian within five classes, e.g., Acantharia, Taxopodida, Collodaria, Phaeodaria and Polycystinea, including 60 newly reported taxa, were described in this study area. Community composition, abundance and distribution of radiolaria are different in each transect but, in each case, are dominated by the combined occurrences of Collodaria and Taxopodida.
The highest abundance was recorded in the south-equator region, and the horizontal distribution appears to be controlled by three explanatory variables; chlorophyll a, silicate, and nitrate dominate the radiolarian species:
(a)
Based on the RDA analysis, the radiolarian abundance in the north–south transect at approximately 80° E (“Long-80”) is mainly controlled by the surface silicate concentrations or might be possible for high nitrate concentrations or dissolved oxygen in the mixed layer. So, their connection with the growth of radiolarian is casual and dominates only the S. punctatum, S. fuscum and S. zanclea species.
(b)
Radiolarian abundance in an equatorial transect (“Lat-0”) is strongly related to the chlorophyll a level in the mixed layer which dominates the S. punctatum, L. pentagona pentagone and S. zanclea but it is not certain that chlorophyll a is necessary for radiolarian growth. Thus, the connection may be indirect, such as radiolarians may consume chlorophyll-producing organisms or may simply require a similar environment.
(c)
The radiolarian abundance in a north-equator transect (“Long-90”) is controlled by the high salinities and silicate concentrations intrude via the BBR runoff flow from BOB and the open coastal zone of Sumatra, which dominates the S. multispina, C. inerme and S. polysiphonia, S. punctatum, C. sociliatorchia, S. zanclea and D. tetrathalamus.

Supplementary Materials

Supplementary materials can be found at https://www.mdpi.com/2073-4441/12/12/3502/s1. Table S1: The raw data as (ind/m−3) of all radiolarian taxa that were recorded in Eastern Indian Ocean cruise ‘Shiyan I’ in 2014. Figure S1. The Satellite Chlorophyll a data profile derived from NASA during April 2014 (a) and May 2014 (b) in the Eastern Indian Ocean.

Author Contributions

J.S. designed the cruise study for community analysis in EIO. C.D. collected the samples on board during cruise “Shiyan I” in 2014. S.M. did all the laboratory work including microscopy examination for identification, counting and wrote the manuscript. J.R. helped to modify all statistical analyses and drafted the statistical portion of the manuscript. X.Z. did chlorophyll a extraction. All authors have read and agreed to the published version of the manuscript.

Funding

This research was financially supported by the National Nature Science Foundation of China, grants # (41876134, 41676112 and 41276124), the Tianjin 131 Innovation Team Program (20180314), and the Changjiang Scholar Program of Chinese Ministry of Education (T2014253) to Jun Sun. The study was also partly funded by the National Science Foundation project (41406155) to Changling Ding.

Acknowledgments

We would also like to thank the Open Cruise Project in Eastern Indian Ocean of National Nature Science Foundation of China (NORC2014-10) for sharing their ship time, which carried out by the RV “Shiyan I”. We are particularly grateful for the corrections and editing by O. Roger Anderson (Sr. Research scientist, Lamont-Doherty Earth Observatory, Columbia University).

Conflicts of Interest

The authors declare no conflict of interest.

References

  1. Boltovskoy, D.; King, S.A.; Takahashi, K.; Bjorklund, K. World atlas of Distribution of Recent Polycystina Radiolaria. Coquina Press Palaeont Electron 2010, 13, 1–229. [Google Scholar]
  2. Biard, T.; Stemmann, L.; Picheral, M.; Mayot, N.; Vandromme, P.; Hauss, H.; Gorsky, G.; Guidi, L.; Kiko, R.; Not, F. In situ imaging reveals the biomass of giant protists in the global ocean. Nature 2016, 532, 504–507. [Google Scholar] [CrossRef] [PubMed] [Green Version]
  3. Ikenoue, T.; Takahashi, K.; Tanaka, S. Fifteen-year time-series of radiolarian fluxes and environmental conditions in the Bering Sea and the central subarctic Pacific, 1990–2005. Deep Sea Res. Part II 2012, 61–64, 17–49. [Google Scholar] [CrossRef]
  4. Boltovskoy, D. Vertical distribution patterns of Radiolaria Polycystina (Protista) in the World Ocean: Living ranges, isothermal submersion and settling shells. J. Plankton Res 2017, 39, 330–349. [Google Scholar] [CrossRef]
  5. Biard, T.; Pillet, L.; Decelle, J.; Poirier, C.; Suzuki, N.; Not, F. Towards an integrative morpho-molecular classification of the Collodaria (polycystinea, radiolaria). Protist 2015, 166, 374–388. [Google Scholar] [CrossRef] [Green Version]
  6. Nelson, D.M.; Treguer, P.; Brzezinski, M.A.; Leynaert, A.; Qu eguiner, B. Production and dissolution of biogenic silica in the ocean: Revised global estimates, comparison with regional data and relationship with biogenic sedimentation. Glob. Biogeochem. Cycles 1995, 9, 359–372. [Google Scholar] [CrossRef]
  7. Tréguer, P.J.; De La Rocha, C.L. The world ocean silica cycle. Annu. Rev. Mar. Sci. 2013, 5, 477–501. [Google Scholar] [CrossRef]
  8. Lisitzin, A.P. Sedimentation in the world ocean. Soc. Econ. Paleontolo. Mineralo 1972, 17, 218–241. [Google Scholar]
  9. Takahashi, K.; Honjo, S. Vertical flux of Radiolaria: A taxon-quantitative sediment trap study from the western tropical Atlantic. Micropaleonto 1981, 27, 140–190. [Google Scholar] [CrossRef]
  10. Caron, D.A. Ocean science: The rise of Rhizaria. Nature 2016, 532, 444–445. [Google Scholar] [CrossRef]
  11. Dworetzky, B.A.; Morley, J.J. Vertical distribution of radiolaria in the eastern equatorial Atlantic: Analysis of a multiple series of closely-spaced plankton tows. Mar. Micropaleontol. 1987, 12, 1–19. [Google Scholar] [CrossRef]
  12. Swanberg, N.R.; Bjørklund, K.R. The radiolarian fauna of western Norwegian fjords: Patterns of abundance in the plankton. Mar. Micropaleontol. 1986, 11, 231–241. [Google Scholar] [CrossRef]
  13. Boltovskoy, D. Classification and distribution of South Atlantic recent polycystine Radiolaria. Palaeonto. Electronic 1998, 1, 116. [Google Scholar] [CrossRef] [Green Version]
  14. Boltovskoy, D.; Gibbons, M.J.; Hutchings, L.; Binet, D. General biological features of the South Atlantic. In South Atlantic Zooplankton; Boltovskoy, D., Ed.; Backhuys Publishers: Leiden, The Netherlands, 1999; pp. 1–42. [Google Scholar]
  15. Abelmann, A.; Gowing, M.M. Spatial distribution of living polycystine radiolarian taxa-baseline study for paleoenvironmental reconstructions in the Southern Ocean (Atlantic sector). Mar. Micropaleontol. 1997, 30, 3–28. [Google Scholar] [CrossRef]
  16. Boltovoskoy, D.; Correa, N. Planktonic equatorial diversity troughs: Fact or artifact? Latitudinal diversity gradient in Radiolaria. Ecology 2016, 98, 112–124. [Google Scholar] [CrossRef]
  17. Chen, M.; Tan, Z. Radiolarian distribution in surface sediments of the northern and central South China Sea. Mar. Micropaleontol. 1997, 32, 173–194. [Google Scholar] [CrossRef]
  18. Ishitani, Y.; Takahashi, K. The vertical distribution of Radiolaria in the waters surrounding Japan. Mar. Micropaleontol. 2007, 65, 113–136. [Google Scholar] [CrossRef]
  19. Yamashita, H.; Takhahshi, K.; Fuijitani, N. Zonal and Vertical distribution of radiolarians in the western and central Equatorial Pacific in January 1999. Deep-Sea Res. Part II Trop. Stud. Oceanog 2000, 49, 2823–2882. [Google Scholar] [CrossRef]
  20. Okazaki, K.; Takahashi, K.; Itaki, K.; Kawasaki, Y. Comparison of radiolarian vertical distributions in the Okhotsk Sea near the Kuril Islands and in the northwestern North Pacific off Hokkaido Island. Mar. Micropaleontol. 2004, 51, 257–284. [Google Scholar] [CrossRef]
  21. Matsuzaki, K.M.; Itaki, T.; Kimoto, K. Vertical distribution of polycystine radiolarians in the northern East China Sea. Mar. Micropaleontol. 2016, 125, 66–84. [Google Scholar] [CrossRef]
  22. Hernández-Almeida, I.; Cortese, G.; Yu, P.S.; Chen, M.T.; Kucera, M. Environmental determinants of radiolarian assemblages in the western Pacific since the last deglaciation. Paleoceanography 2017, 32, 830–847. [Google Scholar] [CrossRef]
  23. Ikenoue, T.; Bjørklund, K.R.; Fujiwara, A.; Uchimiya, M.; Kimoto, K.; Harada, N.; Nishino, S. Horizontal and vertical distribution of polycystine radiolarians in the western Arctic Ocean during the late summers of 2013 and 2015. Polar Biol. 2019, 42, 285–305. [Google Scholar] [CrossRef]
  24. Johnson, D.A.; Nigrini, C. Radiolarian biogeography in surface sediments of the western Indian Ocean. Mar. Micropaleontol. 1980, 5, 111–152. [Google Scholar] [CrossRef]
  25. Johnson, D.A.; Nigrini, C. Radiolarian biogeography in surface sediments of the eastern Indian Ocean. Mar. Micropaleontol. 1982, 7, 237–281. [Google Scholar] [CrossRef]
  26. Gupta, S.M.; Mohan, R.; Guptha, M.V.S. Radiolarian fluxes in the southern Bay of Bengal: A sediment trap study. Deep Sea Res. 2002, 49, 1669–1688. [Google Scholar] [CrossRef]
  27. Rogers, J.; De Deckker, P. Radiolaria as a reflection of environmental conditions in the eastern and southern sectors of the Indian Ocean: A new statistical approach. Mar. Micropaleontol. 2007, 65, 137–162. [Google Scholar] [CrossRef]
  28. Wang, J.; Kan, J.; Zhang, X.; Xia, Z.; Zhang, X.; Qian, G.; Miao, Y.; Leng, X.; Sun, J. Archaea Dominate the Ammonia-Oxidizing Community in Deep-Sea Sediments of the Eastern Indian Ocean from the Equator to the Bay of Bengal. Front. Microbiol. 2017, 8, 415. [Google Scholar] [CrossRef] [Green Version]
  29. Zhang, C.; Sun, J.; Wang, D.; Song, D.; Zhang, X.; Munir, S. Tintinnid community structure in the eastern equatorial Indian Ocean during the spring inter-monsoon period. Aquat. Biol. 2017, 26, 87–100. [Google Scholar] [CrossRef] [Green Version]
  30. Liu, H.; Sun, J.; Wang, D.; Zhang, X.; Zhang, C.; Song, S.; Thangaraj, S. Distribution of living Coccolithophores in eastern Indian Ocean during spring Inter-monsoon. Sci. Rep. 2018, 8, 12488. [Google Scholar] [CrossRef]
  31. Wei, Y.; Zhang, G.; Chen, J.; Wang, J.; Ding, C.; Zhang, X.; Sun, J. Dynamic responses of picophytoplankton to physicochemical variation in the eastern Indian Ocean. Ecol. Evol. 2019, 9, 5003–5017. [Google Scholar] [CrossRef]
  32. Martinez, J.I.; Taylor, L.; De Deckker, P.; Barrows, T. Planktonic foraminifera from the eastern Indian Ocean: Distribution and ecology in relation to the Western Pacific Warm Pool (WPWP). Mar. Micropaleontol. 1998, 34, 121–151. [Google Scholar] [CrossRef]
  33. Vinayachandran, P.N.; Kagimoto, T.; Masumoto, Y.; Chauhan, P.; Nayak, S.R.; Yamagata, T. Bifurcation of the east india coastal current east of Sri-Lanka. Geophy. Res. Lett 2005, 32, 291–310. [Google Scholar] [CrossRef] [Green Version]
  34. Zeng, X.-Z.; Li, Y.-N.; Peng, S.-Q. Analysis of Equatorial Currents Observed by Eastern Indian Ocean Cruises in 2010 and 2011. Atm. Ocean. Sci. Lett. 2012, 5, 280–283. [Google Scholar] [CrossRef]
  35. Murtugudde, R.; McCreary, J.P.; Busalacchi, A.J. Oceanic processes associated with anomalous events in the Indian Ocean with relevance to 1997–1998. J. Geophy. Res 2000, 105, 3295–3306. [Google Scholar] [CrossRef] [Green Version]
  36. Strickland, J.D.H.; Parsons, T.R. A Practical Handbook of Seawater Analysis; The Alger Press Ltd.: Ottawa, ON, Canada, 1972. [Google Scholar]
  37. Sun, J.; Liu, D.; Qian, S. A quantative research and analysis method for marine phytoplankton: An introduction to Utermöhl method and its modification. J. Oceanog. Huanghai Bohai Seas. 2002, 20, 105–112. (In Chinese) [Google Scholar]
  38. Haeckel, E. Report on the Radiolaria collected by HMS Challenger during the years 1873–1876. Rep. Sci. Res. Voyag. HMS Challenger Zool. 1887, 18, 1–1803. [Google Scholar]
  39. Takahashi, K. Radiolaria: Flux ecology and taxonomy in the Pacific and Atlantic. Ocean Biocon Ser. 1991, 3, 1–301. [Google Scholar]
  40. Decelle, J.A.; Not, F. Acantharia. eLS 2015. [Google Scholar] [CrossRef]
  41. Shannon, C.E. A mathematical theory of communications. Bell Syst. Tech. J. 1948, 27, 379–423. [Google Scholar] [CrossRef] [Green Version]
  42. Xu, Z.L.; Chen, Y.Q. Aggregated intensity of dominant species of zooplankton in autumn in the East China Sea and Yellow Sea. J. Ecol. 1989, 8, 13–15. (In Chinese) [Google Scholar]
  43. Legendre, P.; Gallagher, E. Ecologically meaningful transformations for ordination of species data. Oecologia 2001, 129, 271–280. [Google Scholar] [CrossRef] [PubMed]
  44. Borcard, D.; Gillet, F.; Legendre, P. Numerical Ecology with R. Use R! Springer: Montreal, QC, Canada, 2011; p. 306. [Google Scholar]
  45. Blanchet, F.; Legendre, P.; Borcard, D. Forward selection of explanatory variables. Ecology 2008, 89, 2623–2632. [Google Scholar] [CrossRef] [PubMed]
  46. ter Braak, C.; Šmilauer, P. Canoco for Windows 4.53 Biometris-Plant Research International; Wageningen University and Research Centre: Wageningen, The Netherlands, 2004. [Google Scholar]
  47. Yeomans, K.; Golder, P. The Guttman-Kaiser Criterion as a Predictor of the Number of Common Factors. J. R. Stat. Soc. 1982, 31, 221–229. [Google Scholar] [CrossRef]
  48. Jackson, J.E. A Users’ Guide to Principal Components; Wiley Series in Probablity and Statistics; John Wiley and Sons: New York, NY, USA, 2005. [Google Scholar]
  49. Garcia, H.; Locarnini, R.; Boyer, T.; Antonov, J.; Baranova, O.K.; Zweng, M.; Reagan, J.; Johnson, D. World Ocean Atlas 20; Dissolved Inorganic Nutrients (Phosphate, Nitrate, Silicate); US Government Printing Office: Washington, DC, USA, 2013; Volume 4. [Google Scholar]
  50. Garcia, H.; Locarnini, R.; Boyer, T.; Antonov, J.; Baranova, O.K.; Zweng, M.; Reagan, J.; Johnson, D. World Ocean Atlas; Dissolved Oxygen, Apparent Oxygen Utilization, and Oxygen Saturation; US Government Printing Office: Washington, DC, USA, 2013; Volume 3. [Google Scholar]
  51. Biard, T.; Bigeard, E.; Audic, S.; Poulain, J.; Gutierrez-Rodriguez, A.; Pesant, S.; Stemmann, L.; Not, F. Biogeography and diversity of Collodaria (Radiolaria) in the global ocean. ISME J. 2017, 11, 1331–1344. [Google Scholar] [CrossRef] [Green Version]
  52. Qu, H.; Xu, Y.; Wang, J.; Li, X. Radiolarian assemblages in the shelf area of the East China Sea and Yellow Sea and their ecological indication of the Kuroshio Current derivative branches. Peer J. 2020, 8, e9976. [Google Scholar] [CrossRef] [PubMed]
  53. Krsinic, A.; Krsinic, F. Radiolarian in the Adriatic Sea plankton eastern Mediterranean. Acta Adriat. 2012, 53, 189–212. [Google Scholar]
  54. Decelle, N.; Suzuki, F.; Mahé, C.; De Vargas, N.F. Molecular phylogeny and morphological evolution of the Acantharia Radiolaria. Protist 2015, 163, 435–450. [Google Scholar] [CrossRef]
  55. De Deckker, P. On the celestite-secreting Acantharia and their effect on seawater. Hydrobiolog 2004, 517, 1–13. [Google Scholar] [CrossRef]
  56. Tan, Z. Order Acantharia Order Spumellaria. In Fauna Sinica Phylum Protozoa; Editorial Committee of Fauna Sinica, Academia Sinica: Beijing, China, 1998; pp. 1–315. [Google Scholar]
  57. Cachon, M.; Cachon, M. Sticholonche zanclea Hertwig: A reinterpretation of its phylogenetic position based upon new observations on its ultra-structure. Arch. Protistenkd. 1978, 120, 148–168. [Google Scholar] [CrossRef]
  58. Liu, R. Checklist of Marine Biota of China Seas; Science Press: Beijing, China, 2008. [Google Scholar]
  59. Haeckel, E. Die Radiolarien Rhizopoda Radiolaria Eine Monographie; Reimer: Berlin, Garmany, 1862; pp. 1–572. [Google Scholar]
  60. Takahashi, T.; Yuasa, D.; Honda, M.S. Molecular phylogeny of solitary shell-bearing Polycystinea Radiolaria. Rev. Micropaleontol. 2004, 47, 111–118. [Google Scholar] [CrossRef]
  61. Nakumura, Y.; Suzukai, N. Phaeodaria: Diverse Marine Cercozoans of World-Wide Distribution. In Marine Protists; Springer: Tokyo, Japan, 2015. [Google Scholar]
  62. Erez, K.; Takahashi, K.; Honjo, S. In Situ Dissolution of Radiolaria In the Central North Pacific Ocean. Earth Planet. Sci. Lett. 1982, 59, 245–254. [Google Scholar] [CrossRef]
  63. Itaki, T. Late glacial to holocene polycystine radiolarians from the Japan Sea. News Osaka Micropaleontol. 2009, 14, 43–89. [Google Scholar]
  64. Benson, S. Recent Radiolaria from the Gulf of California. Ph.D. Thesis, University of Minnesota, Minneapolis, MN, USA, 1966. [Google Scholar]
  65. Bjørklund, K.R.; Kruglikova, S.B. Polycystine radiolarians in surface sediments in the Arctic Ocean basins and marginal seas. Mar. Micropaleontol. 2003, 493, 231–273. [Google Scholar] [CrossRef]
  66. Liu, L.; Qiang, Z.; Chen, M.; Zhang, L.; Rong, X. Radiolarian biogeography in surface sediments of the Northwest Pacific marginal seas. Sci. China Earth. Sci. 2017, 3, 517–530. [Google Scholar] [CrossRef]
  67. Dennett, M.R.; Caron, D.A.; Michaels, A.F.; Gallager, S.M.; Davis, C.S. Video plankton recorder reveals high abundances of colonial Radiolaria in surface waters of the central North Pacific. J. Plankton Res. 2002, 24, 797–805. [Google Scholar] [CrossRef]
  68. Chang, F.; Zhuang, L.; Li, T.; Yan, J.; Cao, Q.; Cang, S. Radiolarian fauna in surface sediments of the northeastern East China Sea. Microb. Ecol. 2003, 48, 169–204. [Google Scholar] [CrossRef]
  69. Rogers, J. Monsoonal and other climatic influences on radiolarian species abundance over the last 35 ka, as recorded in core FR10/95-GC17, off North West Cape (Western Australia). Rev. Micropalontol. 2016, 59, 275–293. [Google Scholar] [CrossRef]
  70. Rogers, J.; De Deckker, P. Environmental reconstructions of the upper 500 m of the southern Indian Ocean over the last 40 ka using Radiolarian (Protista) proxies. Quat. Sci. Rev. 2011, 30, 876–886. [Google Scholar] [CrossRef]
  71. Swanberg, N.R. The Ecology of Colonial Radiolarians: Their Colony Morphology, Trophic Interactions and Associations, Behavior, Distribution, and the Photosynthesis of their Symbionts. Ph.D Thesis, Massachusetts Institute of Technology and Woods Hole Oceanographic Institution, Cambridge, MA, USA, 1979; p. 202. [Google Scholar]
  72. Anderson, O. Radiolaria; Springer-Verlag: New York, NY, USA, 1983; p. 355. [Google Scholar]
  73. Wu, C.; Kan, J.; Liu, H.; Pujari, L.; Guo, C.; Wanf, X.; Sun, J. Heterotrophic Bacteria Dominate the Diazotrophic Community in the Eastern Indian Ocean (EIO) during Pre-Southwest Monsoon. Microb. Ecol. 2019, 78, 804–819. [Google Scholar] [CrossRef]
  74. Loescher, C.R.; GroβKopf, T.; Desai, F.D.; Gill, D.; Schunck, H.; Croot, P.L.; Schlosser, C.; Neulinger, S.C.; Pinnow, N.; Lavik, G.; et al. Facets of diazotroph in the oxygen minimum zone waters off Peru. ISME J 2014, 8, 2180–2192. [Google Scholar] [CrossRef] [Green Version]
  75. Strutton, V.; Coles, R.; Hood, R.M.; Matear, M.; Phillips, H. Biogeochemical variability in the central equatorial Indian Ocean during the monsoon transition. Biogeosciences 2015, 12, 2367–2382. [Google Scholar] [CrossRef] [Green Version]
  76. Casey, R.; MeMillen, K.; Reynolds, R.; Spaw, J.M.; Schwarzer, R.; Gevirtz, J.; Bauer, M. Relict and Expatriated Radiolarian Fauna in the Gulf of Mexico and Its Implications. Gulf. Coast Assoc. Geol. Soc. Trans. 1979, 29, 224–227. [Google Scholar]
  77. Swanberg, N.R.; Harbison, G.R. The ecology of Collozoum longiforme. sp. nov. a new colonial radiolarian from the equatorial Atlantic Ocean. Deep Sea Res. 1980, 27, 715–732. [Google Scholar] [CrossRef]
  78. Griffith, E.; Calhoun, M.; Thomas, E.; Averyt, K.; Erhardt, A.; Bralower, T.; Lyle, M.; Olivarez Lyle, A.; Paytan, A. Export productivity and carbonate accumulation in the Pacific Basin at the transition from a greenhouse to icehouse climate (late Eocene to early Oligocene). Paleoceanography 2010, 25, PA3212. [Google Scholar] [CrossRef] [Green Version]
  79. Anderson, O. Living together in the plankton: A survey of marine protist symbioses. Review in special issue (Marine Heterotrophic Protists). Acta Protozool. 2014, 53, 29–38. [Google Scholar]
Figure 1. The equatorial currents of the Eastern Indian Ocean. BBR (Bay of Bengal runoffs), EICC (east India coastal current), WICC (west India coastal currents), EK (Ekman transport), SEC (south equatorial counter current), SJS (south Java current), SMC (northeast and southwest monsoon currents) and WJ (Wyrtki jets).
Water 12 03502 g001
Figure 2. Map of the Eastern Indian Ocean, showing the sampling stations in the study area across the three transects during cruise in spring 2014.
Water 12 03502 g002
Figure 3. The vertical profile of nitrate (a,e,i), phosphate (b,f,j), silicate (c,g,k) and dissolved oxygen (d,h,l) in three transects of the Eastern Indian Ocean. (a) Nitrate concentrations (µM) in the North Equatorial transect (NEQ-transect); (b) Phosphate concentrations (µM) in the NEQ-transect; (c) Silicate concentrations (µM) in the NEQ-transect; (d) Dissolved oxygen (mg/L) in the NEQ-transect; (e) Nitrate concentrations (µM) in the Equatorial transect (EQ-transect); (f) Phosphate concentrations (µM) in the EQ-transect; (g) Silicate concentrations (µM) in the EQ-transect; (h) Dissolved oxygen unit (mg/L) in the EQ-transect; (i) Nitrate concentrations (µM) in the South-Equatorial transect (SEQ-transect); (j) Phosphate concentrations (µM) in the SEQ-transect; (k) Silicate concentrations (µM) in the SEQ-transect; (l) Dissolved oxygen (mg/L) in the SEQ-transect.
Water 12 03502 g003
Figure 4. The vertical distribution of temperature (a,d,g), salinity (b,e,h) and chlorophyll a (c,f,i) in three transects described from Table 1. (a) Temperature (°C) in the North Equatorial transect (NEQ-transect); (b) Salinity (psu) in the NEQ-transect; (c) Chlorophyll a concentration (µg/L) in the NEQ-transect; (d) Temperature (°C) in the Equatorial transect (EQ-transect); (e) Salinity (psu) in the EQ-transect; (f) Chlorophyll a concentration (µg/L) in the EQ-transect; (g) Temperature (°C) in the South-Equatorial transect (SEQ-transect); (h) Salinity (psu) in the SEQ-transect; (i) Chlorophyll a concentration (µg/L) in the SEQ-transect.
Water 12 03502 g004
Figure 5. The horizontal distribution of sea-surface temperature (a), salinity (b) and chlorophyll a (c) in the Eastern Indian Ocean. Panels (a,b) represents the high temperature (°C) and salinity (psu) values in BOB stations and SEQ stations at the transect 90° E and 80° E, and (c) represent the maximum Chlorophyll a (µg/L) concentration in the Equator station.
Water 12 03502 g005
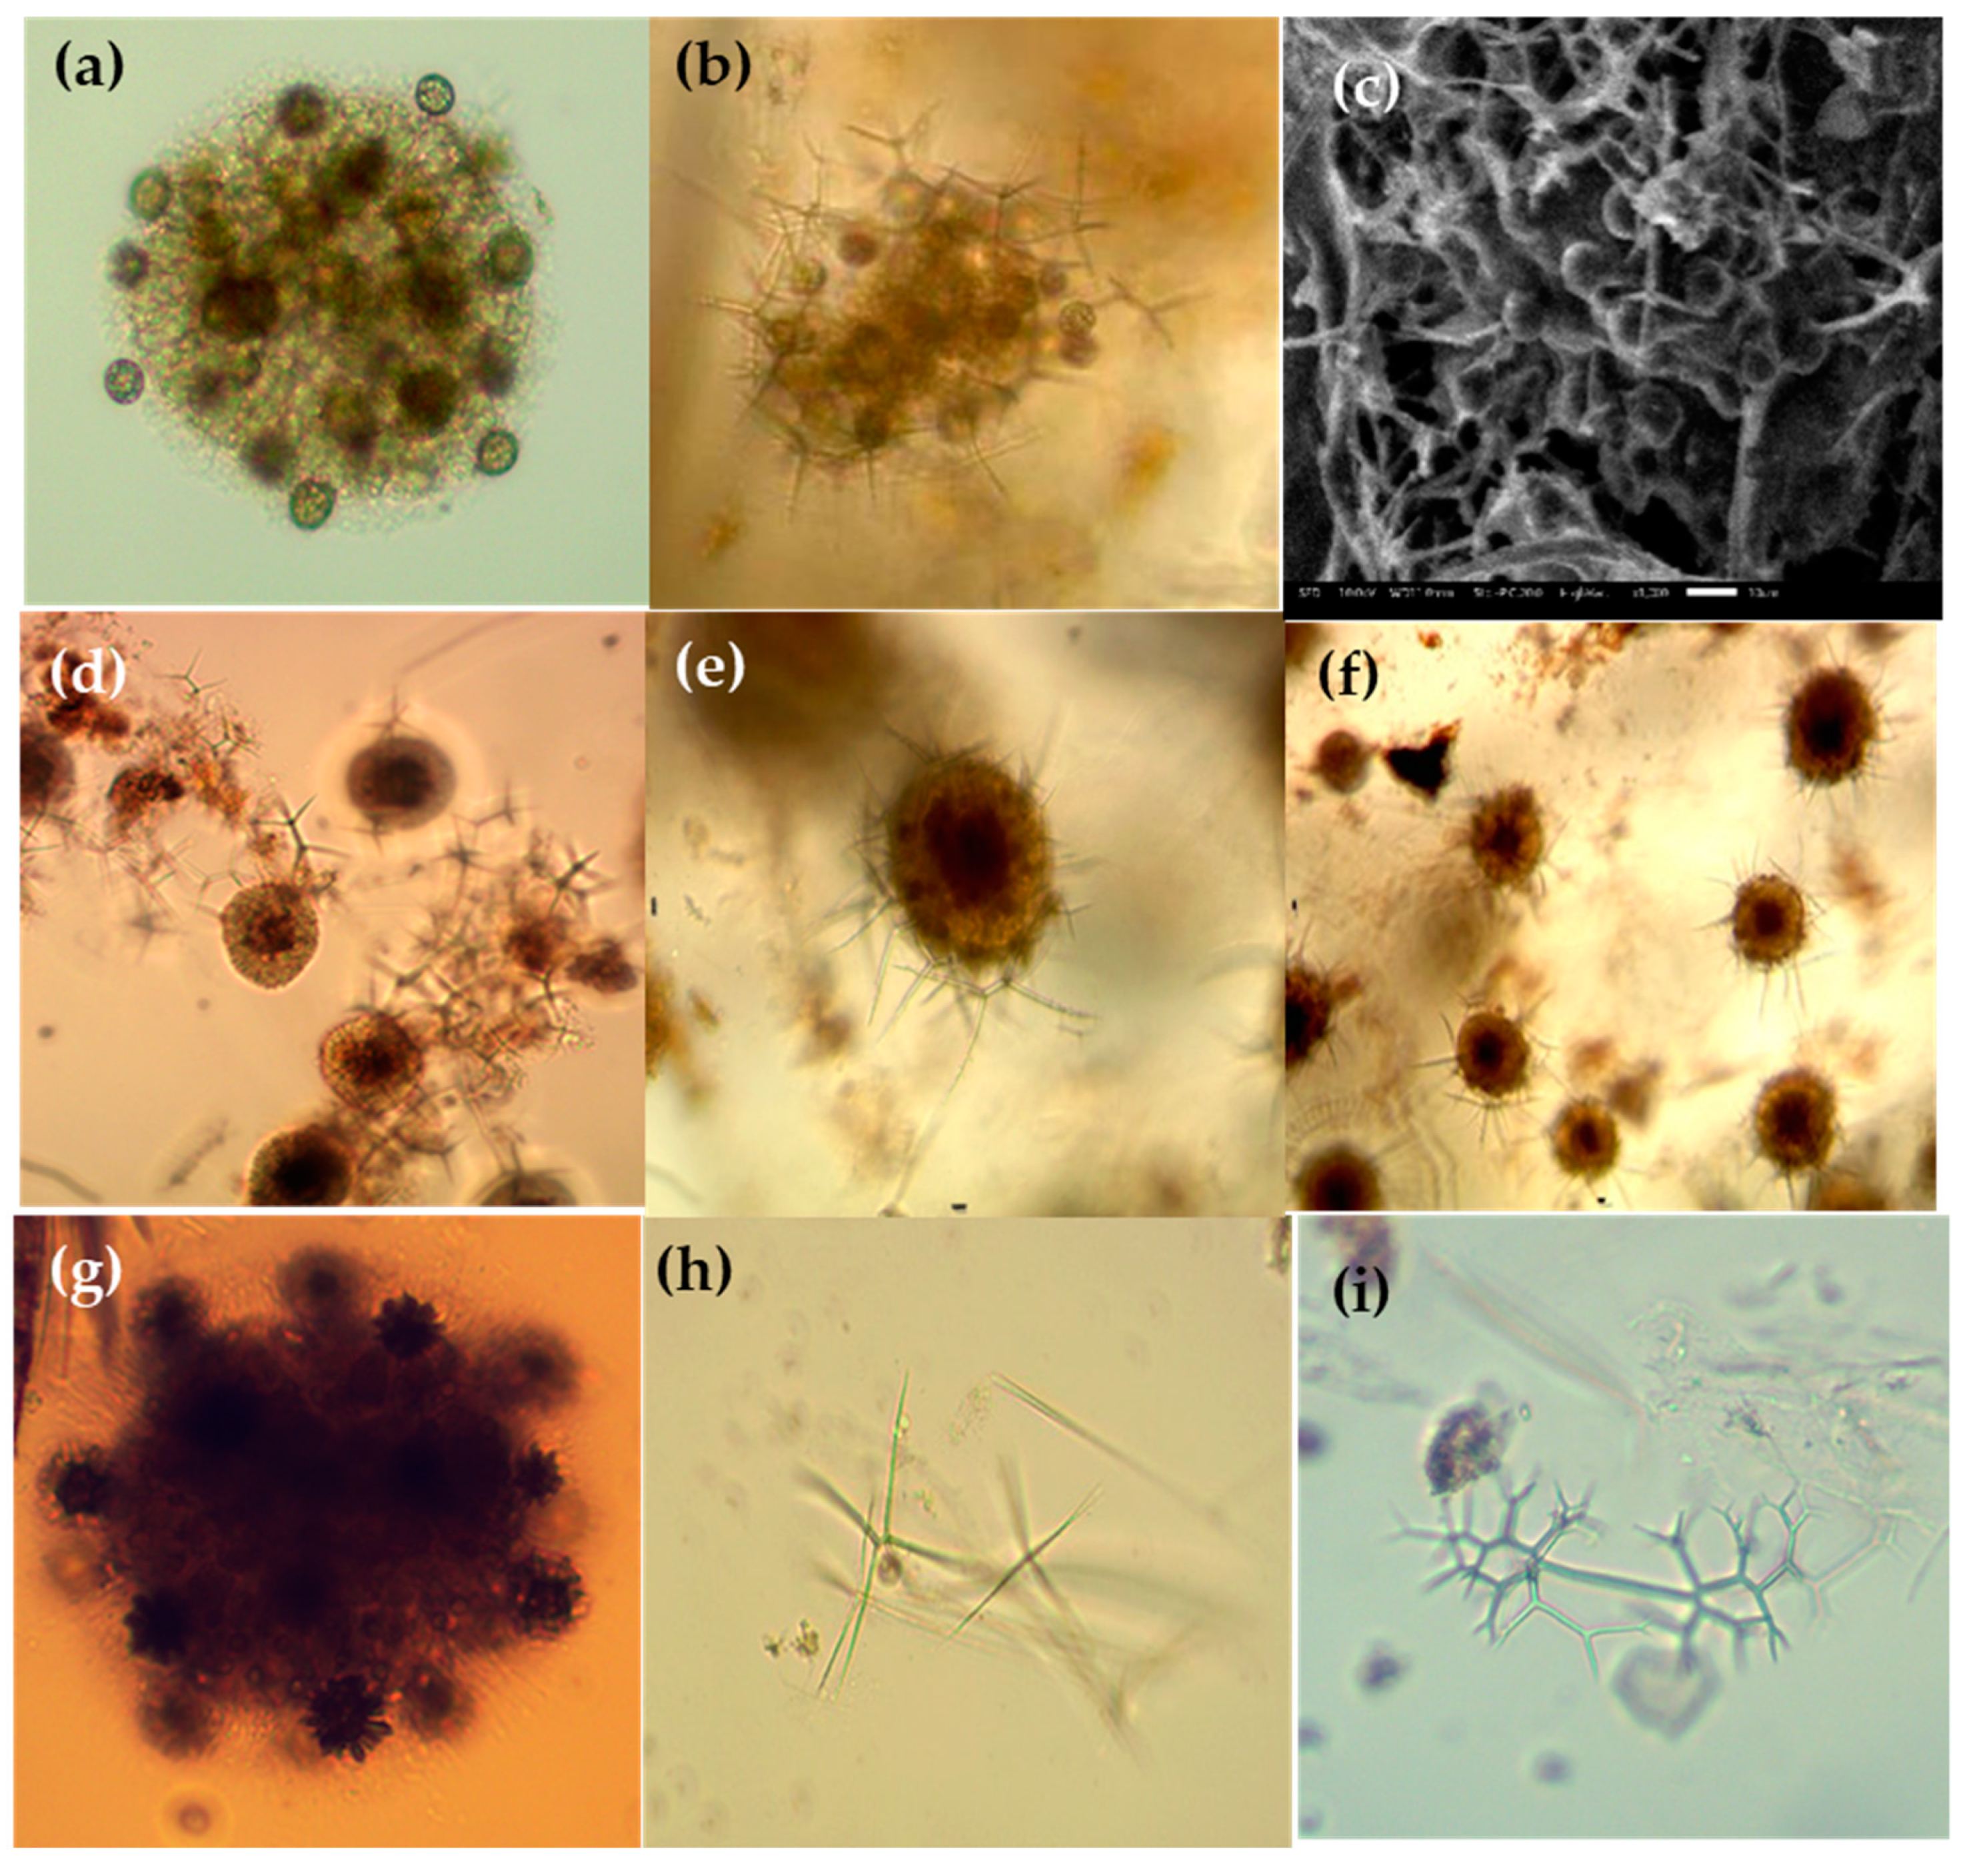
Figure 6. Photomicrographs of Collozeoum (a) and Sphaerozoum species (bg) and Thallosoxanthium species (h,i) in the Eastern Indian Ocean. (a) Collozoum inerme; (b,c) Sphaerozoum punctatum; (c) SEM of the spicules (Sk); (e,f) Sphaerozoum fuscum; (g) Sphaerozoum cf. ovodimare; (h) Thalassoxanthium cervicorne; (i) Thalassoxanthium octoceras. Scale bars: (c) 20 µm.
Water 12 03502 g006
Figure 7. Photographs of Collosphera and Siphonosphera species of Collodaria (ao) in the Eastern Indian Ocean. (a,b) Siphonosphaera magnisphaera; (c,f) Siphonosphaera polysiphonia; (g,h) Siphonosphaera socialis; (j) and (k) Solenosphaera zanguebarica; (l) Collosphaera macropora; (m) Collosphaera tuberosa; (n,o) Collosphaera huxleyi. Scale bars: (b,h) 50 µm, (e) 10 µm, (f,io) 20 µm.
Water 12 03502 g007
Figure 8. Photomicrographs of Spumellarian species in the Eastern Indian Ocean, e.g., (a) Acanthosphaera actinota; (b) Acanthosphaera pinchuda; (c,d) Actinosphaera capillacea; (e,f) Actinosphaera tenella; (g) Astrosphaera hexagonalis; (h) Arachnosphaera myriacantha; (i) Centrocubus cladostylus; (j,k) Cromyechinus circumtextum; (l) Elatomma penicillus; (m,n) Hexalonche amphisiphon; (o) Styptosphaera spongiacea; (p) Spongodictyon spongiosum; (q) Streblacantha circumtexta; (r) Spongurus pylomaticus; (s,t) Xiphosphaera tessaractis; (u) Xiphatractus sp; (v) Stylodictya multispina; (w,x) Stylochlamydium venustum. Scale bars: (a,b,f,i,n,q) 20 µm, (r,w) 50 µm, (t) 100 µm.
Water 12 03502 g008
Figure 9. Photomicrographs of Nassellarian species, e.g., (a,b) Callimitra solocicribrata; (c,d) Clathrocorys murrayi; (e,f) Lophophaena capito; (g,h) Lampromitra schultzei; (i) Phormacantha hystrix, (j) Pseudodictyophimus gracilipes, (k) Pteroscenium pinnatum, (l) Tetraphormis dodecaster; (m) Tetraplecta pinigera; (n) Archibursa tripodiscus; (o) Pterocanium korotnevi; (p) Stichopilium bicorne; (q) Conarachnium parabolicum; (r) Litharachnium tentorium; (s) Eucecryphalus clinatus; (t) Eucyrtidium dictyopodium; (u) Dictyocodon palladius; (v) Sethoconus venosum; (w) Theopilium tricostatum; (x) Cephalospyris cancellata. Scale bars: (a,m,p,x) 50 µm, (f,h–k,o,r–w) 20 µm and (n) 10 µm.
Water 12 03502 g009
Figure 10. Photomicrographs of Acanthrian species (af) and Taxopodida species (e,f) in the Eastern Indian Ocean. (a) Acanthochiasma fusiforme; (b) Trizona brandti; (c) Amphilonche concreta/elongate; (d) Diploconus cylindrus; (e,f) Sticholonche zanclea. Scale bar: (f) 50 µm.
Water 12 03502 g010
Figure 11. Photomicrographs of Phaeodarian species (al) in the Eastern Indian Ocean. (a) Aulacantha scolymantha; (b) Auloceras arborescens subelegens; (c,d) Aulatractus ternaria; (e) Coelodendrum ramosissimum; (f,g) Castanidium longispiniim; (h) Conchidium compressa; (i) Conchidium capsula; (j) Conchidium caudatum; (k) Challengeron radians; (l) Pharyngella gastrula. Scale bars: (a,d,g) : 100 µm, (k) 10 µm.
Water 12 03502 g011
Figure 12. Species richness (a) and Shannon-diversity H’ (b), Total abundance ind/m−3 of radiolarian (c), % of Collodaria (d), % of Taxopodida (e), % of Acantharia (f), % of Spumellaria (g), % of Nassellaria (h) and % of Phaeodaria (i) in the Eastern Indian Ocean. Panels (di) represent the percentage contribution of representative groups to total radiolarian among stations of the Eastern Indian Ocean.
Water 12 03502 g012
Figure 13. Horizontal distribution and abundance (ind/m−3) of dominant species of radiolarian (ai) in the Eastern Indian Ocean. (a) Sphaerozoum punctatum, (b) Sticholonche zanclea, (c) Siphonosphaera polysiphonia, (d) L. pentagona pentagona, (e) Callimitra sociliatorchia, (f) Hexacontium armatum-hostile, (g) Didymocyrtis tetrathalmus, (h) Astrosphaera hexagonalis, (i) Eucytidium hexastichum.
Water 12 03502 g013
Figure 14. Plots for (a) the full species dataset, (b) the Long-90 transect, (c) the Long-80 transect and (d) the Lat-0 transect. The left-hand column contains plots of the eigenvalues with the average eigenvalue shown as a red line (Guttman–Kaiser Criterion): The number of values exceeding the average is an indication of the number of explanatory variables. The right-hand column has the percentage variance (yellow) against the broken stick estimates (red): The number of values exceeding the broken stick estimates indicate the probable number of explanatory variables.
Water 12 03502 g014
Figure 15. Redundancy analysis (RDA) plot between the dominant radiolarian species and environmental variables.
Water 12 03502 g015
Table 1. The station designators and coordinates of the three transects.
NEQ-Long-90SEQ-Long-80EQ-Lat-0
StationLongitudeLatitudeStationLongitudeLatitudeStationLongitudeLatitude
HFA016.50288.002I3022.41580.003I1010.48592.685
HFA037.50588.003I3041.50280I4010.00280.004
HFA038.588I308−0.99780.006I403082.007
I1010.48592.685I310−1.99680.004I404083.016
I1031.592.233I312−2.99980I406085.002
I1052.49991.632I314−480.003I407086.002
I1073.591.03I316−580I410089.002
I1094.590.434I318−680.002I412091.003
I501−0.593.103I4010.00280.004I413092.014
I503−1.593.81I807−0.581.003I501−0.593.103
I505−2.594.337I809−1.49981.002I807−0.581.003
I507−3.594.935I811−2.49980.998
I509−4.595.532I813−3.580.999
I511−5.49996.098I815−4.49981
I601689.5I817−5.581
I6035.99988.502
IQ210.07888.133
Table 2. The relative abundance (%), frequency distribution and dominant index (Y) of the selected radiolarian species in EIO.
SpeciesFrequency (fi)/%Relative Abundance (P)/%Dominance Index Y
Sphaerozoum punctatum5222.25.1
Sphaerozoum fuscum5015.83.49
Didymocyrtis tetrathalamus523.50.8
Sticholonche zanclea397.71.32
Siphonsphaera polysiphonia323.30.46
Lophospyris pentagona pentagone362.30.37
Eucytidium hexastichum361.90.31
Anthocyrtidium cineraria200.80.07
Pterocanium pretextum250.80.09
Eucecryphalus gegenbauri201.20.11
Lophophaena dodecantha200.70.07
Arachnocorys circumtexta231.20.12
Callimitra sociliatorchia2720.24
Amphirrhopalum ypsilon200.70.06
Hexacontium armatum-hostile231.40.14
Acanthsphaera actinote230.70.07
Euchitonia elegans180.60.05
Spongodiscus resurgens180.60.05
Table 3. The inertia and first ten eigenvalues were generated by RDA from the full species data and the three transect (see text). Two sets of data are given for each source: That for the full, Hellinger-transformed, species set and that for the reduced to include the dominant species only.
SourceDatasetInertiaPC1PC2PC3PC4PC5PC6PC7PC8PC9PC10
AllHellinger0.7860.0980.0740.0540.0480.0420.0380.0330.0290.0270.026
AllDominant0.7860.1240.0990.0810.0690.0500.0480.0450.0330.0300.026
Long-90Hellinger0.7550.1270.0990.0730.0640.0560.0520.0440.0380.0360.030
Long-90Dominant0.7550.1470.1120.0850.0760.0550.0440.0400.0350.0210.017
Long-80Hellinger0.7740.1640.1080.0950.0780.0650.0550.0520.0400.0330.028
Long-80Dominant0.7740.1850.1240.1020.0770.0640.0470.0230.0200.0160.008
Lat-0Hellinger0.8200.1540.1230.1110.0930.0900.0780.0670.0460.0330.023
Lat-0Dominant0.8200.1760.1240.1060.0910.0890.0630.0480.0290.0160.011
Table 4. The potential explanatory environmental variables for the Lat-0 and Long-80 transects with. Details of the variance explained and the associated significance statistics.
TransectExplanatory VariableDepth (m bsl)Total VarianceVariance Explained% Variance ExplainedF StatisticPr(>F)Λ12
Lat-0Chlorophyll a00.80850.139917.31.8840.00011.13
Lat-0Chlorophyll a250.80850.131216.21.7430.00151.05
Long-80Nitrate750.79390.102012.91.9170.00131.03
Long-80Diss. Oxygen250.79390.107713.62.0410.00061.06
Long-80Diss. Oxygen500.79390.107713.62.0420.00081.09
Long-80Silicate00.79390.106513.42.0140.00031.06
Table 5. The Pearson coefficients for the correlations between the six ocean environmental variables used in this study.
Correlation Coefficients (43 Degrees of Freedom)Nitrate µMPhosphate µMSalinity psuSilicate µMTemperature °CDissolved Oxygen mg/L
Chlorophyll a µg/L0.131−0.326−0.164−0.1260.149−0.124
Nitrate µM −0.540−0.339−0.5560.2800.129
Phosphate µM 0.4300.662−0.465−0.159
Salinity psu 0.672−0.551−0.406
Silicate µM −0.676−0.622
Temperature °C 0.590
Dissolved Oxygen mg/L
Figure in bold italics are for those combinations significant at the 1% level.
Table 6. The Pearson coefficients for the correlations between the dominant species and integrated six ocean environmental variables used in this study.
Dominant SpeciesTemperature °CSalinity psuChlorophyll a µg/LPhosphate µMSilicate µMNitrate µM
Sticholonche zanclea0.1180.1300.2080.0310.121−0.020
Siphonosphaera polysiphonia0.177−0.471**−0.2130.004*0.1300.068
Sphaerozoum punctatum−0.312*−0.043−0.1870.0850.092−0.048
Sphaerozoum fuscum0.0070.1170.027−0.014−0.237−0.097
Acanthosphaera actinota−0.0620.089−0.0940.059−0.1000.055
Astrosphaera hexagonalis−0.0280.0650.136−0.058−0.291−0.191
Hexacontium armatum-hostile0.0510.164−0.0150.066−0.318*−0.272
Didymocyrtis tetrathalamus0.1020.2900.226−0.290−0.158−0.070
Amphirhopalum ypsilon−0.0580.036−0.0870.0540.019−0.066
Euchitonia elegans0.1040.0710.1170.032−0.035−0.111
Spongodiscus resurgens0.2610.207−0.094−0.100−0.022−0.119
Arachnocorys circumtexta−0.132−0.200−0.067−0.0280.1170.195
Callimitra sociliatorchia0.030−0.123−0.131−0.0180.1780.061
Lophospyris pentagona pentagone−0.0260.0610.100*−0.0450.045*0.062
Lophophaena dodecantha−0.0660.0990.360−0.063−0.309−0.163
Anthocyrtidium cineraria−0.308*0.154−0.098−0.196−0.050−0.049
Pterocanium pretextum−0.0290.054−0.109−0.0600.081−0.103
Eucytidium hexastichum−0.0130.2850.171−0.123−0.056−0.275
Eucecryphalus gegenbauri−0.0800.043−0.158−0.077−0.0430.207
Figure in bold italics are for those combinations significant at the * p < 0.05 and ** p <0.01 level.
Table 7. Geographical records of newly identified taxa from other ocean basins.
ClassTaxaWorldwide Distribution RecordsReferences
Acantharia
Acanthochiasma fusiformeMediterranean Sea, Atlantic and Pacific Ocean[54]
Acanthostaurus conacanthusSouth Atlantic Ocean[54]
Trizona brandtiMediterranean Sea, the Red Sea, the English Channel and the West Pacific Ocean[38]
Dictyacantha tabulatePacific Ocean[38]
Amphibelone anomalaEast China Sea, Australia[38,55]
Amphilonche concretaMediterranean Sea, Atlantic and Pacific Ocean[38]
Diploconus cylindrusNorth Atlantic Ocean, Pacific Ocean[14,38]
Diploconus facesNorth Pacific Ocean, southward Pacific, Atlantic and Indian Ocean[1]
Taxopodida
Sticholonche zancleaEast China Sea; Mediterranean Sea[56,57]
CollodariaSolenosphaera zanguebaricaAtlantic, Pacific Ocean, eastern Indian Ocean, China Sea[25,58]
Collosphaera huxleyiAtlantic, Pacific Ocean[25,58]
Collosphaera macroporaChina Sea[25,58]
Collosphaera tuberosaChina Sea[25,58]
Siphonosphaera polysiphoniaPacific, Atlantic Ocean[25,58]
Siphonosphaera socialisGulf of California, Atlantic Ocean[39]
Siphonosphera magnispheraAtlantic Ocean[39]
Sphaerozoum punctatumGulf of California; Southern Indian Ocean[27]
Sphaerozoum cf. ovodimareMediterranean Sea, Naples, Messina, Atlantic, Canary Islands, Cape Verde Islands, West Coast of Africa[59]
Sphaerozoum fuscumEast China Sea[60]
Collozoum inermeNorthern Norwegian Sea, the South Atlantic Ocean[59]
Thalassoxanthium cervicorneAtlantic Ocean[14]
Thalassoxanthium octocerasMadagascar, Rabbe Island, Indian Ocean[38]
PhaeodariaAularia ternariaNorth Pacific Ocean, south Atlantic and Pacific Ocean[39]
Aulacantha scolymanthaPacific, Atlantic, Indian and Mediterranean Sea[14,61]
Auloceros arborescens subelegensAtlantic and Arctic Ocean[14]
Coelodendrum ramosissimumChina Sea, Eastern Mediterranean Sea[58]
Castanella longispiniumSouth Atlantic Ocean, Gulf of Oman[62]
Conchopsis compressaNorth Pacific (Japan and San Francisco), South Pacific Ocean[14]
Conchellium capsulaAtlantic Ocean and Pacific Ocean[14]
Conchidium caudatumAtlantic Ocean[14]
Challengeron radiansPacific, Atlantic Ocean and Japan Sea[39]
Pharyngella gastrulaPacific and Atlantic Ocean[39]
SpumellariaAcanthosphaera dodecastylaAtlantic[39]
Acanthosphaera pinchudaEquatorial Pacific Ocean[13]
Actinosphaera capillaceaPacific and Atlantic Ocean; East China Sea[21,39]
Astrosphaera hexagonalisPacific and Atlantic Ocean[39]
Centrocubus cladostylusGulf of California, Pacific Ocean[1]
Cladococcus scopariusCentral Pacific Ocean[38]
Cyrtidosphaera reticulataJapan[63]
Spongurus pylomaticusGulf of California[64]
Streblacantha circumtextaArctic Sea, Nordic Sea; North Atlantic Ocean[16,65]
NassellariaArchibursa tripodiscusCentral Pacific Ocean[38]
Callimitra solocicribrataCentral Pacific Ocean[38]
Cephalospyris cancellataCentral Pacific Ocean[38]
Cladoscenium limbatumNordic Seas[39]
Conarachnium parabolicumPacific and Atlantic Ocean[39]
Dictyocodon palladiusCentral Pacific Ocean[59]
Eucecryphalus clinatusGulf of California[39]
Lampromitra schultzeiPacific and Atlantic Ocean[14,39]
Litharachnium tentoriumMediterranean Sea[38]
Pterocanium korotneviCentral Equatorial Pacific Ocean[1]
Pteroscenium pinnatumPacific and Atlantic Ocean[13,38]
Pseudodictyophimus gracilipesArctic Ocean; Gulf of California; Nordic Sea; North Atlantic; North Pacific Ocean[63,64]
Phormacantha hystrixArctic Ocean, Gulf of California, Nordic Sea[64,65]
Stichopilium bicorneGulf of California,[64]
Tetraplecta pinigeraCentral Pacific Ocean[38]
Theocorys venerisPacific and Atlantic Ocean[39]
Publisher’s Note: MDPI stays neutral with regard to jurisdictional claims in published maps and institutional affiliations.