Abstract
Understanding the soil and hydrologic processes in agricultural watersheds are vital for reliable assessments of water quantity and quality to support integrated river basin management. However, deriving hydrology-relevant information is complicated in flat data-scarce agricultural watersheds due to constraints in watershed delineation, flat topography, poor natural drainage, and irregular irrigation schedules by human intervention. The study aimed to improve the applicability of the Soil and Water Assessment Tool (SWAT) model to simulate daily flow and NO3 concentrations in a flat data-scarce agricultural watershed in the Lower Seyhan Plain (LSP) in Turkey. Refined digitized stream networks, discharge data derived from fully equipped gauging stations, and satellite data (Landsat 7 ETM+, Aster GDEM, etc.) had to be integrated into the modeling process to improve the simulation quality. The model was calibrated using a 2-year (2011–2012) dataset of streamflow and NO3 using the Sequential Uncertainty Fitting (SUFI-2) approach and validated from 2013 to 2018. Daily water yields were predicted with a reasonable simulation accuracy (E values ranging from 0.53 to 0.82 and percent bias (PBIAS) from 0 to +4.1). The results proved that integrating redefined stream networks to SWAT within a Geographic Information System (GIS) environment increases the simulation capability of flow and nitrate dynamics efficiently. Automated delineation of these networks and sub-basins at low topographic transitions limits the SWAT accuracy.
1. Introduction
Mesoscale hydrological models can be useful tools to answer land use and water management related questions in agricultural regions worldwide, mostly with mountainous and hilly topography [1]. However, the application of hydrological models in flat agricultural watersheds is still challenging due to anthropogenic disturbance of drainage systems (e.g., alteration of irrigation water, hydroelectricity) and plain topography. Drainage network extraction from the digital elevation model (DEM) is the critical input for delineating the number of sub-units, which affects the spatial variability of the datasets and the simulated spatial distribution of processes in the entire watershed [2]. Using the stream networks derived from the DEM in automated delineation procedures in hydraulic-hydrological models can lead to inaccuracies in low-relief regions [3,4,5]. These inaccuracies are mainly caused by utilizing the DEMs with a low resolution, which are usually free. DEMs with higher resolution (Light Detection and Ranging (LIDAR), IKONOS stereo images, etc.) could provide more accurate and precise elevation information; however, they are mostly expensive. Commonly used low resolution DEMs (i.e., Shuttle Radar Topography Mission (SRTM)) might ignore detailed topographical information and affect the water flows with minimal elevation gradients in these regions [6]. This is especially true for the Soil and Water Assessment Tool (SWAT); [7], which has not been frequently applied to coastal agricultural plains. Schmalz et al. [8] tested the capability of using SWAT in the flat lowland catchments of northern Germany with low hydraulic gradients. They found that topography was one of the most critical inputs for parameterization directly affecting the model behavior.
Habeck et al. [9] simulated the nitrogen flows well in the Nuthe low land catchment in northeastern Germany. They used the Soil and Water Integrated Model (SWIM) [10], which is based on SWAT and MATSALU [11] and uses a similar spatial disaggregation scheme like SWAT (basin—subbasins—hydrotopes). Water flows, vegetation growth, and nutrient cycling processes are calculated for each hydrotope (or Hydrological Response Unit (HRU) in SWAT) and then aggregated at the subbasin level, from where lateral flows of water and nutrients are routed to the basin outlet [12].
In conceptual semi-distributed hydrologic models such as SWAT, a sound structuring of watersheds into smaller units representing heterogeneity and topography of the region is essential for achieving accuracy [13]. Khafaji and Sweiti [14] assessed the complemental interactive effects of topography using DEM and land cover on the estimated runoff using SWAT in three watersheds in Iraq. They concluded that the watershed delineation and stream networks are profoundly affected by the DEM’s quality, particularly in flat watersheds with a limited slope and low gradients variance. Digitized stream networks derived by a stream burning method to artificially lower and fit the relief data along the existing channels in the catchment can account for this problem recently [15]. This technique can increase the accuracy of representing the input channels in the model—in case the stream networks may not be consistent with the DEM due to the flat topography of the study area [3].
Data scarcity is another problem in hydrological modeling [16]. The shortage of monitoring data generally limits the calibration of the model parameters, which are typically adjusted against observed time series values [17,18,19,20]. This is particularly challenging in Turkey, where gauging stations are sparse in agricultural watersheds, discharge measurements are limited, and the quality of measured data is generally low [20,21]. Although setting up well-equipped gauging stations is expensive, it is essential to modelling to gain hourly or daily discharge data in data-scarce watersheds [22,23].
The study investigates the suitability of SWAT to simulate daily flow and NO3 concentrations in a flat, data-scarce agricultural watershed in the Lower Seyhan Plain (LSP) located in the Eastern Mediterranean part of Turkey. By redefining digitized stream networks, using discharge data derived from fully equipped gauging stations, and integrating Landsat 7 ETM+, Aster GDEM satellite images into the modeling procedure, we show how to overcome data scarcity and the problems caused by the flat topography of the study region. We tested how far the use of the redefined digitized stream networks and the additional data would improve the model’s capability to simulate the water flows, which would be essential to recommend best management practices for sustainable water use. Moreover, the changes in the NO3 cycle were simulated to check if the model can represent both the spatial distribution of nutrient concentrations and the number of days with nitrate and water stress that affect plant growth. The study shows ways to improve the applicability of SWAT and similar models in flat data-scarce agricultural regions in the Mediterranean to predict flows and nutrient loads. It contributes to integrated river basin management in such areas.
2. Materials and Methods
2.1. Study Area
The LSP is located at the Eastern Mediterranean coast of Turkey. It covers 2132 km2, with elevations ranging from 0 to 23 m. Around 81% of the entire basin area is irrigated. Open irrigation systems and drainage infrastructures are managed by the State Hydraulic Works (DSI) of Turkey. Mediterranean climate dominates the region with an annual total of 730 mm precipitation and a mean annual temperature of 30 ℃ for summer and 7 ℃ for winter. Due to the privileged climate and fertile soils, LSP is one of Turkey’s most productive agricultural areas, providing approximately 10% of the total agricultural production. Large-scale irrigated agriculture extends throughout the lower delta, where maize, citrus fruit, cotton, wheat, and vegetables are cultivated and exported to the European Union, Russia, and other neighboring countries. These crops depend on water provision supplied by reservoirs that store the runoff of winter, rain, and snow in the upper mountainous areas.
The Seyhan Dam supplies irrigation water to the LSP through a two-conveyance canal and the Seyhan River. The flow downstream of the diversion dam is used as one of the main sources for irrigation and is deficient. This water deficiency will be increased according to the rising demand to maintain the river ecosystem in the future [24]. Besides, the impacts of fertilizer load on salinity, water pollution, and other environmental issues are still unclear, especially on the Ramsar wetlands, including Akyatan and Agyatan Lagoons of Cukurova Delta along the coastal belt of LSP. A Ramsar site is a wetland site designated to be of international importance under the Ramsar Convention. Thus, the LSP represents an ideal testbed for examining the capability of the SWAT model to simulate hydrology and water quality in such a complex agricultural plain. Figure 1 shows both the location of the LSP and the gauging stations used in the study.
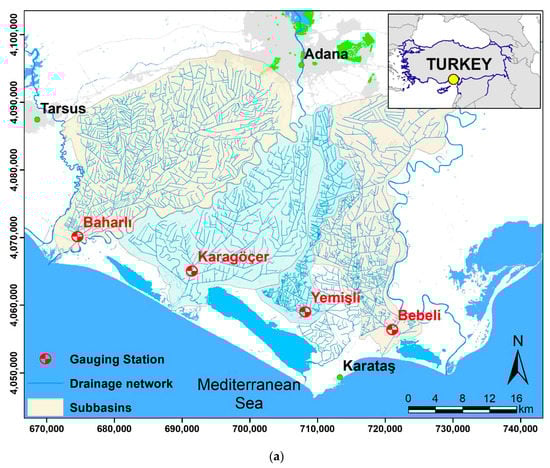
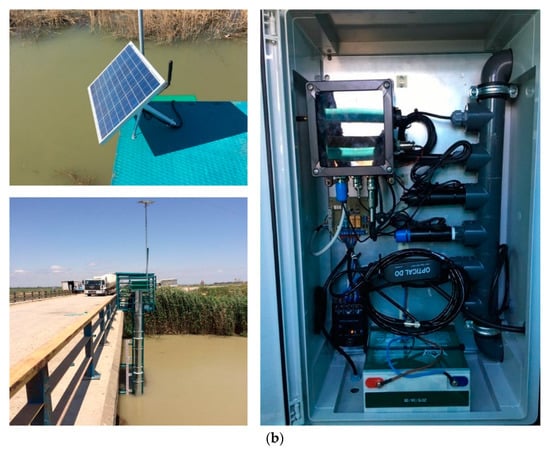
Figure 1.
Location of the Lower Seyhan Plain (a) and the gauging stations used in the study (b).
There are four main discharges of the drainage networks of the LSP (three to the Mediterranean Ocean, one to Akyatan Lagoon). We set up four real-time stream gauging stations (funded by the Turkish Scientific and Research Council (TUBITAK), Project No: 115Y063) at these locations to accurately measure the accumulated drainage flow from the entire study region. Each station included a Limnigraph and a multi-parameter device that measured Electrical Conductivity (EC), temperature, Total Dissolved Soils (TDS), Turbidity, Dissolved Oxygen, pH, and Nitrate on an hourly basis. A data logger on the station transferred the measured data to the server in our Remote Sensing and Geographic Information System laboratory at Cukurova University via data modem and General Packet Radio Service (GPRS). A separate concrete and steel construction platform was built for the Yemisli station (at Akyatan Lagoon) to cover all of the water inlets to the lagoon, while other stations were built on fixed structures such as bridges. The water level is measured by the radar system instead of a limnigraph at Bebeli station since the drainage channel in this area consists of mud after 2–3 m depth; this increased the station cost.
2.2. Model Description
SWAT is a process-based hydrological model that runs on a daily time step to simulate the impact of agricultural management practices on water, sediment, plant growth, nutrient cycling, and agricultural chemical yields at the catchment scale [7]. It has been applied to different sizes and scales of watersheds worldwide [25,26,27].
The model subdivides a watershed into sub-basins based on topography, which are connected to stream networks. Sub-basins are further partitioned to HRUs, which are heterogeneous land units with land cover, soils, slope, and aspect. The simulation outputs, including soil water content, surface runoff, nutrient cycling, and management practices, are estimated on an HRU basis. Weighted averages are applied to aggregate the results for the sub-basins.
The hydrological cycle is simulated in two major sections as land and routing phases. Runoff, erosion evapotranspiration, nutrient, and soil-water processes are simulated in the land phase. The routing phase can define the water movement through the channel network to the outlet [28]. Surface runoff from daily precipitation is estimated by the Soil Conservation Service Curve Number method (SCS-CN) [29]. Evapotranspiration was calculated using the Penman–Monteith method. Outflow from a channel is adjusted for transmission losses and return flow [7,28]. Stream networks, as model inputs, have critical importance in the SWAT modeling process. A command structure is used for routing runoff through streams and inputting measuring data on point sources. In this case, the model can simulate the discharge in the study basin by subdividing it into sub-watersheds based on these stream networks [30,31,32,33].
2.2.1. Model Inputs
Figure 2 and Table 1 provide an overview of the full range of spatial and temporal datasets that have been used as model input. Hydrological Response Units (HRUs) were derived independently by overlapping slope, soil, and land use/land cover (LULC) in quantum GIS and integrated into the modeling (see Figure 2). Spatial inputs of the model were derived using the free and open source Geographic Information System quantum GIS (QGIS).
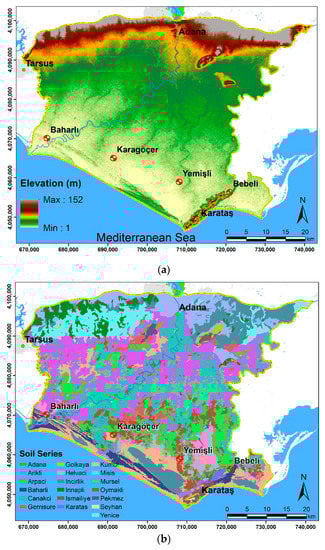
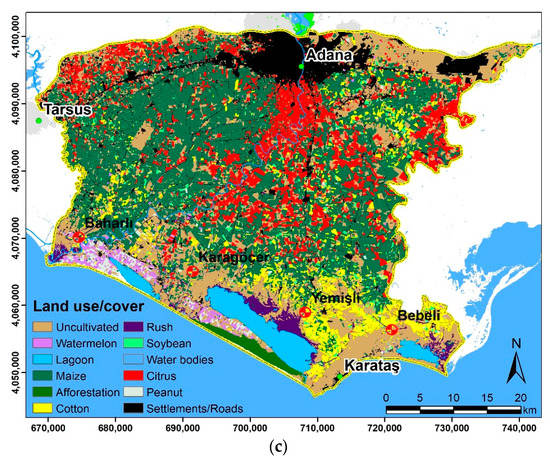
Figure 2.
Input dataset used in the Soil and Water Assessment Tool (SWAT) model, including; (a) digital elevation model (DEM), (b) soil series, (c) land use/land cover (LULC).

Table 1.
Spatial and temporal datasets used in the study.
For each sub-basin, a monthly observed flow point source dataset was also used. The Water Use Associations provided management operation data for the various crops in the study area for each crop (e.g., corn, citrus, wheat, soybean, peanut, vegetables) and added them into the database. The management operations included planting, harvest, irrigation, fertilizer and pesticide applications, and tillage operations.
2.2.2. Data Adjustments, Model Parametrization, and Setup
Ancillary Data
Ancillary data used for model parameterization in the study comprised LULC data and soil information. SWAT already includes an extensive default database that we adjusted using four data sources: Landsat 7 ETM+ images, topographic maps, State Hydraulic Works land cover records, and ground data from field surveys. LULC maps were derived seasonally using six Landsat 7 ETM+ images acquired in June, July, and August 2016 (summer) and December, January, and February 2016 (winter). These images were selected according to the harvest, sowing, and tillering periods of the crop plants and geometrically corrected to the Universal Transverse Mercator (UTM) coordinate system and WGS 84 datum. An object-oriented classification was used to derive seasonal LULC maps for winter and summer. The images were segmented at the first step of LULC classification and processed using the nearest neighbor technique as corn, cotton, grassland, forest, and settlements and used in the model. Corn covered 35% of the LSP, where cotton was planted on 30% of the area.
Besides the LULC information, an extensive and detailed soil database was used in the study; a 1:250.000 scaled soil map was provided by our project (no: 115Y063) supported by the Turkish Scientific and Research Council (TUBITAK). The shapefile was converted to a raster format (30 m resolution) in a GIS environment. Thirteen soil series were defined, and model parameters were included as depth, pH, water holding capacity, total porosity, sand, clay and silt percentages, hydraulic permeability coefficient, organic matter amount, and electrical conductivity. The definition of the soil parameters was supported and proven by field campaigns within our TUBITAK project (no: 115Y063).
Drainage Networks
During the model setup, numerous problems occurred due to the flat topography of the LSP. The elevation of the terrain ranges from 0 to 40 m, maximum slopes are only 5%. The pre-processing procedure in SWAT utilizes the DEM data to delineate the sub-basins, which is problematic in such flat regions as the LSP. For instance, the delineated sub-basins and stream networks did not represent the real conditions since the flat terrain also caused weak and inconsistent (delineated) stream networks. The SWAT pre-processing procedure offers to burn in streams in its standard settings. However, our attempts to derive these networks using SWAT were unsuccessful. The drainage networks mostly cause this failure to settle in contrary to slope direction and their disconnected branches. Thus, SWAT was unable to derive these networks satisfactorily due to their inconsistent flow direction (see also next subsection on sub-basin delineation). Hence, these networks were externally derived (see Figure 3) and included in the modelling process.
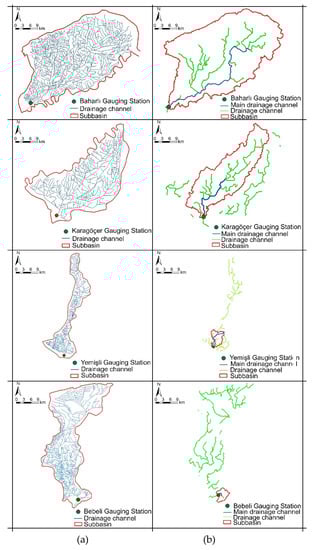
Figure 3.
Delineated subbasins using (a) external stream burning method, (b) default SWAT settings.
Moreover, the amount of water supplied daily to the channels was included in the model system as point sources. The State Hydraulic Works provided these point source data. The plant management database was also updated with current data from the field to define the crop-specific agricultural management practices in SWAT.
Sub-Basin Delineation
In the first step of the SWAT pre-processing procedure, the LSP was divided into four sub-basins (Baharli, Karagocer, Yemisli, Bebeli). We used the gauging stations on the stream network as main outlets of divided sub-basins. Four gauging stations set up for the study were used as outlets; sub-basins were delineated in a GIS environment and introduced into the model along with sub-basins. Furthermore, stream networks were delineated using default stream burning in SWAT. However, the sub-basins were not successfully derived since the stream networks were mostly disconnected. As previously mentioned, externally derived drainage networks were used, and the subbasins were then properly delineated using stream burning (Figure 3).
The coverage of the sub-basins delineated in the study ranged between 12,945 ha (Yemisli) and 61,439 ha (Baharli). The main channel of these sub-basins discharges directly into the Mediterranean Sea. They are fed by the return irrigation flow from agricultural lands. Gauging stations as the main outlets of each basin were installed on the bridges over the drainage networks.
Hydrological Response Units
HRUs were delineated for each sub-basin by overlapping spatial inputs as LULC, soil, geology, and topography. Each class layer was reclassified to derive different classes of hydrological significance. The total number of HRUs was reduced by eliminating units with redundant information to increase the model performance’s efficiency. HRU definition included minimum area thresholds (50 ha) for the LULC, soil, and slope to eliminate negligible areas and helped to reduce the total number of HRUs to increase the computational efficiency of the model simulations. The minimum threshold for HRU delineation was defined as 50 ha. Overall, 125 HRU for Baharli, 102 for Karagocer, 83 for Yemisli, and 107 for Bebeli sub-basins were delineated.
Time Series and Management Data
Meteorological data used in the study comprised precipitation (mm), minimum, mean, maximum temperature (℃), wind speed (m/s), net radiation (MJ/m2/day), and humidity (%). These data were derived from 5 climate stations in the LSP, including Adana (no: 17351), Karatas (no: 17981), Karaisalı (no: 17936), Ceyhan (no: 17960), Yumurtalik (no: 17979), and Seyhan (no: 17352), and was imported into SWAT.
Management data included plant sowing time, irrigation frequency and type, fertilization amount and type, soil tillage frequency considering the crop rotations [22,34]. The required information for each crop was obtained from the Turkish Ministry of Food and Agriculture database. Data on crop management included irrigation, pesticide, harvest, tillage, annual grazing operations in plant growing, and harvesting seasons. Special attention was given to citrus production that covers over 50% of the LSP. The fertilizer amount for each Citrus tree was defined as 10 kg/per tree in October and November (Sari 2018).
After setting up the spatial and time-series inputs, the model was set up and run in three main steps; (i) model simulations with default parameters, (ii) model calibration, and (iii) model simulations with improved parameters for the entire basin. The SWAT model was run monthly for six years from 2011 to 2018 with a two-year-warm-up period to minimize possible simulation and initialization problems. Streamflow and nutrient calibration was carried out from 2011 to 2012. The model was then validated for 2013 to 2018 using the data obtained from the gauging stations for each sub-basin.
2.2.3. Model Calibration and Sensitivity Analysis
The program SWAT-CUP (SWAT Calibration and Uncertainty Procedures; [35]) was used for calibration, validation, and uncertainty analysis of the model. From the four approaches SWAT-CUP offers, we used the acknowledged and robust SUFI-2 routine [28,35,36] for model calibration and uncertainty analysis of each ensemble member. In SUFI-2, a multivariate uniform distribution in a parameter hypercube was used to describe parameter uncertainty. The cumulative distribution of the outputs variables was used to derive model uncertainty of model outputs (Abbaspour et al. 2007; Strauch et al. 2012). Global and temporal sensitivity analyses were applied to define the most and least sensitive parameters within the broad parameter set. Parameters higher than a p-value of t-stat were specified. In the first step of the calibration and sensitivity procedure, an objective function is defined, and a summation form of the squared error was selected in Equation (1):
where yt and ft are the daily observed and simulated flow. These variables are divided into two subsets by the threshold of 2 m3 s−1. This threshold represents the mean streamflow during the calibration. If the yt is lower than it, yt and ft are belonging to subset ytlow, ftlow, otherwise high. The standard deviation of the lower (qlow) and higher (qhigh) was used as weights to prevent missing base flow in optimization [28]. In SUFI-2, the spread of uncertainties in the parameter ranges expresses the model output variables with 95% (95 PPU) probability distribution. It utilized Latin hypercube sampling with several iterations. For each iteration, SUFI-2 aims to achieve the reasonable values of P (the percentage of observed data surrounded by 95 PPU) and R (the thickness of the 95 PPU envelope) factors for the most accurate results.
Flow and NO3 parameter sets were selected in the SWAT-CUP calibration procedure, and the model was initially run 500 times. In the global sensitivity analysis, the number of parameters was decreased to increase the calibration efficiency. While determining the parameters sensitive to these changes, the difference between the t-stat value (the coefficient divided by the standard error of a parameter) and the P-value (testing whether each parameter coefficient is equal to zero) was considered. The outputs of the global sensitivity analysis applied in the study for flow and NO3 are given in Figure 4 and Figure 5.
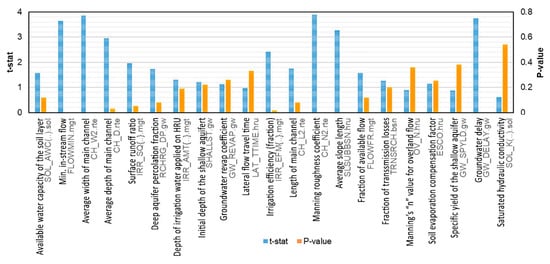
Figure 4.
Streamflow global sensitivity analysis results.
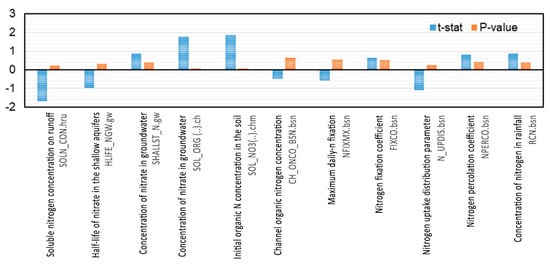
Figure 5.
Nitrate data (NO3_out) global sensitivity analysis results.
The global analysis identified the channel parameters (channel width, length, and depth) as most sensitive and the HRU parameters as least sensitive for the flow-related parameter. As a result of these analyses, 35 sensitive parameters were set for flow data, while 11 parameters were set for NO3. Moreover, SWAT-CUP was run separately for each parameter, and the sensitive parameters were determined by temporal precision (Figure 6). The calibration procedure was carried out five times for each parameter, where the most sensitive ones were determined. The main reason for the sensitivity of SWAT to the channel parameters was the region’s flat topography.
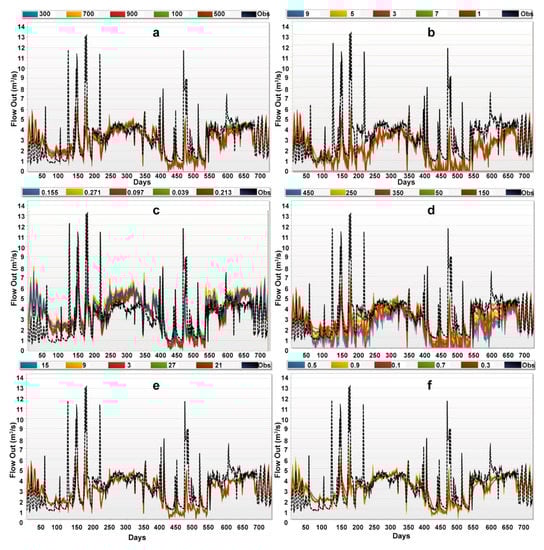
Figure 6.
Temporal sensitivity analysis results for selected parameters: (a) Channel width (CH_W2), (b) Channel Length (CH_L2), (c) Channel Manning “n” value (CH_N2), (d) Baseline Flow Alpha Factor (ALPHA_BNK), and (e) Channel depth (CH_D.rte), (f) Average slope of the main channel (CH_S2).
Model performance was evaluated by using standard criteria suggested by Moriasi et al. [37] and Cakir et al. [38], i.e., r2 (Equation (2)), E (Equation (3)), percent bias (PBIAS) (Equation (4)) were used as the objective functions in model performance evaluation.
r2: The coefficient of determination [39].
E: Nash-Sutcliffe coefficient (Nash Sutcliffe, 1970).
PBIAS [40].
where Qo Qm = mean observed discharge, Qm = modeled discharge, Qt = discharge at time t. Since only one technique might cause misleading results, all those functions were used for the performance evaluation of the model [41].
3. Results
This study intended to improve the SWAT model’s performance in a flat Mediterranean agricultural basin by introducing the digitized stream network input, Landsat 7 ETM+ satellite images, and involving gauging data from the stations set up for this research. The model was first run in daily time steps using default parameter conditions for each sub-basin and nutrients, runoff, actual evapotranspiration (ET), and water stress. The model was then calibrated in a proxy sub-basin in the LSP and validated within the entire basin.
3.1. Model Runs Using Default Parameter Conditions
Using the default parameters has led to the prediction of excessive or insufficient fertilization according to the changes in plant nitrogen and phosphorus stress days. In this regard, a particular effort was put into the model setup to indicate mean annual stress days, including water, temperature, nitrogen, and phosphorus, for four sub-basins in the study area (Table 2). The average number of nutrient and water stress days per year is crucial since it directly affects plants’ growth.
Table 2.
Mean annual stress days in the four sub-basins of the Lower Seyhan Plain (LSP).
Model simulations indicated that nitrogen and water stress days were relatively high in four sub-basins. The reason for high nitrogen and water stress days can be referred to as the dates of sowing and the variation of the harvesting dates. Additionally, the predominant clay soils in the study region limited the infiltration of irrigation water provided by rain and drainage channels. Table 3 shows the total annual amount of the hydrological variables of the sub-basins in the LSP.
Table 3.
Total annual amount of the hydrological variables of the sub-basins in the LSP.
The simulated amount of water passing from the soil to the shallow and deep aquifers was limited. Discharge from groundwater to the stream was also low due to the impermeability and porosity structure of the clay soil. Annual total surface runoff was estimated between 244 to 374 mm, and surface runoff and precipitation ratio ranged from 30% to 45%, which can be considered reasonable for a Mediterranean region [22]. The total water yield was estimated as 513 mm for Yemisli sub-basin, whereas the highest runoff was estimated in the Karagocer sub-basin. Monthly water distributions of the sub-basins are given in Figure 7.
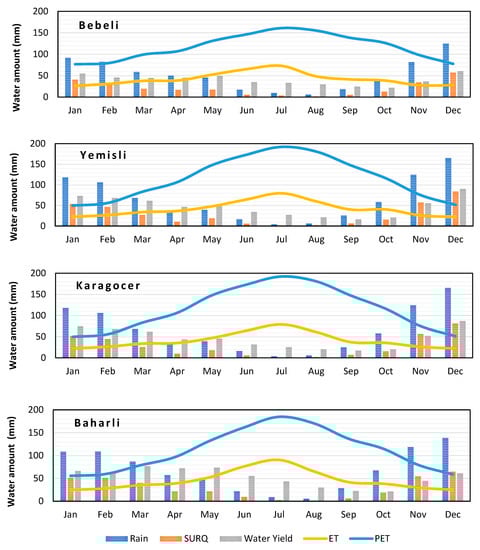
Figure 7.
Monthly distributions of water amount in the sub-basins (SURQ: Surface runoff, ET: Actual Evapotranspiration, PET: Potential Evapotranspiration).
Evaporation and humidity reached their highest levels in the summer and the lowest in the winter. The surface flow depended on rain and irrigation water, which were at the lowest in summer and highest in winter. The surface runoff in summer was mostly due to irrigation contribution to the hydrological system. The impermeability of the clay soil led to an increase in the amount of evaporation and surface runoff. In addition to these hydrological dynamics, NO3, nitrogen, and phosphorus of the sub-basins were also simulated (Table 4).
Table 4.
Simulated mean annual amounts of nutrients for the sub-basins of the LSP.
Seasonal crop patterns were derived using Sentinel-2 data and the records of the Water Use Associations (WUAs) of the region. During the calibration step, fertilization and irrigation parameters, which significantly affect streamflow and nitrate, were derived from farmer’s questionaries. Accordingly, it was defined that the crops used approximately half of the nitrogen for the sub-basins. Therefore, the simulated nitrogen and NO3 days were high, while phosphorus stress days were optimum. About half of the used nitrogenous fertilizers were lost due to denitrification. Most of them were accumulated in the soil or drainage system. Therefore, the solubility of nitrogen in the surface stream was relatively high. Simulations showed that the amount of NO3, nitrogen, and phosphorus in the soil was relatively high compared to the initial amounts. These issues indicated an over-fertilization in the sub-basins.
3.1.1. Model Calibration
For the model calibration, a proxy basin was selected by referring to the LSP’s physical conditions. Then, calibration was performed in Bebeli sub-basin as a proxy area bordered by the Berdan and Seyhan Rivers and located at the western part of the LSP. Bebeli sub-basin was selected as a test area since it represented the common crops and water regime of the entire basin. The validation process was applied for the four sub-basins using the parameter set obtained from the calibration study in Bebeli. Calibration and validation processes were applied using gauging station records derived from the stations constructed for each sub-basin. The calibration procedure (period 2011 to 2012) has been carried out for the left bank irrigation, water, and NO3 budget of the LSP.
The SWAT-CUP calibration module was run 12 times to achieve the best value range for 35 parameters, and 800 simulations were performed for each run after determining the temporal parameters for the calibration of the flow. The most accurate result was derived in run 8. Then, these 35 parameters were used in the modeling and validation for the whole basin. The results for the E value was 0.44, and the r2 value was 0.47. The relatively low values are caused by the flat topography’s influence and the complex drainage network of the study region.
The drainage networks supply water from Seyhan and Catalan dams from April to November. These frequent water inlets were defined as point sources in the model and had a significant effect (30%) on the simulated flow data. Moreover, the previously described additional information on soils, routing, groundwater, HRUs, and management parameters were also used for the calibration studies. The additional information gained for the test area was used in the validation process for the entire basin.
After determining 46 parameters (11 for NO3 data, 35 for flow data), the SWAT-CUP was run 15 times to derive the optimal ranges for these parameters. Nine hundred simulations were performed for each run. The most accurate result was achieved in run 15 with an E value of 0.45 and an r2 value of 0.46.
A comparison of the observed, uncalibrated, and validated flow and NO3 outputs are given in Figure 8 and Figure 9.
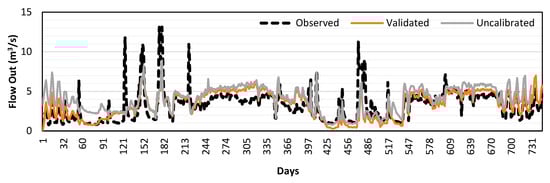
Figure 8.
Comparison of the observed, uncalibrated, and validated flow outputs.
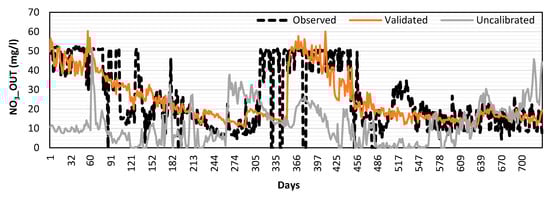
Figure 9.
Comparison of the observed, uncalibrated, and validated NO3 outputs.
The calibration process improved the accuracy of the model simulations compared to the uncalibrated results, as shown with the nitrate simulations in the Bebeli sub-basin (improvement of the coefficient of determination r2 from 0.48 to 0.85, where E was increased from −0.18 to 0.82). A similar performance was achieved for other sub-basins as well: In Yemisli, E was increased from −0.44 to 0.72. In Karagocer, r2 was improved from 0.10 to 0.61, which is reasonable for a flat agricultural basin, according to Kapur et al. [42]. Therefore, the model responded to the complex conditions of the LSP well and provided a meaningful and reasonable trend of the flow and NO3 distribution [42,43,44].
Water
Calibrations were carried out in 2017, and validation was performed for Baharli by using the parameter ranges obtained from the Karagocer station. Numerous simulations showed a high sensitivity of groundwater and streamflow routing parameters. Selected flow parameters used in the model are shown in Table 5.
Table 5.
Selected flow (Flow_OUT) parameters used in the model.
E and r2 values were 0.64 and 0.67, respectively, in the 12th run with 800 simulations, and 35 parameters were used for calibration of flow data. These results can be considered reasonable concerning the simulation problems caused by the flat topography and the complex drainage networks of the LSP (Table 6). The LSP shows a high proportion of irrigated agricultural land with a wide range of crop rotations. Irrigation networks were usually supplied from the dams in specific periods, particularly in summer, to support agricultural irrigation. These periodic water inflows defined as a point source in the model significantly affected simulated flow data and considerably improved the simulation quality. The impact of point source data on the system was estimated at approximately 30% [22].
Table 6.
Simulated mean annual hydrological variables of the sub-basins.
A total annual runoff of 348.3 mm was simulated for the Bebeli sub-basin, with a maximum runoff of 515.49 mm for bare grounds and a minimum of 200.35 mm for citrus cultivated lands. The average surface flow of the Karagocer sub-basin was 320.29 mm, with a maximum flow of 465.69 mm and 189.82 mm as the lowest value (for the citrus plantations). According to the model results, Yemisli and Bebeli sub-basin had 486.74 mm and 247.18 mm flow, respectively.
Spatially-distributed flow outputs of the four sub-basins showed that the lowest flow occurred in citrus plantations since they are located in protected areas and watered using drip irrigation, limiting the runoff considerably. In contrast, the highest flow values were simulated on bare grounds due to the absence of vegetation and the soil’s low hydraulic conductivity. In other words, soil porosity and permeability were low, and the water table was high. Thus, more than 50% of the rainwater occurred as surface flow and less than 22% groundwater.
Nutrients
Flow and nitrate (NO3) calibration were performed for each of the four sub-basins of the LSP separately. A total of 46 parameters from the test area runs were used for calibration and validation of the model, which lead to satisfactory results. NO3 concentration in drainage networks or channels increased during the spring months when rainfall was abundant and decreased gradually in summer months. While irrigation of agricultural areas was relatively high in summer, its effect on NO3 concentration was limited. Since the LSP is almost flat, the discharge into the drainage channels was relatively low. However, due to excess fertilization and less permeability of the clayey soils, NO3 remained in the soil and accumulated gradually. More than 25% of the applied fertilizers were denitrified in this way. The simulated NO3 infiltration into the soil was less than 21% of the applied fertilizer. Less NO3 infiltration was referred to a high amount of nitrogen solubility in the surface flow and the evaporation of this flow before penetrating the soil.
Due to the tides occurring at specific periods in Baharli and Karagocer drainage channels, the salinity increased considerably, and NO3 records also increased during these periods. The reason for using flow parameters was to simulate the transport rate of NO3 to water accurately.
The amount of NO3 in the soil increased with fertilizers and is directly related to plant growth and, thus, for agricultural production and management. After simulating the flow of sub-basins, sensitive parameters for calibration of NO3 simulations were also defined. The list of sensitive parameters for nitrate simulations is given in Table 7.
Table 7.
Selected nitrate parameters used in the model.
The most accurate results were derived in Run 15 with an E value of 0.45 and an r2 value of 0.46. The results were satisfactory for each sub-basin (Table 5). The model performance of nitrate simulations in the sub-basins is provided in Table 8 and Figure 10.
Table 8.
Model performance for calibration and validation of the flow and NO3 simulations in the study area.
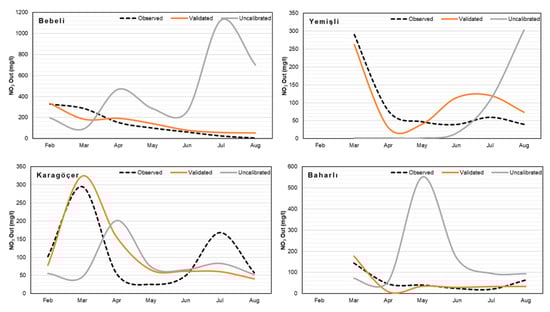
Figure 10.
Calibration of nitrate loads for the sub-basins.
Since we have integrated digitized stream networks into the model, the flow was reasonably estimated even in uncalibrated mode. However, the NO3 showed an overestimation, especially without calibration. This can be explained as the effect of anthropogenic disturbance (over-irrigation) and, therefore, nitrate percolation in the region. The calibration of NO3 seemed reasonable and helpful to improve its simulation results in this case.
The amount of applied fertilizers was high in the areas with extensive agriculture. Most of the applied fertilizers were accumulated in the soil, while some were uptaken by the plants. According to the model outputs, the mean annual NO3 rate in the soil of the Bebeli sub-basin was 1.931 kg N/ha. In this sub-basin, the highest NO3 amount was defined as 17.68 kg/ha as nitrate content in citrus plantations of the Incirlik subregion and whereas the lowest was 0.1 kg N/ha in Arikli. The mean annual total NO3 in the soil of the Karagocer sub-basin was 1,895 kg N/ha, and the NO3 rates ranged from 0.01 to 15.22 kg N/ha. The mean annual total NO3 in Yemisli and Baharli sub-basins are 1.486 kg N/ha and 1.500 kg N/ha, respectively. The NO3 maps of the sub-basins derived from the SWAT simulations are given in Figure 11.
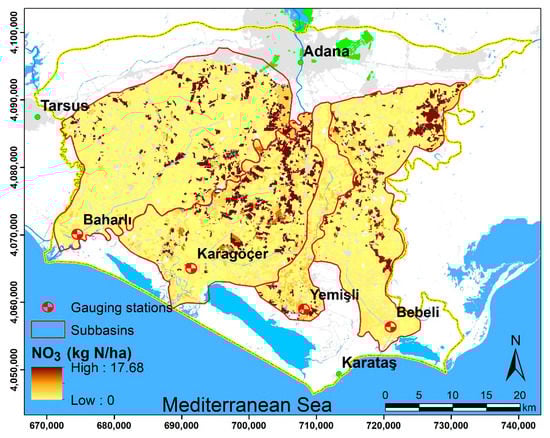
Figure 11.
Nitrate contents map of the soils in the LSB derived from the SWAT simulation.
The amount of NO3 in the soil of the four sub-basins was similar, and a large amount of NO3 applied with agricultural fertilization was accumulated in the soil. This accumulation was mostly due to over-fertilization and the clay soil structure of NO3 leakage to the soil.
The hydraulic conductivity coefficient and organic matter amount were relatively low in soils dominated by clay in the modeling process. In contrast, the water holding capacity of clay soil is high. During calibration, the hydraulic conductivity coefficient of the soil series and the amount of organic matter in the soil were increased by about 50% to increase the amount of lateral flow. In comparison, the water holding capacity of the soil was reduced by 20–30%. As a result, the amount of lateral flow was increased from about two mm to 15–20 mm approximately. The amount of water stored in the shallow aquifer was extended to allow water flow to reach the deeper aquifers.
4. Discussion and Conclusions
In this applied research, the problem of implementing the SWAT model in flat areas with composite irrigation networks, such as in the Mediterranean coastal areas, when high-resolution DEMs are lacking, is investigated. We showed that our suggested procedure of using accurate digitized stream networks and ancillary data could significantly improve the simulation quality of SWAT in a flat data-scarce basin. Our study has shown that a remarkable effort should be given to identify the most sensitive parameters to improve the calibration and validation of the model. Besides, longer-term time series data are of high value to achieve the model performance. The additional use of including field measurements on water quality and quantity, meteorological data, satellite data to define crop rotations, and local soil parameters are needed to enable accurate SWAT simulations on monthly and daily scales in our study area.
One of the most important steps was the calibration stage, carried out in a selected proxy sub-basin (Bebeli sub-basin) of the region. The simulated streamflow and nitrate loads improved in comparison to previous studies in this region with an overall E value of 0.69. Akgul [34] achieved SWAT simulation qualities with 0.56 E, whereas the simulations performed by Sari (2018) show an E of 0.62.
In the study of Sari (2018), the streamflow varied at Bebeli station between 200 to 300 mm annually, which is in the same range as our study (244 mm). Total annual streamflow generation changed between 339 to 375 mm. According to Tanaka et al. [45] this value is reasonable in this study area. Total annual precipitation inputs of our model application ranged from 628 to 804 mm, which are also in an acceptable range as defined in Hoshikawa et al. [46], with 744 mm per year.
During the calibration and validation procedure, many parameter changes had to be carried out to reduce the surface water flow amount and to increase the passage of the water to the drainage channels. The curve coefficient (CN) parameter affecting the surface water flow amount was decreased by 10%. Moreover, the evaporation compensation factor (ESCO) increased by 5% because the CN and ESCO parameters depend on the soil and LULC classes. These two parameters are fundamental since they determine the amount of surface flow. For instance, a high CN value indicated high surface runoff and well-developed soil structure, while the low CN value corresponds to high sub-soil percolation and low surface runoff.
Our results suggest using stream burning to derive digitized stream networks externally and include them in the SWAT modelling process to avoid inconsistencies in sub-basin delineation, which can also be used in similar regions. Basins such as the LSP with flat topographic structure, complex drainage networks, and diverse agricultural activities can cause severe hydrological modelling problems. Our literature review showed that the application of SWAT in those regions is still limited. Therefore, our study suggests methods to improve the applicability in such areas, in our case, also affected by data scarcity.
The LSP drainage network system is human made, unlike the common river network systems. Therefore, the connections of the drainage networks mostly consisted of artificial irrigation systems such as pipes or pump stations. Moreover, the subbasins delineated by SWAT stream burning did not represent the study sites since the model was not correctly able to produce the subbasins due to disconnected drainage networks. Hence, we included externally digitized stream networks to the model to enable precisely delineated sub-basins.
For deriving more precise spatial inputs, the Unmanned Air Vehicles and LIDAR systems might support the field surveys to map channel networks and sub-basin topography. Using these systems can be essential to produce more precise DEM data that can contribute to more accurate hydrological modeling in flat regions.
The sensitivity analyses showed that in our flat semi-arid basin, the most sensitive parameters were related to groundwater, surface runoff, and channel geometry. Since the model was not able to simulate drainage channels or network structure correctly, the most suitable intervals for channel parameters were set after determining the channel width, length, and depth parameters. The average depth of drainage channels is simulated between 10–50 cm.
The model results showed a high fertilization rate in the LSP, and plants used only 60% of the given fertilizer; the remaining part was accumulated in the soil. A high rate of fertilization might threaten the agricultural yield in the region in the next decades due to the degradation of the soils in the model.
It was also observed in the modeling that a small amount of nitrogen accumulated in the soil transferred to main drainage channels. The main reasons are assumed to be flat topography, clay soil structure, structural features of drainage channels, and water mobility. As a result, the calibration and validation graphs showed that the non-calibrated nitrate values were considerably lower than their observed data. The accumulation of NO3 in the soil was ignored in model settings in calibration and validation. In this way, satisfactory results were derived in the validation of the sub-basins.
Soil and fertilizer type, quantity, and agricultural irrigation scheduling varied widely within the plant management database. This complexity may mislead to inaccuracies in model simulations. Irregular crop rotation might also cause an inconsistency in the parameters used during calibration and influence the results. Although the nitrate simulations were considered satisfactory, no point source data were used to model the nitrate loads, causing uncertainties. Understanding the nitrate and water balance of the flat agricultural plains could give us valuable insights into water management decisions and increase awareness for sustainable water resources management. It can be concluded that the SWAT can be a useful and adaptable tool to apply in flat plains of sub-tropical regions to simulate streamflow and NO3 dynamics.
Author Contributions
Conceptualization, C.D. and S.B.; methodology, C.D., S.B., and M.V.; validation, O.S. (Omer Sari); formal analysis, O.S. (Omer Sari) and A.C.; data curation, O.S. (Omer Sari), A.C., and O.S. (Onur Satir); writing—original draft preparation, C.D.; writing—review and editing, C.D., M.V., S.B.; visualization, C.D. and A.C.; supervision, S.B. and M.V.; project administration, S.B. and C.D.; funding acquisition, S.B. All authors have read and agreed to the published version of the manuscript.
Funding
This research was funded by [the Turkish Scientific and Research Council (TUBITAK)] grant number [115Y063] and The APC was funded by [Helmholtz Center for Environmental Research (UFZ), Germany].
Conflicts of Interest
The authors declare no conflict of interest.
References
- Amatya, D.M.; Jha, M.K. Evaluating the SWAT model for a low-gradient forested watershed in coastal South Carolina. Trans. ASABE 2011, 54, 2151–2163. [Google Scholar] [CrossRef]
- Tripathi, M.P.; Raghuwanshi, N.S.; Rao, G.P. Effect of watershed subdivision on simulation of water balance components. Hydrol. Process. 2006, 20, 1137–1156. [Google Scholar] [CrossRef]
- Garbrecht, J.; Ogden, F.L.; DeBarry, P.A.; Maidment, D.R. GIS and distributed watershed models. I: Data coverages and sources. J. Hydrol. Eng. 2001, 6, 506–514. [Google Scholar] [CrossRef]
- Vogt, J.; Soille, P.; Colombo, R.; Paracchini, M.L.; de Jager, A. Development of a pan-European river and catchment database. Lect. Notes Geoinf. Cartogr. 2007, 121–144. [Google Scholar] [CrossRef]
- Reil, A.; Skoulikaris, C.; Alexandridis, T.K.; Roub, R. Evaluation of riverbed representation methods for one-dimensional flood hydraulics model. J. Flood Risk Manag. 2018. [Google Scholar] [CrossRef]
- Maidment, D.R. Arc Hydro: GIS for Water Resources; Environmental Systems Research Institute Inc.: Redlands, CA, USA, 2002; ISBN 1589480341. [Google Scholar]
- Arnold, J.G.; Srinivasan, R.; Muttiah, R.S.; Williams, J.R. Large area hydrologic modeling and assessment part I: Model development. J. Am. Water Resour. Assoc. 1998, 34, 73–89. [Google Scholar] [CrossRef]
- Schmalz, B.; Tavares, F.; Fohrer, N. Modelling hydrological processess in mesoscale lowland river basins with SWAT-Capabilities and challenges. Hydrol. Sci. J. 2008, 53, 989–1000. [Google Scholar] [CrossRef]
- Habeck, A.; Krysanova, V.; Hattermann, F. Integrated analysis of water quality in a mesoscale lowland basin. Adv. Geosci. 2005, 5, 13–17. [Google Scholar] [CrossRef][Green Version]
- Krysanova, V.; Müller-Wohlfeil, D.I.; Becker, A. Development and test of a spatially distributed hydrological/water quality model for mesoscale watersheds. Ecol. Modell. 1998, 106, 261–289. [Google Scholar] [CrossRef]
- Krysanova, V.; Meiner, A.; Roosaare, J.; Vasilyev, A. Simulation modelling of the coastal waters pollution from agricultural watershed. Ecol. Modell. 1989, 49, 7–29. [Google Scholar] [CrossRef]
- Stefanova, A.; Hesse, C.; Krysanova, V.; Volk, M. Assessment of Socio-Economic and Climate Change Impacts on Water Resources in Four European Lagoon Catchments. Environ. Manag. 2019, 64, 701–720. [Google Scholar] [CrossRef]
- Arabi, M.; Govindaraju, R.S.; Hantush, M.M.; Engel, B.A. Role of watershed subdivision on modeling the effectiveness of best management practices with SWAT. J. Am. Water Resour. Assoc. 2006, 42, 513–528. [Google Scholar] [CrossRef]
- Al-Khafaji, M.S.; Al-Sweiti, F.H. Integrated Impact of Digital Elevation Model and Land Cover Resolutions on Simulated Runoff by SWAT Model. Hydrol. Earth Syst. Sci. Discuss. 2017, 1–26. [Google Scholar] [CrossRef]
- Lindsay, J.B. The practice of DEM stream burning revisited. Earth Surf. Process. Landf. 2016, 41, 658–668. [Google Scholar] [CrossRef]
- Amatya, D.M.; Radecki-pawlik, A. Flow Dynamics of Three Experiemental Forested Watersheds in coastal SC. Acta Sci. Pol. Form. Circumiectus 2007, 6, 3–17. [Google Scholar]
- Bárdossy, A. Calibration of hydrological model parameters for ungauged catchments. Hydrol. Earth Syst. Sci. 2007, 11, 703–710. [Google Scholar] [CrossRef]
- Blöschl, G. Rainfall-Runoff Modeling of Ungauged Catchments. In Encyclopedia of Hydrological Sciences; John Wiley & Sons, Ltd.: Chichester, UK, 2005. [Google Scholar]
- Nepal, S.; Flügel, W.A.; Krause, P.; Fink, M.; Fischer, C. Assessment of spatial transferability of process-based hydrological model parameters in two neighbouring catchments in the Himalayan Region. Hydrol. Process. 2017, 31, 2812–2826. [Google Scholar] [CrossRef]
- Donmez, C.; Berberoglu, S. A comparative assessment of catchment runoff generation and forest productivity in a semi-arid environment. Int. J. Digit. Earth 2016, 9, 942–962. [Google Scholar] [CrossRef]
- Cilek, A.; Berberoglu, S. Biotope conservation in a Mediterranean agricultural land by incorporating crop modelling. Ecol. Modell. 2019, 392, 52–66. [Google Scholar] [CrossRef]
- Sari, O. Modelling Hydrologic Dynamics of Lower Seyhan Basin by the Swat Model. Master’s Thesis, Department of Remote Sensing and Geographical Information Systems, Institute of Natural and Applied Sciences, Cukurova University, Adana, Turkey, 2018. [Google Scholar]
- Berberoglu, S.; Polat, S.; Ibrikci, H.; Donmez, C.; Satir, O.; Akin Tanriover, A.; Gultekin, U.; Kapur, B.; Erdogan, M.; Erdogan, N.; et al. Spatial Information Technology based Decision Support System for Seyhan Basin; Turkish Scientific and Research Council (TUBITAK) Project (ID:115Y063); Turkish Scientific and Research Council (TUBITAK): Adana, Turkey, 2019. [Google Scholar]
- Watanabe, T.; Nagano, T.; Kanber, R.; Kapur, S. An Integrated Approach to Climate Change Impact Assessment on Basin Hydrology and Agriculture. In Climate Change Impacts on Basin Agro-Ecosystems; Watanabe, T., Kapur, S., Aydın, M., Kanber, R., Akça, E., Eds.; Springer International Publishing: Cham, Switzerland, 2019; pp. 1–15. ISBN 978-3-030-01036-2. [Google Scholar]
- Guse, B.; Pfannerstill, M.; Strauch, M.; Reusser, D.E.; Lüdtke, S.; Volk, M.; Gupta, H.; Fohrer, N. On characterizing the temporal dominance patterns of model parameters and processes. Hydrol. Process. 2016, 30, 2255–2270. [Google Scholar] [CrossRef]
- Rahman, K.; Maringanti, C.; Beniston, M.; Widmer, F.; Abbaspour, K.; Lehmann, A. Streamflow Modeling in a Highly Managed Mountainous Glacier Watershed Using SWAT: The Upper Rhone River Watershed Case in Switzerland. Water Resour. Manag. 2013, 27, 323–339. [Google Scholar] [CrossRef]
- Zhou, P.; Huang, J.; Pontius, R.G.; Hong, H. New insight into the correlations between land use and water quality in a coastal watershed of China: Does point source pollution weaken it? Sci. Total Environ. 2016, 543, 591–600. [Google Scholar] [CrossRef] [PubMed]
- Strauch, M.; Bernhofer, C.; Koide, S.; Volk, M.; Lorz, C.; Makeschin, F. Using precipitation data ensemble for uncertainty analysis in SWAT streamflow simulation. J. Hydrol. 2012, 414, 413–424. [Google Scholar] [CrossRef]
- USDA Soil Conservation Service. Soil Conservation Service Engineering Division Section 4: Hydrology. In National Engineering Handbook; USDA Soil Conservation Service: Washington, DC, USA,, 1972. [Google Scholar]
- Vaché, K.B.; Eilers, J.M.; Santelmann, M.V. Water quality modeling of alternative agricultural scenarios in the U.S. Corn Belt. J. Am. Water Resour. Assoc. 2002, 38, 773–787. [Google Scholar] [CrossRef]
- Chaplot, V.; Saleh, A.; Jaynes, D.B.; Arnold, J. Predicting water, sediment and NO 3-N loads under scenarios of land-use and management practices in a flat watershed. Water. Air. Soil Pollut. 2004, 154, 271–293. [Google Scholar] [CrossRef]
- Behera, S.; Panda, R.K. Evaluation of management alternatives for an agricultural watershed in a sub-humid subtropical region using a physical process based model. Agric. Ecosyst. Environ. 2006, 113, 62–72. [Google Scholar] [CrossRef]
- Gassman, P.W.; Reyes, M.R.; Green, C.H.; Arnold, J.G. The soil and water assessment tool: Historical development, applications, and future research directions. Trans. ASABE 2007, 50, 1211–1250. [Google Scholar] [CrossRef]
- Akgul, M.A. Modelling Water and Nitrate Budget in Left Bank Irrigation of Lower Seyhan Plain. Master’s Thesis, Department of Remote Sensing and Geographical Information Systems, Institute of Natural and Applied Sciences, Cukurova University, Adana, Turkey, 2015. [Google Scholar]
- Abbaspour, K.C.; Vejdani, M.; Haghighat, S. SWAT-CUP calibration and uncertainty programs for SWAT. In Proceedings of the MODSIM07-Land, Water and Environmental Management: Integrated Systems for Sustainability, Christchurch, New Zealand, 10–13 December 2007; pp. 1596–1602. [Google Scholar]
- Setegn, S.G.; Srinivasan, R.; Melesse, A.M.; Dargahi, B. SWAT model application and prediction uncertainty analysis in the Lake Tana Basin, Ethiopia. Hydrol. Process. 2010, 24, 357–367. [Google Scholar] [CrossRef]
- Moriasi, D.N.; Arnold, J.G.; Van Liew, M.W.; Bingner, R.L.; Harmel, R.D.; Veith, T.L. Model Evaluation Guidelines for Systematic Quantification of Accuracy in Watershed Simulations. Trans. ASABE 2007, 50, 885–900. [Google Scholar] [CrossRef]
- Cakir, R.; Raimonet, M.; Sauvage, S.; Paredes-Arquiola, J.; Grusson, Y.; Roset, L.; Meaurio, M.; Navarro, E.; Sevilla-Callejo, M.; Lechuga-Crespo, J.L.; et al. Hydrological alteration index as an indicator of the calibration complexity ofwater quantity and quality modeling in the context of global change. Water 2020, 12, 115. [Google Scholar] [CrossRef]
- Nagelkerke, N.J.D. A note on a general definition of the coefficient of determination. Biometrika 1991, 78, 691–692. [Google Scholar] [CrossRef]
- Gupta, H.V.; Sorooshian, S.; Yapo, P.O. Status of Automatic Calibration for Hydrologic Models: Comparison with Multilevel Expert Calibration. J. Hydrol. Eng. 1999. [Google Scholar] [CrossRef]
- Tedeschi, L.O. Assessment of the adequacy of mathematical models. Agric. Syst. 2006, 89, 225–247. [Google Scholar] [CrossRef]
- Kapur, B.; Aydın, M.; Yano, T.; Koç, M.; Barutçular, C. Interactive Effects of Elevated CO2 and Climate Change on Wheat Production in the Mediterranean Region. In Climate Change Impacts on Basin Agro-Ecosystems; Watanabe, T., Kapur, S., Aydın, M., Kanber, R., Akça, E., Eds.; Springer International Publishing: Cham, Switzerland, 2019; pp. 245–268. ISBN 978-3-030-01036-2. [Google Scholar]
- Ben-Asher, J.; Yano, T.; Aydın, M.; Garcia y Garcia, A. Enhanced Growth Rate and Reduced Water Demand of Crop Due to Climate Change in the Eastern Mediterranean Region. In Climate Change Impacts on Basin Agro-Ecosystems; Watanabe, T., Kapur, S., Aydın, M., Kanber, R., Akça, E., Eds.; Springer International Publishing: Cham, Switzerland, 2019; pp. 269–293. ISBN 978-3-030-01036-2. [Google Scholar]
- Berberoğlu, S.; Evrendilek, F.; Dönmez, C.; Çilek, A. Estimating Spatio-temporal Responses of Net Primary Productivity to Climate Change Scenarios in the Seyhan Watershed by Integrating Biogeochemical Modelling and Remote Sensing. In Climate Change Impacts on Basin Agro-Ecosystems; Springer: Berlin/Heidelberg, Germany, 2019; pp. 183–199. [Google Scholar]
- Tanaka, K.; Fujihara, Y.; Topaloğlu, F.; Simonovic, S.P.; Kojiri, T. Impacts of Climate Change on Basin Hydrology and the Availability of Water Resources. In Climate Change Impacts on Basin Agro-Ecosystems; Watanabe, T., Kapur, S., Aydın, M., Kanber, R., Akça, E., Eds.; Springer International Publishing: Cham, Switzerland, 2019; pp. 71–97. ISBN 978-3-030-01036-2. [Google Scholar]
- Hoshikawa, K.; Nagano, T.; Kume, T.; Watanabe, T. Evaluation of Impact of Climate Changes in the Lower Seyhan Irrigation Project Area, Turkey. In Climate Change Impacts on Basin Agro-Ecosystems; Watanabe, T., Kapur, S., Aydın, M., Kanber, R., Akça, E., Eds.; Springer International Publishing: Cham, Switzerland, 2019; pp. 99–123. ISBN 978-3-030-01036-2. [Google Scholar]
Publisher’s Note: MDPI stays neutral with regard to jurisdictional claims in published maps and institutional affiliations. |
© 2020 by the authors. Licensee MDPI, Basel, Switzerland. This article is an open access article distributed under the terms and conditions of the Creative Commons Attribution (CC BY) license (http://creativecommons.org/licenses/by/4.0/).