Article

Depression of Groundwater Table and Reduced Nitrogen Application Jointly Regulate the Bacterial Composition of nirS-Type and nirK-Type Genes in Agricultural Soil

1
Farmland Irrigation Research Institute, Chinese Academy of Agricultural Sciences, Xinxiang 453002, China
2
Graduate School of Chinese Academy of Agricultural Sciences, Beijing 100081, China
3
Water Environment Factor Risk Assessment Laboratory of Agricultural Products Quality and Safety, Ministry of Agriculture, Xinxiang 453002, China
4
Agricultural Water Soil Environmental Field Research Station of Xinxiang, Chinese Academy of Agricultural Sciences, Xinxiang 453002, China
5
Key Laboratory of Ecosystem Network Observation and Modeling, Institute of Geographic Sciences and Natural Resources Research, Chinese Academy of Sciences, Beijing 100101, China
*
Author to whom correspondence should be addressed.
Water 2020, 12(12), 3459; https://doi.org/10.3390/w12123459
Submission received: 27 October 2020 / Revised: 1 December 2020 / Accepted: 3 December 2020 / Published: 9 December 2020
(This article belongs to the Section Water, Agriculture and Aquaculture)

Abstract

:
Despite the known influence of nitrogen fertilization and groundwater conditions on soil microbial communities, the effects of their interactions on bacterial composition of denitrifier communities have been rarely quantified. Therefore, a large lysimeter experiment was conducted to examine how and to what extent groundwater table changes and reduced nitrogen application would influence the bacterial composition of nirK-type and nirS-type genes. The bacterial composition of nirK-type and nirS-type genes were compared at two levels of N input and three groundwater table levels. Our results demonstrated that depression of groundwater table, reduced nitrogen application and their interactions would lead to drastic shifts in the bacterial composition of nirS-type and nirK-type genes. Structural equation models (SEMs) indicated that depression of groundwater table and reduced nitrogen application not only directly altered the species composition of denitrifier bacterial communities, but also indirectly influenced them through regulating soil nutrient and salinity. Furthermore, the variation in soil NO3–N and electrical conductivity caused by depression of groundwater table and reduced nitrogen application played the most important role in altering the community composition of denitrifier bacterial communities. Together, our findings provide first-hand evidence that depression of groundwater table and reduced nitrogen application jointly regulate the species composition of denitrifier bacterial communities in agricultural soil. We highlight that local environmental conditions such as groundwater table and soil attributes should be taken into account to enrich our knowledge of the impact of nitrogen fertilization on soil denitrifier bacterial communities, or even biogeochemical cycles.

1. Introduction

Global changes have caused substantial shifts in terrestrial ecosystem structure, processes and functioning via elevated greenhouse gas emissions and extensive nitrogen fertilization. As an essential component of greenhouse gases, nitrous oxide (N2O) has a warming potential almost 300 times larger than that of carbon dioxide [1]. Soil microbes play a crucial role in controlling ecosystem processes and functioning and regulating important biogeochemical cycles, such as nitrogen and carbon cycles [2,3,4]. Denitrification is one of the most crucial stages of the nitrogen (N) cycle which leads to nitrogen (N) losses in ecosystems through nitrogenous gases, including: N2, nitrous oxide (N2O) and nitric oxide (NO) [5]. It is notable that the denitrification process is principally regulated by two key denitrifying bacteria of nirK and nirS genes which can convert NO2–N to NO [6,7]. Agricultural soil, the largest source of N2O, has been widely regarded as the main anthropogenic source of greenhouse gases [8,9]. Therefore, improving knowledge of the fundamental processes shaping the community composition of nirK-type and nirS-type denitrifier communities in agricultural soil can help us better understand the effect of global changes on biogeochemical cycles.
Nitrogen is the most important restrictive factor for the growth of soil microbes, so nitrogen fertilizer application has been widely recognized as a key driving factor causing substantial changes in soil microbial composition in agricultural soil [10,11]. However, in order to increase crop yield, over-application of nitrogen fertilizers has caused a series of severe environmental problems, such as groundwater pollution, soil nitrate contamination and salinization [12,13,14,15,16]. More importantly, nitrogen form release will directly change soil fertility and the salt content of soil and underground water, thereby affecting the growth of soil microorganisms [17,18]. This may cause significant shifts in the community assembly of bacterial denitrifier communities in agricultural soil [8,19]. Nitrogen application can indirectly affect soil microbial composition by regulating soil properties and filed crops [20], or even directly influence soil microbes [11,17,21]. Therefore, over-application of nitrogen fertilizers also may exert profound negative influences on biogeochemical cycles (e.g., greenhouse gas emissions) through altering the abundance and composition of soil denitrifier communities [2,3,4,5,8,15]. It is therefore important to explore the appropriate nitrogen input amount to maintain sustainable agricultural development. In fact, the effect of nitrogen application on soil microbes has been well examined [14,20], but the impact varies greatly [22,23]. In addition, the response of bacterial composition to nitrogen input may differ between nirS and nirK genes [24]. In brief, the associated difference in the response of nirS and nirK genes to reduced nitrogen application still remains largely unclear.
The North China Plain is located in the eastern part of China, which is one of the most vital crop-producing regions of China. However, with the increase of population, the expansion of urban size, and the development of industry and agriculture, groundwater consumption has increased sharply, and a series of environmental geologic problems have occurred such as regional groundwater table fall, water quality worsening, surface subsidence and so on, especially in the North China Plain [25]. Some studies have found that groundwater table also has an important influence on soil microbes [18,20,26]. Groundwater table changes can cause obvious shifts in soil environmental conditions such as O2 supply, salinity, pH and NO3–N [27,28,29], in turn, altering the bacterial community structure of denitrifier communities [26]. For example, some studies have pointed out that groundwater table fluctuations have substantial impacts on the abundance for nirK-type, nirS-type and nosZ-type denitrifier communities [8,26]. Recent studies have examined the impact of groundwater table on soil denitrifier bacterial communities, but the results vary among different studies. Moreover, groundwater conditions and reduced nitrogen application are also likely to interact and determine the abundance and community structure of denitrifier bacterial communities [8]. For instance, over-release nitrogen forms will cause serious groundwater contamination [15,16,30]. However, rare tests have focused on the influence of depression of groundwater table, reduced nitrogen application and their interactions on the soil denitrifier bacterial communities in the agricultural soil of the North China Plain.
To explore how the depression of groundwater table, reduced nitrogen application and their interactions shape the community structure of denitrifier communities in agricultural soil, we conducted a large lysimeter experiment. The composition of nirS-type and nirK-type denitrifier communities was compared at two levels of N input (reduced N of 240 kg N ha−1 year−1 and conventional N of 300 kg N ha−1 year−1) and three groundwater table (2, 3 and 4 m). Soil nirK-type and nirS-type denitrifier communities were assessed based on the high throughput sequencing data of nirS-type and nirK-type genes on an Illumina. Specifically, we primarily attempt to examine the following questions—(1) Does the bacterial community composition of nirK-type and nirS-type genes vary remarkably between conventional N and reduced N levels? (2) Does groundwater table change lead to drastic shifts in the bacterial community composition of nirK-type and nirS-type genes? (3) How do depression of groundwater table and reduced nitrogen application affect nirK-type and nirS-type denitrifier communities?

2. Materials and Methods

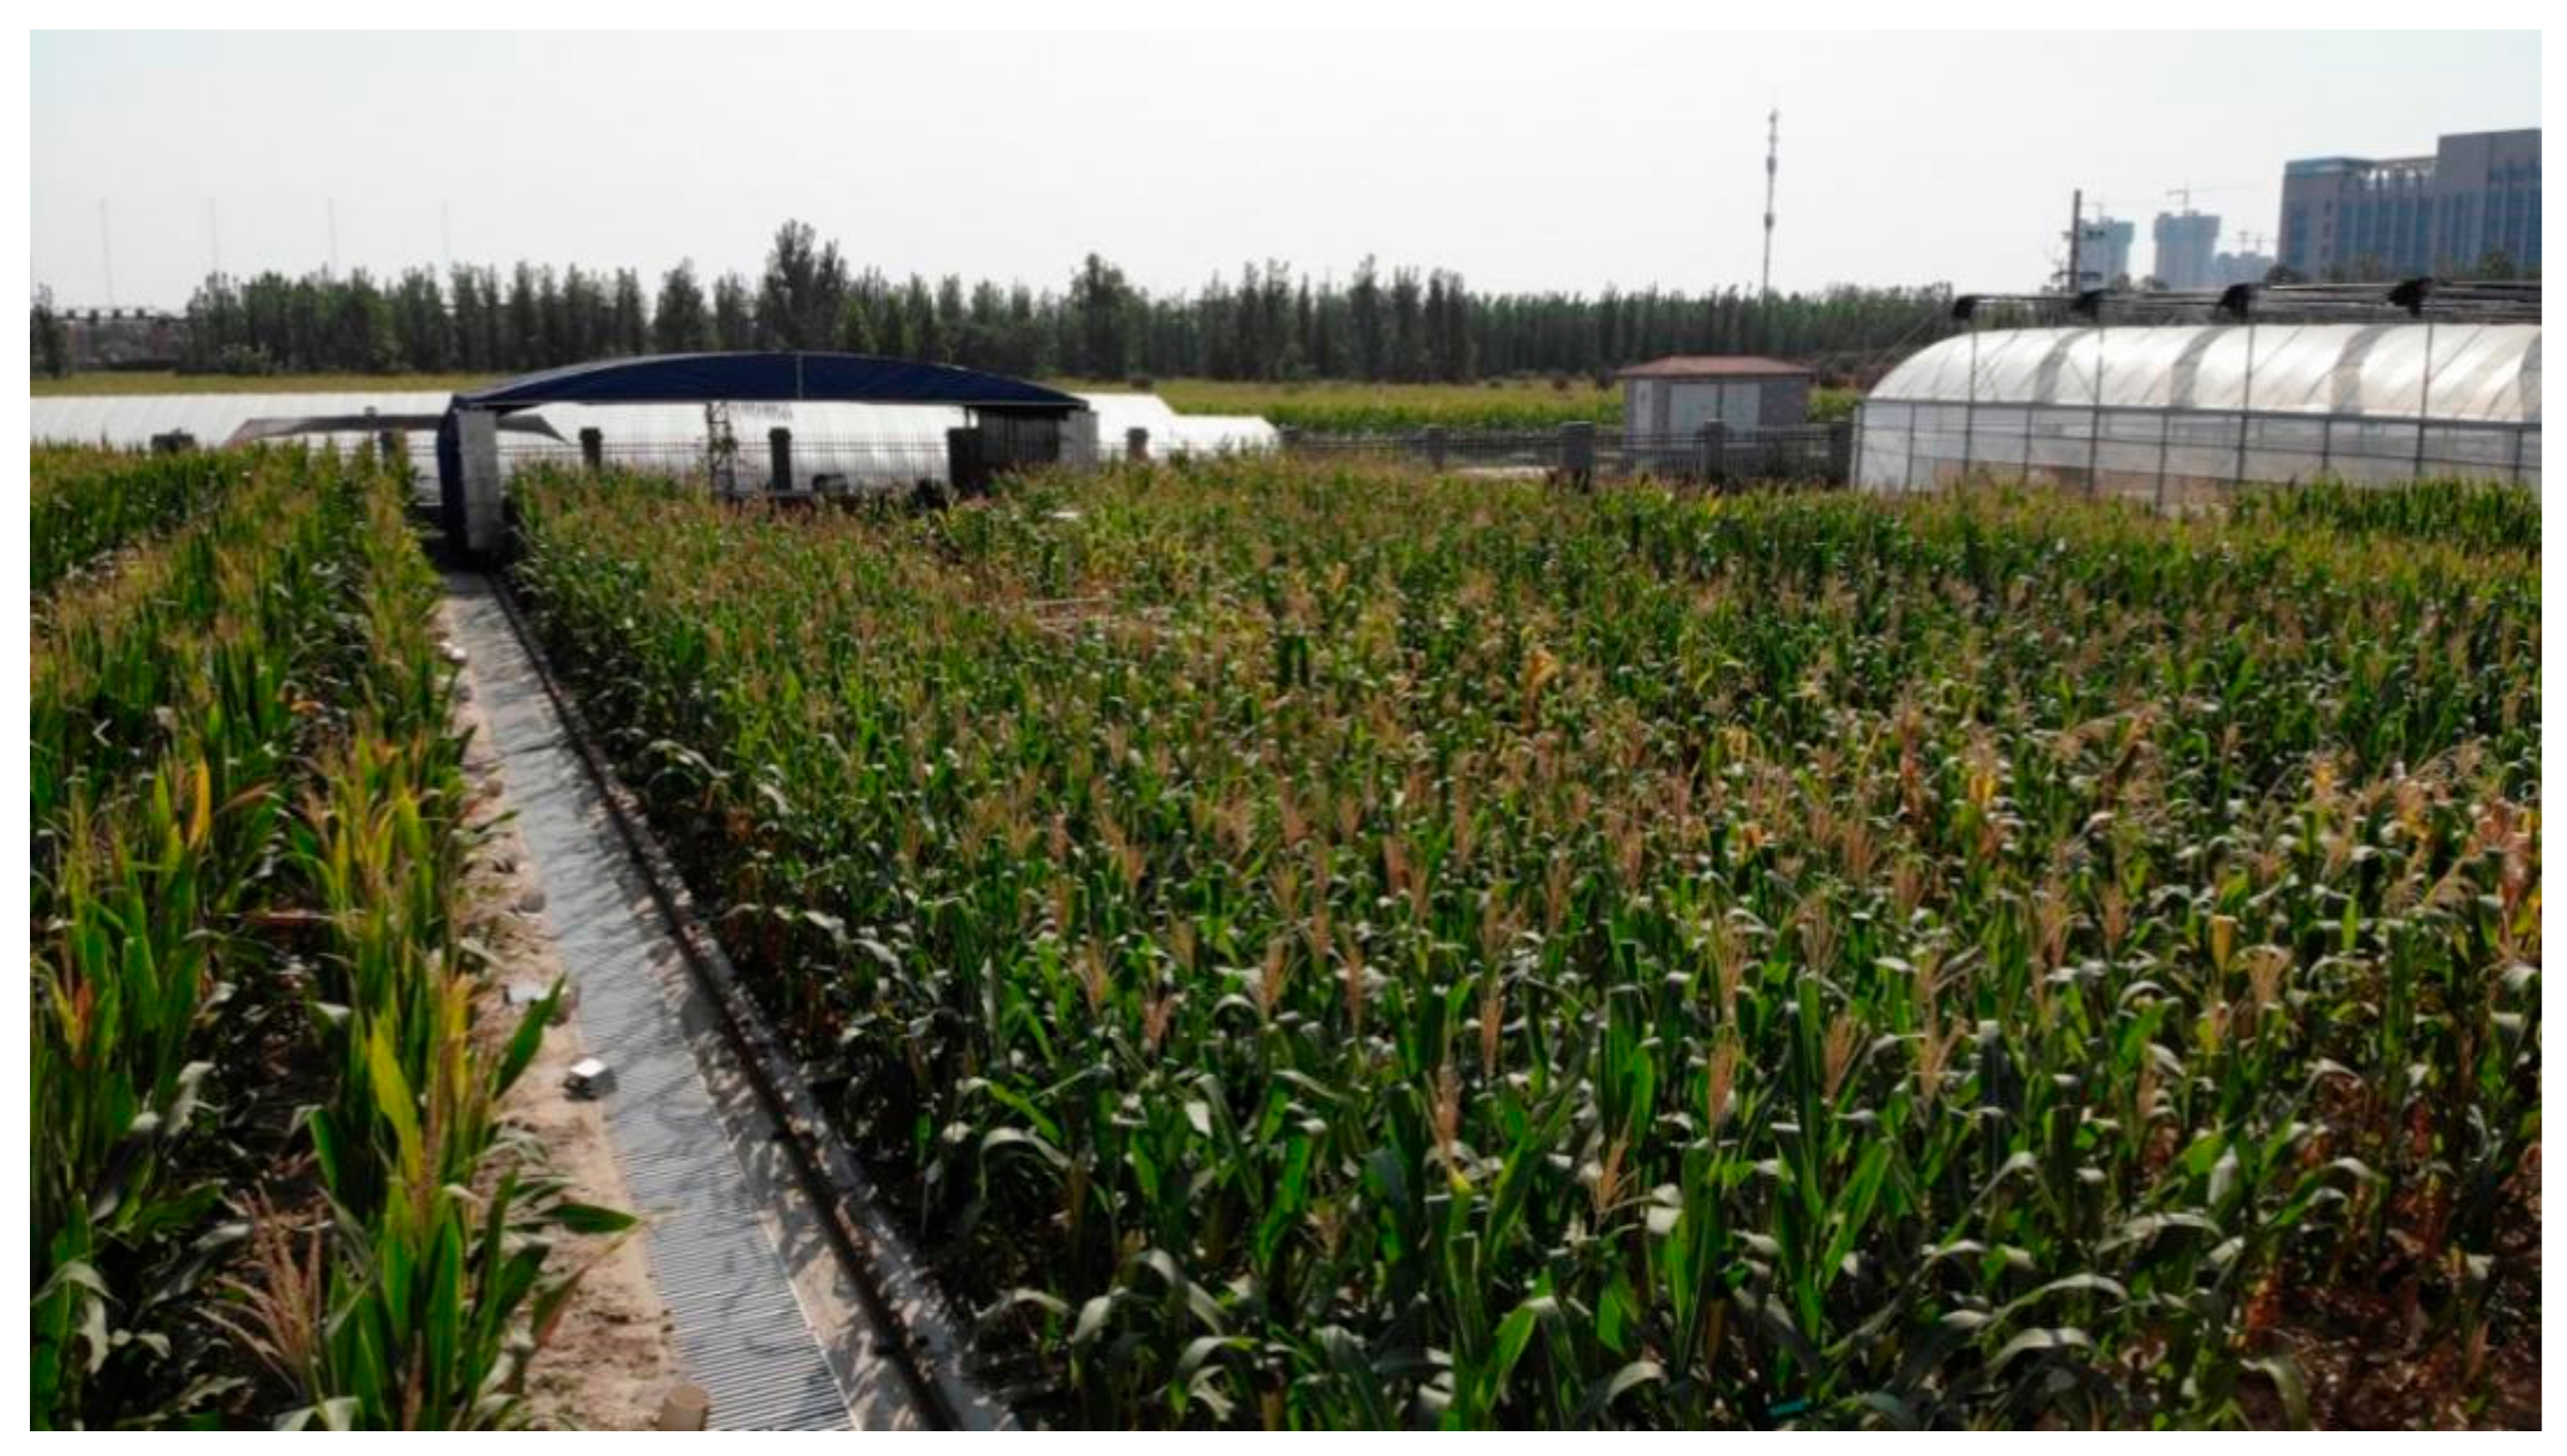
2.1. Field Site and Experimental Description

The field site was established at the Xinxiang Agricultural Water and Soil Environment Field Scientific Observation and Experiment Station, Chinese Academy of Agricultural Sciences (35°1′ N, 113°53′ E), Xinxiang City, Henan Province, People’s Republic of China. The mean annual air temperature and annual precipitation is 14.1 °C, 588.8 mm, respectively. Almost all precipitation is concentrated during July, August and September. The mean annual evapotranspiration is approximately 2000 mm. In 2019, this study was conducted on a large infiltration lysimeter platform, and all lysimeters were filled with silt loam soil obtained from the neighboring cropland. The site conditions are shown in Figure 1.
The field site was sown with maize (Zea mays L.), where we examined six treatments produced by the interactions between two levels of N input (local conventional N of 300 kg N ha−1 year−1 (N300), reduced N of 240 kg N ha−1 year−1 (N240)) and three groundwater table (GW2, 2 m; GW3, 3 m and GW4, 4 m). Local conventional nitrogen level (300 kg N ha−1 year−1) was used as a control with 100% of normal nitrogen input. Excessively shallow groundwater table will limit the growth of crops and root aerobic respiration [31], and lead to soil waterlogging [32]. A previous study has observed that 2.5 m is a crucial groundwater depth to control soil salinization [28]. When the groundwater table is shallow, there are obvious two-ways of water exchange at the interface under the root layer, the upper soil moisture can infiltrate into deep soil and ground water, and crop evapotranspiration can partially utilize the groundwater. When the groundwater table becomes deeper, the soil moisture at the interface mainly migrated downward, and the critical groundwater depth for crop growth in the North China Plain is generally 4 m. Therefore, we used 2, 3 and 4 m as the treatments of groundwater depth in our tests. The experiment followed a random block design with four replicates. Furthermore, 120 K2O ha−1 year−1 and 150 kg P2O5 ha−1 year−1 were applied in six treatments in the form of potassium sulphate and monocalcium phosphate, respectively. Seeding, fertilization and tillage operations were carried out at the same time. Furthermore, ground irrigation was conducted when the soil moisture was lower than 55% of the field water holding rate. A RS-XAJ-100 probe was buried in the 20 cm soil layer to monitor soil moisture and guide irrigation.

2.2. Soil Sampling and Physicochemical Properties Analysis

We randomly collected 5 soil subsamples from the 0–20 cm soil layer in each lysimeter and mixed together into one sample, so finally 24 soil samples were collected in total in this study. After that, each composite sample was sieved using a 2 mm screen and divided into two parts: one portion was stored in room temperature and air-dried for measuring the soil attributes, and the other was stored at −80 °C to extract DNA. For soil conditions, we measured soil organic carbon content, soil pH and total nitrogen content following the procedures described by Wang et al [33]. In addition, the conductivity meter was used to determine soil electrical conductivity, and then soil NO3–N and NH4+–N contents were also measured using the methods of Li et al [34].

2.3. DNA Extraction, PCR Amplification and Illumina-Based Sequencing

E.Z.N.A. soil DNA kits (OMEGA, Norcross, Georgia, United States) was used to extract the Genomic DNA from the 0.5 g fresh soil samples according to the manufacturer’s instructions. A 1% agarose gel electrophoresis and spectrophotometry were used to check the quality of extracted DNA. All the extracted DNA was stored at −20 °C for following analysis.
The denitrification functional gene was amplified with the universal primers of the forward nirS cd3a-F (5’-GTSAACGTSAAGGARACSGG-3’) and the reverse R3cd-R (5’-GASTTCGGRTGSGTCTTGA-3’), nirK FlaCu-F (5’-ATCATGGTSCTGCCGCG-3’) and the reverse R3Cua-R (5’-GCCTCGATCAGRTTGTGGTT-3’). These primers contained a set of 8-nucleotide barcodes sequence, each of which is unique. The PCR program for nirS is 94 °C (5 min), 35 cycles at 94 °C (30 s), 57 °C (30 s), 72 °C (60 s) and with extension of 72 °C (7 min). Finally, the PCR program for nirK is 94 °C (5 min), 35 cycles at 94 °C (30 s), 63 °C (30 s), 72 °C (60 s) and with a final extension of 72 °C (7 min). PCR reactions were performed in triplicate. A total of 25 μL mixture containing 10× Pyrobest Buffer (2.5 μL), 2.5 mM dNTPs (2 μL), each primer (10 μM, 1 μL), Pyrobest DNA Polymerase (TaKaRa, 0.4 U), and template DNA (15 ng). The amplicon mixture was applied to the MiSeq Genome Sequencer (Illumina, San Diego, CA, USA).
According to the manufacturer’s instructions, amplicons were extracted from 2% agarose gels, the purity was determined using the AxyPrep DNA Gel Extraction Kit (Axygen Biosciences, Union City, CA, USA) and the concentration were determined using QuantiFluor™-ST (Promega, Madison, WI, USA). The purified amplicon was sequenced isometrically and paired on an Illumina MiSeq platform.

2.4. Amplicon Sequencing and Sequencing Data Processing

High-quality sequences were extracted firstly by the QIIME package (Quantitative Insights Into Microbial Ecology) (v1.2.1, Gregory Caporaso, Flagstaff, AZ, USA). The raw sequences were selected according to the sequence length, quality, primer and tag, and the low-quality sequences were eliminated. Under the threshold of 97% identity, the unique sequence set was classified into operational taxonomic units (OTUs) performed with UCLUST. Usearch (version 8.0.1623, Robert Edgar, United States) was used to identify and remove chimeric sequences. UCLUST was used to analyze the taxonomy of each denitrification functional gene sequence against the nt database. To eliminate the effect of different sequencing depths on the analysis, a subset of 34,463 sequences per sample for nirK-type gene and 27,347 sequences per sample for nirS-type gene was randomly selected for the subsequent analysis, respectively.

2.5. Statistical Analyses

Bray–Curtis community dissimilarity matrices of nirK-type and nirS-type genes were evaluated (Hellinger-transformed the abundance data) and standardized environmental Euclidean distances of each variable were evaluated. Two-way ANOVA was used to examine the influence of groundwater table conditions, reduced nitrogen application and their interactions on soil attributes. Permutational analysis of variance (PERMANOVA) was performed to assess the differences in species composition (Bray–Curtis distance) of nirK-type and nirS-type genes among groundwater depth and nitrogen-treatment groups, and those differences in community composition were visualized through Nonmetric multidimensional scaling (NMDS).
Mantel tests (10,000 permutations) were carried out to test the significance of the influence of soil attributes on bacterial composition of nirS and nirK genes. Structural equation models (SEMs) were constructed to further test the indirect and direct impacts of groundwater depth changes, reduced nitrogen application and soil attributes on the soil bacterial composition of nirS and nirK genes. Before analysis, priori structural equation models were constructed in accordance with the associated theory (Figure S1). The SEM model was fitted using the following indexes: comparative fit index (CFI), goodness of fit index (GFI), low root square mean error of approximation (RMSEA) and χ2 test [35]. SEM was performed with the “lavaan” package [36].

3. Results

3.1. Soil Environmental Parameters

Two-way ANOVA showed that soil NO3–N, NH4+–N, pH, EC, SOC and TSN were significantly changed by reduced nitrogen application and groundwater depth conditions (Table 1). Specifically, reduced nitrogen application remarkably decreased soil NO3–N, EC, SOC and TSN, but increased soil NH4+–N and pH (Table 1 and Figure S2). Notably, soil NO3–N, NH4+–N, EC, SOC and TSN were positively related to the depression of groundwater table (Table 1 and Figure S3). In addition, the interactions between groundwater table conditions and reduced nitrogen application significantly influenced soil pH, EC and SOC, but did not affect NO3–N, NH4+–N and TSN (Table 1).

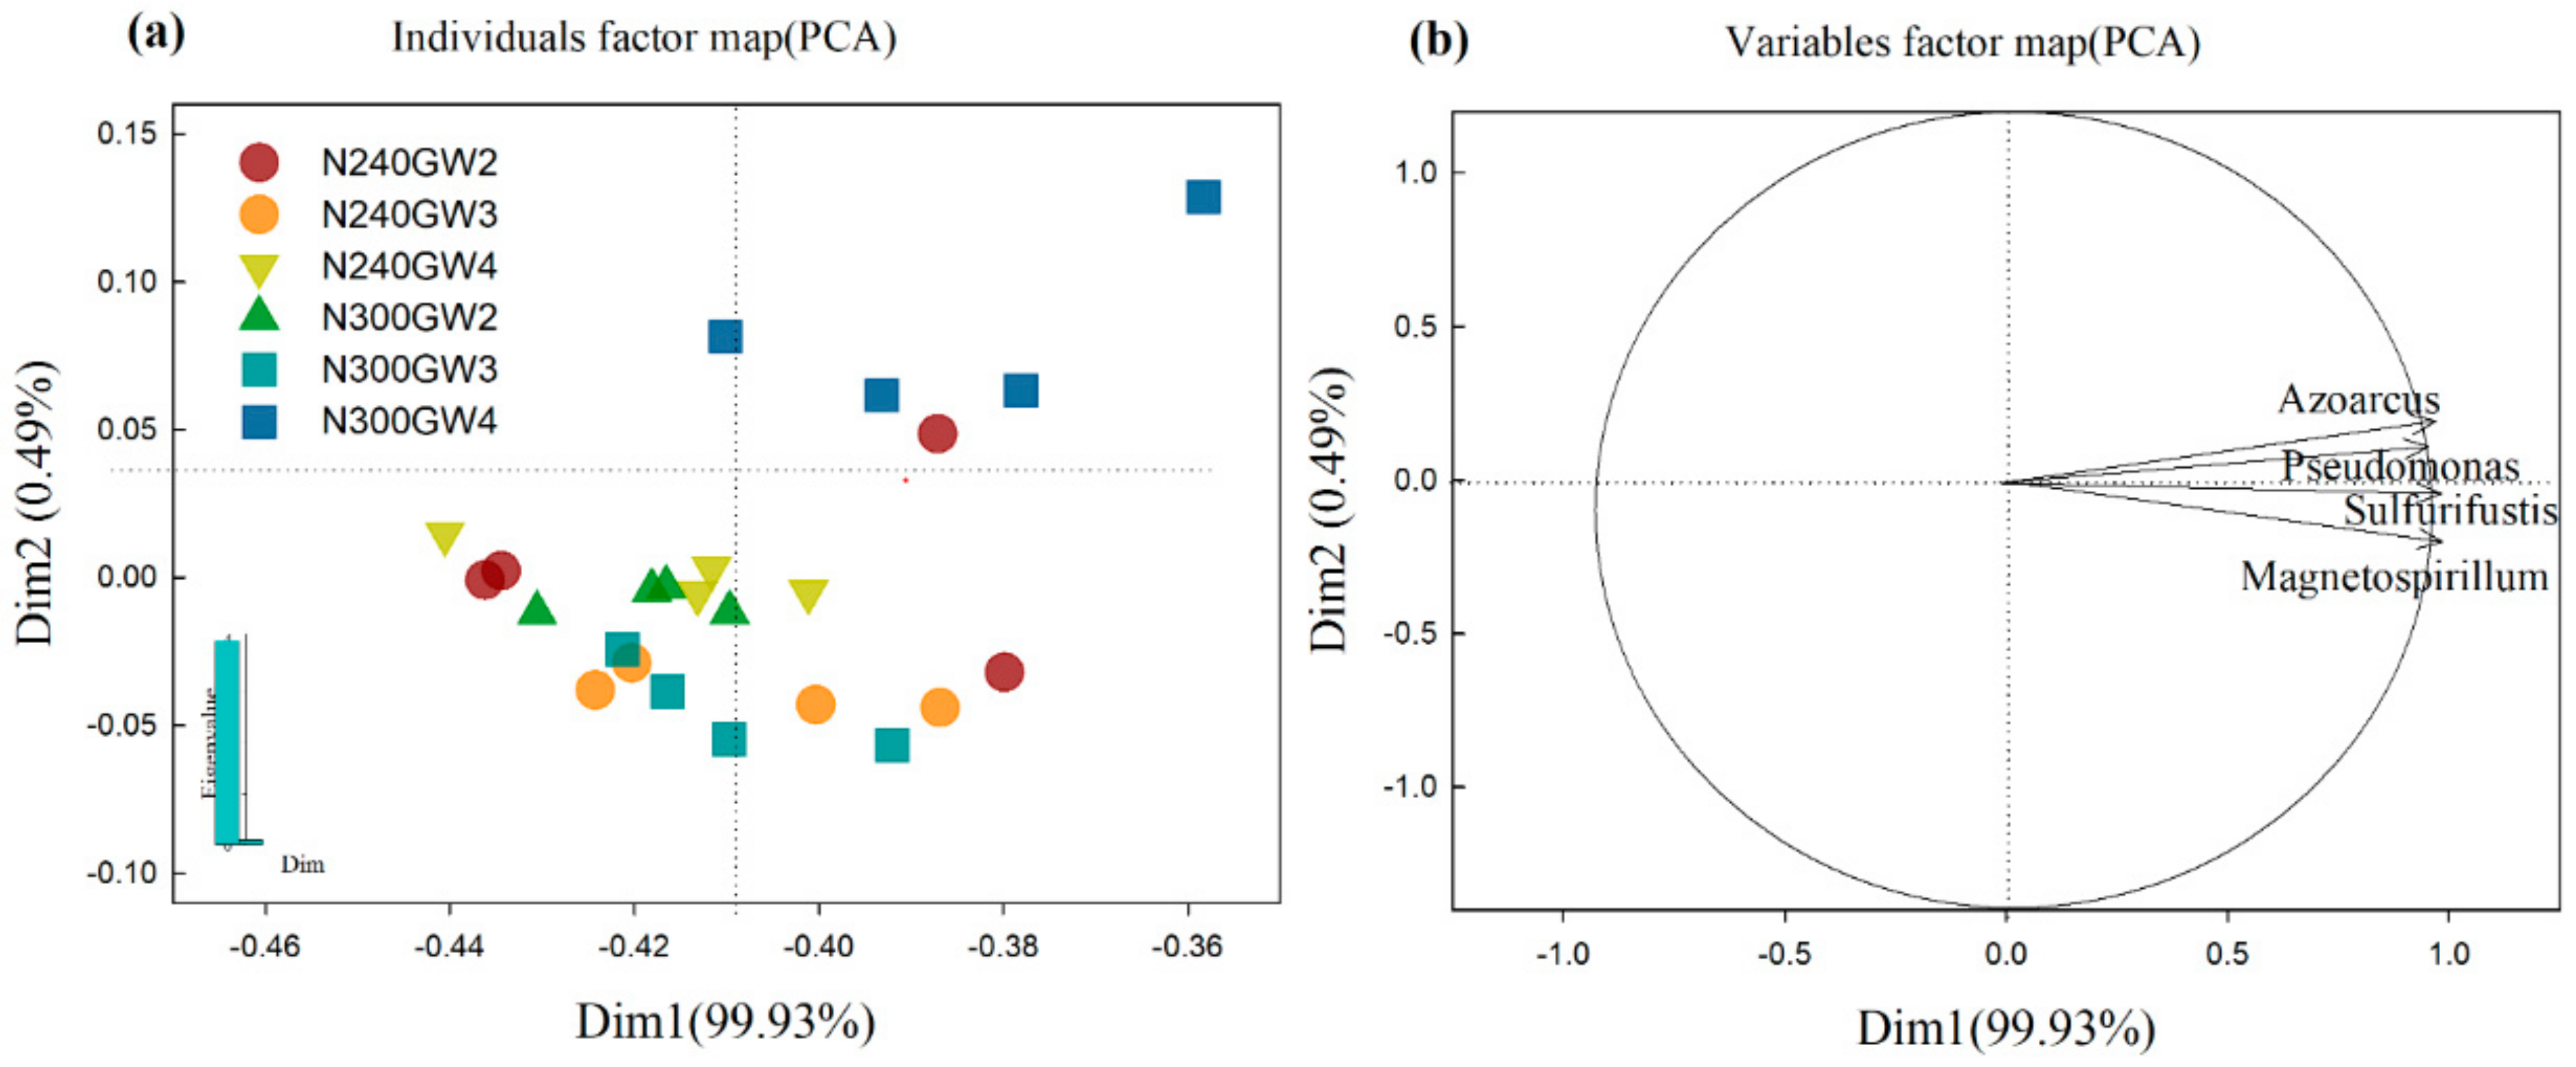
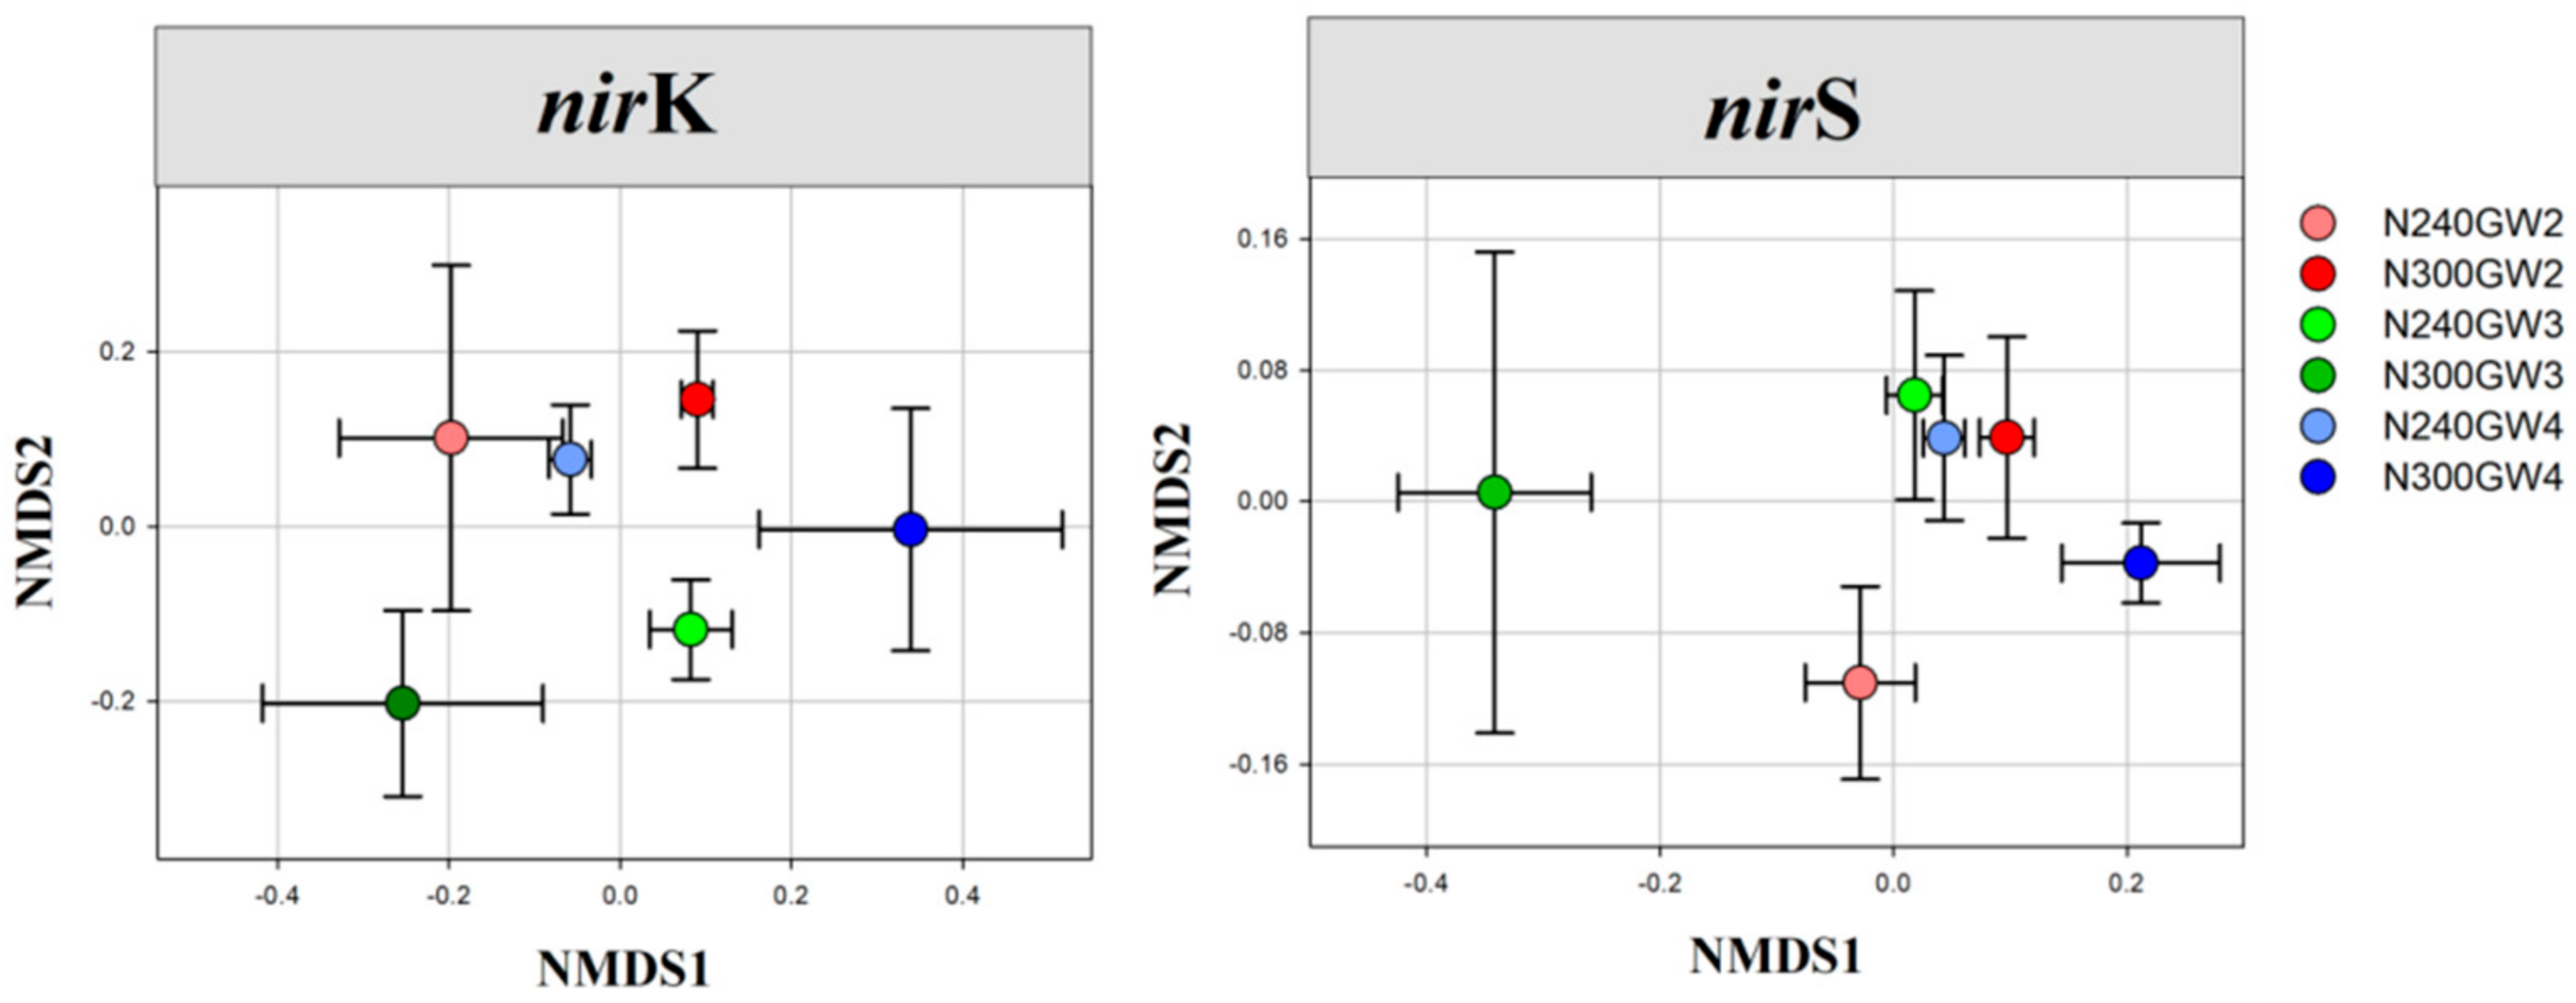
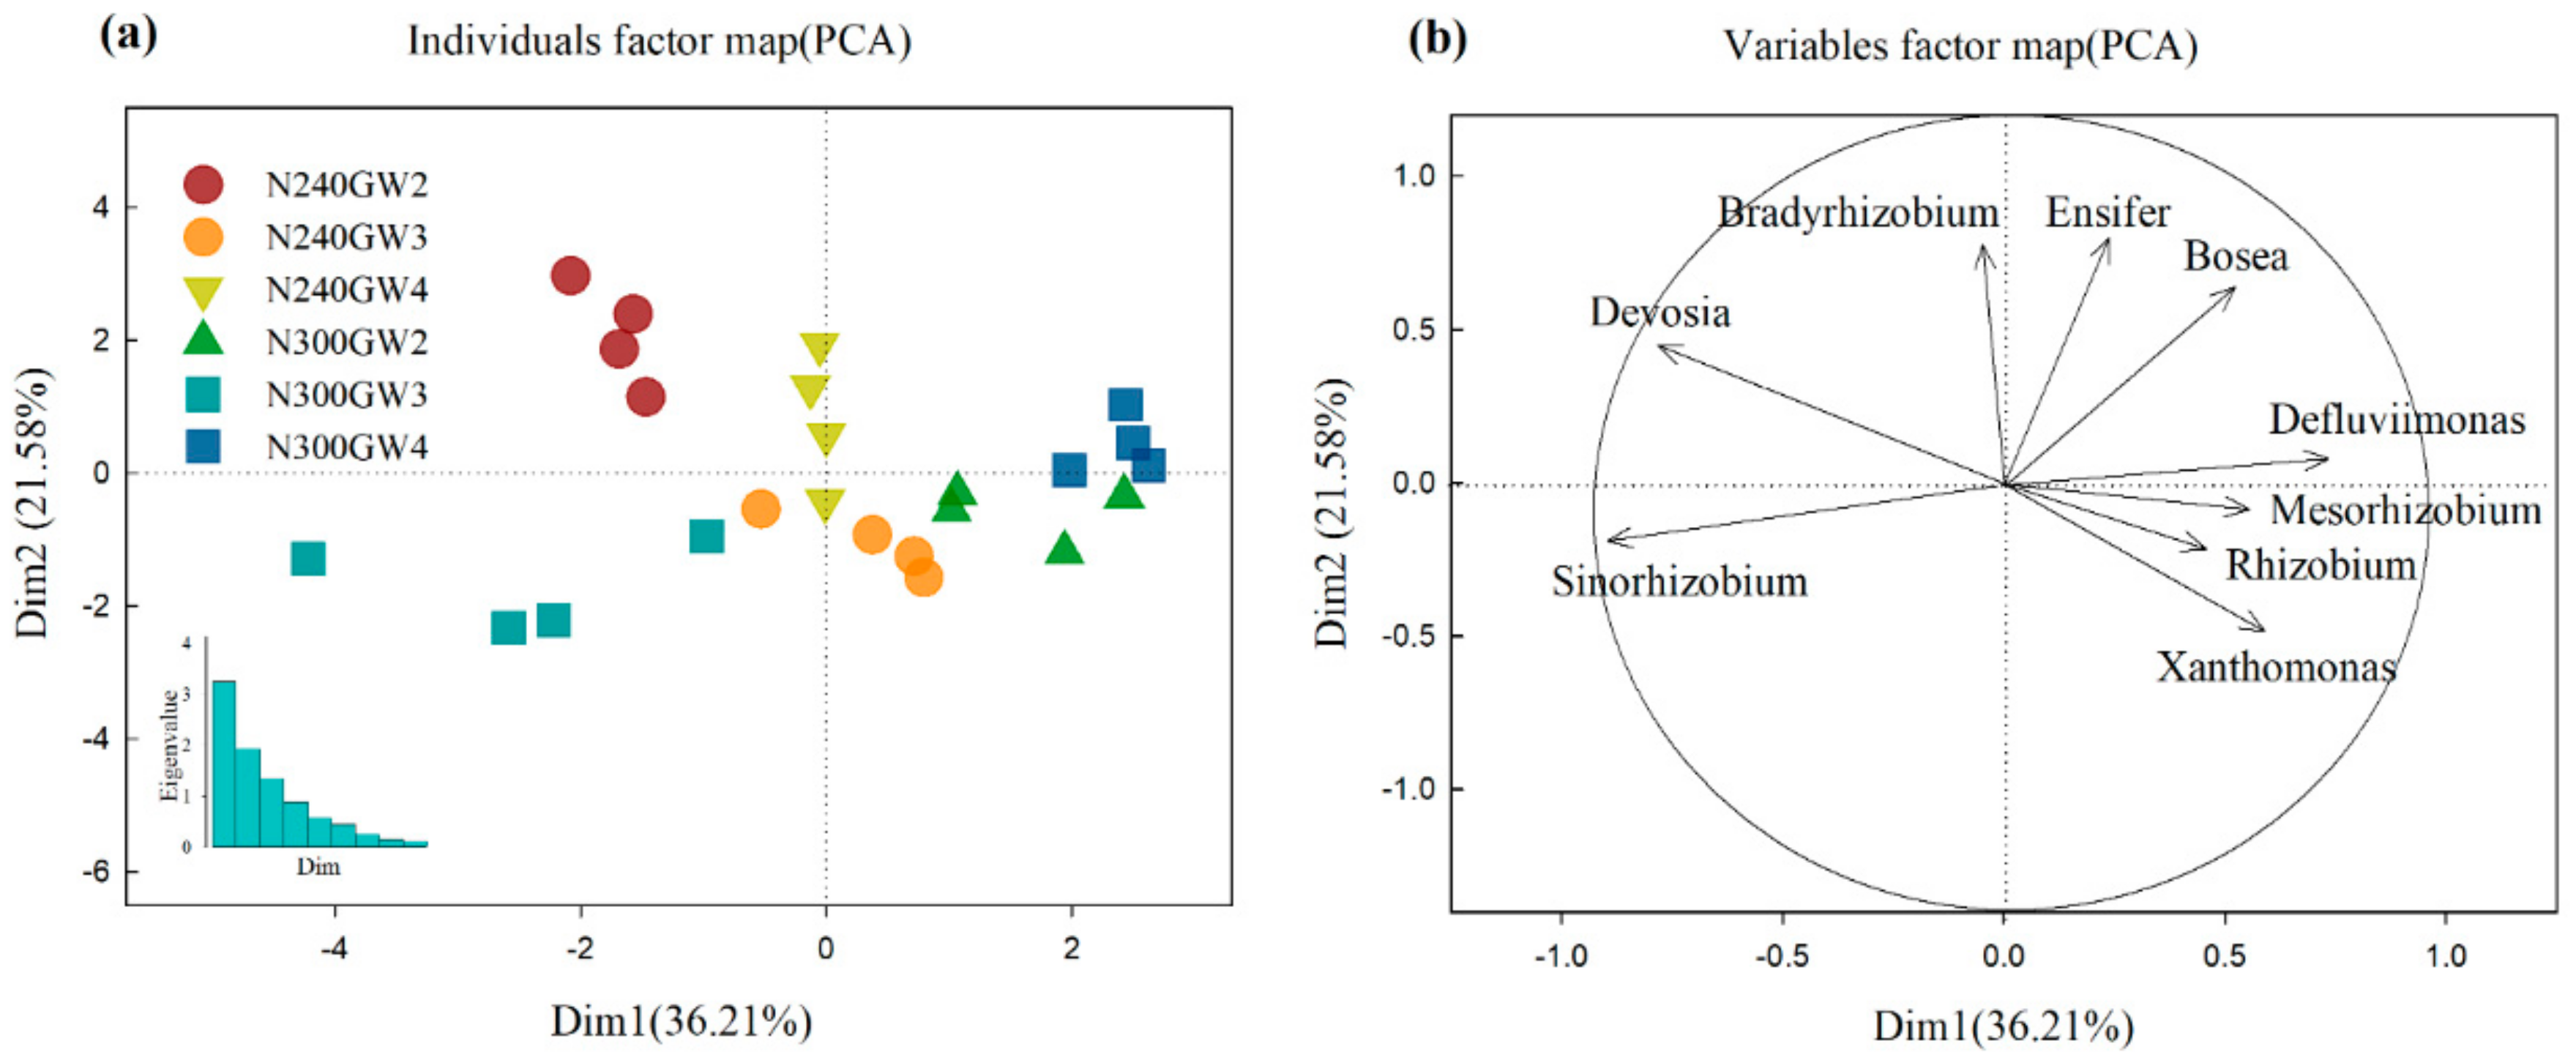
3.2. Soil Bacterial Composition of nirS-Type and nirK-Type Genes

Across six treatments, we identified a total of 827,112 and 656,328 high-quality bacterial sequences, which were classified into 3887 nirK-type OTUs and 3356 nirS-type OTUs, respectively. The dominant phyla of nirK-type bacterial denitrifier communities (relative abundance greater than 0.1%) across 24 samples were Proteobacteria, Actinobacteria, Chloroflexi and Planctomycetes, which occupied more than 55% of the total bacterial sequences (Table S1). nirS-type bacterial denitrifier communities were mainly dominated by Proteobacteria and Actinobacteria, which occupied 9.13% of the total bacterial sequences (Table S1). Furthermore, the unclassified nirK-type and nirS-type OTUs occupied 42.04% and 90.80% of bacterial sequences in total.
A total of nine dominant genera (relative abundance greater than 1.0%) were identified from all nirK-type OTUS (Table 2 and Table S2). Principal component analysis (PCA) based on these dominant genera profiles demonstrated the significant separation across six treatments (Figure 2a). Moreover, the distribution of these dominant genera under six treatments showed that Bradyrhizobium and Devosia were dominant in N240GW2, Sinorhizobium was dominant in N300GW3, and Defluviimonas, Mesorhizobium and Rhizobium were dominant in N300GW2 and N300GW4 (Figure 2b). The results of Two-way ANOVA showed that reduced nitrogen application significantly affected the relative abundance of Mesorhizobium, Xanthomonas, Devosia, Rhizobium and Ensifer, but did not influence that of Sinorhizobium, Bosea, Bradyrhizobium and Defluviimonas (Table 2 and Table S2). Groundwater table conditions significantly altered the relative abundance of Sinorhizobium, Mesorhizobium, Bosea, Devosia, Bradyrhizobium and Ensifer, but had no effect on that of other dominant genera. Besides Rhizobium and Ensifer, the interactions between groundwater table conditions and reduced nitrogen application could remarkably affect the abundance of the other seven dominant genera.
Only four dominant genera (relative abundance greater than 1.0%) were identified from all nirS-type OTUS (Table 3). PCA based on four dominant genera profiles indicated the significant separation between N300GW4 and other five treatments (Figure 3a). Meanwhile, the distribution of these dominant genera under six treatments showed that Azoarcus was dominant in N300GW4 (Figure 3b). Two-way ANOVA indicated that the relative abundance of four dominant genera were significantly affected by groundwater table conditions. Reduced nitrogen application meaningfully influenced the relative abundance of Pseudomonas, Azoarcus and Magnetospirillum. However, the interactions between groundwater table conditions and reduced nitrogen application only could change the relative abundance of Azoarcus.

3.3. Influences of Depression of Groundwater Table, Reduced Nitrogen Application and Soil Environmental Parameters on the Bacterial Composition of nirS-Type and nirK-Type Genes

The results of PERMANOVA and NMDS indicated that the variation in soil bacterial community composition of nirK-type and nirS-type genes was significantly regulated by reduced nitrogen application (nirK-type: F = 1.52, P < 0.05; nirS-type: F = 1.61, P < 0.05), groundwater table levels (nirK -type: F = 1.75, P < 0.01; nirS-type: F = 2.10, P < 0.01), and their interactions (nirK-type: F = 1.96, P < 0.01; nirS-type: F = 2.11, P < 0.01; Table 4 and Figure 4).
Mantel test showed that the bacterial community composition of nirK-type genes was significantly related to NO3–N, EC, SOC and TSN, but not related to NH4+–N, pH (Table 5). The species composition of nirS-type genes only had a correlation with NO3–N and EC (Table 5). SEM further demonstrated that the bacterial community structure of nirK-type genes was mainly determined by groundwater table conditions together with reduced nitrogen application, NO3–N, EC, SOC and TSN (Figure 5). Groundwater table conditions, reduced nitrogen application, NO3–N and EC jointly shaped the bacterial community structure of nirS-type genes (Figure 5). Groundwater table conditions could indirectly and directly influence the species composition of nirK-type genes, but only had an indirect impact on that of nirS-type genes. In contrast, reduced nitrogen application had both direct and indirect influences on the species composition of nirS-type genes, but only could indirectly regulate that of nirK-type genes.

4. Discussion

4.1. Effects of Depression of Groundwater Table and Reduced Nitrogen Application on Soil Attributes

It is widely believed that reduced nitrogen application and increased groundwater table may have very important influences on soil physico-chemical conditions [37,38,39]. Our results showed that reduced nitrogen application led to a certain degree of decline in soil fertility, but it also could significantly reduce the soil salt content, thereby reducing the risk of soil salinization (Table 1 and Figure S2). We also found that both soil nutrient and salt contents obviously increased with the increase of groundwater table (Table 1 and Figure S2). Excessively shallow groundwater table will limit the growth of crops and root aerobic respiration [31]. An appropriately increased groundwater table can alleviate waterlogging and improve crop growth status [40,41]. However, an excessively lowered groundwater table will increase the difficulty of water absorption from groundwater and reduce crop water utilization, which would adversely influence the nutrient absorption of crops from the soil [42,43,44]. Furthermore, a previous study has demonstrated that groundwater salinity increases with the depression of groundwater table, and soil salt content is positively related to groundwater salinity [28]. Therefore, both soil nutrient and salt contents were positively related to groundwater table. More importantly, we found that the interactions between depression of groundwater table and reduced nitrogen application also had important influences on some soil physico-chemical properties (Table 1). Taken together, these findings may suggest that future cropland management should simultaneously develop appropriate nitrogen input and groundwater table levels to improve soil physico-chemical conditions.

4.2. Effects of Altered Groundwater Table and Reduced Nitrogen Application on Bacterial Composition of Denitrifier Communities

We observed that depression of groundwater table, reduced nitrogen application and their interactions significantly affected the abundance of the dominant genera of both nirK-type and nirS-type genes (Table 2 and Table 3), which may confirm the viewpoint that different groundwater table and nitrogen fertilisation levels cause significant changes in the abundance of denitrifier bacteria [8,26]. Our results further confirmed that the bacterial composition of nirK-type and nirS-type genes differed significantly between conventional N and reduced N levels (Table 4 and Table 5), indicating that reduced nitrogen application will alter the community structure of denitrifier communities in agricultural soil [20]. Meanwhile, we also observed that depression of groundwater table would lead to drastic shifts in the bacterial composition of nirS-type and nirK-type genes. SEM showed that reduced nitrogen application and groundwater table changes could not only directly affect the species composition of denitrifier communities, but also indirectly influence it through causing significant variations in soil nutrient and salinity (Figure 5). Furthermore, the bacterial composition of nirK-type and nirS-type genes was obviously changed by the interactions between depression of groundwater table and reduced nitrogen application.
Nitrogen input will directly change the soil fertility and salt content, thereby affecting the growth of soil microorganisms [17,18]. Groundwater table conditions can affect soil salt content, which in turn affects soil microorganisms and crop growth [28,32,45]. In addition, changes in groundwater table can also regulate soil nutrient conditions by affecting soil nutrient absorption of crops [43,44], thereby affecting soil microbial communities. Therefore, depression of groundwater table and reduced nitrogen application act simultaneously and synergistically to shape the species composition of bacterial denitrifier communities. Taken together, our results provide robust evidence that nitrogen fertilisation and groundwater table conditions jointly regulate soil denitrifier bacterial communities. More local environmental conditions, such as groundwater table and soil conditions should be taken into account to enrich our understanding of the impact of nitrogen fertilization on biogeochemical cycles.

4.3. Influences of Soil Attributes on Bacterial Composition of Denitrifier Communities

As the carrier of microbes, soil properties directly determine the distribution and composition of microbial communities [46,47,48]. In the past few decades, plenty of studies have assessed the impact of soil attributes on microbial communities in different ecosystems [46,49,50], they found that the relative influence of different soil factors varied among microbial taxa [51,52]. In our study, the bacterial composition of nirS-type and nirK-type genes was affected by soil factors (Figure 5), implying that the variations in soil properties caused by depression of groundwater table and reduced nitrogen application would lead to important shifts in community composition of soil bacterial denitrifier communities [17,26]. However, we also found that the composition of nirK-type genes was mainly determined by NO3–N, EC, SOC and TSN (Figure 5). In contrast, that of nirS-type genes was only shaped by NO3–N and EC. This may indicate that the response of bacterial denitrifier communities to soil factors differs between nirS-type and nirK-type genes. More importantly, both NO3–N and EC had the most important effects on the bacterial composition of nirS-type and nirK-type genes, which suggests that depression of groundwater table and reduced nitrogen application mainly regulate the composition of denitrifying bacterial communities by affecting soil nutrient and salinity.
In addition, soil pH is widely regarded as the foremost driver shaping soil microbial community structure [46,53], yet results from our study showed that soil pH had no substantial effect on soil denitrifying bacterial communities. This may be partly because the soil samples collected in this study were all alkaline. These soil denitrifying communities had no response to soil pH, probably because of the absence of acidic soil in all samples [54], since the intracellular pH of most bacteria is close to neutral, and the optimum pH range for bacterial growth is usually narrow [55]. When soil pH is outside the adaptive range, microbes will grow slowly to enhance stress resistance [55]. Therefore, those slow-growing bacterial species may have higher resistance and adaptability to high soil pH. As a result, both bacteria of nirS-type and nirK-type genes were not sensitive to the relatively slight changes in pH (ranged from 9.02 to 9.65). In brief, future research also should take into account soil physicochemical properties among agricultural ecosystems to enrich our understanding of the impact of global changes on biogeochemical cycles.

4.4. Research Limitation and Future Perspectives

Together, our study provides first-hand evidence that nitrogen fertilization and groundwater table conditions jointly shape the bacterial composition of denitrifier communities. We highlight that local environmental conditions, including groundwater table and soil attributes should be taken into account to enrich our knowledge of the effect of nitrogen fertilization on soil denitrifying bacteria communities, or even biogeochemical cycles. It is notable that our study was a short-term experiment and only selected two levels of N input and three groundwater table levels, which may result in probable biased results. Therefore, longer observation period and more nitrogen input and groundwater table should be considered in further research to more precisely elucidate the intrinsic influence of nitrogen fertilization on agricultural ecosystems, and test the appropriate nitrogen input amount to maintain sustainable agricultural development.

5. Conclusions

Our research conducted a comprehensive evaluation about the influence of depression of groundwater table, reduced nitrogen application and their interactions on bacterial community structure of denitrifier communities in agricultural soil. Our results found that the bacterial composition of nirS-type and nirK-type genes was significantly changed by depression of groundwater table, reduced nitrogen application and their interactions. SEM demonstrated that reduced nitrogen application and groundwater table changes could not only directly affect the species composition of denitrifier communities, but also indirectly influence it by causing significant variations in soil nutrient and salinity. Furthermore, the variations in soil NO3–N and EC caused by depression of groundwater table and reduced nitrogen application played the most important role in altering the community composition of denitrifier bacterial communities. Taken together, our findings provide first-hand evidence that nitrogen fertilization and groundwater table conditions jointly shape the bacterial composition of denitrifier communities.

Supplementary Materials

The following are available online at https://www.mdpi.com/2073-4441/12/12/3459/s1, Figure S1: Priori structural equation models including direct and indirect effects of depression of groundwater table, reduced nitrogen application and soil attributes on the soil bacterial composition of nirS and nirK genes, Figure S2. Influence of reduced nitrogen application on soil physicochemical condition, Figure S3. Influence of depression of groundwater table on soil physicochemical condition, Table S1. Observed phyla from nirS-type and nirK-type denitrifier communities, Table S2. Effects of depression of groundwater table, reduced nitrogen application and their interaction on the relative abundance of dominant genera in nirK-type denitrifier communities.

Author Contributions

F.B., X.Q., P.L. and D.Q. designed this study; F.B. and Y.S. performed the field investigation and collected the data; F.B., X.Q. and Z.D. developed the methods; F.B., X.Q., J.W., W.G. and H.L. wrote the paper; J.W. conducted the language editing. All authors have read and agreed to the published version of the manuscript.

Funding

This work was funded by the Natural Science Foundation of China, grant number 51679241, 51779260, 51709265, 51879268. Central Public-interest Scientific Institution Basal Research Fund, grant number Y2020GH04, the Agricultural Science and Technology Innovation Program, grant number CAAS-ASTIP-2020, and Science and Technology project of Henan Province, grant number 192102110051.

Data Availability Statement

The bacterial raw sequences of this study have been submitted to SRA of NCBI database, with the accession number PRJNA669295.

Conflicts of Interest

All authors declare no conflict of interest

References

  1. Stockert, F.T.; Qin, D.; Plattner, G.K. Ipcc: The Physical Science Basis. Intergovernmental Panel on Climate Change; Cambridge University Press: Cambridge, UK; New York, NY, USA, 2013. [Google Scholar]
  2. Handa, I.T.; Rien, A.; Frank, B.; Matty, P.B.; Andreas, B.; Olaf, B.; Eric, C.; Mark, O.G.; Jérémy, J.; Marika, M.; et al. Consequences of biodiversity loss for litter decomposition across biomes. Nature 2014, 509, 218. [Google Scholar] [CrossRef] [PubMed] [Green Version]
  3. Koranda, M.; Kaiser, C.; Fuchslueger, L.; Kitzler, B.; Sessitsch, A.; Zechmeister-Boltenstern, S.; Richter, A. Seasonal variation in functional properties of microbial communities in beech forest soil. Seas. Var. Funct. Prop. Microb. Communities Beech Soil 2013, 60, 95–104. [Google Scholar] [CrossRef] [Green Version]
  4. Mooshammer, M.; Wanek, W.; Hämmerle, I.; Fuchslueger, L.; Hofhansl, F.; Knoltsch, A.; Schnecker, J.; Takriti, M.; Watzka, M.; Wild, B.; et al. Adjustment of microbial nitrogen use efficiency to carbon: Nitrogen imbalances regulates soil nitrogen cycling. Nat. Commun. 2014, 5, 3694. [Google Scholar] [CrossRef] [PubMed]
  5. Hofstra, N.; Bouwman, A. Denitrification in agricultural soils: Summarizing published data and estimating global annual rates. Nutr. Cycl. Agroecosyst. 2005, 72, 267–278. [Google Scholar] [CrossRef]
  6. Wertz, S.; Goyer, C.; Zebarth, B.J.; Burton, D.L.; Tatti, E.; Chantigny, M.H.; Filion, M. Effects of temperatures near the freezing point on N2O emissions, denitrification and on the abundance and structure of nitrifying and denitrifying soil communities. FEMS Microbiol. Ecol. 2013, 83, 242–254. [Google Scholar] [CrossRef] [Green Version]
  7. Kuypers, M.M.M.; Marchant, H.K.; Kartal, B. The microbial nitrogen-cycling network. Nat. Rev. Microbiol. 2018, 16, 263–276. [Google Scholar] [CrossRef]
  8. Cocco, E.; Bertora, C.; Squartini, A.; Delle Vedove, G.; Berti, A.; Grignani, C.; Lazzaro, B.; Morari, F. How shallow water table conditions affect N2O emissions and associated microbial abundances under different nitrogen fertilisations. Agric. Ecosyst. Environ. 2018, 261, 1–11. [Google Scholar] [CrossRef]
  9. Wiśniewski, P. Assessment of nitrous oxide emissions from agricultural soils at local level in Poland. Int. Agrophys. 2019, 33, 303–311. [Google Scholar] [CrossRef]
  10. Sun, R.; Guo, X.; Wang, D.; Chu, H. Effects of long-term application of chemical and organic fertilizers on the abundance of microbial communities involved in the nitrogen cycle. Appl. Soil Ecol. Sect. Agric. Ecosyst. Environ. 2015, 95, 171–178. [Google Scholar] [CrossRef]
  11. Hou, S.; Ai, C.; Zhou, W.; Liang, G.; He, P. Structure and assembly cues for rhizospheric nirk- and nirs-type denitrifier communities in long-term fertilized soils. Soil Biol. Biochem. 2018, 119, 32–40. [Google Scholar] [CrossRef]
  12. Zhang, W.-F.; Dou, Z.-X.; He, P.; Ju, X.-T.; Powlson, D.; Chadwick, D.; Norse, D.; Lu, Y.-L.; Zhang, Y.; Wu, L.; et al. New technologies reduce greenhouse gas emissions from nitrogenous fertilizer in China. Proc. Natl. Acad. Sci. USA 2013, 110, 8375–8380. [Google Scholar] [CrossRef] [Green Version]
  13. Lasagna, M.; Luca, D.A.; Franchino, E. Nitrate contamination of groundwater in the western po plain (Italy): The effects of groundwater and surface water interactions. Environ. Earth Sci. 2016, 75, 1–16. [Google Scholar] [CrossRef]
  14. Han, H.; Chen, C.; Bai, M.; Xu, T.; Yang, H.; Shi, A.; Ding, G.-C.; Li, J. Abundance and diversity of denitrifying bacterial communities associated with N2O emission under long-term organic farming. Eur. J. Soil Biol. 2020, 97, 103153. [Google Scholar] [CrossRef]
  15. Sieczka, A.; Bujakowski, F.; Falkowski, T.; Koda, E. Morphogenesis of a floodplain as a criterion for assessing the susceptibility to water pollution in an agriculturally rich valley of a lowland river. Water 2018, 10, 399. [Google Scholar] [CrossRef] [Green Version]
  16. Paladino, O.; Massabò, M.; Gandoglia, E. Assessment of nitrate hazards in Umbria region (Italy) using field datasets: Good agriculture practices and farms sustainability. Sustainability 2020, 12, 9497. [Google Scholar] [CrossRef]
  17. She, W.; Bai, Y.; Zhang, Y.; Qin, S.; Feng, W.; Sun, Y.; Zheng, J.; Wu, B. Resource availability drives responses of soil microbial communities to short-term precipitation and nitrogen addition in a desert shrubland. Front. Microbiol. 2018, 9, 186. [Google Scholar] [CrossRef] [PubMed]
  18. Tiehang, W.; Ashley, G.; Gan, L.; Hilary, K.; Bolanle Osi, E.; Doug, P.A. Groundwater depth overrides tree-species effects on the structure of soil microbial communities involved in nitrogen cycling in plantation forests. Forests 2020, 11, 275. [Google Scholar]
  19. Luo, S.; Yu, L.; Liu, Y.; Zhang, Y.; Yang, W.; Li, Z.; Wang, J. Effects of reduced nitrogen input on productivity and N2O emissions in a sugarcane/soybean intercropping system. Eur. J. Agron. 2016, 81, 78–85. [Google Scholar] [CrossRef]
  20. Chen, J.; Arafat, Y.; Wu, L.; Xiao, Z.; Li, Q.; Khan, M.A.; Khan, M.U.; Lin, S.; Lin, W. Shifts in soil microbial community, soil enzymes and crop yield under peanut/maize intercropping with reduced nitrogen levels. Appl. Soil Ecol. Sect. Agric. Ecosyst. Environ. 2018, 124, 327–334. [Google Scholar] [CrossRef]
  21. Hu, X.; Liu, J.; Wei, D.; Zhu, P.; Cui, X.A.; Zhou, B.; Chen, X.; Jin, J.; Liu, X.; Wang, G. Chronic effects of different fertilization regimes on nirs-type denitrifier communities across the black soil region of Northeast China. Pedosphere 2020, 30, 73–86. [Google Scholar] [CrossRef]
  22. Maeda, K.; Morioka, R.; Hanajima, D.; Osada, T. The impact of using mature compost on nitrous oxide emission and the denitrifier community in the cattle manure composting process. Microb. Ecol. 2010, 59, 25–36. [Google Scholar] [CrossRef] [PubMed]
  23. Tang, Y.; Zhang, X.; Li, D.; Wang, H.; Chen, F.; Fu, X.; Fang, X.; Sun, X.; Yu, G. Impacts of nitrogen and phosphorus additions on the abundance and community structure of ammonia oxidizers and denitrifying bacteria in Chinese fir plantations. Soil Biol. Biochem. 2016, 103, 284–293. [Google Scholar] [CrossRef]
  24. Yang, Y.; Zhao, J.; Jiang, Y.; Hu, Y.; Zhang, M.; Zeng, Z. Response of bacteria harboring nirS and nirK genes to different N fertilization rates in an alkaline northern Chinese soil. Eur. J. Soil Biol. 2017, 82, 1–9. [Google Scholar] [CrossRef]
  25. Liu, C.; Yu, J.; Eloise, K. Groundwater exploitation and its impact on the environment in the North China Plain. Water Int. 2001, 26, 265–272. [Google Scholar]
  26. Zhang, D.; Cui, R.; Fu, B.; Yang, Y.; Wang, P.; Mao, Y.; Chen, A.; Lei, B. Shallow groundwater table fluctuations affect bacterial communities and nitrogen functional genes along the soil profile in a vegetable field. Appl. Soil Ecol. 2020, 146, 103368. [Google Scholar] [CrossRef]
  27. Xu, X.; Huang, G.; Pereira, L.S.; Ramos, T.B.; Huang, Q.; Hao, Y. Assessing the effects of water table depth on water use, soil salinity and wheat yield: Searching for a target depth for irrigated areas in the upper yellow river basin. Agric. Water Manag. 2013, 125, 46–60. [Google Scholar] [CrossRef]
  28. Abliz, A.; Tiyip, T.; Ghulam, A.; Halik, Ü.; Ding, J.-I.; Sawut, M.; Zhang, F.; Nurmemet, I.; Abliz, A. Effects of shallow groundwater table and salinity on soil salt dynamics in the Keriya Oasis, Northwestern China. Environ. Earth Sci. 2016, 75. [Google Scholar] [CrossRef]
  29. Zhang, D.; Fan, M.; Liu, H.; Wang, R.; Zhao, J.; Yang, Y.; Cui, R.; Chen, A. Effects of shallow groundwater table fluctuations on nitrogen in the groundwater and soil profile in the nearshore vegetable fields of Erhai Lake, southwest China. J. Soils Sediments 2020, 20, 42–51. [Google Scholar] [CrossRef]
  30. Matzeu, A.; Secci, R.; Uras, G. Methodological approach to assessment of groundwater contamination risk in an agricultural area. Agric. Water Manag. 2017, 184, 46–58. [Google Scholar] [CrossRef]
  31. Soylu, M.E.; Kucharik, C.J.; Loheide, S.P. Influence of groundwater on plant water use and productivity: Development of an integrated ecosystem—Variably saturated soil water flow model. Agric. For. Meteorol. 2014, 189–190, 198–210. [Google Scholar] [CrossRef]
  32. Askri, B.; Ahmed, A.T.; Abichou, T.; Bouhlila, R. Effects of shallow water table, salinity and frequency of irrigation water on the date palm water use. J. Hydrol. 2014, 513, 81–90. [Google Scholar] [CrossRef]
  33. Wang, J.; Wang, Y.; He, N.; Ye, Z.; Chen, C.; Zang, R.; Feng, Y.; Lu, Q.; Li, J. Plant functional traits regulate soil bacterial diversity across temperate deserts. Sci. Total Environ. 2020, 715. [Google Scholar] [CrossRef] [PubMed]
  34. Weike, L.; Shukui, N.; Xiaodong, L.; Jianming, W. Short-term response of the soil bacterial community to differing wildfire severity in pinus tabulaeformis stands. Sci. Rep. 2019, 9, 1–10. [Google Scholar]
  35. Coughlan, J.; Hooper, D.; Mullen, M. Structural equation modelling: Guidelines for determining model fit. Electron. J. Bus. Res. Methods 2008, 6, 53–60. [Google Scholar]
  36. Yves, R. Iavaan: An R package for structural equation modeling. J. Stat. Softw. 2012, 48. [Google Scholar] [CrossRef] [Green Version]
  37. Li, X.; Li, J.; Xi, B.; Yuan, Z.; Zhu, X.; Zhang, X. Effects of groundwater level variations on the nitrate content of groundwater: A case study in Luoyang area, China. Environ. Earth Sci. 2015, 74, 3969–3983. [Google Scholar] [CrossRef]
  38. Zhang, W.; Zhu, J.; Li, F. Effects of shallow groundwater table and fertilization level on soil physico-chemical properties, enzyme activities, and winter wheat yield. Agric. Water Manag. 2018, 208, 307–317. [Google Scholar] [CrossRef]
  39. Creze, C.M.; Madramootoo, C.A. Water table management and fertilizer application impacts on CO2, N2O and CH4 fluxes in a corn agro-ecosystem. Sci. Rep. 2019, 9, 2692. [Google Scholar] [CrossRef]
  40. Anuradha, M.; Sivaraju, K.; Krishnamurthy, V. Effect of waterlogging on physiological characteristics, yield and quality of flue-cured tobacco. Indian J. Plant Physiol. 2013, 18, 67–70. [Google Scholar] [CrossRef]
  41. Kumar, P.; Pal, M.; Joshi, R.; Sairam, R. Yield, growth and physiological responses of mung bean [Vigna radiata (l.) Wilczek] genotypes to waterlogging at vegetative stage. Physiol. Mol. Biol. Plants 2013, 19, 209–220. [Google Scholar] [CrossRef] [Green Version]
  42. Trillo, N.; Fernández, R. Wheat plant hydraulic properties under prolonged experimental drought: Stronger decline in root-system conductance than in leaf area. Plant Soil 2005, 277, 277–284. [Google Scholar] [CrossRef]
  43. Yang, Y.; Li, C.; Li, J.; Schneider, R.; Lamberts, W. Growth dynamics of Chinese wingnut (Pterocarya stenoptera) seedlings and its effects on soil chemical properties under simulated water change in the Three Gorges Reservoir region of Yangtze River. Environ. Sci. Pollut. Res. 2013, 20, 7112–7123. [Google Scholar] [CrossRef] [PubMed]
  44. Zimmermann, I.; Fleige, H.; Horn, R. Longtime effects of deep groundwater extraction management on water table levels in surface aquifers. J. Soils Sediments 2017, 17, 133–143. [Google Scholar] [CrossRef]
  45. Ramos, T.B.; Simionesei, L.; Jauch, E.; Almeida, C.; Neves, R. Modelling soil water and maize growth dynamics influenced by shallow groundwater conditions in the Sorraia Valley region, Portugal. Agric. Water Manag. 2017, 185, 27–42. [Google Scholar] [CrossRef]
  46. Griffiths, R.I.; Thomson, B.C.; James, P.; Bell, T.; Bailey, M.; Whiteley, A.S. The bacterial biogeography of British soils. Environ. Microbiol. 2011, 13, 1642–1654. [Google Scholar] [CrossRef]
  47. Hu, Y.; Xiang, D.; Veresoglou, S.D.; Chen, F.; Chen, Y.; Hao, Z.; Zhang, X.; Chen, B. Soil organic carbon and soil structure are driving microbial abundance and community composition across the arid and semi-arid grasslands in northern China. Soil Biol. Biochem. 2014, 77, 51–57. [Google Scholar] [CrossRef]
  48. Liu, Y.; Priscu, J.C.; Xiong, J.; Conrad, R.; Vick-Majors, T.; Chu, H.; Hou, J.; Wagner, D. Salinity drives archaeal distribution patterns in high altitude lake sediments on the Tibetan Plateau. FEMS Microbiol. Ecol. 2016, 92. [Google Scholar] [CrossRef]
  49. Wang, J.; Zhang, T.; Li, L.; Li, J.; Feng, Y.; Lu, Q. The patterns and drivers of bacterial and fungal β-diversity in a typical dryland ecosystem of northwest China. Front. Microbiol. 2017, 8, 2126. [Google Scholar] [CrossRef] [Green Version]
  50. Ma, B.; Dai, Z.; Wang, H.; Dsouza, M.; Liu, X.; He, Y.; Wu, J.; Rodrigues, J.L.M.; Gilbert, J.A.; Brookes, P.C.; et al. Distinct biogeographic patterns for archaea, bacteria, and fungi along the vegetation gradient at the continental scale in eastern China. mSystems 2017, 2. [Google Scholar] [CrossRef] [Green Version]
  51. Liu, J.; Sui, Y.; Yu, Z.; Shi, Y.; Chu, H.; Jin, J.; Liu, X.; Wang, G. High throughput sequencing analysis of biogeographical distribution of bacterial communities in the black soils of northeast China. Soil Biol. Biochem. 2014, 70, 113–122. [Google Scholar] [CrossRef]
  52. Liu, J.; Sui, Y.; Yu, Z.; Shi, Y.; Chu, H.; Jin, J.; Liu, X.; Wang, G. Soil carbon content drives the biogeographical distribution of fungal communities in the black soil zone of northeast China. Soil Biol. Biochem. 2015, 83, 29–39. [Google Scholar] [CrossRef]
  53. Fierer, N.; Jackson, R.B. The diversity and biogeography of soil bacterial communities. Proc. Natl. Acad. Sci. USA 2006, 103, 626–631. [Google Scholar] [CrossRef] [PubMed] [Green Version]
  54. Wang, X.; Van Nostrand, J.D.; Deng, Y.; Lu, X.; Wang, C.; Zhou, J.; Han, X. Scale-dependent effects of climate and geographic distance on bacterial diversity patterns across northern China’s grasslands. FEMS Microbiol. Ecol. 2015, 91. [Google Scholar] [CrossRef] [PubMed] [Green Version]
  55. Hou, J.; Wu, L.; Liu, W.; Ge, Y.; Mu, T.; Zhou, T.; Li, Z.; Zhou, J.; Sun, X.; Luo, Y.; et al. Biogeography and diversity patterns of abundant and rare bacterial communities in rice paddy soils across China. Sci. Total Environ. 2020, 730, 139116. [Google Scholar] [CrossRef]
Figure 1. Field experiment in Xinxiang Agricultural Water and Soil Environment Field Scientific Observation and Experiment Station, Chinese Academy of Agricultural Sciences.
Water 12 03459 g001
Figure 2. Individuals and variables graph in principal component analysis for nirK-type denitrifier communities. We used taxonomic abundances data from 9 nirK-type dominant genera (relative abundance greater than 1.0%) as quantitative variables, which were used to perform the PCA.
Water 12 03459 g002
Figure 3. Individuals and variables graph in principal component analysis for nirS-type denitrifier communities. We used taxonomic abundances data from 4 nirS-type dominant genera (relative abundance greater than 1.0%) as quantitative variables, which were used to perform the PCA.
Water 12 03459 g003
Figure 4. Nonmetric multidimensional scaling (NMDS) ordination of nirS-type and nirK-type community differences (Bray–Curtis distance) under different groundwater table conditions and reduced nitrogen application treatments.
Water 12 03459 g004
Figure 5. SEM describing the direct and indirect effects of depression of groundwater table, reduced nitrogen application and soil attributes on the species composition (two axes from nonmetric multidimensional scaling) of nirK (a) and nirS genes (b). The solid red arrows indicate the significant direct paths (P < 0.05), and the dashed grey arrows represent the significant indirect paths (P < 0.05). N-input, reduced nitrogen application; GWD, groundwater table condition treatments; KC1, NMDS1 for nirK genes; SC1 and SC2, NMDS1 and NMDS2 for nirS genes.
Water 12 03459 g005
Table 1. Effects of depression of groundwater table, reduced nitrogen application and their interactions on soil attributes.
SourceNO3–NNH4+–NpHECSOCTSN
FPFPFPFPFPFP
Ninput519.10<0.00111.27<0.01376.15<0.001365.49<0.00152.65<0.00116.12<0.001
GWD121.74<0.0014.03<0.05172.96<0.00118.33<0.00144.26<0.00139.91<0.001
Ninput*GWD0.220.801.530.2426.73<0.00127.90<0.00112.85<0.0012.750.09
Ninput, levels of N input; GWD, groundwater table; Ninput*GWD, interaction between Ninput and GWD; SOC, soil organic carbon; TSN, soil total nitrogen; pH, soil pH; EC, soil electrical conductivity; NH4+–N, soil NH4+–N contents, NO3–N, soil NO3–N content; F, F-test Value; P, probability value.
Table 2. Effects of depression of groundwater table, reduced nitrogen application and their interactions on the relative abundance of dominant genera in nirK-type denitrifier communities.
SourceSinorhizobiumMesorhizobiumXanthomonasBosea
FPFPFPFP
Ninput0.120.744.51<0.055.02<0.050.080.78
GWD32.35<0.00125.77<0.0011.560.2411.00<0.001
Ninput*GWD79.60<0.00111.83<0.00117.58<0.0013.88<0.05
Ninput, levels of N input; GWD, groundwater table; Ninput*GWD, interaction between Ninput and GWD; F, F-test Value; P, probability value.
Table 3. Effects of depression of groundwater table, reduced nitrogen application and their interactions on the relative abundance of dominant genera in nirS-type denitrifier communities.
SourcePseudomonasAzoarcusSulfurifustisMagnetospirillum
FPFPFPFP
Ninput4.63<0.055.36<0.050.040.846.11<0.05
GWD4.33<0.0529.42<0.0015.46<0.054.30<0.05
Ninput*GWD0.220.8015.50<0.0012.270.130.220.81
Ninput, levels of N input; GWD, groundwater table; Ninput*GWD, interaction between Ninput and GWD; F, F-test Value; P, probability value.
Table 4. Effects of depression of groundwater table, reduced nitrogen application and their interactions on the species compositions of nirS-type and nirK-type denitrifier communities.
Genotype NinputGWDNinput*GWD
nirK-typeF1.521.751.96
P<0.05<0.01<0.01
nirS-typeF1.612.102.11
P<0.05<0.01<0.01
Ninput, levels of N input; GWD, groundwater table; Ninput*GWD, interaction between Ninput and GWD; F, F-test Value; P, probability value.
Table 5. Correlations between soil properties and soil denitrifier bacterial communities (Bray–Curtis dissimilarities), as determined by the Mantel test.
VariablesnirK-TypenirS-Type
rPrP
NO3–N0.36<0.0010.34<0.01
NH4+–N−0.110.71−0.220.95
pH0.140.070.070.21
EC0.27<0.010.32<0.01
SOC0.27<0.050.150.15
TSN0.35<0.010.160.14
SOC, soil organic carbon; TSN, soil total nitrogen; pH, soil pH; EC, soil electrical conductivity; NH4+–N, soil NH4+–N contents, NO3–N, soil NO3–N content; r, Mantel test correlation coefficient; P, probability value.
Publisher’s Note: MDPI stays neutral with regard to jurisdictional claims in published maps and institutional affiliations.

