Article

Cohesive Channel Response to Watershed Urbanization: Insights from the Sand River, Aiken SC

1
Department of Biology and Geology, University of South Carolina Aiken, Aiken, SC 29801, USA
2
Arnold School of Public Health, University of South Carolina, Columbia, SC 29208, USA
3
Mirion Technologies Inc., Los Alamos, NM 94582, USA
4
Mirion Technologies Inc., Meridan, CT 06450, USA
*
Author to whom correspondence should be addressed.
Water 2020, 12(12), 3441; https://doi.org/10.3390/w12123441
Submission received: 10 November 2020 / Revised: 5 December 2020 / Accepted: 6 December 2020 / Published: 8 December 2020
(This article belongs to the Section Urban Water Management)

Abstract

:
Stream channel degradation is among the most widely documented symptoms of urban stream syndrome arising from watershed urbanization. Nevertheless, our present understanding of space and time scales associated with channel response to urbanization is poorly constrained and largely limited to assessments of non-cohesive systems. The purpose of this study is to assess the evolution of a cohesive, ephemeral river channel in response to watershed urbanization. The assessment of historical images document the stable, pre-urbanized channel conditions from 1870 to 1930. Historical assessments revealed a 131% increase in urbanized watershed area from 1930 to 1992, and a minimal increase in urbanized extent from 1992 to 2012. A 2012 lidar dataset was used to generate the modern long-channel profile, to reconstruct cross-channel profiles observed in 2002, and to estimate the volume flux of sediment removed from the channel from 1930 to 1992, and from 1992 to 2012. The long-channel profile reveals incision of up to 35 m in response to urbanization from 1930 to 1992. Cross-channel profiles reveal incision and widening of 2.5 and 3 m, respectively, from 2002 to 2012. Volume flux estimates indicate erosion rates of 9000 m3/yr during the first 62 years of the study period, and a flux of 4000 m3/yr after installation of stormwater control measures in 1992. Collectively, our findings highlight a cohesive channel that has undergone substantial incision and widening at a rate of ~0.20 m/yr since 1930, and the channel continues to adjust. Hence, we contend that the channel has not yet attained a new equilibrium “shape” at 82 years after peak land use change within the watershed, and that the channel will continue to adjust its shape until this new balance is achieved.

1. Introduction

More often than not, urban areas arise at or near river systems which provide water supply, aesthetics, recreation, and natural drainage for rainwater runoff [1,2,3,4]. Given their position in the landscape, and their important role as carriers of water and materials between upstream and downstream areas, rivers and streams near developed areas are particularly vulnerable to the impacts of land use change [5,6,7]. In particular, rivers are sensitive to human-caused changes in flow and sedimentation initiated by urbanization within their upstream source areas [8,9,10,11,12,13]. Moreover, most urban stream systems have been manipulated for hydroelectric power (Bilinski), dredged for navigation or riverbed mining [14], and managed for flood control by directing stormwater flows through piped connections between the upstream watershed and the downstream river channel [5]. This type of anthropogenic forcing has been shown to reduce biotic richness and enhance the dispersal of invasive plants and seeds [14,15,16,17]. Water quality issues also arise because urbanization leads to increased concentrations and loads of chemical pollutants [14,18,19,20], alters water nutrient content [20,21,22,23], and exacerbates issues arising from non-point source pollutants [14,24,25]. The consistently observed ecological impacts and associated stream system degradation is termed “urban stream syndrome” [5,26], which has seen a global marked increase over the past century due to a rapid increase in human population and associated rise in human interactions with natural systems [5,15,26,27,28,29].
One ubiquitous feature of urban stream syndrome is alteration of the river channel morphology and stability [9,10,11,12,14,30,31,32,33,34,35,36]. Generally speaking, rivers will adjust their shapes in response to natural fluctuations in sediment supply and flow regime [30,37], and the rate of this response is frequently accelerated by watershed urbanization. One problem is related to the increased imperviousness of the watershed, when natural ground surfaces are replaced by roads, sidewalks, buildings, and parking lots. Increased imperviousness interrupts the natural infiltration processes that gradually route rainwater downward into the subsurface, and the eventual recharge of the downstream river channel [10,11,38,39,40,41,42], thereby disrupting the natural hydrological processes that route water and material downstream. More issues can arise from installation of drainage pipe networks that often lead to rainwater being collected over a much larger area, thereby increasing the extent of the area delivering flows to downstream channels [42,43,44]. Collectively, these practices can result in much more stormwater runoff being instantaneously delivered to the channel head, and this increases the energy of the flow regime to a point that exceeds the rivers natural transport capacity [8,12,35,36,45,46].
Channels respond to such energy perturbations by first incising into the channel bed by erosion [10,29,35,37,44], which is intensified by the coarsening of bed materials [33]. Because incision leads to a deeper channel, the banks steepen and become unstable and more prone to erosion through bank failures [44,47,48], thereby widening the channel and increasing sedimentation [48]. Continued erosion leads to further incision as coarse particles are transported downstream. This cyclic process of incision and widening will continue until the channel reaches a new balance, or equilibrium, to accommodate the increased flows received from the urbanized watershed [9,33,44,49]. In extreme cases, a channel may incise many meters below the original level of their beds [50,51].
This general view of channel adjustment in response to watershed urbanization has been well documented [12,33,44], however, the space and time scales associated with their response has been poorly constrained [52,53,54,55,56]. One reason for this knowledge gap arises from the highly varied nature of bed material types and sizes between study sites [43,57,58,59], as well as the presence or absence of stormwater management infrastructure or exposed bedrock [14,33,34,44]. Moreover, our present understanding of channel “re-equilibration” due to watershed urbanization is largely limited to studies of non-cohesive, alluvial systems [60], and less is known about erosional processes in cohesive channels [61,62,63,64], let alone their morphodynamic response to human activities. Hence, we are presently unable to predict how channels, particularly those comprised of cohesive materials, may change in response to present and future land use change conditions [52,53,54,55,56,65].
In this study, we investigate the morphological alteration of the Sand River; a cohesive, urban stream channel that has undergone substantial morphological alteration in response to century-scale watershed urbanization. Scientific research on the Sand River system is limited to two studies [51,66], and only one has quantitatively assessed the channel morphology. Specifically, Julian and Torres [51] focused on the dominant mechanisms for sediment mobilization for the cohesive channel. As part of their study, they measured the cross-sectional area of the active channel [67] in order to calculate flow depth-area relationships for each transect. Theirs was the first and only study to quantify the morphology of the Sand River, and one of very few field studies to investigate sediment transport processes in a cohesive channel. Nevertheless, millions of dollars have been allocated to engineering efforts that aimed at slowing or stopping erosional processes in the Sand River [66], despite our poor constraint on the space and time scales associated with cohesive channel adjustment.
The purpose of this study is to quantitatively assess the Sand River channel adjustment over an 82-year period in response to watershed urbanization. Here, we use lidar data, field observations, historical image interpretation, and GIS to evaluate long- and cross-channel profiles, and volume sediment flux in the context of watershed urbanization occurring from 1930 to 1992, and from 1992 to 2012. This work is significant because it provides additional insights into the effects of urbanization on fluvial geomorphology and can aid in the management and restoration efforts for the Sand River.

2. Study Site History and Description

The Sand River is a natural, first-order tributary in the Savannah River drainage basin, with headwaters located in Aiken, SC, USA (Figure 1).
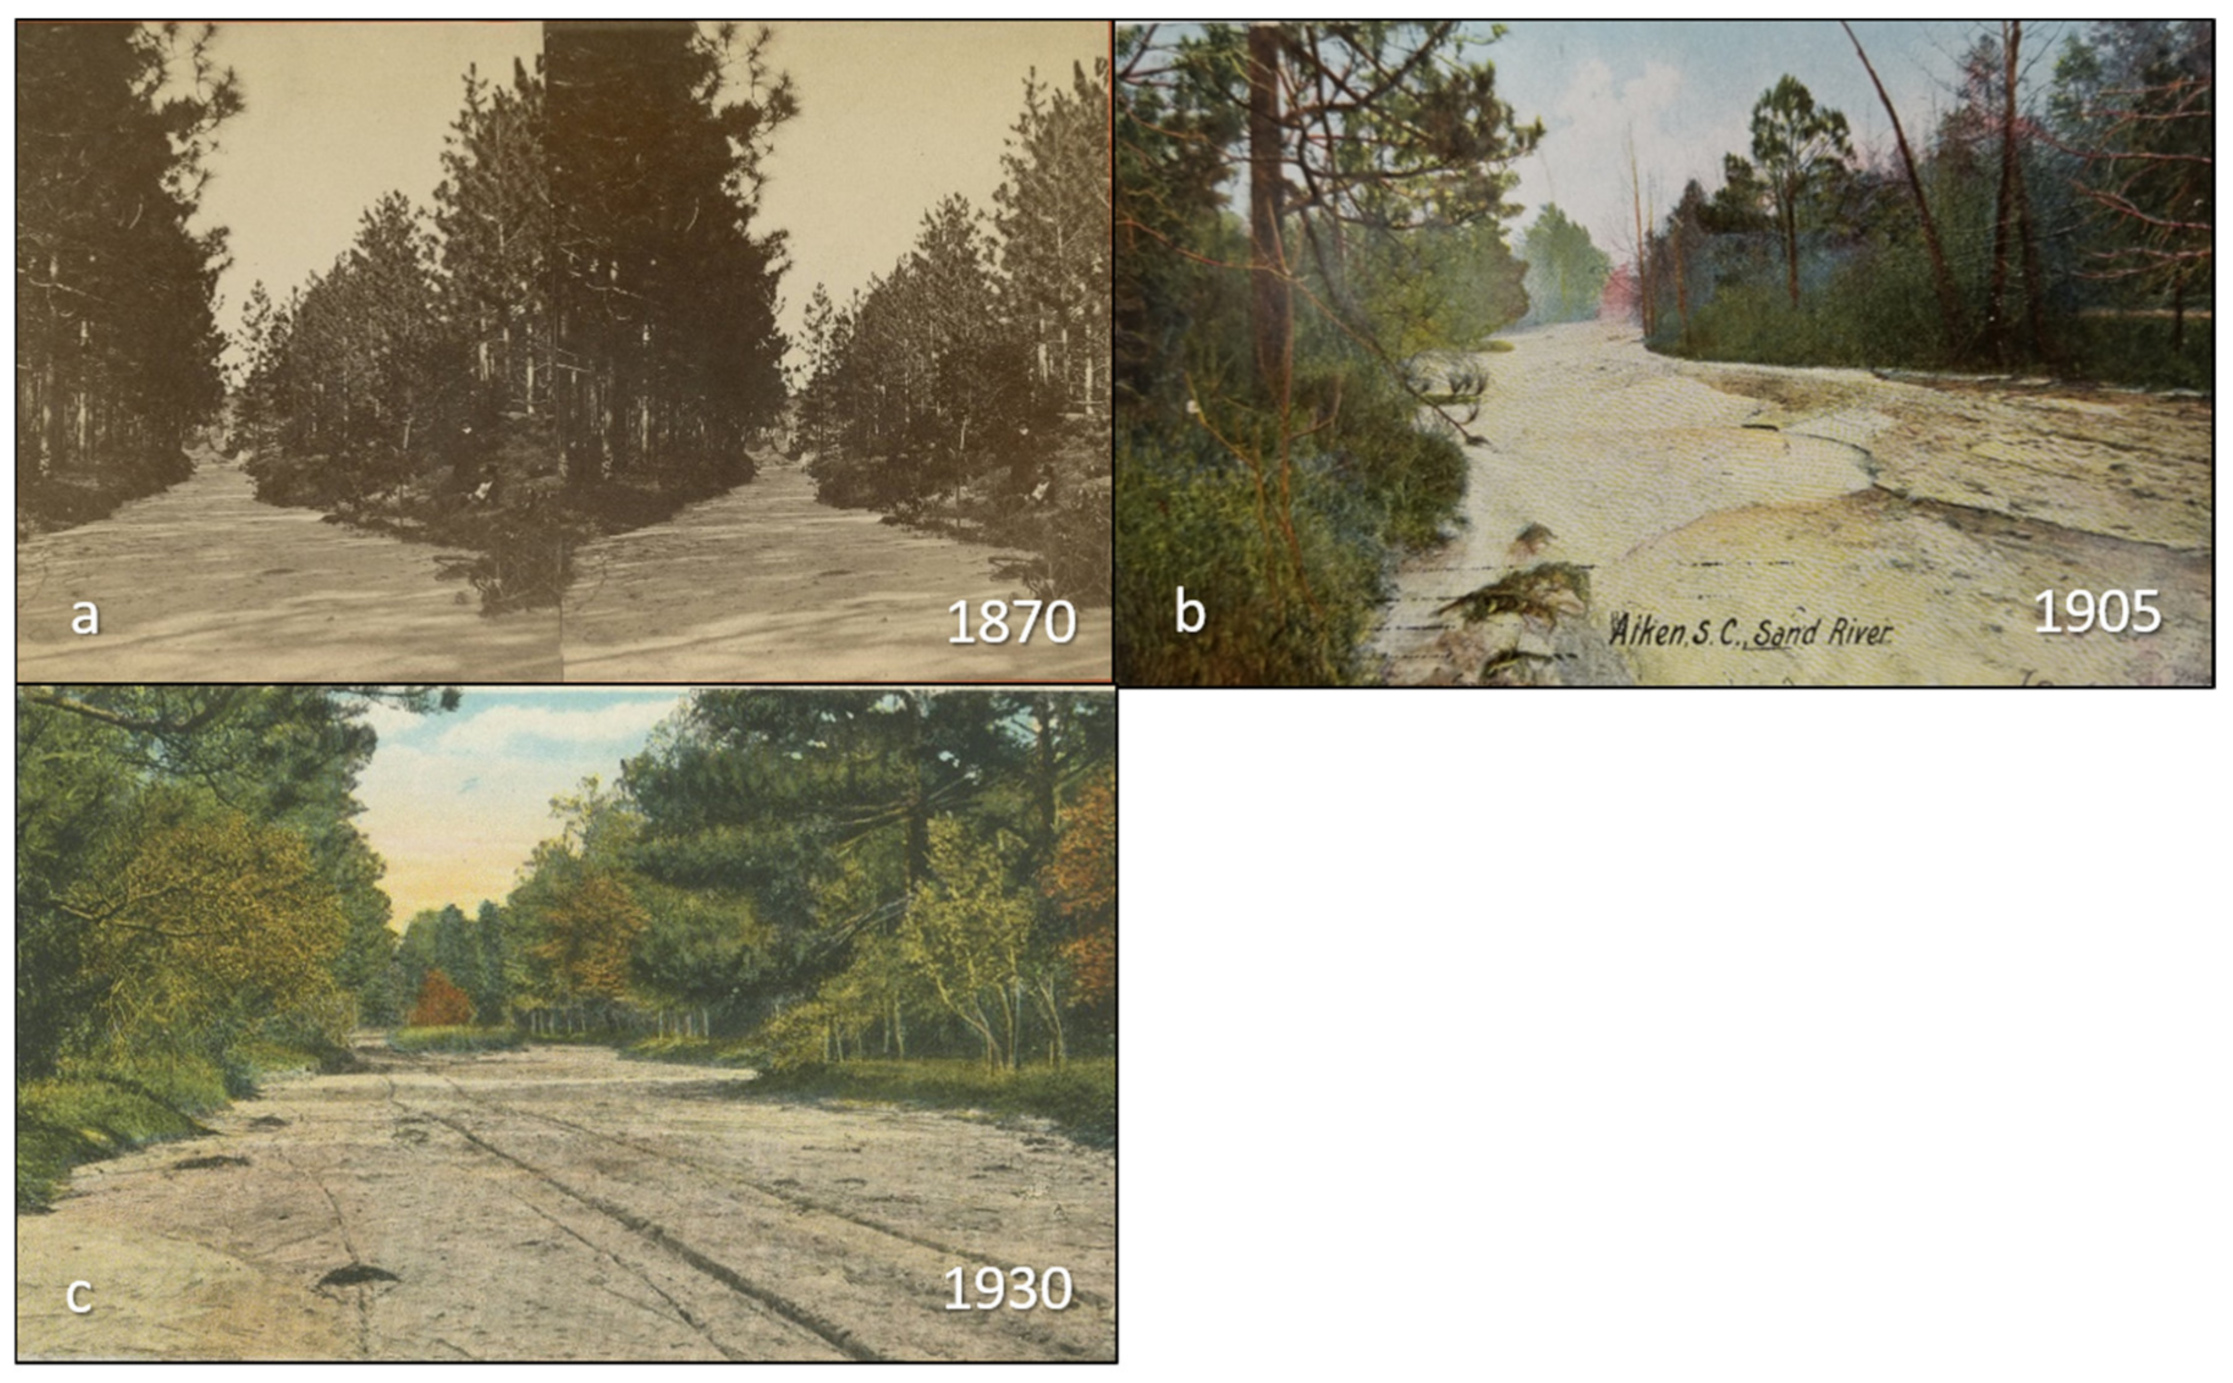
From 1870 to 1930, the Sand River was characteristic of a shallow stream with a width and depth of ~6 and 1 m, respectively (Figure 2a–c). The images do not reveal any obvious change in the overall channel morphology over the 60-year period, and this suggests that there was no major disturbance to the system up until 1930. This period of stability was interrupted, however, by rapid urban development arising from a boom in economic growth associated with establishment of the Savannah River Nuclear power plant in the late 1940s. By the early 1950s, roughly two thirds of the natural watershed had been sold for timber and real estate development [68]. The epicenter of this urban growth was Aiken’s downtown business district, situated within the Sand River’s natural drainage area.
The rapid increase in watershed urbanization had a profound impact on the hydrology of the river system and increased the demand for stormwater management to route rainwater away from the downtown district. A network of stormwater drainages was constructed from 1955 to 1956 [69,70], and this culminated in a network of artificial drainage pipes that routed rainwater runoff directly to the Sand River channel head. The immediate impact of this effort was a sharp increase in the flow discharge at the channel head, as more water rushed into the channel at a much faster rate. These issues were exacerbated over the next few decades as watershed imperviousness increased [69,70], further increasing the flow energy at the channel head and enhancing channel erosion. By 1970, the natural headwaters of the Sand River were being gorged by energetic, erosive stormwater flows with each passing rainstorm [69].
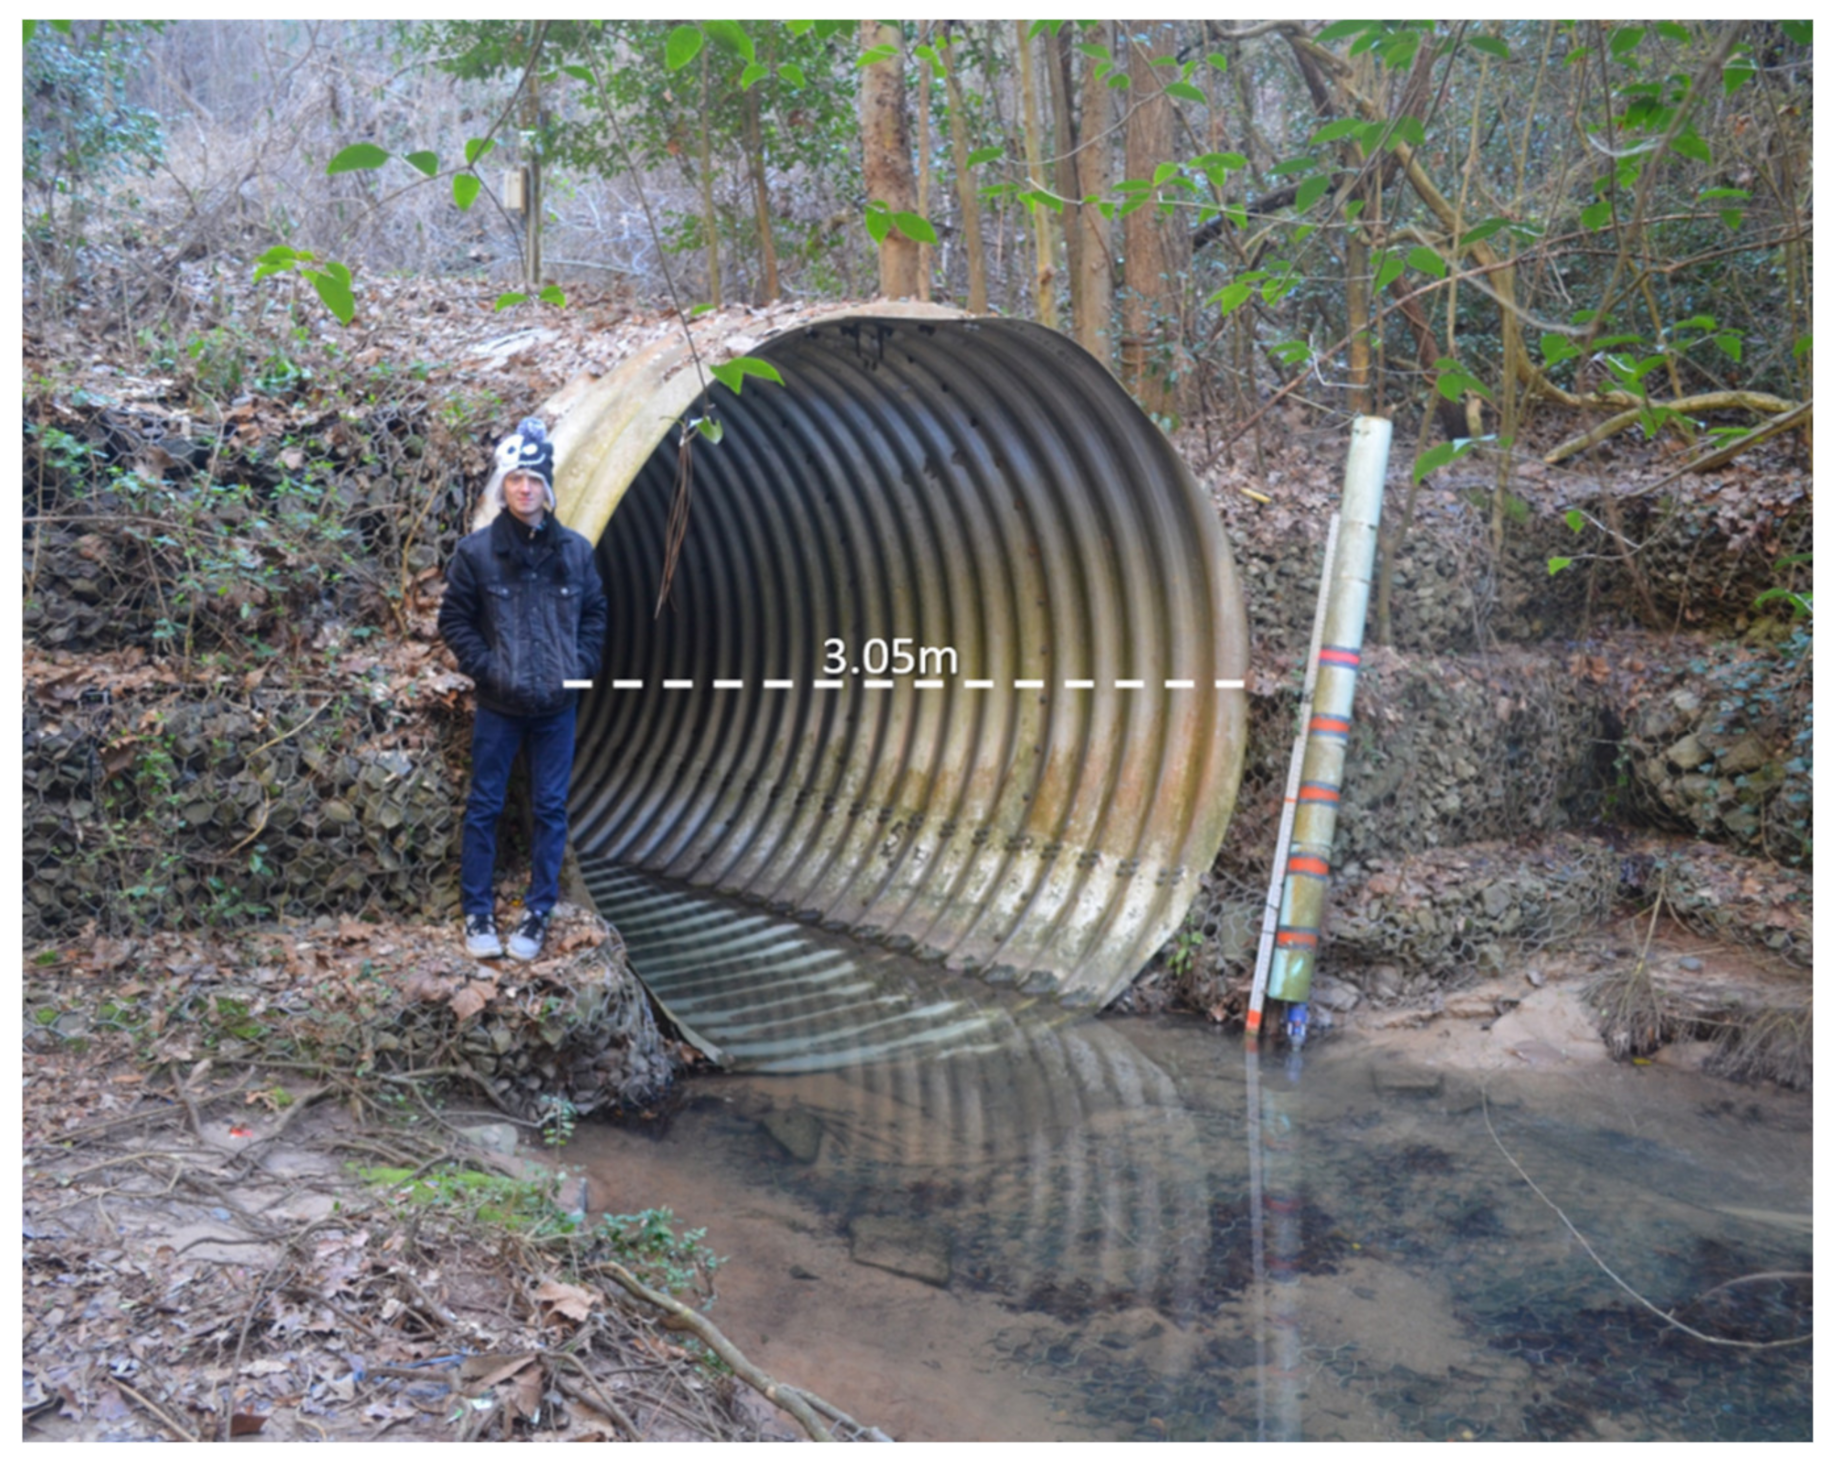
Over the next few decades, erosion of the channel resulted in a deeply incised canyon that threatened the primary road used to access the Hitchcock Woods, a 2000-acre urban forest preserve (Figure 1). In 1992, the network of stormwater drainages distributed throughout the city limits were connected to a 3.05 m diameter outfall pipe, which was laid onto the channel bed and extended 100 m downstream of the Hitchcock woods access way. The outfall pipe was laid onto the canyon bed and the 100 m reach of channel between the access way and the pipe mouth was filled and covered with a vegetative layer (Figure 3). At the same time, the channel bed and walls, along the first 100 m downstream of the pipe mouth, were lined with gabion (erosion-resistant rock lining held by wire mesh) to help dissipate the energy of flows entering the natural channel bed. Essentially, in 1992 the natural headwaters of the Sand River were replaced with a major stormwater outfall pipe (Figure 3).
Today, the Sand River is described as a cohesive, ephemeral river channel that drains a 9.0 km2 area inclusive of the central business district of Aiken and adjacent suburban communities (Figure 1). The Sand River study reach begins at the natural channel bed just downstream of the outfall pipe and extends over the next 600 m (Figure 1). Although the average amount of rain falling on the Sand River watershed has not changed much over the past century [71], larger quantities of rainwater are delivered to the channel and at a much faster rate due to watershed urbanization. These intermittent flows rush down the channel in brief, albeit destructive pulses with each passing rainstorm. The river meanders through a deeply incised canyon with widths and depths of up to 35 m along upstream reaches (Figure 4a) near its headwaters, narrowing and shallowing to ~10 m in the downstream direction. The canyon is composed of unconsolidated Late Cretaceous Eocene fluvial and deltaic sediments [51,72]. Beyond the gabion canal, the natural channel banks consist of mostly quartz sand with interstitial silt and clay throughout [51] which cause the banks to be cohesive [5,72]. Recurring bank failures primarily due to undercutting of the channel (Figure 4b) and disconnection to the floodplain suggest that the ephemeral study reach is in its active widening state of channel evolution [30,51].

3. Materials and Methods

3.1. Watershed Urbanization

Century-scale changes in urbanized watershed area were assessed with a series of historical maps, aerial photographs, and images. First, a stereopair image from 1870 (Figure 2a), and postcard images from 1905 (Figure 2b) and 1930 (Figure 2c) provided an assessment of the pre-urbanized channel. This set of historical images showed no apparent change in the overall channel morphology from 1870 to 1930, indicating that the Sand River was not undergoing major alteration in response to natural or human activity, up until 1930. Therefore, 1930 was set as the pre-disturbed reference condition [73] of the channel. From there, a series of georeferenced topographic maps and aerial photos were obtained from the Nationwide Environmental Title Research website (https://netronline.com) for years 1930, 1992, 2002, and 2012. Then, the georeferenced images were brought into ArcGIS to estimate changes in the extent of urbanized lands within the watershed for each year. The percent change in urbanized area for the periods 1930–1992, 1992–2002, and 2002–2012 was calculated. These time intervals were selected because they corresponded to (1) the time interval following pre-disturbed channel conditions; (2) post-outfall pipe conditions; and (3) active, decadal-scale channel adjustment. Hence, this approach provides a holistic assessment of cohesive channel response to human impacts in that it captures the channel morphology before and after watershed urbanization.

3.2. Lidar DEM

A light detection and ranging (lidar) survey of the Sand River was conducted for Aiken County by the U.S. Geological Survey (USGS) in 2012. The ground returns of the lidar dataset had a nominal post spacing of 1.4 m and a horizontal and vertical accuracy of ±0.18 m. The ground returns point datasets were downloaded from the USGS website (https://catalog.data.gov/dataset/usgs-lidar-point-cloud-sc-6county-aiken-2012-8700-02-las-2017) and interpolated onto a 1 × 1 m gridded digital elevation model (DEM) using ArcGIS. The long-channel profile of the 600 m ephemeral reach was extracted from the DEM using the Interpolate Line geoprocessing tool in ArcGIS. Then, the profile was used to determine bed elevations, north and south valley bank elevations, and channel slope.

3.3. Channel Width, Depth, and Volume

The lidar DEM was used to reconstruct the channel cross-section profiles of Julian and Torres [51], who surveyed the channel cross sections at 150, 290, 425, and 600 m downstream of the outfall pipe in 2002. These four locations were selected because they were the best sites where the channel banks were exposed and there was little to no vegetation. Furthermore, at the 150, 290, and 425 sites, there were evidences of active widening (undercutting and recent bank failures), and the 600 m location was expected to be stable and thought to represent the start of the “zone of transport” [51]. The vertical datum of the 2002 profiles was set by the active channel width (ACW) [51]. The active channel is described as the upper limit of the channel being actively shaped by prevailing flows [67]. This was determined through field observations of the lower limit of permanent vegetation along the channel banks [51,67]. Then, the active channel bank height was marked for each transect by driving 0.5 m lengths of steel rebar into each channel bank.
The Interpolate Line tool in ArcGIS was used to extract the full valley cross-channel profiles from the 2012 lidar DEM at all transect sites. To facilitate a comparison of the 2002 and 2012 cross-channel profiles, a field survey was conducted to locate the steel rebar markers installed by Julian and Torres at each transect location. All were successfully recovered and the maximum and average channel depths below the rebar markers was measured with a stadia rod. The maximum channel depths were, then, used to establish the vertical limit of sub-profiles extracted from the full channel valley profiles. Then, the 2002 and 2012 profiles were compared to determine decadal-scale changes in channel width and depth over the 20-year interval.
Then, the volume of the pre-outfall pipe canyon was estimated using three-dimensional (3D) Analyst tools in ArcGIS. Specifically, the Surface Volume tool was used to estimate the volume of channel below the ground elevation of the infilled reach between the outfall pipe mouth and the Hitchcock Woods access way. Then, using the gabion bed elevation as the vertical datum, the same approach was used to estimate the channel volume for the 600 m reach downstream of the outfall pipe and above the gabion bed elevation. These two values were, then, combined to approximate the total volume of sediment removed from the Sand River channel from 1930 to 1992. Similarly, with the gabion elevation as a vertical datum, the downstream channel volume downstream of the outfall pipe and below the gabion bed elevation was estimated to determine the total volume of sediment eroded from the channel from 1992 to 2012. Then, the volume estimates were divided by their respective time intervals to estimate sediment flux out of the Sand River canyon from 1930 to 1992 and from 1992 to 2012. Altogether, our approach provided a two-dimensional (2D) and three-dimensional (3D) context for assessing cohesive channel response to watershed urbanization across a range of spatial and temporal scales.

4. Results

4.1. Watershed Urbanization

Table 1 summarizes the watershed area and percent change in urbanized extent for 1930, 1992, 2002, and 2012. The time interval from 1930 to 1992 saw the greatest increase in urbanized watershed area. Specifically, during the 62-year period, the urbanized area increased from 3.5 to 8.11 km2, at a rate of 7 km2 per year, resulting in an increase of 131.7% of its initial size (Table 1). From 1992 to 2002, the extent of urbanized areas had grown to 8.8 km2, or by 8.5% over the 20-year period, yielding an urbanization rate of 3.4 km2 per year. From 2002 to 2012, the urbanized watershed area increased to 9.0 km2, a 2.3% increase over the 10-year period, with an urbanization rate of 2 km2 per year. Altogether, land use change within the Sand River watershed resulted in a 157% increase in the total urbanized watershed area from 1930 to 2012 (Table 1).

4.2. Lidar DEM

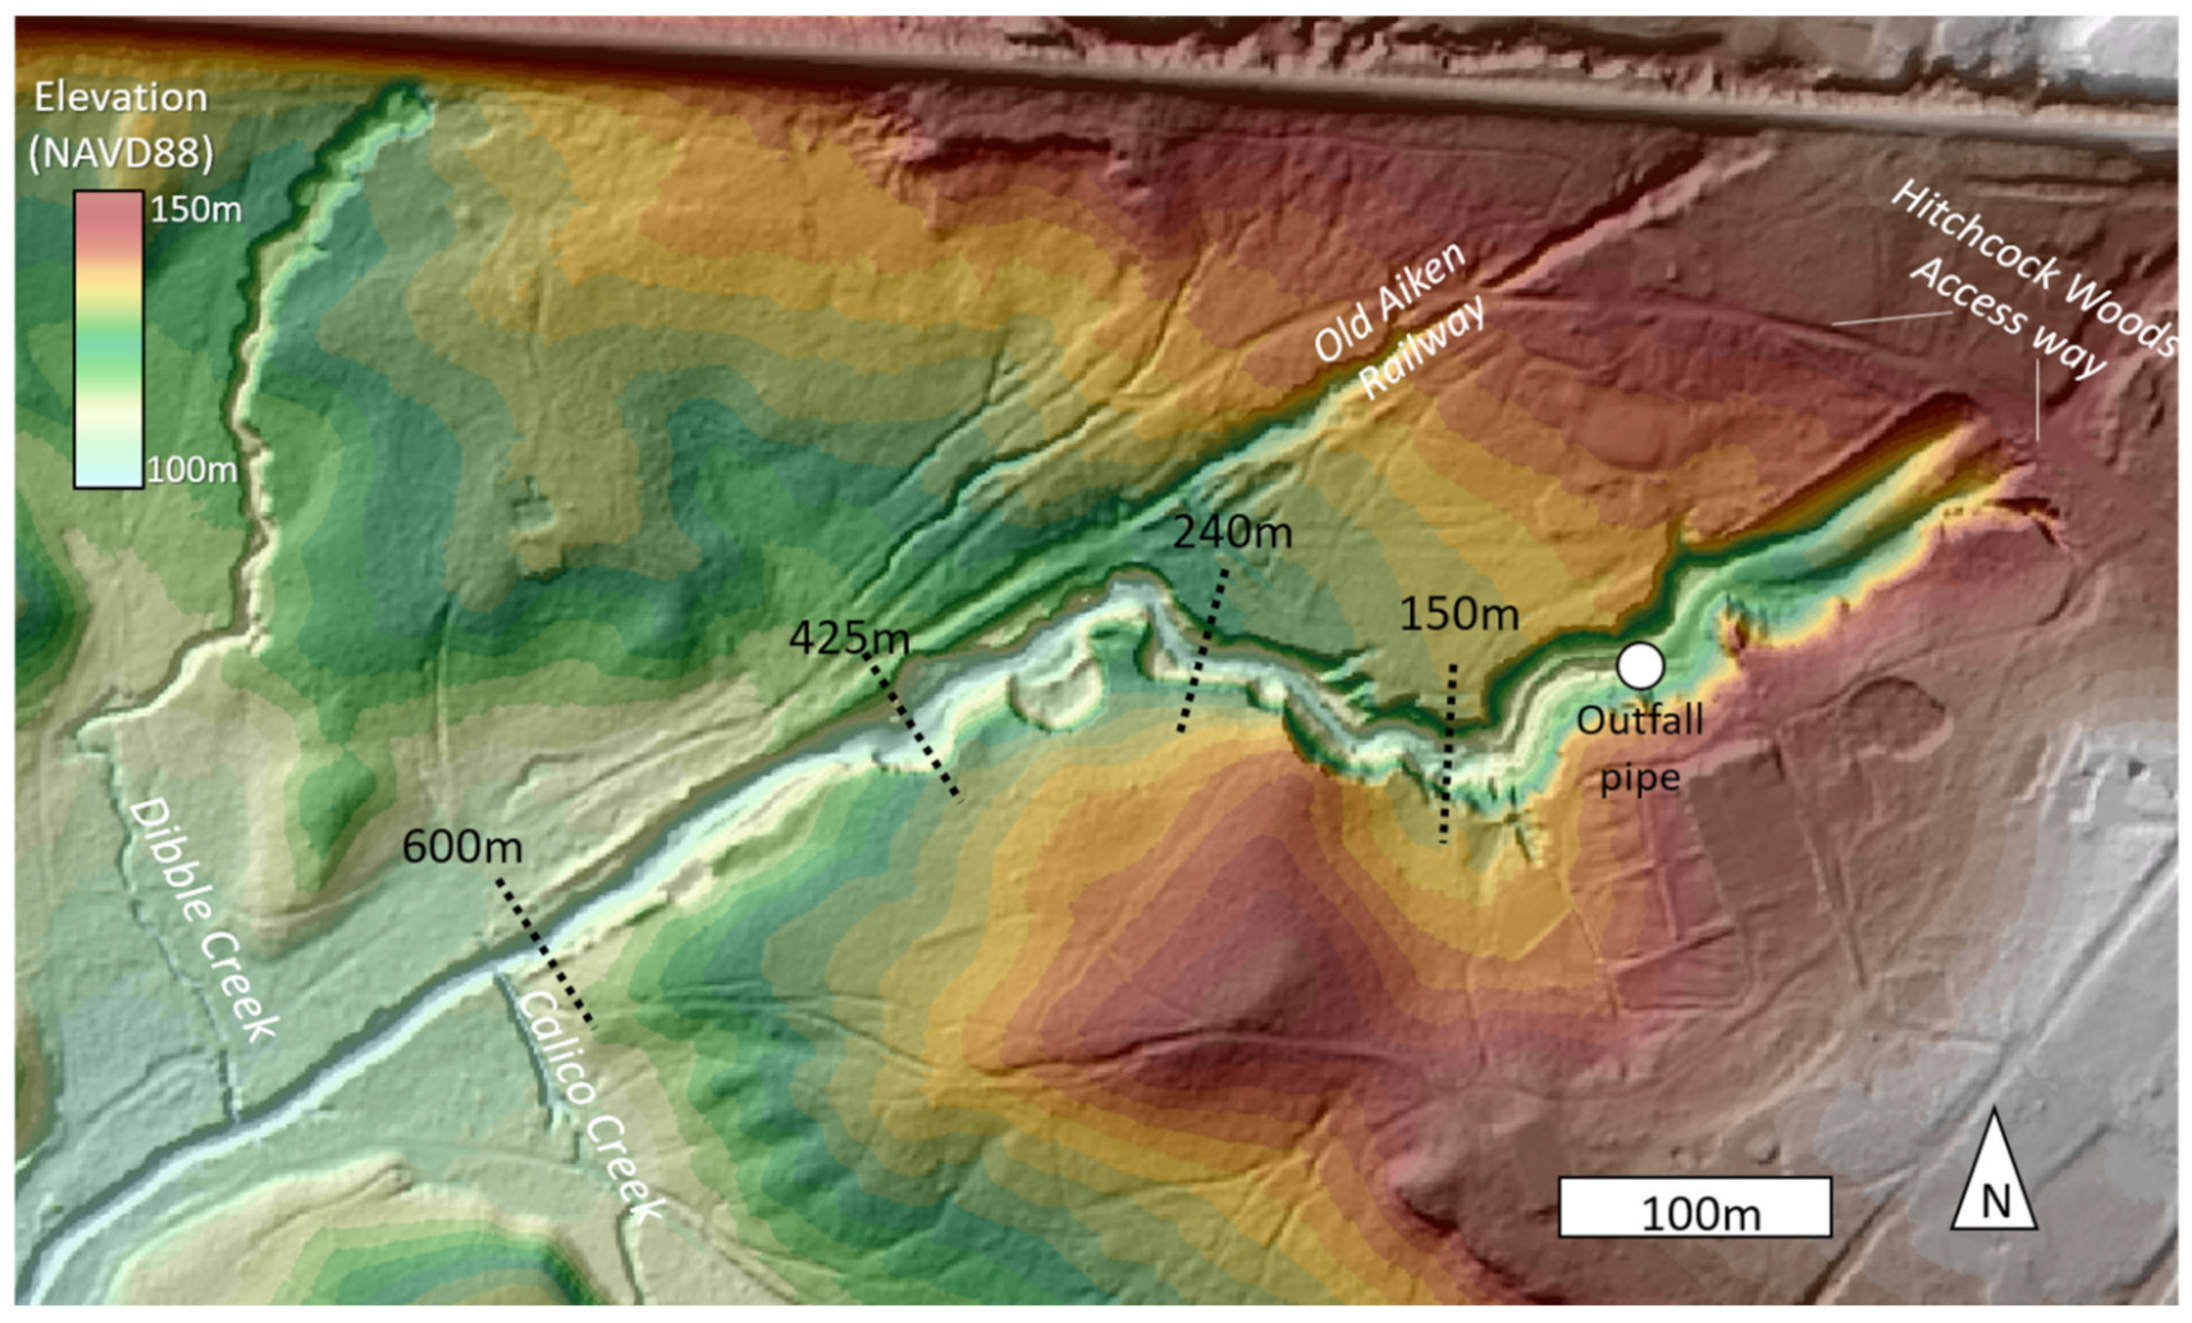
The 2012 lidar DEM highlights the 600 m ephemeral reach of the Sand River, and other less obvious surface features. For instance, the DEM reveals a linear embankment running roughly parallel to, and converging with, the northern bank of the Sand River ~300 m downstream (Figure 5). This feature is associated with the Aiken Inclined Plane [74], as evident by field observations of railroad tracks belonging to the South Carolina Canal and Railroad Company, c. 1839–1852 [74], which have been excavated by channel erosion. The DEM also highlights two tributaries of the Sand River, i.e., Dibble Creek and Calico Creek (Figure 5), which are also experiencing incision and widening in response to recent land use change.
The DEM reveals that the 600 m ephemeral canyon has a maximum valley elevation of 126 m (all elevations referenced to NAVD88), decreasing to 105 m at 600 m downstream (Figure 5). The valley width is greatest near the upstream outfall pipe where the distance between north and south valley banks is 35 m. Valley width decreases in the downstream direction, reaching 5 m at the confluence of Calico Creek (Figure 5). The first 100 m of the channel corresponds to the infilled reach of the pre-outfall pipe canyon. The atypical shape of this channel reach is attributed to the infilling of the canyon when the outfall pipe was installed in 1992. Downstream of the outfall pipe, the modern canyon tends to meander along the first 300 m, becoming straighter in the downstream direction (Figure 5).

4.3. Long-Channel Profile

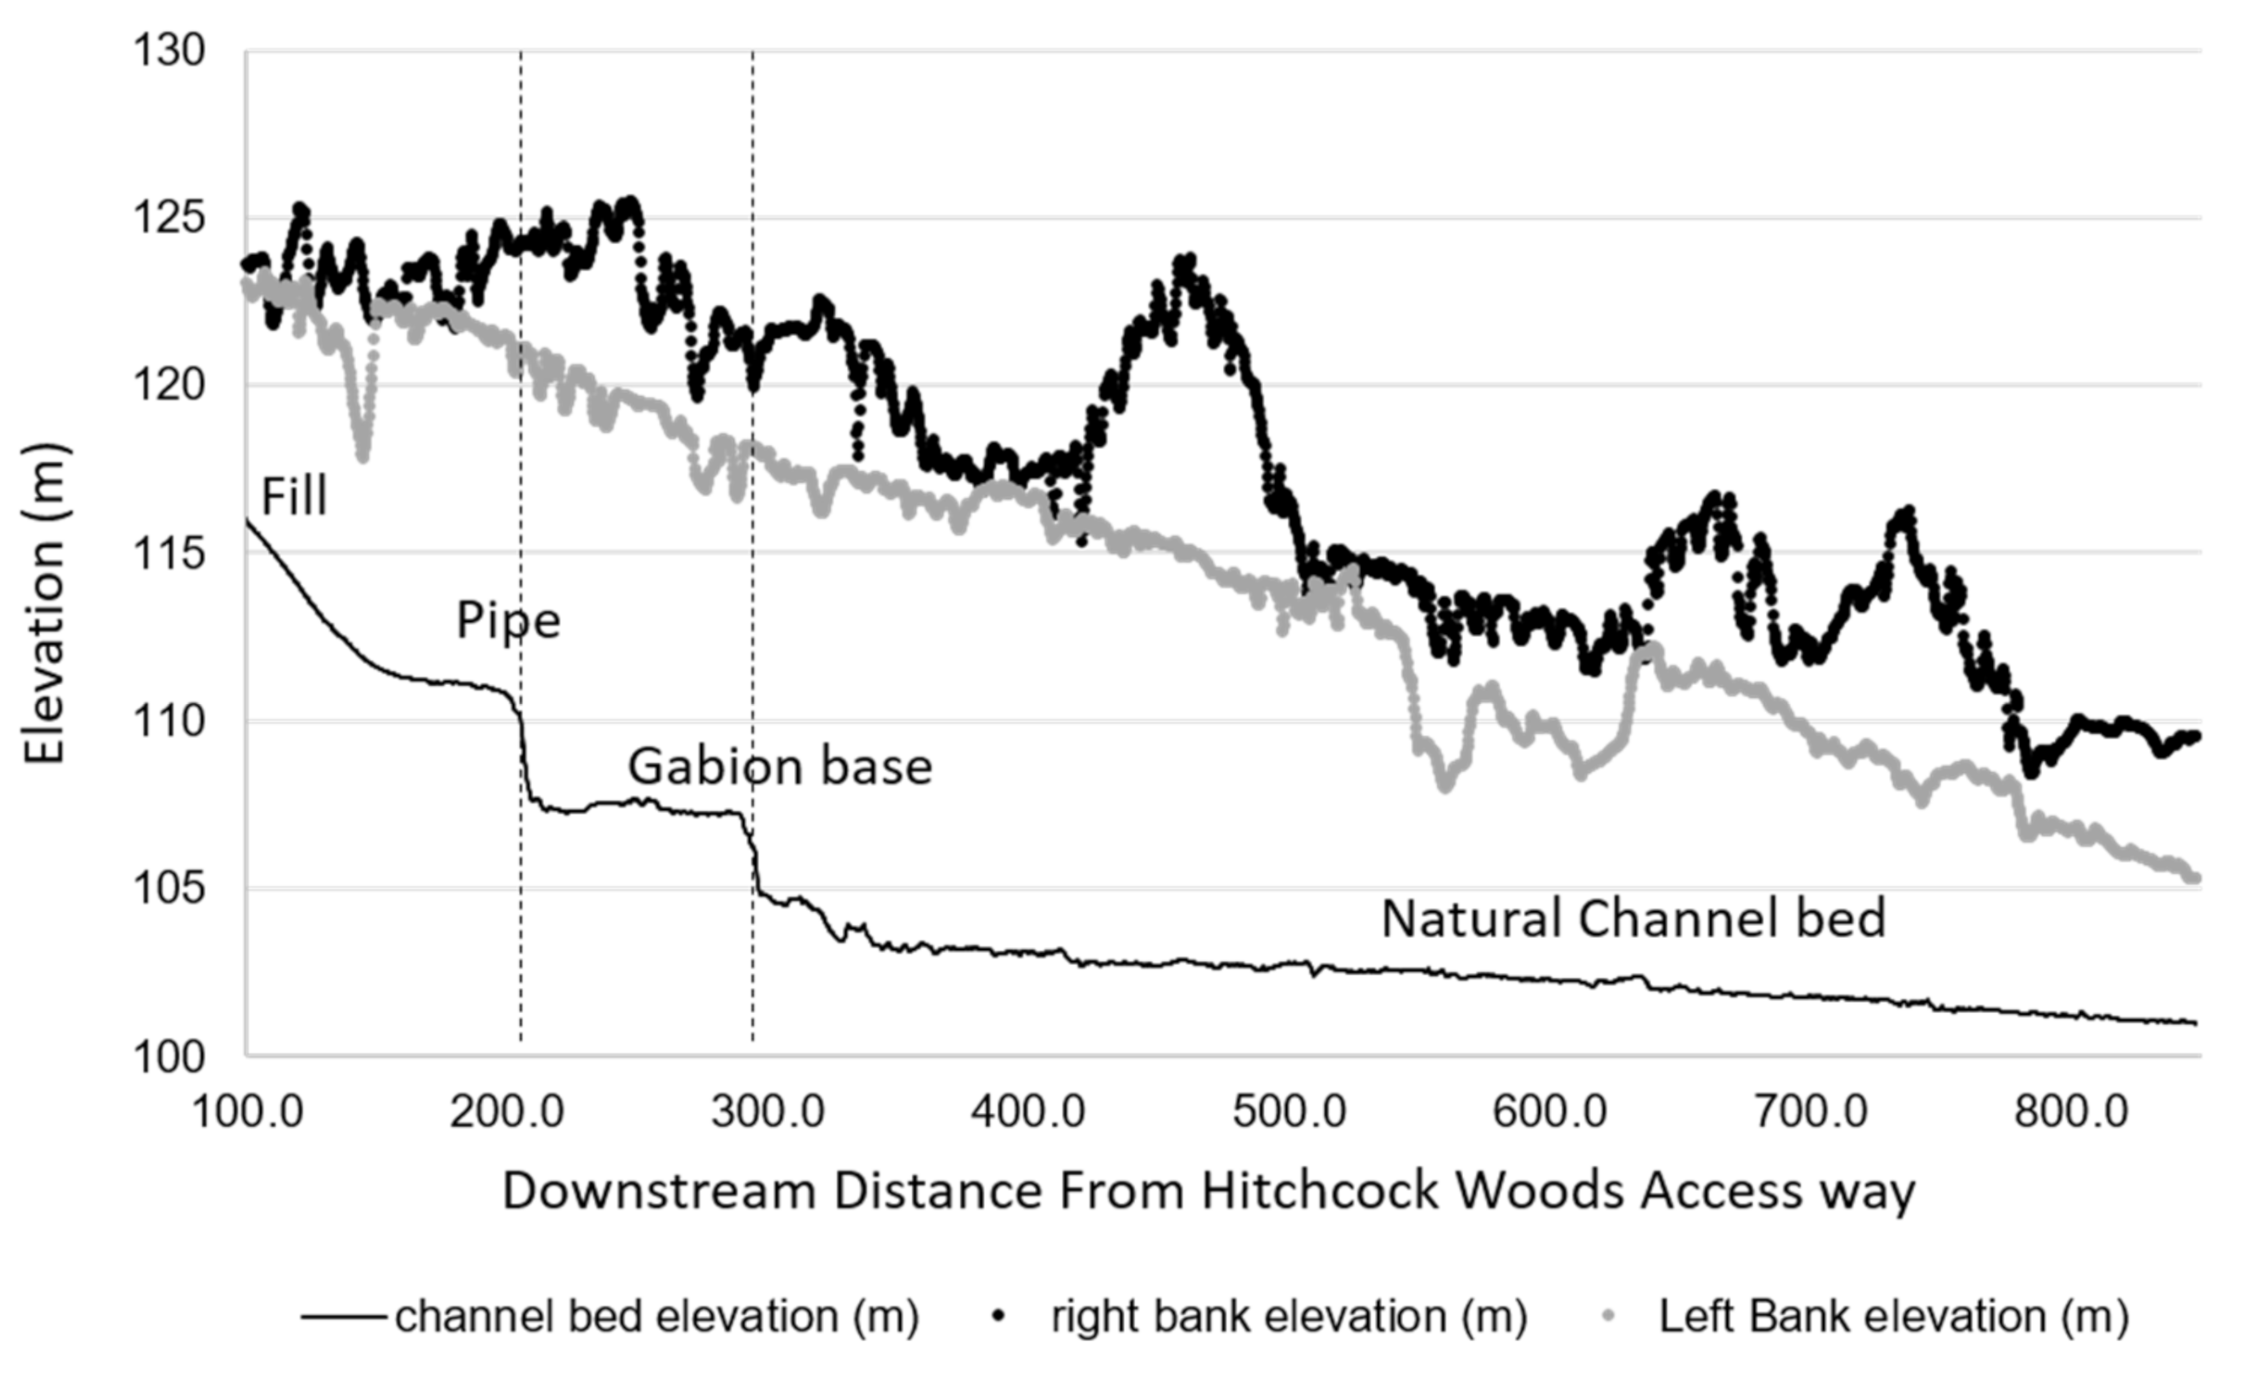
Figure 6 shows the long-channel profiles of the north and south valley banks, and channel bed for the 600 m ephemeral reach. The south valley bank elevations range from 122 m to 109 m over the 600 m study reach, yielding a slope of 0.021. The north valley bank is relatively lower than the south, with a maximum and minimum elevation of 123 and 105 m, respectively, yielding a slope of 0.03. Channel bed elevations range from 116 m at the upstream limit of the infilled channel to 101 m downstream, where the valley bank elevation eventually converge with the channel bed (Figure 6).
This general view of the long-channel profile is interrupted by two abrupt breaks in channel bed elevation. The first occurs at 200 m downstream and is associated with the transition between the filled channel reach and the opening of the outfall pipe at the start of the gabion lined canal (Figure 6). The second occurs at 300 m downstream and marks the transition between the gabion canal and the natural channel bed (Figure 6). These two breaks in channel bed elevation highlight channel incision that occurred from 1930 to 1992, and from 1992 to 2012, or pre- and post-outfall pipe installation, respectively. The bed elevations along the natural channel reach between 300 and 600 m downstream range from 105 to 100 m, yielding a slope of 0.008.

4.4. Channel Width and Depth

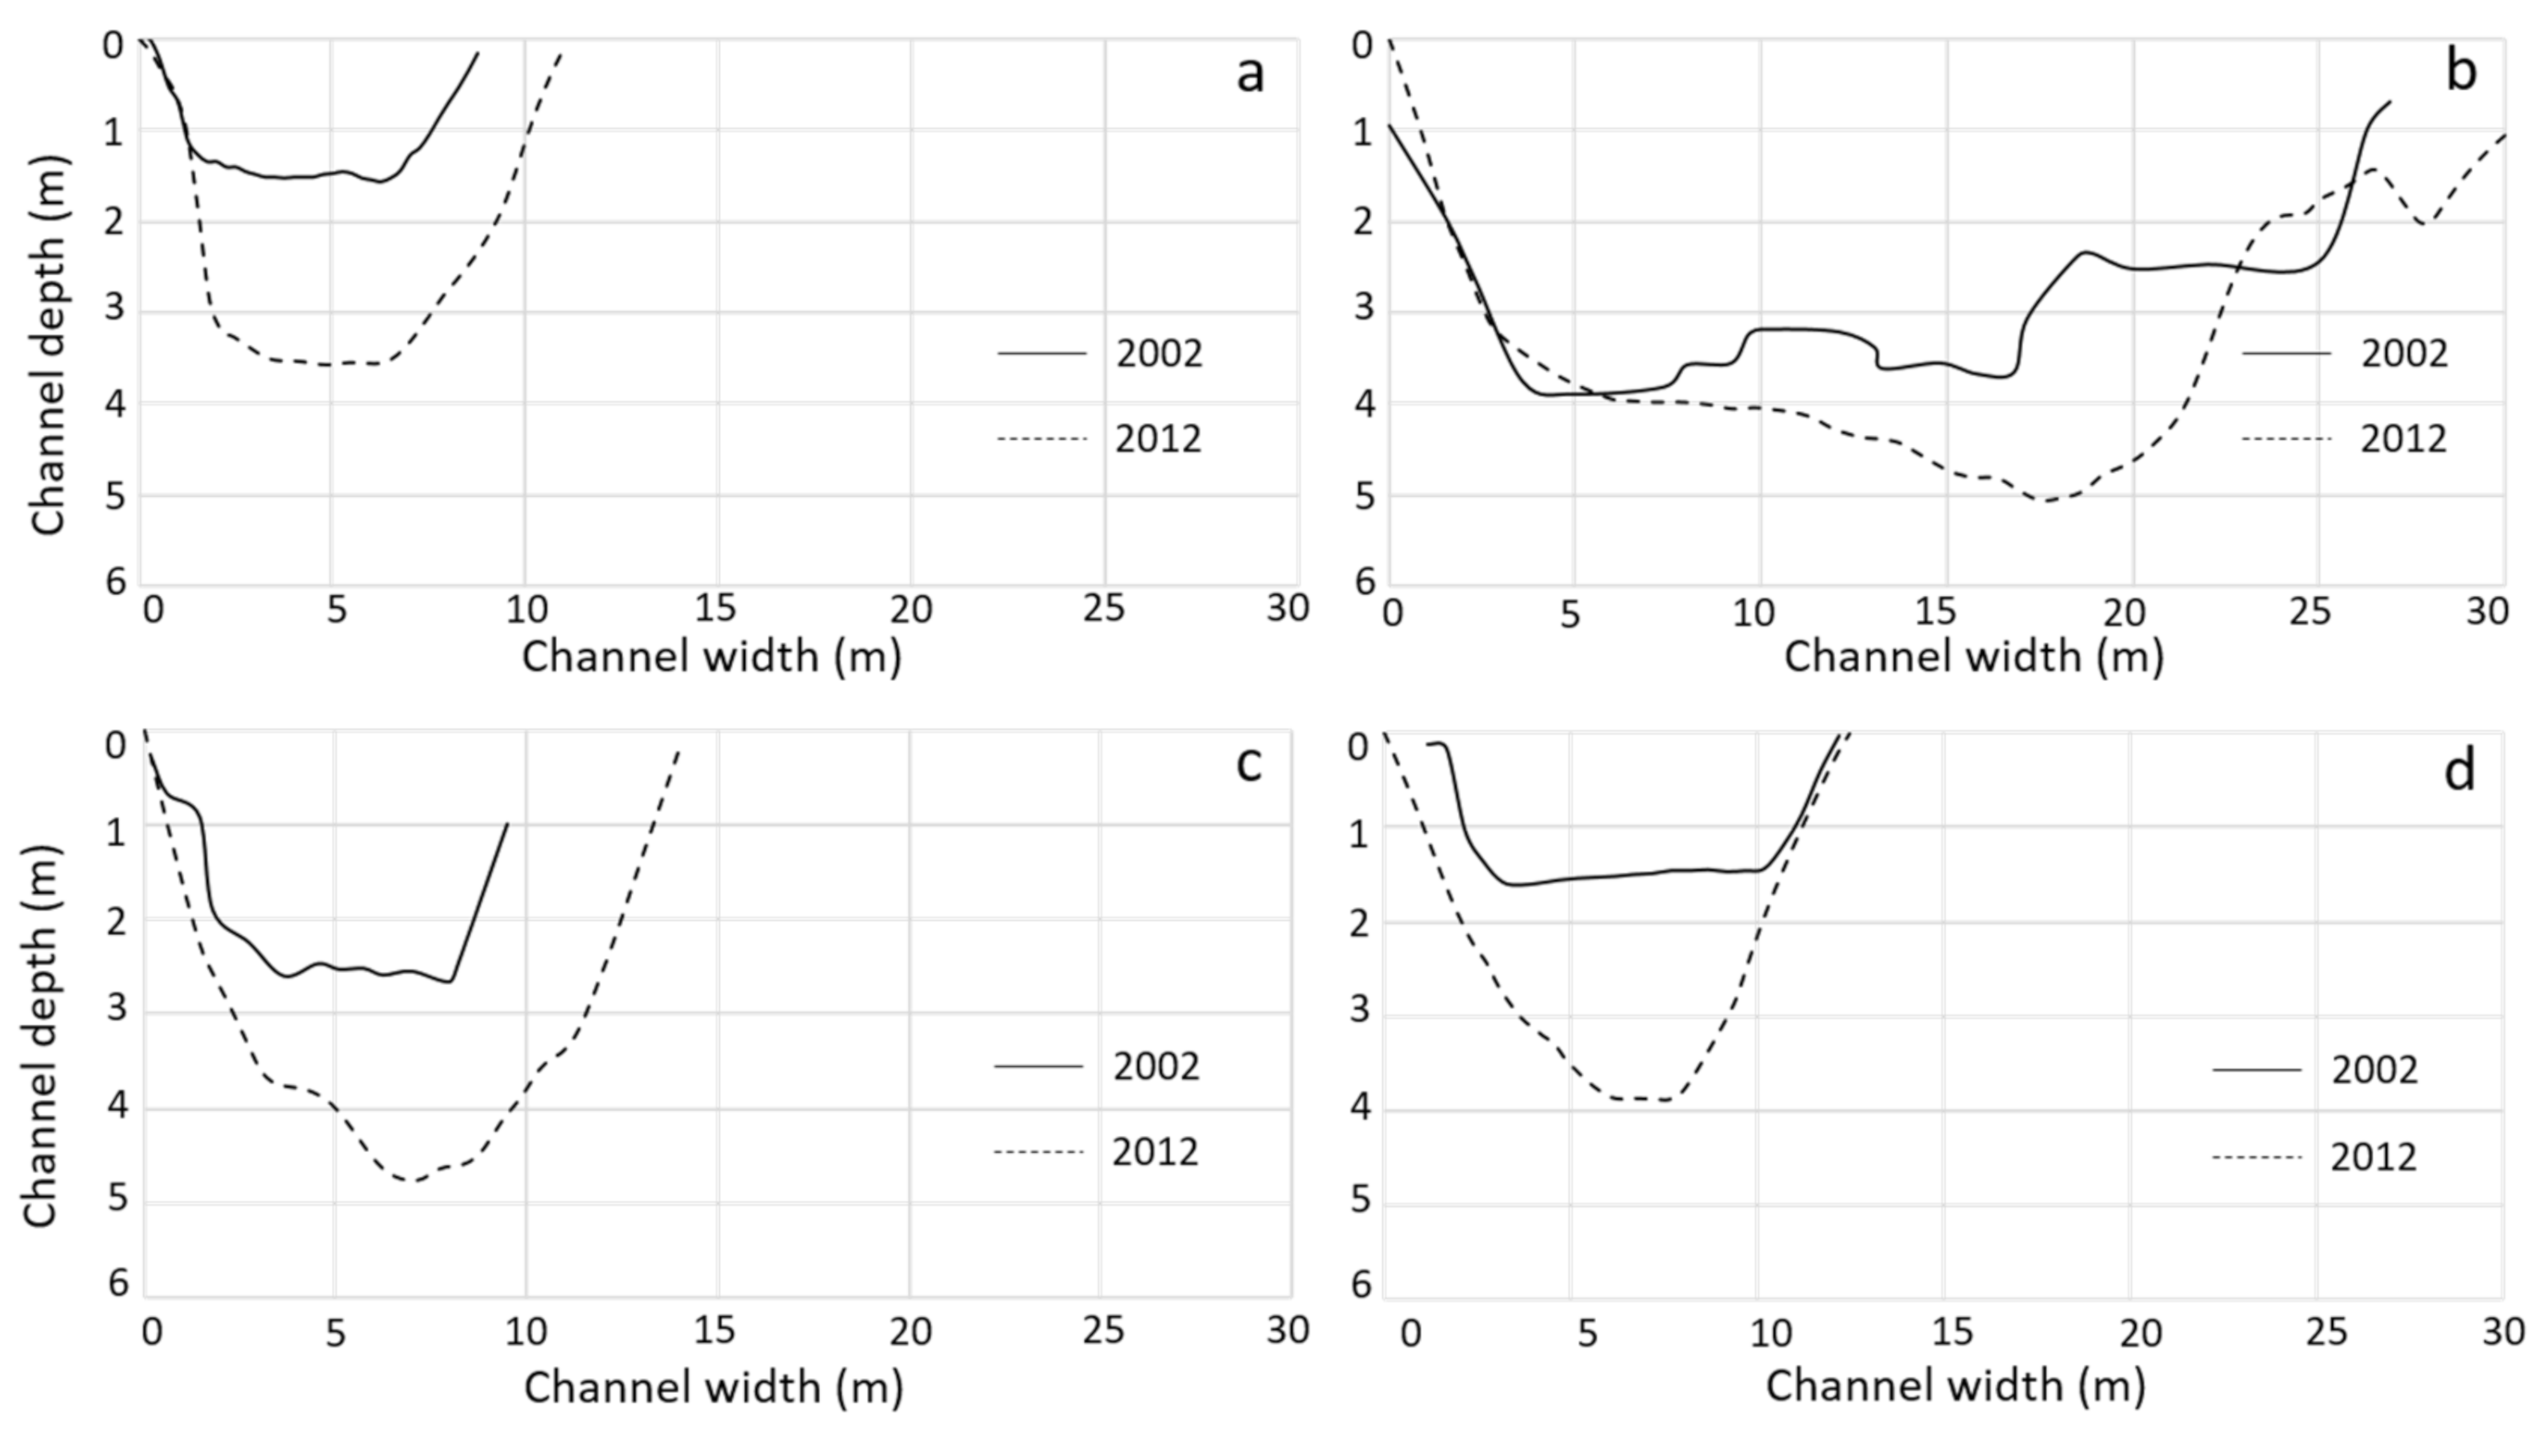
The 2002 and 2012 cross-section profiles are shown in Figure 7. At 150 m downstream of the outfall pipe, the channel width is 11 m, and the average depth is 2.42 ± 1.23 m. At 240 m downstream, channel width is 14 m and is associated with an active cut-bank (Figure 7). The mean depth along the 240 m cross-section profile is 3.17 ± 1.35 m. The channel is widest at 425 m, where the bank-to-bank distance is 30 m due to the presence of an active cut-bank. The average depth along the 425 m profile is 3.16 ± 1.47 m. At 600 m downstream, the channel width is 12.4 m, with an average depth of 2.38 ± 1.28 m.
Comparing the 2002 and 2012 cross-section profiles reveals channel widening and deepening at all transect locations (Figure 7). Specifically, the channel width increased by 2, 4, 3, and 1 m at 150, 240, 425, and 600 m, respectively. More often than not, the channel widening was associated with erosion of the right (southern) bank (Figure 7). The comparison also reveals incision, or deepening, of the channel over the 10-year period. For instance, the average depth at 150 m increased from 1.14 to 2.43 m. Likewise, average depths increased from 1.94 to 3.17 m at 240 m downstream (Figure 7). At 425 m, the average depth increased from 2.85 to 3.16 m. At the 600 m site, the average channel depth increased from 1.21 to 2.38 m. This 2D assessment reveals that, on average, the active channel of the Sand River canyon widened by 2.5 m from 2002 to 2012. At the same time, channel incision occurred at all transect sites over the 10-year period, albeit at a lesser extent than changes in channel width.

4.5. Volume Sediment Flux

The volume of the canyon above the gabion base elevation and including the infilled pipe reach is 5.8 × 10⁵ m3 (Table 2). Hence, the estimated volume flux of sediment out of the Sand River, from 1930 to 1992, was 9354 m3/yr. Similarly, the volume of the canyon between the base of the gabion canal and the natural channel bed was 4.98 × 10⁴ m3, yielding a volume flux rate of 2490 m3/yr associated with erosion of sediment out of the channel from 1992 to 2012 (Table 2). Altogether, the 3D assessment reveals that a total volume of 6.3 × 10⁵ m3 of sediment has been eroded from the Sand River canyon over the 82 years in response to watershed urbanization. Moreover, sediment flux estimates, for the time interval from 1992 to 2012, highlight continued erosion, albeit at a slower rate, in the last 20 years of the study (Table 2).

5. Discussion

Humanity has a longstanding relationship with rivers and the water resources they provide. For hundreds of thousands of years, humans have benefited from rivers for food and water needs, and also for navigation [75]. More recently, our interactions with rivers and watersheds have expanded to resource extraction and energy supply [14], and manipulation of watersheds to accommodate urban development [35,36]. Even more recently, the post-industrial revolution period from ~1950 to the present is referred to as “the Great Acceleration” due to an exponential rise in human population and associated increase in human impacts on natural systems [76]. In the case of rivers and watersheds, this has led to a global marked increase in water quality issues, declining biodiversity, and stream channel degradation [29]. The Sand River canyon represents an extreme example of the profound influence humans can have on a natural system. Specifically, we have shown that the Sand River has deepened by up to 35 m below its original channel bed elevation in response to accelerated watershed urbanization that peaked from 1930 to 1992.
While the morphological response of river channels to watershed urbanization has been widely recognized, our understanding of the associated magnitudes, rates, and controls is largely limited by sparse data and anecdotal information [50], and this is particularly true for the Sand River. In fact, this is the first study to quantify the morphological response of the Sand River to a century of land use change within the upstream watershed. Our poor constraint on processes and associated rates of channel response to natural and human activity is further confounded by the scarcity of studies on urbanization effects in cohesive rivers. Hence, we contend that our study is unique in that it (1) provides an assessment of channel morphology prior to land use change impacts and (2) provides a multi-decadal assessment of the rates and spatial scales of cohesive channel adjustment to accelerated urbanization within the watershed. The Sand River long-channel profile reveals a 20 m drop in elevation between the upstream infilled reach and the base of the gabion canal (Figure 6), revealing that the most dramatic morphological adjustment occurred in response to a 131% increase in urbanized watershed area from 1930 to 1992. The long-channel profile also reveals a 3 m decrease in elevation downstream of the stormwater outfall pipe, indicating continued adjustment of the channel, during the 20-year interval following installation of the pipe and gabion, and under relatively stable land use change conditions within the watershed (Table 1). The comparison of the 2012 and 2002 channel cross-section profiles also shows that, for the four transect sites presented here, the channel is actively incising and widening at a rate of up to 0.4 m per year. This local-scale evidence indicates that the Sand River is still adjusting land use change within the watershed that peaked more than twenty years ago. These findings are similar to those of [36] who used a combination of historical analysis and field work to assess the morphodynamic response of a semi-alluvial river channel in Canada to 70 years of urban development. They found that urbanization within the watershed peaked in the mid-1960s, triggering substantial incision and widening of the downstream river channel, and that the system continued to adjust. They concluded that the river system, which had similar bed material to the Sand River (sands and gravels with interstitial clays) had not fully adjusted to the urban regime despite over 70 years since the onset of urbanization, and over 50 years of constant land use change. Together, our findings and those of [36] suggest that cohesive channel re-equilibration in response to watershed urbanization is associated with spatial scales of up to 20–30 m and century-scale time periods. Finally, volume sediment flux estimates that sediment was removed from the canyon at a rate of 9354 m3/year from 1930 to 1992, and we attribute this to channel erosion in response to a 131% increase in urbanized watershed area. Sediment flux estimates also reveal continued erosion within the channel, albeit at a slower rate of 2490 m3/yr following installation of the stormwater outfall pipe and gabion walls in 1992. Our estimated flux rate for the time interval of 1992–2012 is in agreement with values reported by Julian and Torres, who estimated that 2800 m3 of bank material was eroded from the Sand River over a period of 14 months [51]. These findings indicate that installation of the stormwater outfall and gabion worked to decrease channel erosion rates but did not stop it completely.
Altogether, our findings reveal that the Sand River represents a cohesive, ephemeral river channel that has not yet attained a new “equilibrium shape” [9] in response to watershed urbanization that began at least 82 years ago, and which peaked over 20 years ago. We contend that the channel will continue to adjust until this balance is restored [36,44]. This assertion is consistent with other, albeit sparse, long-term datasets which suggests that a true equilibrium may only be possible after a decade- to century-long time lag, and under constant land use conditions [36,50,77]. In the case of the Sand River, ongoing morphological adjustment in response to watershed urbanization has occurred for almost a century. We have shown that, at least for the four transect sites presented here, the Sand River is currently widening at a faster rate than it is incising, indicating that the channel is in the third phase of channel evolution [44] at 80 years after initial disturbance, and after 20 years of stable land use conditions within the watershed. Continued stability with the watershed may allow the channel to transition into the fourth and final phase of channel evolution [44], and ultimately a new state of dynamic equilibrium. This raises new questions about what the new “equilibrium shape” might look like for the Sand River, and when such an equilibrium state might be attained. Perhaps the channel may only require minimal (<0.5 m width and depth) horizontal and vertical adjustment before reaching a new balance
Our findings on the space and time scales of channel re-equilibration to human interference have important implications for other river systems that are in earlier stages of channel re-equilibration due to land use change. For instance, [35] assessed river channel response to 30 years of land use change within the Balason and Mahananda river watersheds in India. In their case, channel narrowing and incision were the dominant responses observed for their 30-year period of records, indicating that their channel was in the second phase of channel evolution [44]. Continued land use change is likely to push the channel of [35] into the third, widening phase of channel evolution, and we have shown that this third phase could last for several decades. The information presented here also has important implications for newly established gullies that arise from the conversion of natural watershed surfaces into urban landscapes. For instance, [78] used digital orthophotography and geospatial techniques to construct the pre- and post-urbanization digital surfaces of a river basin. The stream networks generated from each digital surface revealed the emergence of urban gullies in areas adjacent to developed lands, likely due to the focused stormwater flows and lack of engineered drainages to manage runoff flows [7]. Indeed, such gullies are forming along the periphery of the Hitchcock woods (i.e., Dibble Creek and Callico Creek in Figure 5), and we speculate that these young gullies are similar to the Sand River channel during earlier stages of channel evolution. Within this context, we contend that these gullies, as well as other newly established urban gullies in other parts of the world, may be on a trajectory for substantial widening and incision over the next century should urban landscapes continue to take the place of natural watersheds.
Other factors, specifically implementation of local-scale efforts to mitigate channel erosion, could prolong the natural process of channel re-equilibration, or simply displace the issues to downstream reaches. In the case of [35], anthropogenic embankments prevented widening of the channel, and it was possible that such local erosion control efforts prolonged the transition from phase 2 (channel incision) to phase 3 (widening) [44]. It is important to note, however, that our findings on decadal-scale channel adjustment are limited to the transect locations of Julian and Torres. Hence, this study provides a general understanding of how channel conditions have changed from 2002 to 2012, and more work is needed to determine how the channel is adjusting in between these four sites. Nevertheless, the data and insights provided here have important implications for management strategies for the Sand River system. In particular, the multi-decadal sediment flux rates and morphological datasets provided here can be used to initialize and validate numerical models that can be used to predict the channel morphology associated with engineering efforts that aim at slowing or stopping erosional processes within the river channel, thereby adding scientific rigor to management strategies. Such models could also provide useful tools for predicting the channel geometry associated with the new equilibrium condition, as well as the space and time scales associated with re-equilibration under present and future land use change scenarios. This information can aid in future management and restoration decisions for the Sand River and can be generalized to evaluate cohesive channel response for other urban river systems worldwide.

Author Contributions

Conceptualization, J.G.; methodology, J.S., R.W., J.G., D.B. and C.E.D.; software, J.S.; validation, J.S.; formal analysis, J.G., J.S., R.W., C.E.D., and B.F.; investigation, J.S., J.G., D.B., and R.W.; resources, J.S. and R.W.; data curation, J.G., J.S.; writing—original draft preparation, J.S. and J.G.; writing—review and editing, J.S., C.E.D., and R.W.; visualization, J.S.; supervision, J.S.; project administration, J.S.; funding acquisition, J.S. All authors have read and agreed to the published version of the manuscript.

Funding

No external funding was provided for this work.

Acknowledgments

We would like to thank Bennett Tucker and the Hitchcock Woods, and Raymond Torres of the University of South Carolina for conversations and historical photographs that helped to pull this story together. We thank the Hitchcock Woods Foundation for providing access to the study site. We thank the SCDNR for advice on how to best utilize the lidar dataset. We kindly thank James Chassereau for generously providing field materials to this project, and J. Robert Sullivan, for helping acquire the historical documents used in this study. Critical reviews from two anonymous reviewers are also greatly appreciated.

Conflicts of Interest

The authors declare no conflict of interest.

References

  1. Cohen, J. Human population: The next half century. Science 2003, 302, 1172–1175. [Google Scholar] [CrossRef] [PubMed]
  2. Vorosmarty, C.J.; McIntyre, P.B.; Gessner, M.O.; Dudgeon, D.; Prusevich, A.; Green, P.; Glidden, S.; Bunn, S.E.; Sullivan, C.A.; Reidy Liermann, C.; et al. Global threats to human water security and river biodiversity. Nature 2010, 467, 555–561. [Google Scholar] [CrossRef] [PubMed]
  3. Lundy, L.; Wade, R. Integrating sciences to sustain urban ecosystem services. Prog. Phys. Geogr. 2011, 35, 653–669. [Google Scholar] [CrossRef]
  4. Chen, W.Y.; Li, X.; Hua, J. Environmental amenities of urban rivers and residential property values: A global meta-analysis. Sci. Total Environ. 2019, 693. [Google Scholar] [CrossRef] [PubMed]
  5. Walsh, C.J.; Roy, A.H.; Feminella, J.W.; Cottingham, P.D.; Groffman, P.M.; Morgan, R.P. The urban stream syndrome: Current knowledge and the search for a cure. J. N. Am. Benthol. Soc. 2005, 24, 706–723. [Google Scholar] [CrossRef]
  6. Zhang, L.; Nan, Z.; Xu, Y.; Li, S. Hydrological impacts of land use change and climate variability in the headwater region of the Heihe River Basin, Northwest China. PLoS ONE 2016, 11. [Google Scholar] [CrossRef]
  7. Marhaento, H.; Booij, M.J.; Rientjes, T.H.M.; Hoekstra, A.Y. Sensitivity of streamflow characteristics to different spatial land-use configurations in tropical catchment. J. Water Resour. Plan. Manag. 2019, 145. [Google Scholar] [CrossRef]
  8. Wolman, M.G. A cycle of sedimentation and erosion in urban river channels. Geogr. Ann. 1967, 49A, 385–395. [Google Scholar] [CrossRef]
  9. Hammer, T.R. Stream channel enlargement due to urbanization. Water Resour. Res. 1972, 17, 1530–1540. [Google Scholar] [CrossRef]
  10. Booth, D.B. Stream-channel incision following drainage-basin urbanization 1. J. Am. Water Resour. Assoc. 1990, 26, 407–417. [Google Scholar] [CrossRef]
  11. Bledsoe, B.P.; Watson, C.C. Effects of urbanization on channel instability 1. J. Am. Water Resour. Assoc. 2001, 37, 255–270. [Google Scholar] [CrossRef]
  12. Leopold, L.B.; Huppman, R.; Miller, A. Geomorphic effects of urbanization in forty-one years of observation. Proc. Am. Philos. Soc. 2005, 149, 349–371. [Google Scholar]
  13. Frančišković-Bilinski, S.; Bhattacharya, A.K.; Bilinski, H.; Bhattacharya, B.D.; Mitra, A.; Sarkar, S.K. Fluvial geomorphology of the Kupa River drainage basin, Croatia: A perspective of its application in river management and pollution studies. Z. Geomorphol. 2012, 56, 93–119. [Google Scholar] [CrossRef]
  14. Russell, K.L.; Vietz, G.J.; Fletcher, T.D. How urban stormwater regimes drive geomorphic degradation of receiving streams. Prog. Phys. Geogr. Earth Environ. 2020, 44, 749–778. [Google Scholar] [CrossRef]
  15. Paul, M.J.; Meyer, J.L. Streams in the urban landscape. Annu. Rev. Ecol. Syst. 2001, 32, 333–365. [Google Scholar] [CrossRef]
  16. Meyer, J.L.; Paul, M.J.; Taulbee, W.K. Stream ecosystem function in urbanizing landscapes. J. N. Am. Benthol. Soc. 2005, 35, 436–443. [Google Scholar] [CrossRef]
  17. Violin, C.R.; Cada, P.; Sudduth, E.B.; Hassett, B.A.; Penrose, D.L.; Bernhardt, E.S. Effects of urbanization and urban stream restoration on the physical and biological structure of stream ecosystems. Ecol. Appl. 2011, 21, 1932–1949. [Google Scholar] [CrossRef]
  18. Horner, R.A.; Garrison, D.L.; Plumley, F.G. Harmful algal blooms and red tide problems on the US west coast. Limnol. Oceanogr. 1997, 40, 1076–1088. [Google Scholar] [CrossRef]
  19. Hatt, B.E.; Fletcher, T.D.; Walsh, C.J.; Taylor, C.S. The influence of urban density and drainage infrastructure on concentrations and loads of pollutants in small streams. J. Environ. Manag. 2004, 34, 112–124. [Google Scholar] [CrossRef]
  20. Song, Y.H.; Lee, J.H.; Lee, E.H. Developing a reliability index of low impact development for urban areas. Water 2020, 12, 2961. [Google Scholar] [CrossRef]
  21. Grimm, N.B.; Sheibley, R.W.; Crenshaw, C.J.; Dahm, C.N.; Roach, W.J.; Zeglin, L.N. N retention and transformation in urban streams. J. N. Am. Benthol. Soc. 2005, 24, 626–642. [Google Scholar] [CrossRef]
  22. Johnson, L.; Richards, C.; Host, G.; Arthur, J. Landscape influences on water chemistry in Midwestern stream ecosystems. Freshw. Biol. 1997, 37, 193–208. [Google Scholar] [CrossRef]
  23. Zhou, T.; Wu, J.; Peng, S. Assessing the effects of landscape pattern on river water quality at multiple scales: A case study of the Dongjang River watershed, China. Ecol. Indic. 2012, 23, 166–175. [Google Scholar] [CrossRef]
  24. Schoonover, J.E.; Willard, K.W.; Zaczek, J.J.; Mangun, J.C.; Carver, A.D. Nutrient attenuation in agricultural surface runoff by riparian buffer zones in southern Illinois, USA. Agrofor. Syst. 2005, 64, 169–180. [Google Scholar] [CrossRef]
  25. Harmon, S.M.; West, R.T.; Yates, J.R. Identifying fecal pollution sources using 3M Petrifilm count plates and antibiotic resistance analysis in the Horse Creek Watershed in Aiken County, SC (USA). Environ. Monit. Assess. 2014, 186, 8215–8227. [Google Scholar] [CrossRef] [PubMed]
  26. Booth, D.B.; Roy, A.H.; Smith, B.; Capps, K.A. Global perspectives on the urban stream syndrome. Freshw. Sci. 2016, 35, 412–420. [Google Scholar] [CrossRef] [Green Version]
  27. Suren, A.M. Effects of urbanization. In New Zealand Stream Invertebrates: Implications for Management; Collier, K.J., Winterbourn, M.J., Eds.; New Zealand Limnological Society: Christchurch, New Zealand, 2000; pp. 260–288. [Google Scholar]
  28. Cole, J.N.; Miller, A.J.; Stapleton, E.; Welty, C. Quantifying spatial patterns of channel geometry and stream incision in urban drainage network. J. Hydrol. Eng. 2016, 22. [Google Scholar] [CrossRef]
  29. Whol, E. Rivers in the Anthropocene: The U.S. perspective. Geomorphology 2018, 366, 106600. [Google Scholar] [CrossRef]
  30. Schumm, S.A.; Harvey, M.D.; Watson, C.C. Incised Channels: Morphology, Dynamics, and Control; Water Resources Publications: Highlands Ranch, CO, USA, 1984. [Google Scholar]
  31. Trimble, S.W. Stream channel erosion and change resulting from riparian forests. Geology 1997, 25, 467–469. [Google Scholar] [CrossRef]
  32. Simon, A.; Rinaldi, M. Channel instability in the Loess area of the Midwestern United States. J. Am. Water Resour. Assoc. 2000, 36, 133–150. [Google Scholar] [CrossRef]
  33. Hawley, R.J.; Bledsoe, B.P. Channel enlargement in semi-arid suburbanizing watersheds: A southern California case study. J. Hydrol. 2013, 496, 17–30. [Google Scholar] [CrossRef]
  34. Chin, A.; Gidley, R.; Tyner, L.; Gregory, K.J. Adjustment of dryland stream channels over four decades of urbanization. Anthropocene 2017, 20, 24–36. [Google Scholar] [CrossRef]
  35. Mitra, S.; Roy, A.K.; Tamang, L. Assessing the status of changing channel regimes of Balason and Mahananda River in the Sub-Himalayan West Bengal, India. Earth Syst. Environ. 2020, 4409–4425. [Google Scholar] [CrossRef]
  36. Bevan, V.; MacVicar, B.; Chapuis, M.; Ghunowa, K.; Papangelakis, E.; Parish, J.; Snodgrass, W. Enlargment and evolution of a semi-alluvial creek in response to urbanization. Earth Surf. Process. Landf. 2018, 43, 2295–2312. [Google Scholar] [CrossRef]
  37. Dunne, T.; Leopold, L.B. Water in Environmental Planning; Macmillan: New York, NY, USA, 1978. [Google Scholar]
  38. Leopold, L.B. Hydrology for Urban Land Planning—A Guidebook on the Hydrologic Effects of Urban Land Use. Geological Survey Circular 554; U.S. Geological Survey: Washington, DC, USA, 1968. [Google Scholar]
  39. Morisawa, M.; LaFlure, E. Hydraulic geometry, stream equilibrium and urbanization. Adjust. Fluv. Syst. 1979, 10, 333–350. [Google Scholar]
  40. Booth, D.; Reinelt, L.E. Consequences of urbanization on aquatic systems—Measured effects, degradation thresholds, and corrective strategies. In Proceedings of the Watershed ’93: A National Conference on Watershed Management, Alexandria, VA, USA, 21–24 March 1994; pp. 545–550. [Google Scholar]
  41. Schueler, T. The importance of imperviousness. Watershed Prot. Tech. 1994, 1, 100–111. [Google Scholar]
  42. Vietz, G.J.; Sammonds, M.J.; Walsh, C.J.; Fletcher, T.D.; Rutherford, I.D.; Stewardson, M.J. Ecologically relevant geomorphic attributes of streams are impared by even low levels of watershed effective imperviousness. Geomorphology 2014, 1, 67–78. [Google Scholar] [CrossRef]
  43. Utz, R.M.; Hopkins, K.G.; Beesley, L.; Booth, D.B.; Hawley, R.J.; Baker, M.E.; Freeman, M.C.; Jones, K. Ecological resistance in urban streams: The role of natural and legacy attributes. Freshw. Sci. 2016, 35, 380–397. [Google Scholar] [CrossRef] [Green Version]
  44. Hawley, R.J.; MacMannis, K.R.; Wooten, M.S.; Fet, E.V.; Korth, N.L. Suburban stream erosion rates in northern Kentucky exceed reference channels by an order of magnitude and follow predictable trajectories of channel evolution. Geomorphology 2020, 352, 106998. [Google Scholar] [CrossRef]
  45. Lane, E.W. Importance of fluvial morphology in hydraulic engineering. Proc. Am. Soc. Civ. Eng. 1955, 81, 1–17. [Google Scholar]
  46. Hawley, R.J. Making stream restoration more sustainable: A geomorphically, ecologically, and socioeconomically principled approach to bridge the practice with the science. BioScience 2018, 68, 517–528. [Google Scholar] [CrossRef] [PubMed]
  47. Leopold, L.B.; Wolman, M.G.; Miller, J.B. Fluvial Processes in Geomorphology; W.H. Freeman: San Francisco, CA, USA, 1964. [Google Scholar]
  48. Arnold, C.L.; Boison, P.J.; Patton, P.C. Sawmill Brook: An example of rapid geomorphic change related to urbanization. J. Geol. 1982, 90, 155–166. [Google Scholar] [CrossRef]
  49. Roberts, C.E. Flood frequency and urban-induced channel change: Some British examples. In Floods: Hydrological, Sedimentological and Geomorphological Implications; Beven, K., Carling, P., Eds.; Wiley: Chichester, UK, 1989; pp. 57–82. [Google Scholar]
  50. Booth, D.B.; Henshaw, P.C. Rates of channel erosion in small urban streams. In Geomorphic Processes and Riverine Habitat; American Geophysical Union: Washington, DC, USA, 2001; Volume 2, pp. 17–38. [Google Scholar]
  51. Julian, J.P.; Torres, R. Hydraulic erosion of cohesive riverbanks. Geomorphology 2006, 76, 193–206. [Google Scholar] [CrossRef]
  52. Williams, G.P.; Wolman, M.G. Downstream effects of dams on alluvial rivers. In Geological Survey Professional Paper; U.S. G.P.O.: Washington, DC, USA, 1984. [Google Scholar]
  53. Holley, F.M.; Karim, M.F. Simulations of Missouri River bed degradation. J. Hydraul. Eng. 1986, 112, 497–517. [Google Scholar] [CrossRef]
  54. Grant, G.E.; Schmidt, J.C.; Lewis, S.L. A geological framework for interpreting downstream effects of dams on rivers. In A Peculiar River, American Geophysical Union, Water Science Application; O’Conner, J.E., Grant, G.E., Eds.; American Geophysical Union: Washington, DC, USA, 2003; Volume 7, pp. 209–225. [Google Scholar]
  55. Bunte, K. Gravel mitigation and augmentation below hydroelectric dams: A geomorphological perspective. In Report to the Stream Systems Technology Center; USDA Forest Service Rocky Mountain Research Station: Fort Collins, CO, USA, 2004. [Google Scholar]
  56. Shelley, D.C. Geology, Geomorphology, and Tectonics of the Congaree River Valley, South Carolina. Ph.D. Thesis, University of South Carolina, Columbia, SC, USA, 2007; p. 384. [Google Scholar]
  57. Bledsoe, B.P.; Stein, E.D.; Hawley, R.J.; Booth, D. Framework and tool for rapid assessment of stream susceptibility to hydromodification. J. Am. Water Resour. Assoc. 2012, 48, 788–808. [Google Scholar] [CrossRef]
  58. Bledsoe, B.P.; Baker, D.W.; Nelson, P.A.; Rosburg, T.; Sholtes, J.; Stroth, T.R. Design hydrology for stream restoration and channel stability at stream crossings. In Report, National Cooperative Highway Research Program (NCHRP); Department of Civil and Environmental Engineering, Colorado State University: Fort Collins, CO, USA, 2016; pp. 24–40. [Google Scholar]
  59. Hawley, R.J.; Vietz, G.J. Addressing the urban stream disturbance regime. Freshw. Sci. 2016, 35, 278–292. [Google Scholar] [CrossRef]
  60. Driscoll, M.O.; Clinton, S.; Jefferson, A.; Manda, A.; McMillan, S. Urbanization effects on watershed hydrology and in-stream processes in the Southern United States. Water 2010, 2, 605–648. [Google Scholar] [CrossRef]
  61. ASCE Task Committee on Hydraul, Bank Mechanics. River width adjustment. I: Processes and Mechanisms. J. Hydraul. Eng. 1998, 124, 881–902. [Google Scholar] [CrossRef]
  62. Couper, P.R. Space and time in river bank erosion: A review. Area 2004, 36, 387–403. [Google Scholar] [CrossRef]
  63. Rinaldi, M.; Mengoni, B.; Luppi, L.; Darby, S.E.; Mosselman, E. Numerical simulation of hydrodynamics and bank erosion in a river bend. Water Resour. Res. 2008, 44. [Google Scholar] [CrossRef] [Green Version]
  64. Pizzuto, J. An empirical model of event scale cohesive bank profile evolution. Earth Surf. Process. Landf. 2009, 34, 1234–1244. [Google Scholar] [CrossRef]
  65. Salem, H.; Rennie, C.D. Practical determination of critical shear stress in cohesive soils. J. Hydraul. Eng. 2017, 143, 04017045. [Google Scholar] [CrossRef]
  66. Edison, G.W.; Sawyer, C.B.; Hichcock, D.R.; Calabria, J.; Putman, B.; Chanse, V.; Post, C.J.; Hallstrom, J.O.; White, D.L.; Esswein, S.T.; et al. Sand River headwaters green infrastructure project, City of Aiken, South Carolina: A collaborative team approach to implementing green infrastructure practices. In Proceedings of the 2010 South Carolina Water Resources Conference, Columbia, SC, USA, 13–14 October 2010. [Google Scholar]
  67. Osterkamp, W.R.; Hedman, E.R. Variation of width and discharge for natural high-gradient stream channels. Water Resour. Res. 1977, 13, 256–258. [Google Scholar] [CrossRef]
  68. Council Takes Emergency Action to Correct Drainage Situation. In Aiken Standard Review; Hitchcock Woods Foundation: Aiken, SC, USA, 1955.
  69. Rabold, D. Turning Back the Sands of Time; Hitchcock Woods Foundation: Aiken, SC, USA, 2008. [Google Scholar]
  70. Sand River Erosion under Study by City. In Aiken Standard Review; Hitchcock Woods Foundation: Aiken, SC, USA, 1956.
  71. Southeast Regional Climate Center (SERCC). Period of Record monthly Climate Summary, Raleigh, NC State University, North Carolina. Available online: http://www.sercc.com/cgi-bin/sercc/cliMAIN.pl?nc7079 (accessed on 8 January 2020).
  72. Nystrom, P.G., Jr.; Willoughby, R.H.; Kite, L.E. Cretaceous and Teritary stratigraphy of the Upper Coastal Plain, SC. In The Geology of the Carolinas; Horton, J.W., Jr., Zullo, V.A., Eds.; University of Tennessee Press: Knoxville, TN, USA, 1991; pp. 221–240. [Google Scholar]
  73. Newson, M.D.; Large, A.R. ‘Natural’ rivers, ‘hydromorphological quality’ and river restoration: A challenging new agenda for applied fluvial geomorphology. Earth Surf. Process. Landf. 2006, 31, 1606–1624. [Google Scholar] [CrossRef]
  74. Wayt, H. Railroad tracks belonging to the South Carolina Canal and Railroad Company, c. 1839–1852. J. Soc. Ind. Archaeol. 2016, 42, 19–36. [Google Scholar]
  75. Gamble, R.; Hogan, T. Watersheds in watersheds: The fate of the planet’s major river systems in the Great Acceleration. Thesis Elev. 2019, 150, 3–25. [Google Scholar] [CrossRef]
  76. Steffen, W.; Broadgate, W.; Deutsch, L.; Gaffney, O.; Ludwig, C. The trajectory of the Anthropocene: The great acceleration. Anthr. Rev. 2015, 2, 81–98. [Google Scholar] [CrossRef]
  77. Konrad, C.P.; Booth, D.B. Hydrologic changes in urban streams and their ecological significance. Am. Fish. Soc. Symp. 2005, 47, 157–177. [Google Scholar]
  78. De Albuquerque, A.O.; De Carvalho, O.A., Jr.; Guimaraes, R.F.; Gomes, A.T.; Hermuche, P.M. Assessment of gully development using geomorphic change detection between pre- and post- urbanization scenarios. Environ. Earth Sci. 2020, 79, 232. [Google Scholar] [CrossRef]
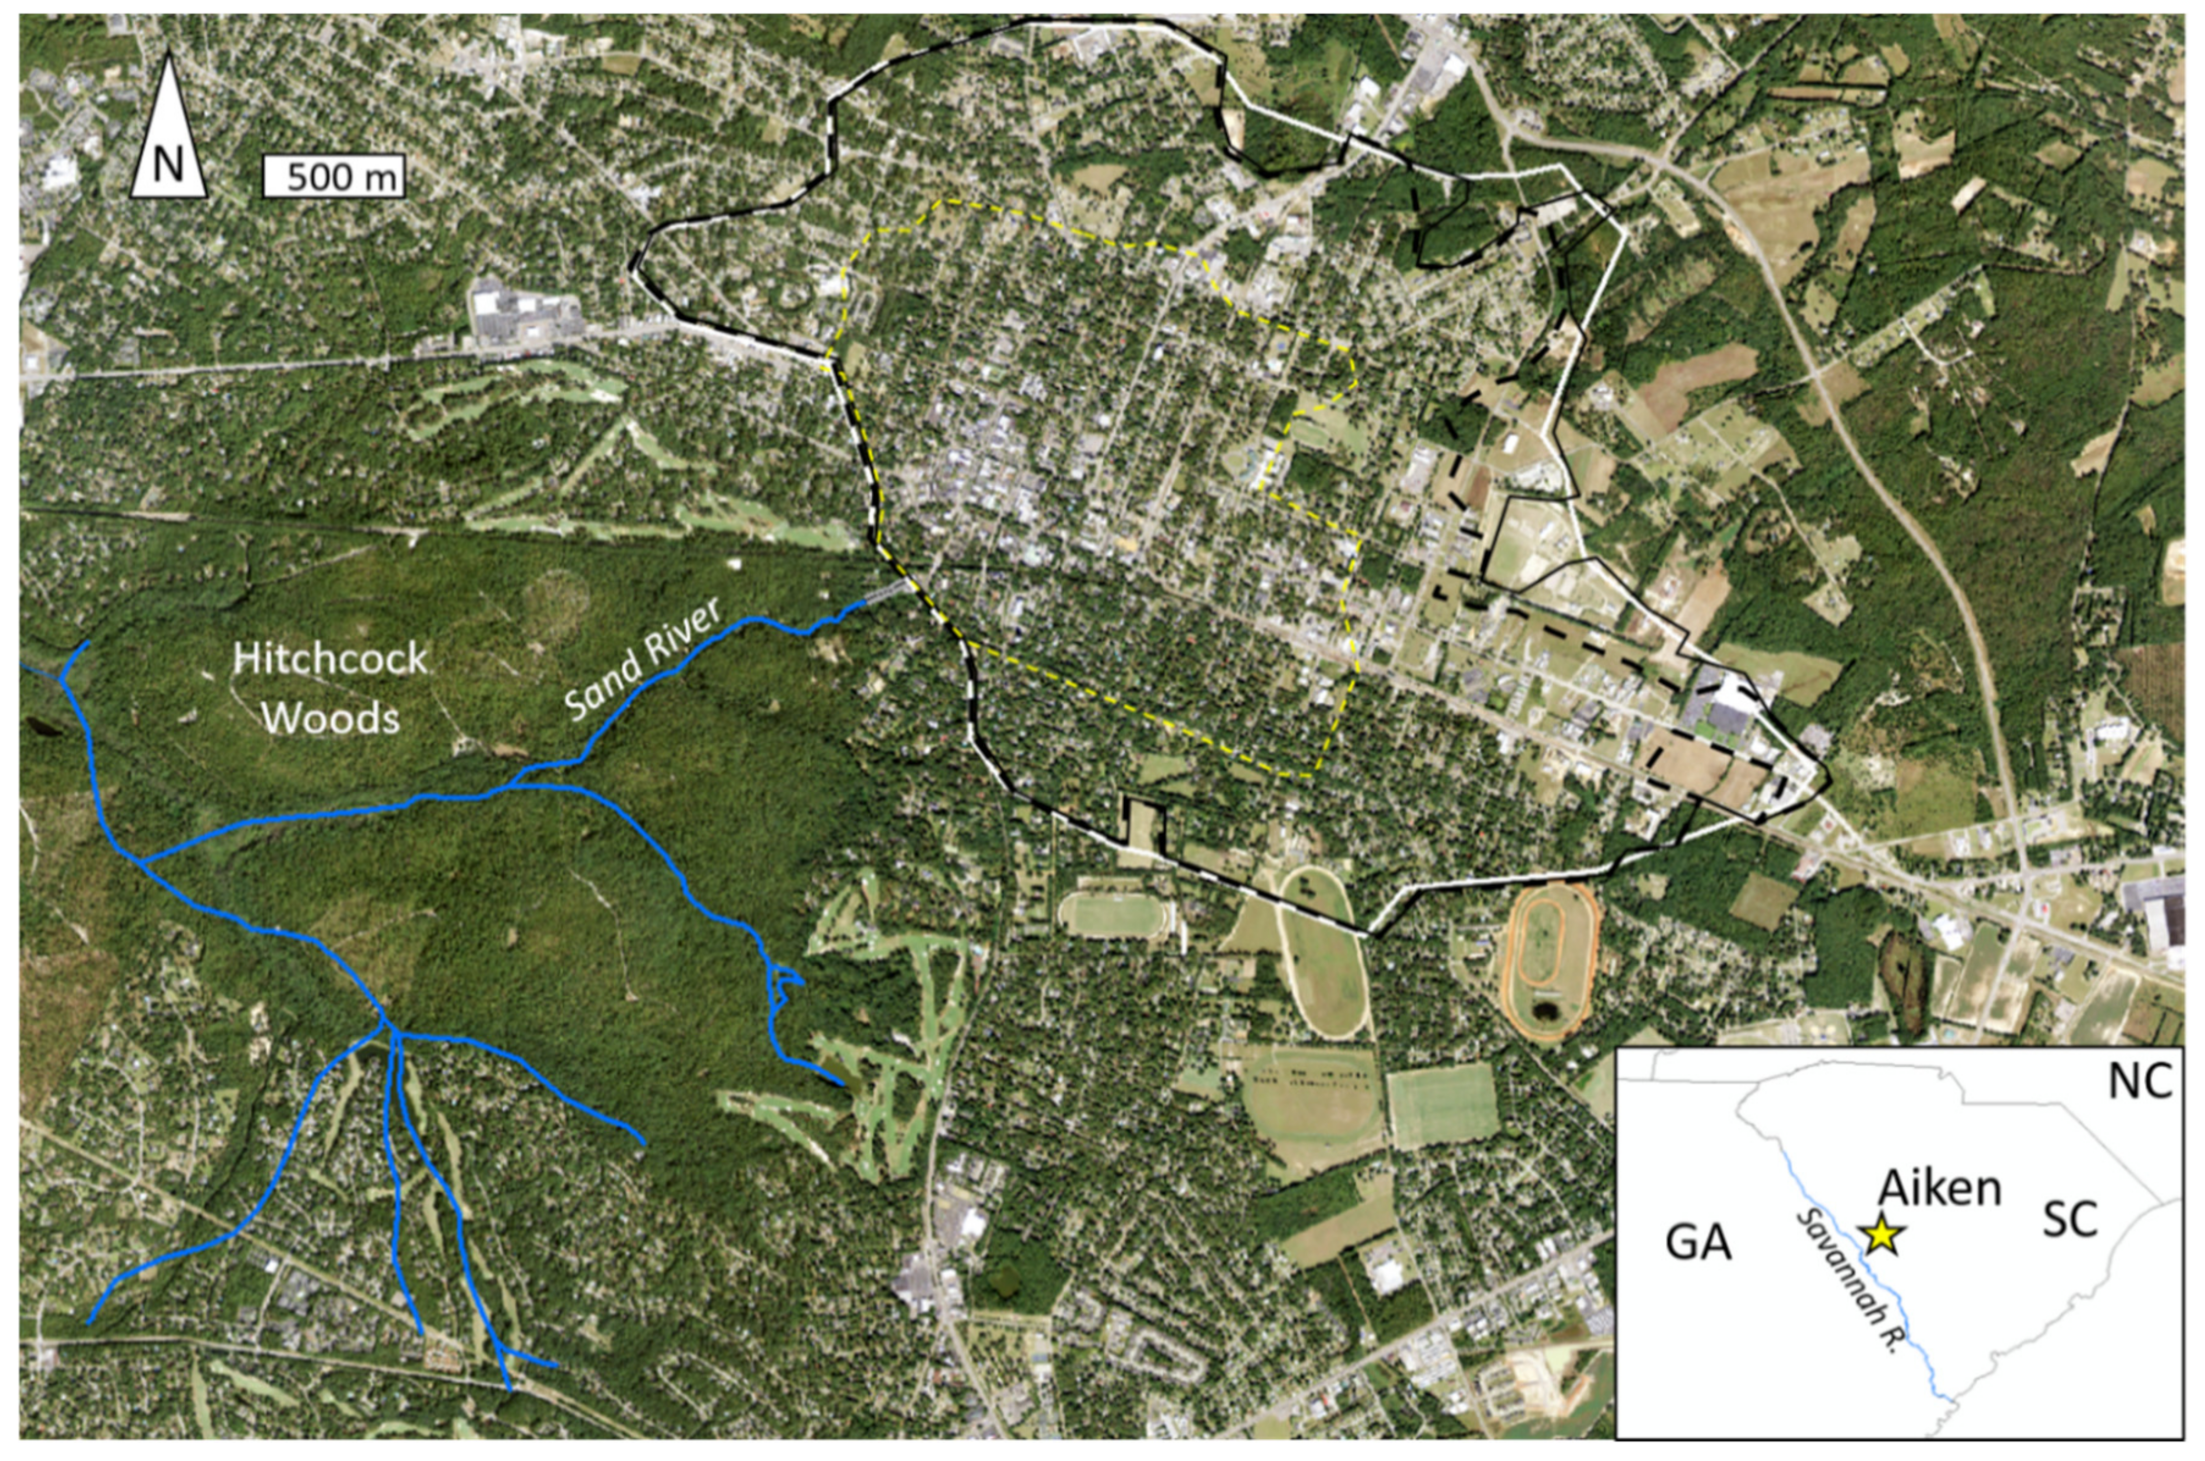
Figure 1. The Sand River is a first-order tributary of the Savannah River. The Sand River drains a 9.0 km2 area including the downtown business district and neighboring suburbs. The river runs through the Hitchcock Woods, a 2000 acre forest preserve. The dashed yellow and black lines mark the increased extent of urbanized watershed area in 1930 and 1960, respectively. Similarly, the solid black and white lines show the extent of the watershed in 2002 and 2012.
Water 12 03441 g001
Figure 2. (a) A stereo pair image from 1870, and postcard images from (b) and (c) 1930 reveal the shallow nature of the pre-urbanized Sand River channel. The images reveal no apparent change in the channel morphology over the 60-year period.
Water 12 03441 g002
Figure 3. Photograph of the 3.05 m outfall pipe and gabion lined canal installed in 1992.
Water 12 03441 g003
Figure 4. (a) 2017 Photograph of the modern Sand River canyon; (b) 2017 Photograph showing undercutting of the banks due to active channel flows increases instability of the channel banks, leading to frequent bank failures.
Water 12 03441 g004
Figure 5. 2012 lidar DEM of the Sand River study reach. Warm to cool colors represent high to low elevations, respectively. The black dashed line marks the transect locations used to generate cross section channel profiles.
Water 12 03441 g005
Figure 6. Long-channel profile of the Sand River study reach as a function of downstream distance from the Hitchcock Woods access way. The solid black line marks the location of the channel bed, while the black and gray dots mark the valley banks. A break in the channel bed slope occurs at 200 m downstream and is associated with opening of the outfall pipe. Another slope break occurs at 300 m downstream where the gabion canal transitions to natural channel bed.
Water 12 03441 g006
Figure 7. Cross-section profiles at (a) 150 m; (b) 240 m; (c) 425 m; and (d) 600 m downstream of the stormwater outfall pipe. The solid line represents the 2002 transects of Julian and Torres (2006). The dashed line shows the cross-section profiles extracted from the 2012 lidar DEM. The comparison of the 2002 and 2012 profiles reveals deepening and widening of the channel over the 10-year interval.
Water 12 03441 g007
Table 1. Summary table of total watershed area, Total Impervious Area (TIA), and percentage of urbanized watershed area for 1930, 1992, 2002, and 2012.
YearWatershed Area (km2)% Increase in Urbanized Watershed Area
1930 (initial)3.50
19928.11131.7
20028.88.5
20129.02.3
Total % increase (1930–2012) 157%
Table 2. Summary table of channel volume (m3) and volume sediment flux (m3/yr) for channel corresponding to the 87- and 10-year time intervals from 1930 to 1992 and from 1992 to 2012, respectively.
Time IntervalChannel Volume (m3)Volume Sediment Flux (m3/yr)
1930–19925.8 × 1059354
1992–20124.98 × 1042490
Total canyon volume (2012)6.3 × 10⁵
Publisher’s Note: MDPI stays neutral with regard to jurisdictional claims in published maps and institutional affiliations.