1. Introduction
Especially in regions where water resources are scarce, irrigation management assumes a key role to reduce the requirements of water and energy. However, the correct management needs to dispose of accurate measurements of actual soil water availability. It is common, among growers, to schedule irrigation based on direct observations or fixed intervals between watering events. This way to proceed generally determines over-irrigation and, consequently, the loss of water in the deep layers and the leaching of nutrients. Then, appropriate and efficient irrigation water management can support sustainable water use in crop growth [
1].
In Sicily, the highest extension of the agricultural area was registered in 2010 and, with 1.4 million hectares, accounts for 10.8% of the agricultural area of Italy; among the cultivated area, about 160,000 ha are under irrigation [
2]. However, some studies suggested that soil physical properties may affect the agricultural potential mainly in irrigated areas, reducing root growth and water retention [
3,
4,
5]. Therefore, soils with high clay content and, consequently, with expandability characteristics, have been studied under different aspects in Sicily [
6,
7,
8,
9]. Among the physical properties of soil, bulk density is considered an expandability potential index, and the associated soil water content represents the degree of soil compaction [
10]. Thus, in soils containing swelling/shrinking clays, decreasing soil water content determines the reduction of the apparent soil volume and, consequently, the increase of soil bulk density and the appearance of cracks on the soil surface [
11,
12,
13].
In the last decades, Frequency Domain Reflectometry (FDR) sensors have been extensively used to monitor soil water content [
14,
15,
16,
17]. Real-time measurements of soil moisture allow, among others, quick and accurate determinations of irrigation scheduling variables, such as irrigation timing and amounts of water to apply, reducing the need of extensive computations to determine the actual crop water use [
1,
16,
18,
19].
Among FDR sensors, Diviner 2000
® capacitance probe (Sentek Pty Ltd., Stepney, Australia), allows measuring apparent soil dielectric permittivity, whose values are strongly influenced by the soil water content. The sensor’s response is represented by the scaled frequency, which includes the raw counts in air, water, and soil. Several studies used different methods to calibrate the sensor in the field and/or in the laboratory, by using disturbed or undisturbed soil samples [
20]. Then, if from the one hand there is a need to standardize methodologies and techniques for laboratory and field sensor’s calibration [
18], on the other it is necessary to evaluate the advantages of site-specific calibration to identify the relationship between the soil water content and the scaled frequency measured by the sensor [
21,
22]. In general, site-specific calibration is necessary to improve the sensor’s response accuracy [
14,
22,
23,
24]. The calibration equations suggested by the manufacturer cannot account for some site-specific factors affecting the actual sensor’s readings, like temperature, salinity, and soil composition [
25,
26,
27].
The relationship between soil dielectric permittivity and volumetric water content is well known, as well as that other soil factors affect the measurements, such as soil texture, bulk density, salinity, and organic matter [
17,
28,
29]. On the other hand, not deeply investigated are the calibration procedures valid for swelling/shrinking clay soils, for which the changes of bulk density with soil water content affect the apparent soil dielectric permittivity [
30]. Besides that, mineralogical and structural soil characteristics can influence the accuracy of FDR measurements, requiring site-specific calibration to obtain suitable estimations of soil water content. Significant variations of soil bulk density, mainly occurring in expandable soils, can cause considerable changes in the sensor’s readings, as well as to generate air gaps around the access tube, making the measurement useless. The manufacturer’s calibration equation, representing the functional relationship between volumetric soil water content, θ, and the scaled frequency, SF, has been generally calibrated for rigid soils [
31].
Then, the objective of this work was to develop and validate a new calibration model for the Diviner 2000® probe to estimate the volumetric soil water content, θ, as a function of SF and soil bulk density (ρb) in a range of soils with different textures. Operating in this way, the volumetric soil water content was assumed as the dependent variable of the proposed model, with the changes of bulk density occurring in the presence of expandable clay particles considered as the dependent variable of the model.
2. Material and Methods
2.1. Location and Characterization of the Studied Soils
The research was carried out on six agricultural soils of western Sicily, characterized by different particle size composition, reduced amount of gravel, low salinity, and low organic matter. The particle size distribution was determined by the hydrometer method (type ASTM 152H) and the corresponding soil texture followed the definitions of the United State Department of Agriculture (USDA) Soil Texture Classes [
32]. Electrical conductivity (EC) was measured using a conductivity meter on 1:5 soil–water extract (CRISON, microCM 2200, Alella, Spain). Organic matter (OM) was determined based on the Walkley–Black chromic acid wet oxidation method [
33].
The geographical locations of the soils are indicated in
Table 1. The surface layer (0–0.30 m) was sampled in the agricultural areas of Partinico (PAR), Marsala (MAR), Salemi (SAL), Mazara del Vallo (MAZ), and Castelvetrano (CAS). Only in the last location, two different sites were investigated: the first, CAS-A, with coarse-textured soil, and the second, characterized by soil with higher clay content (CAS-B).
2.2. Laboratory Calibration
The Diviner 2000
® calibration equations for the different soils were obtained in the laboratory by using disturbed soil samples. The experiments were carried out on repacked soil monoliths with diameter and height of 0.25 m, chosen according to the sensing volume investigated by the sensor. The manufacturer reports that the sensor’s resolution is physically designed to represent 10-cm vertical depth, with a radial sensitivity of 5–14 cm around the access tube [
31]. Then, the cylinder diameter of the monolith was selected according to the probe’s sphere of influence. Besides that, the results of previous experimental studies to determine the influence of the different soil thicknesses around the probe [
34,
35] demonstrated that approximately a thickness of 8.0 cm is the limit reached by the probe. Therefore, the dimensions chosen for the monolith determined a soil volume slightly larger than the sphere of influence of the sensor so that about 99% of the generated response was within the monolith [
18].
Twelve PVC samplers were filled with soils sieved through 5-mm mesh and compacted to achieve the maximum and minimum soil bulk density. Preliminarily, these limits were determined based on the standard type Proctor hammer test, following the protocol ASTM D698 [
36]. In this way, with the data generated from the compaction curve, for each type of soil, the upper and lower limits of soil bulk density and related gravimetric water content were defined [
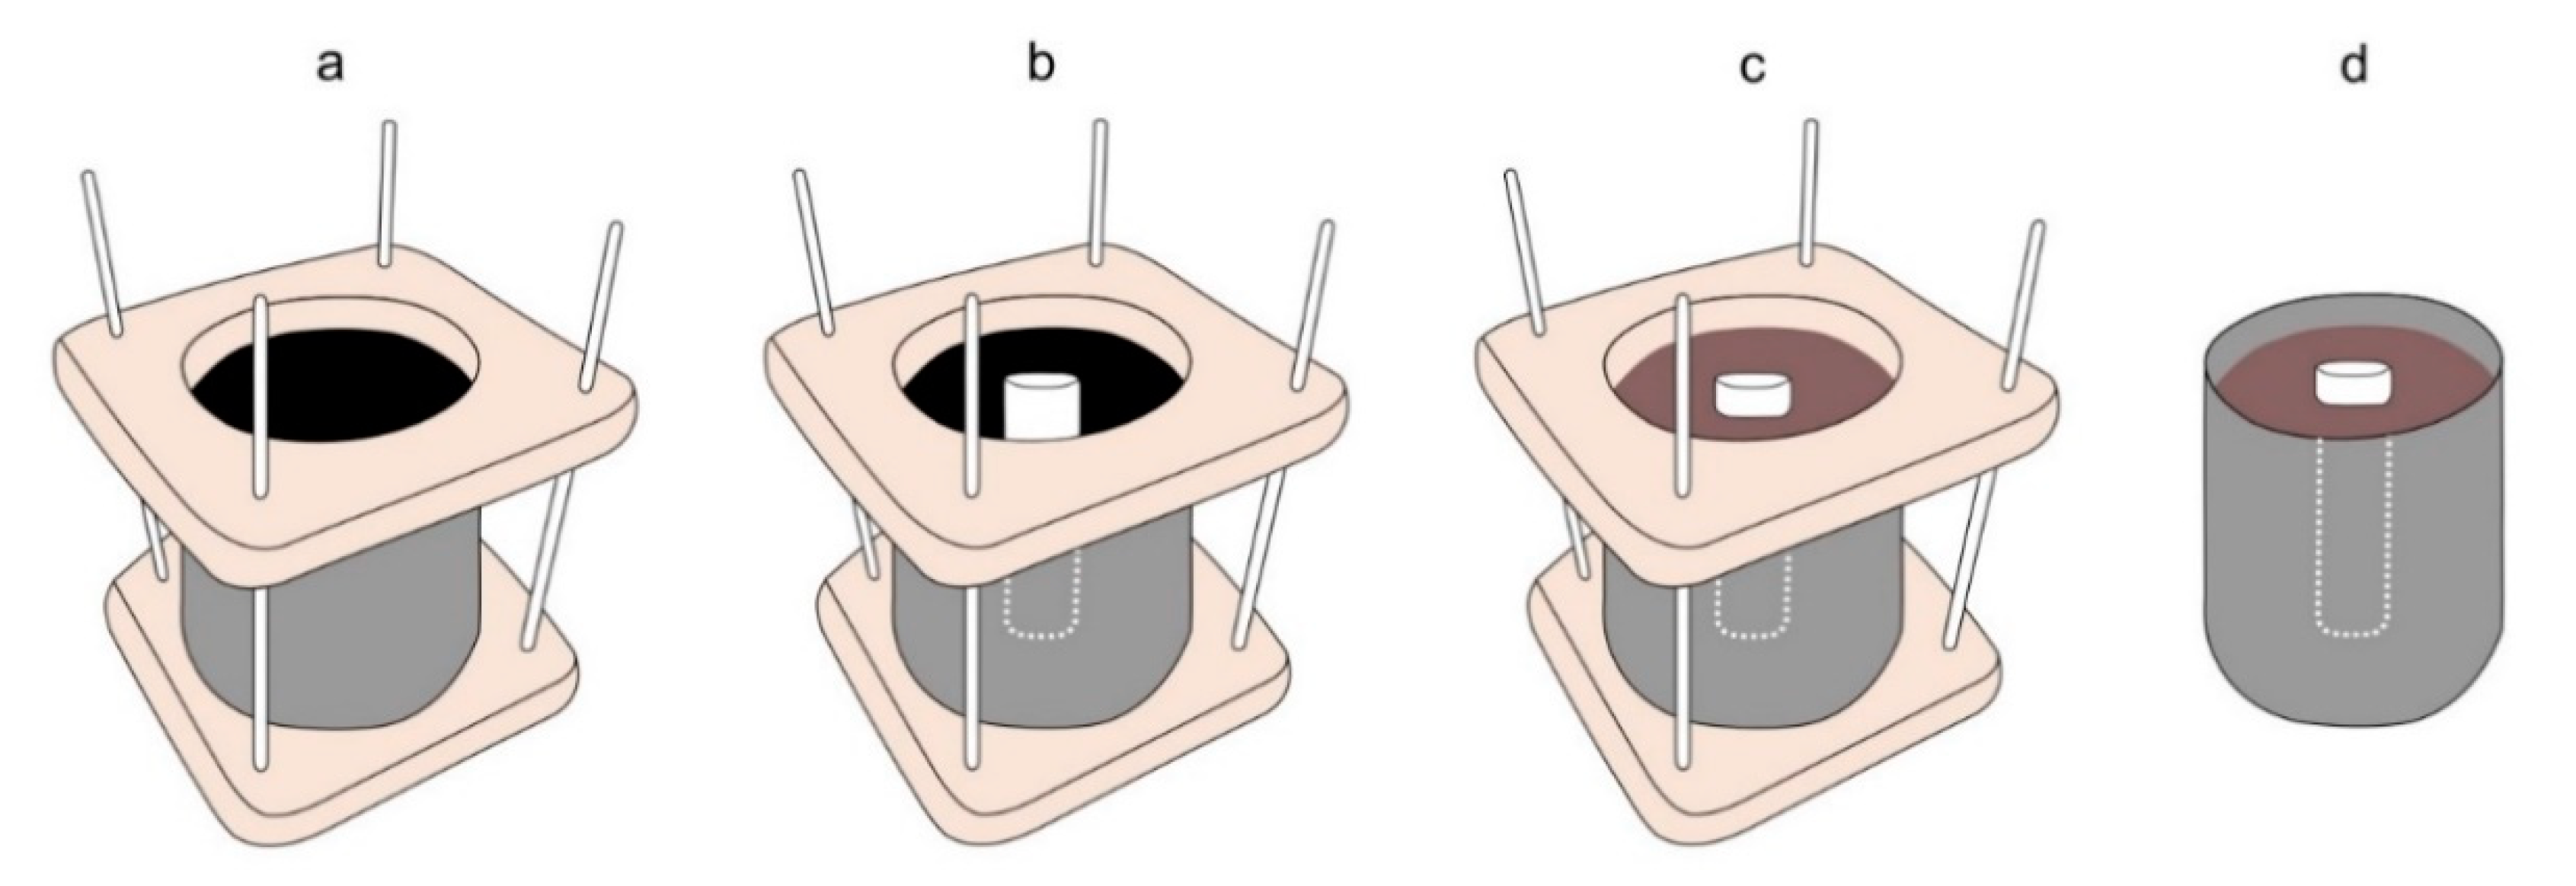
37]. Consequently, the amount of air-dry soil and water mass to fill the samplers with the minimum and maximum soil density was calculated, to obtain two monoliths for each soil type. Before filling each monolith, a 0.30-m-long access tube was installed axially to the PVC sampler. The soil mass was wetted according to the predetermined values in the compaction curve [
37]; then, after homogenization, the soil was weighed and packed inside the PVC sampler, which was inserted into a wood, rigid structure to avoid deformation, as shown in
Figure 1.
In each sampler, the soil was compacted to reach the maximum and minimum bulk density by applying, according to standard Proctor test, a series of blows proportional to the cylinder size. The monoliths were saturated and then air-dried. During the air-drying process and after oven-drying, the scaled frequency value (SF), the corresponding gravimetric soil water content (U), and soil bulk density (ρb) were measured.
Before each reading session, the probe was normalized, according to the recommendation of the manufacturer, to convert the raw counts, corresponding to the actual water content, into scaled frequency (SF). To determine SF, the frequencies in air and water were also acquired:
where SF is the scaled frequency,
Fa is the raw count in the PVC access tube while suspended in air,
Fs is the raw count in the PVC access tube in the soil, and
Fw is the raw count in the PVC access tube in water.
Gravimetric soil water content was determined by using a digital weighing scale with 0.1 g accuracy. To consider the possible shrinking processes characterizing the soils containing expandable clay, the soil bulk density corresponding to each water content was determined based on the measurements of vertical subsidence and lateral contraction during the air-drying process of the sample [
6]. The vertical contraction and then the soil sample height were measured by a Vernier caliper (accuracy of 0.1 mm) attached to a bar installed above the monolith and allowing orthogonal movements. All the measurements were always carried out on the same eight points previously chosen on the sample surface in two orthogonal directions and then averaged to obtain the sample height corresponding to each soil water content.
At the end of the air-drying process, the monoliths were put into the oven and kept at 105 °C for 48 h. After oven-drying, the diameters of the soil monolith along with two orthogonal directions and in three sections at different heights were measured with a caliper (accuracy of 0.5 mm), to obtain the final volume of the sample and the geometric factor (
rs), as defined by Bronswijk [
38].
The knowledge of the geometric factor allowed the indirect determination of the horizontal contraction based on the vertical subsidence corresponding to each soil water content, under the hypothesis that the value of rs measured at the end of the experiment was valid for the entire contraction process. Both the measurements, i.e., vertical subsidence and lateral contraction, therefore allowed determining the soil volume used to determine the soil bulk density corresponding to each gravimetric soil water content and, finally, the volumetric water content. The soil shrinkage characteristic curves (SSCC), i.e., the relationships between ρb and U, were then identified for the different soils.
The dependency of the Diviner 2000® calibration model parameters on soil physical attributes was then assessed. The new calibration model, θ (SF, ρb), in which the parameters were indirectly estimated based on sand and clay content and accounting for the variations of soil bulk density with gravimetric water content, was finally proposed.
2.3. Validation of the Proposed Model
The model validation was carried out based on the measurements acquired on repacked and undisturbed monoliths having the same dimensions of the repacked ones and collected in the same agricultural sites used for calibration purposes. Measurements of U, SF, and ρb were contextually acquired during an air-drying process, from saturation until oven-drying, following the same procedure used for repacked monoliths. Then, the comparison between the measured volumetric soil water content, obtained as the product between measured ρb and U, and the corresponding estimate by the model was carried out, to evaluate the errors associated to the estimations.
2.4. Statistical Analysis
For each soil, the experimental measurements (θ, SF, ρ
b) obtained on the repacked monoliths with maximum and minimum bulk density allowed the estimation of the calibration equation parameters by maximizing the Nash–Sutcliffe Efficiency index (NSE) by using the tool solver of Microsoft Excel
® (2010), which includes techniques to iterate the research of the optimal solution:
where θ
meas,i (cm
3 cm
−3) and θ
estim,i (cm
3 cm
−3) are the volumetric water contents measured in the monoliths and estimated by the model respectively,
(cm
3 cm
−3) is the average of volumetric water content measured in the monoliths, and n is the number of observations (i = 1, 2, …, n).
The value of NSE ranges from −∞ to 1, being equal to 1.0 when there is the perfect agreement between the measured and estimated values. The NSE becomes negative when the average measured value represents a better estimation than the model [
39]. The errors associated with the site-specific calibration equations were then computed based on the mean bias error (MBE) and the root mean square error (RMSE), obtained as:
where θ
estim,i (cm
3 cm
−3) and θ
meas,i (cm
3 cm
−3) are the volumetric water contents estimated by the model and measured in repacked monoliths, and n is the number of observations (i = 1, 2, …, n).
The NSE, MBE, and RMSE indices were also used to assess the suitability of the proposed model, in which the parameters were indirectly estimated based on soil physical attributes, to estimate volumetric water content on undisturbed monoliths.
3. Results
3.1. Soil Analysis
Table 2 summarizes the physical and chemical characteristics of the investigated soils in terms of gravel content, particle size distribution, electrical conductivity (EC), and organic matter content (OM). The investigated soils are characterized by low values of electrical conductivity and a wide range of clay content, resulting in different textural classes according to the USDA classification [
32], from Loamy Sand to Clay, with and without expandability characters.
From
Table 2 it is possible to observe that there were two distinct groups of soil in terms of sand and clay contents. The first group, with a relatively high sand content and lower clay content, followed the order PAR, CAS_A, MAR in terms of decreasing sand content. In the second group, the SAL sample had the highest clay content and the lowest sand content, followed by MAZ and CAS_B.
3.2. Experiments on Repacked Monoliths to Parameterize the Sensor’s Calibration Equation
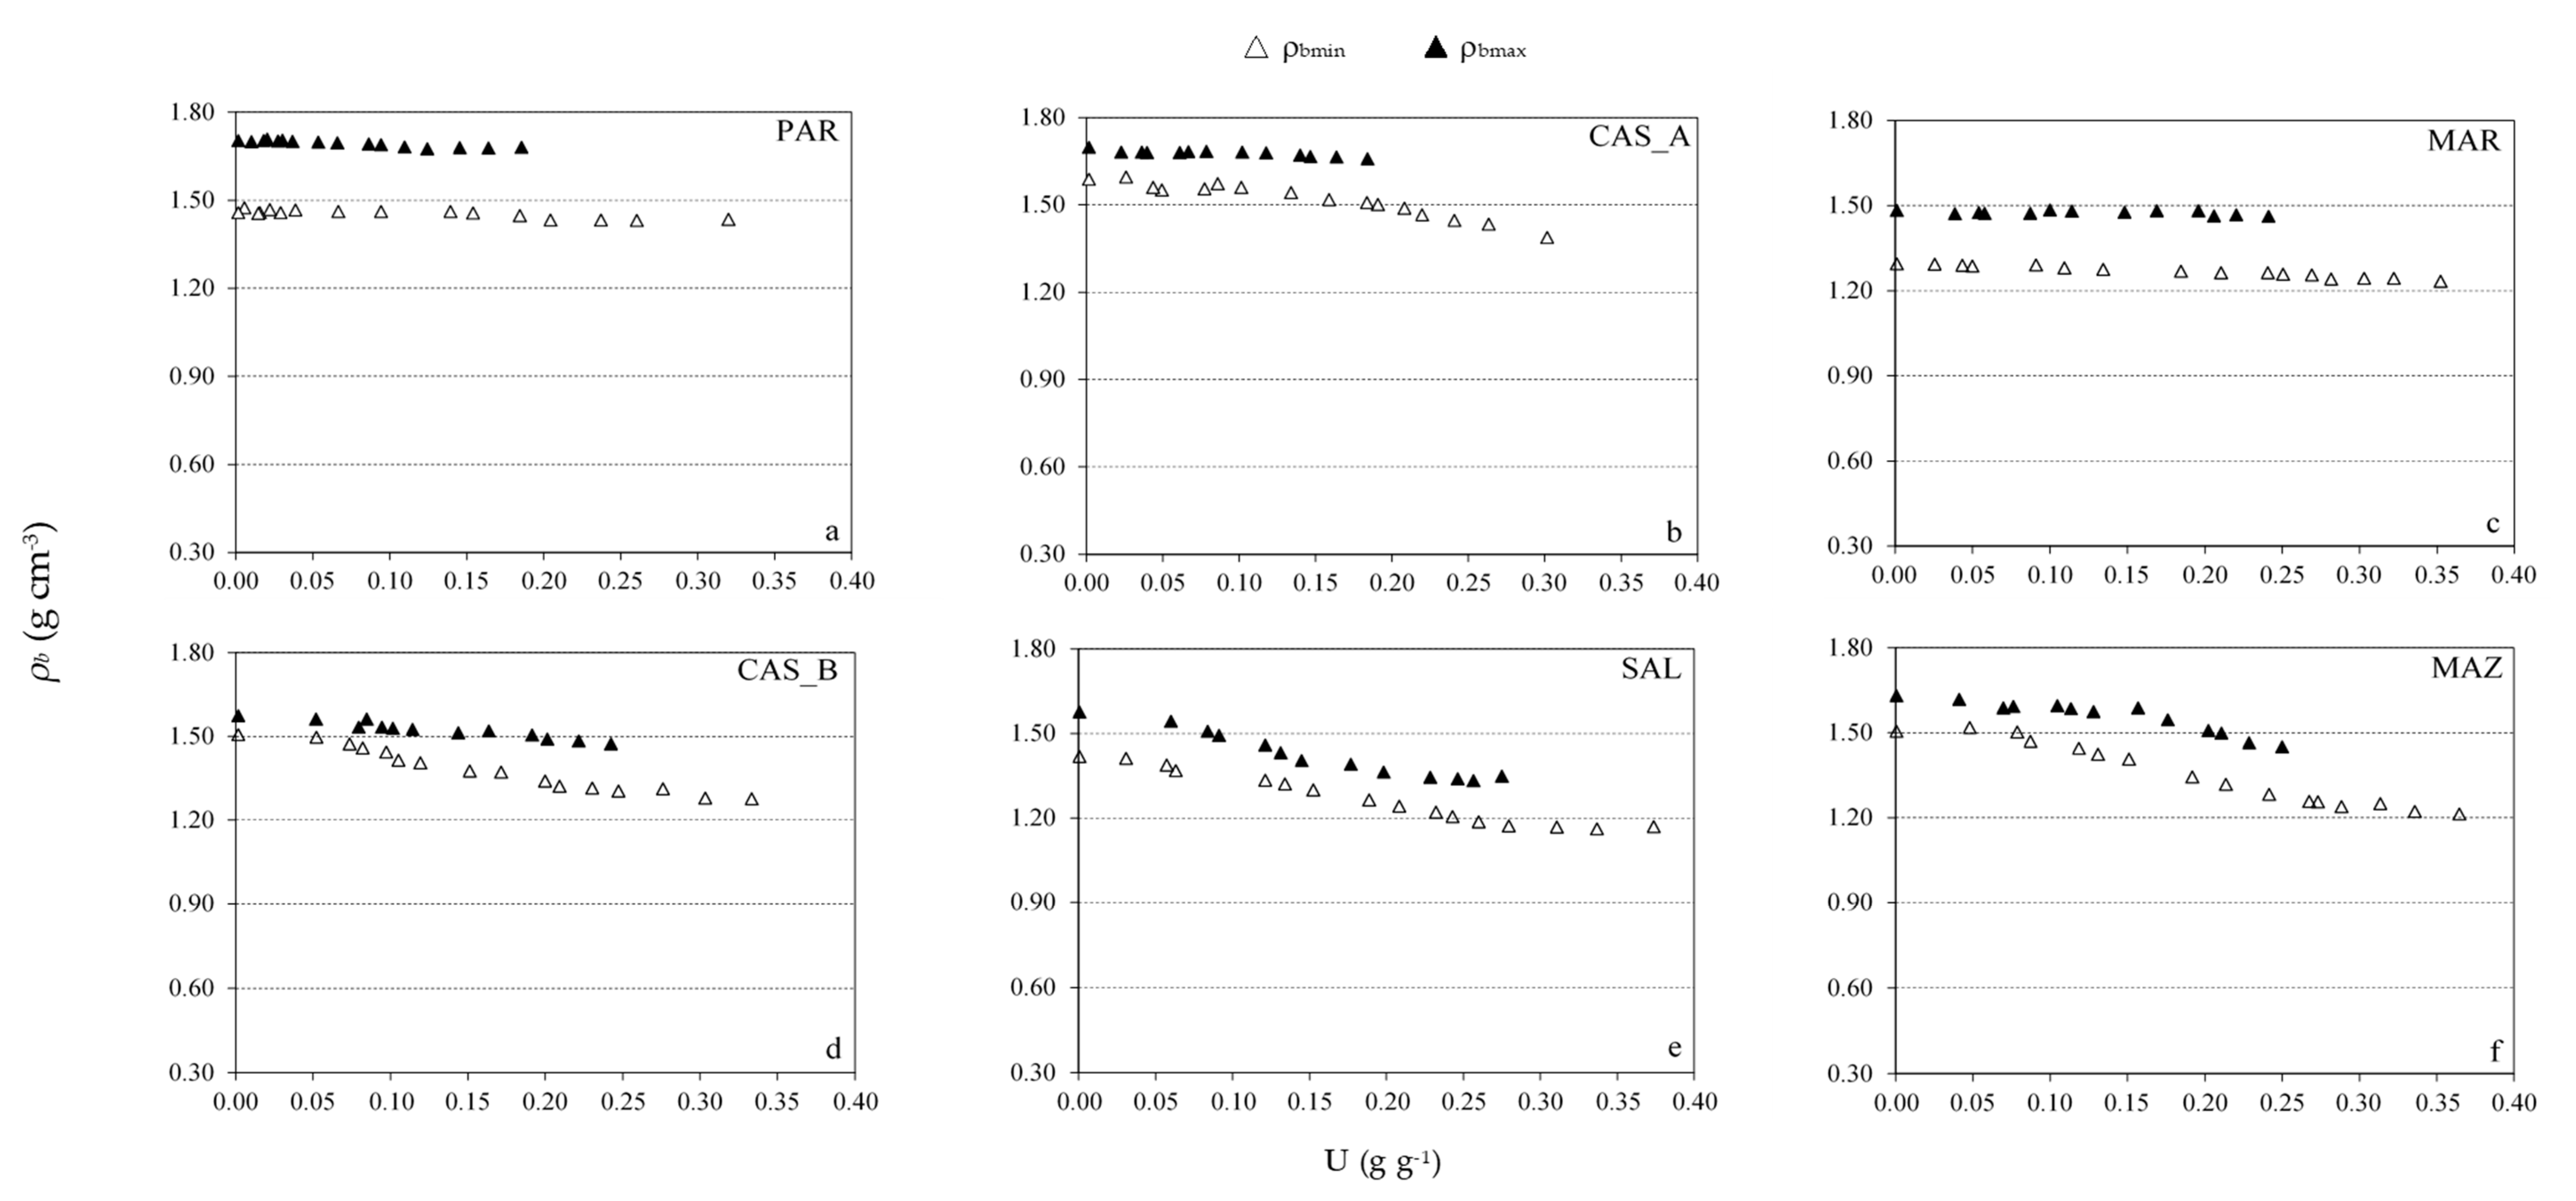
For each soil type,
Figure 2 shows the soil shrinkage characteristic curves obtained on repacked soil monoliths. The curves are represented in terms of variations of soil bulk density with gravimetric soil water contents. To estimate ρ
b, the soil volume during the air-drying process was obtained by considering the geometric factor
rs due to the response of each soil in terms of vertical subsidence and lateral contraction. In particular, following the methodology proposed by Bronswijk [
38], the geometric factor
rs resulted in being equal to 1 for PAR and MAR, equal to 2 for CAS_A and CAS_B, and equal to 3 for SAL and MAZ.
For the soils characterized by the relatively lower clay content, i.e., PAR, CAS-A, and MAR (
Figure 2a–c, respectively), the ρ
b values corresponding to the maximum bulk density were practically constant (rigid soil) for the different soil water contents, whereas the ρ
b values corresponding to the minimum bulk density showed slight increments at decreasing U, probably due to the rearrangement of soil particles during the air-drying process. On the other hand, for soils with relatively higher clay content, i.e., CAS-B, SAL, and MAZ (
Figure 2d–f, respectively), the ρ
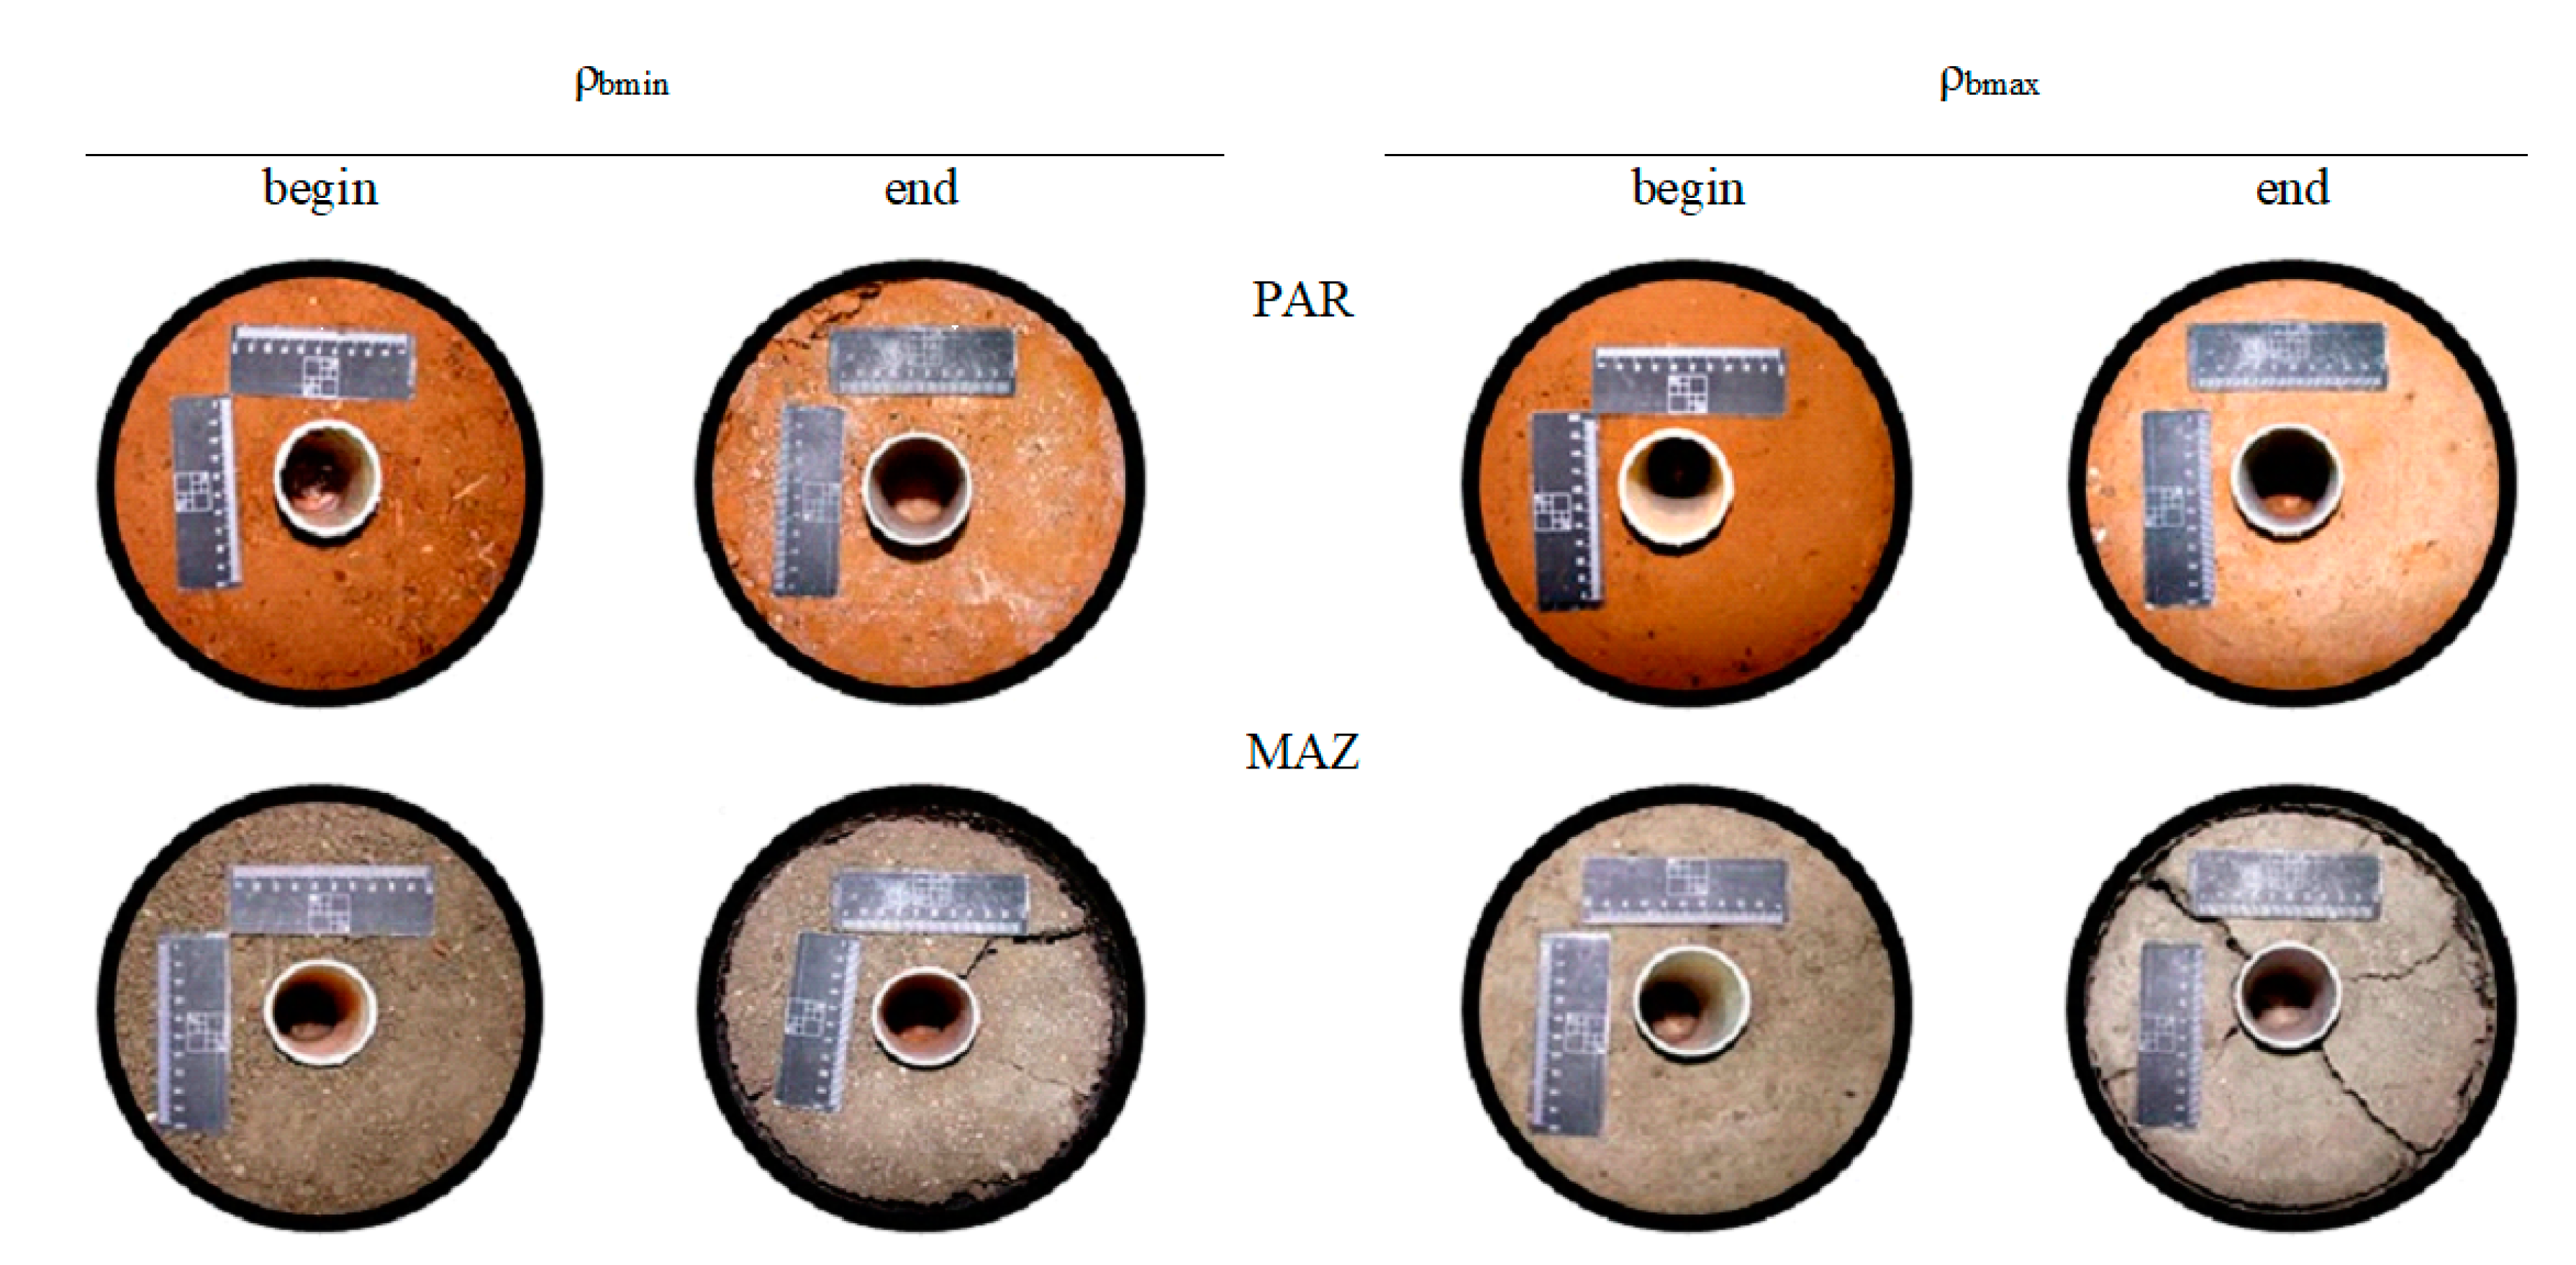
b values corresponding to both the maximum and minimum bulk density tended to increase at decreasing U, mainly due to the swelling/shrinking characters of the clay minerals present in these soils. For two soils with quite different clay content (Partinico (PAR) and Mazara del Vallo (MAZ)), the photographic sequence in
Figure 3 shows the images of monoliths repacked at the minimum and maximum bulk density, at the beginning of the air-drying process, and after oven-drying.
The selection included the soil PAR, representing the group with high sand content, and the soil MAZ, representing the group with high clay content. As can be observed, for both the bulk densities, the soil PAR behaved as rigid soil without lateral contraction whereas, due to the high clay content, a strong lateral contraction and the appearance of cracks on the soil surface was observed in both the MAZ monoliths. However, in all the cases in which after oven-drying the detachment of soil from the probe access tube was observed, the corresponding scaled frequencies were not considered for the purpose of probe calibration, since the sensor readings were strongly affected by the presence of air gaps around the access tube.
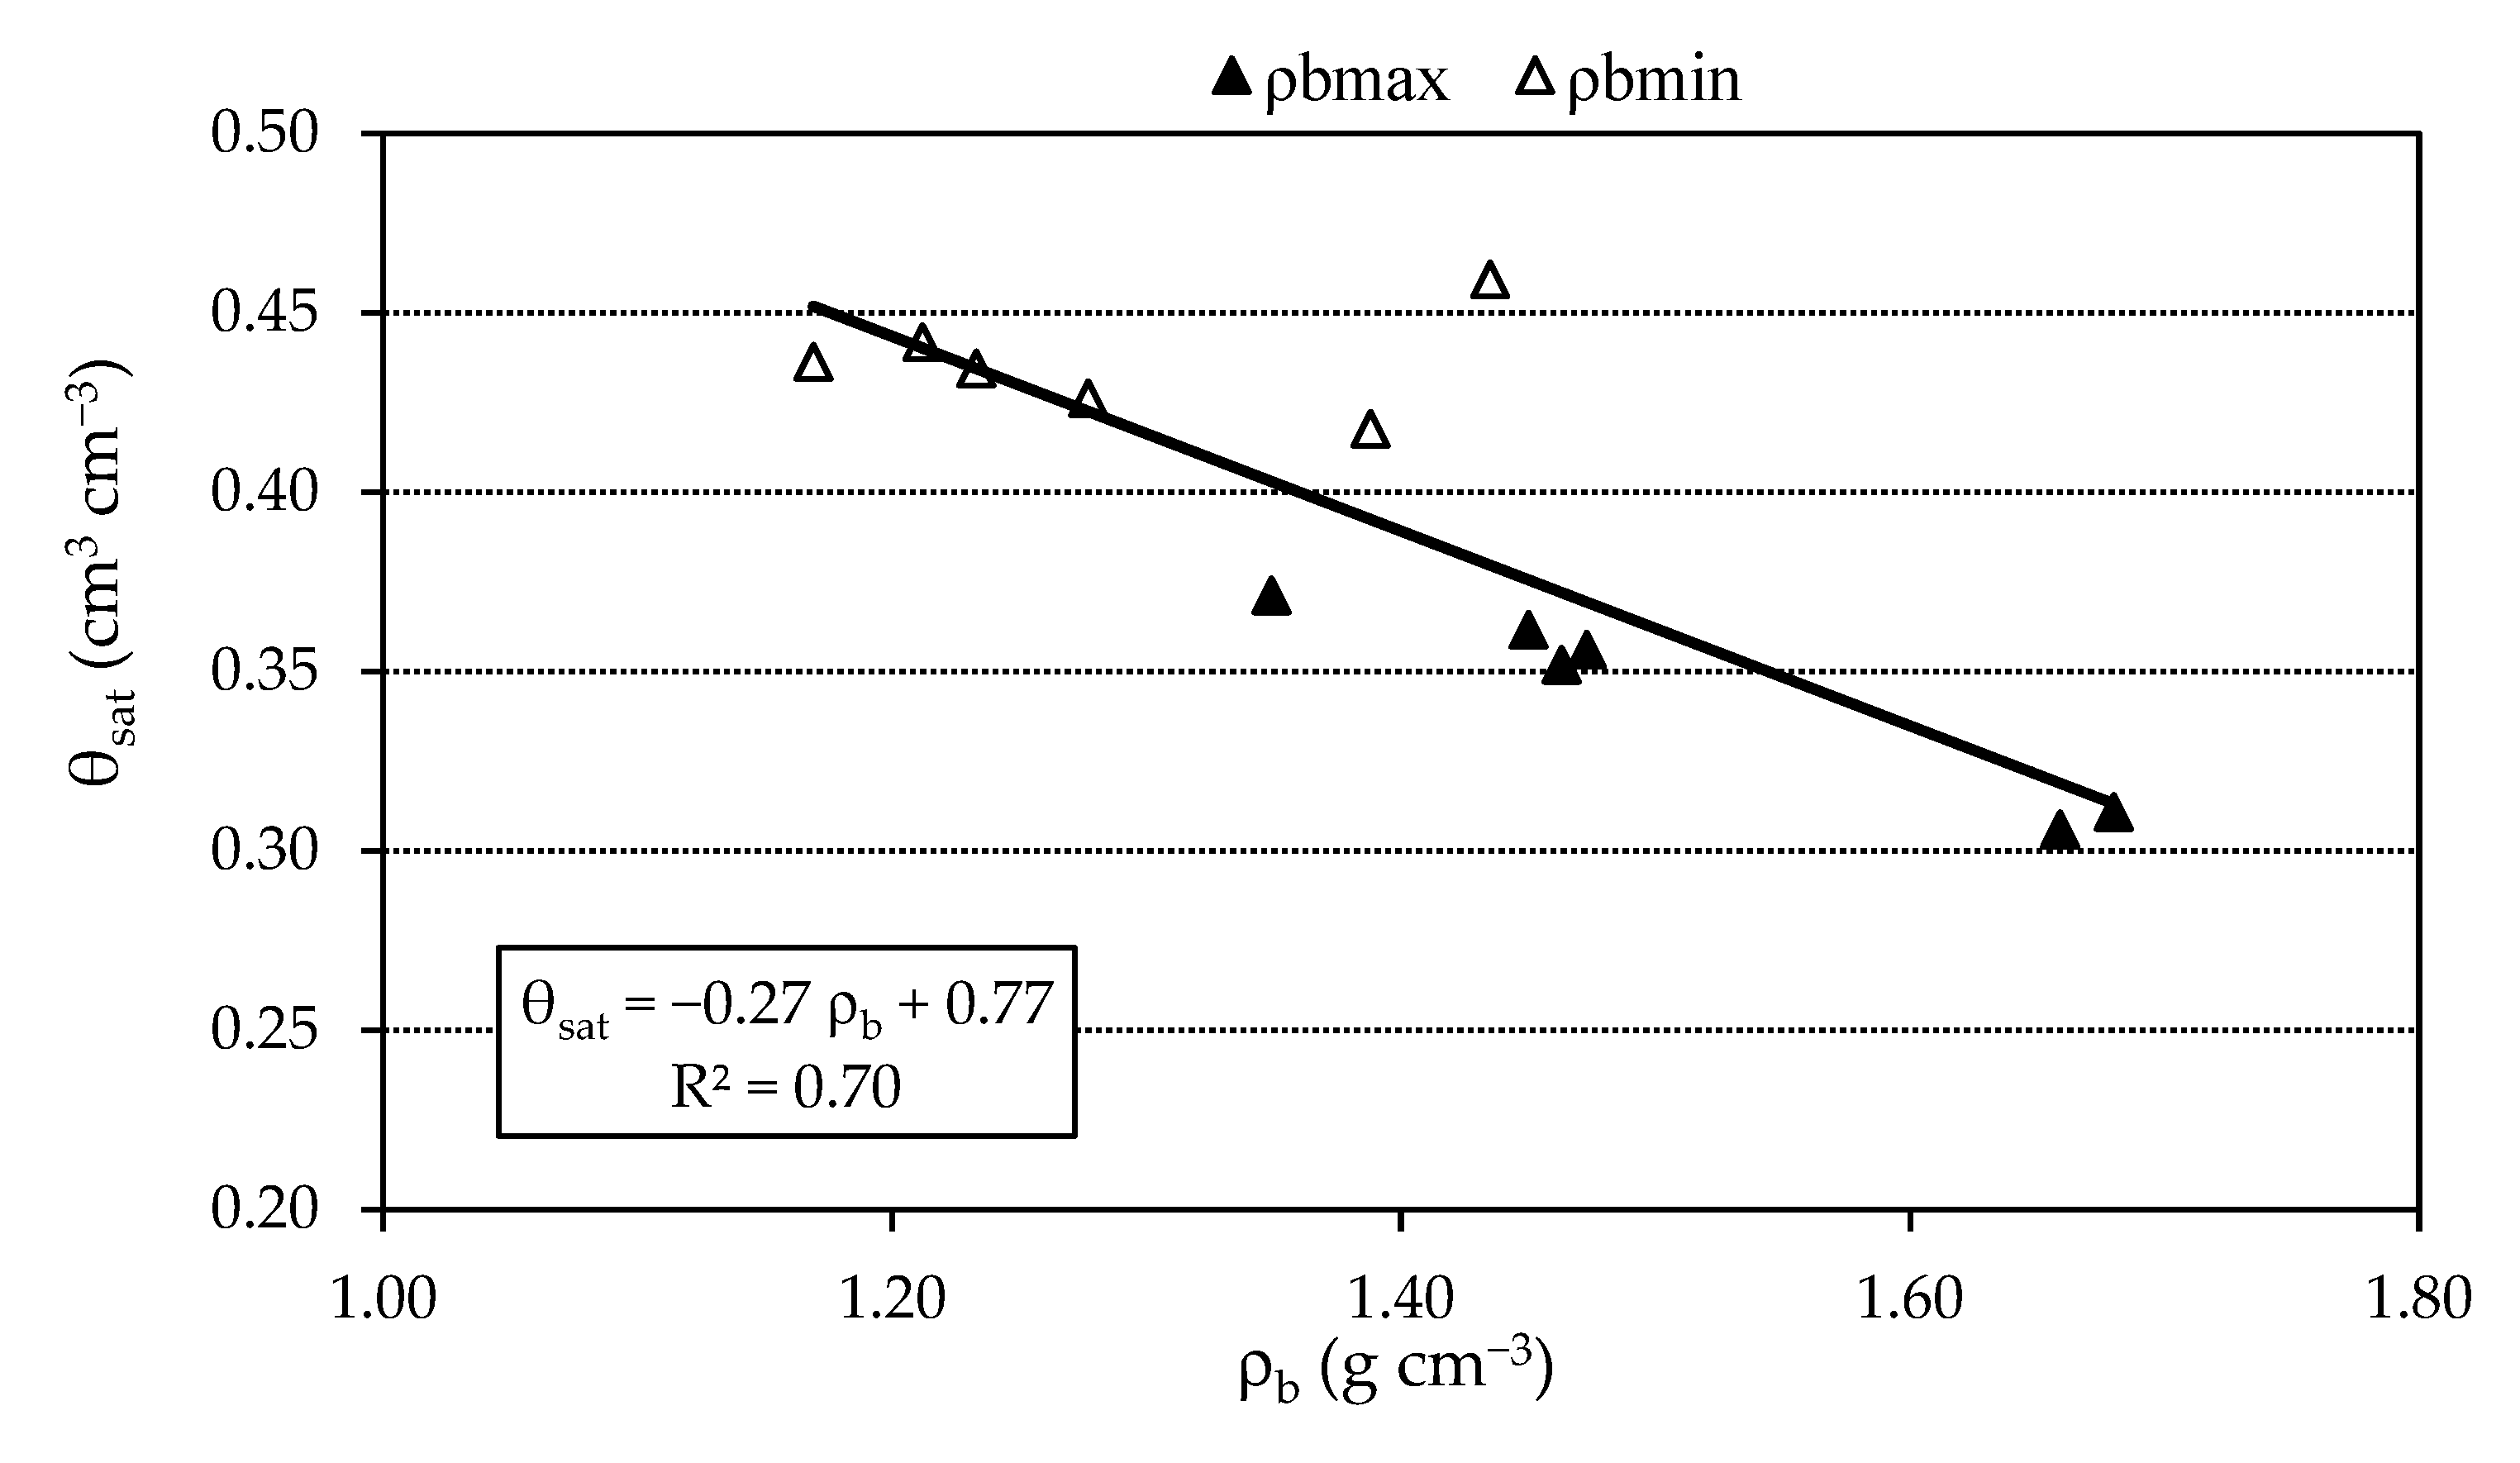
The relationship between saturated water content (θ
sat) as a function of the soil bulk density obtained in repacked monoliths is shown in
Figure 4. The values of θ
sat, decreasing at increasing ρ
b, were highly (R
2 = 0.70) and negatively correlated with ρ
b. As can be noticed, two groups can be clearly distinct, the first, with the highest θ
sat values (0.42–0.46 cm
3 cm
−3), obtained from repacked monoliths with the minimum ρ
b and the second, with the lowest θ
sat (0.31–0.37 cm
3 cm
−3), obtained from monoliths with the maximum ρ
b. Of course, this result was expected, since in more compacted soil the pore volume is smaller and, consequently, the saturated water content is lower.
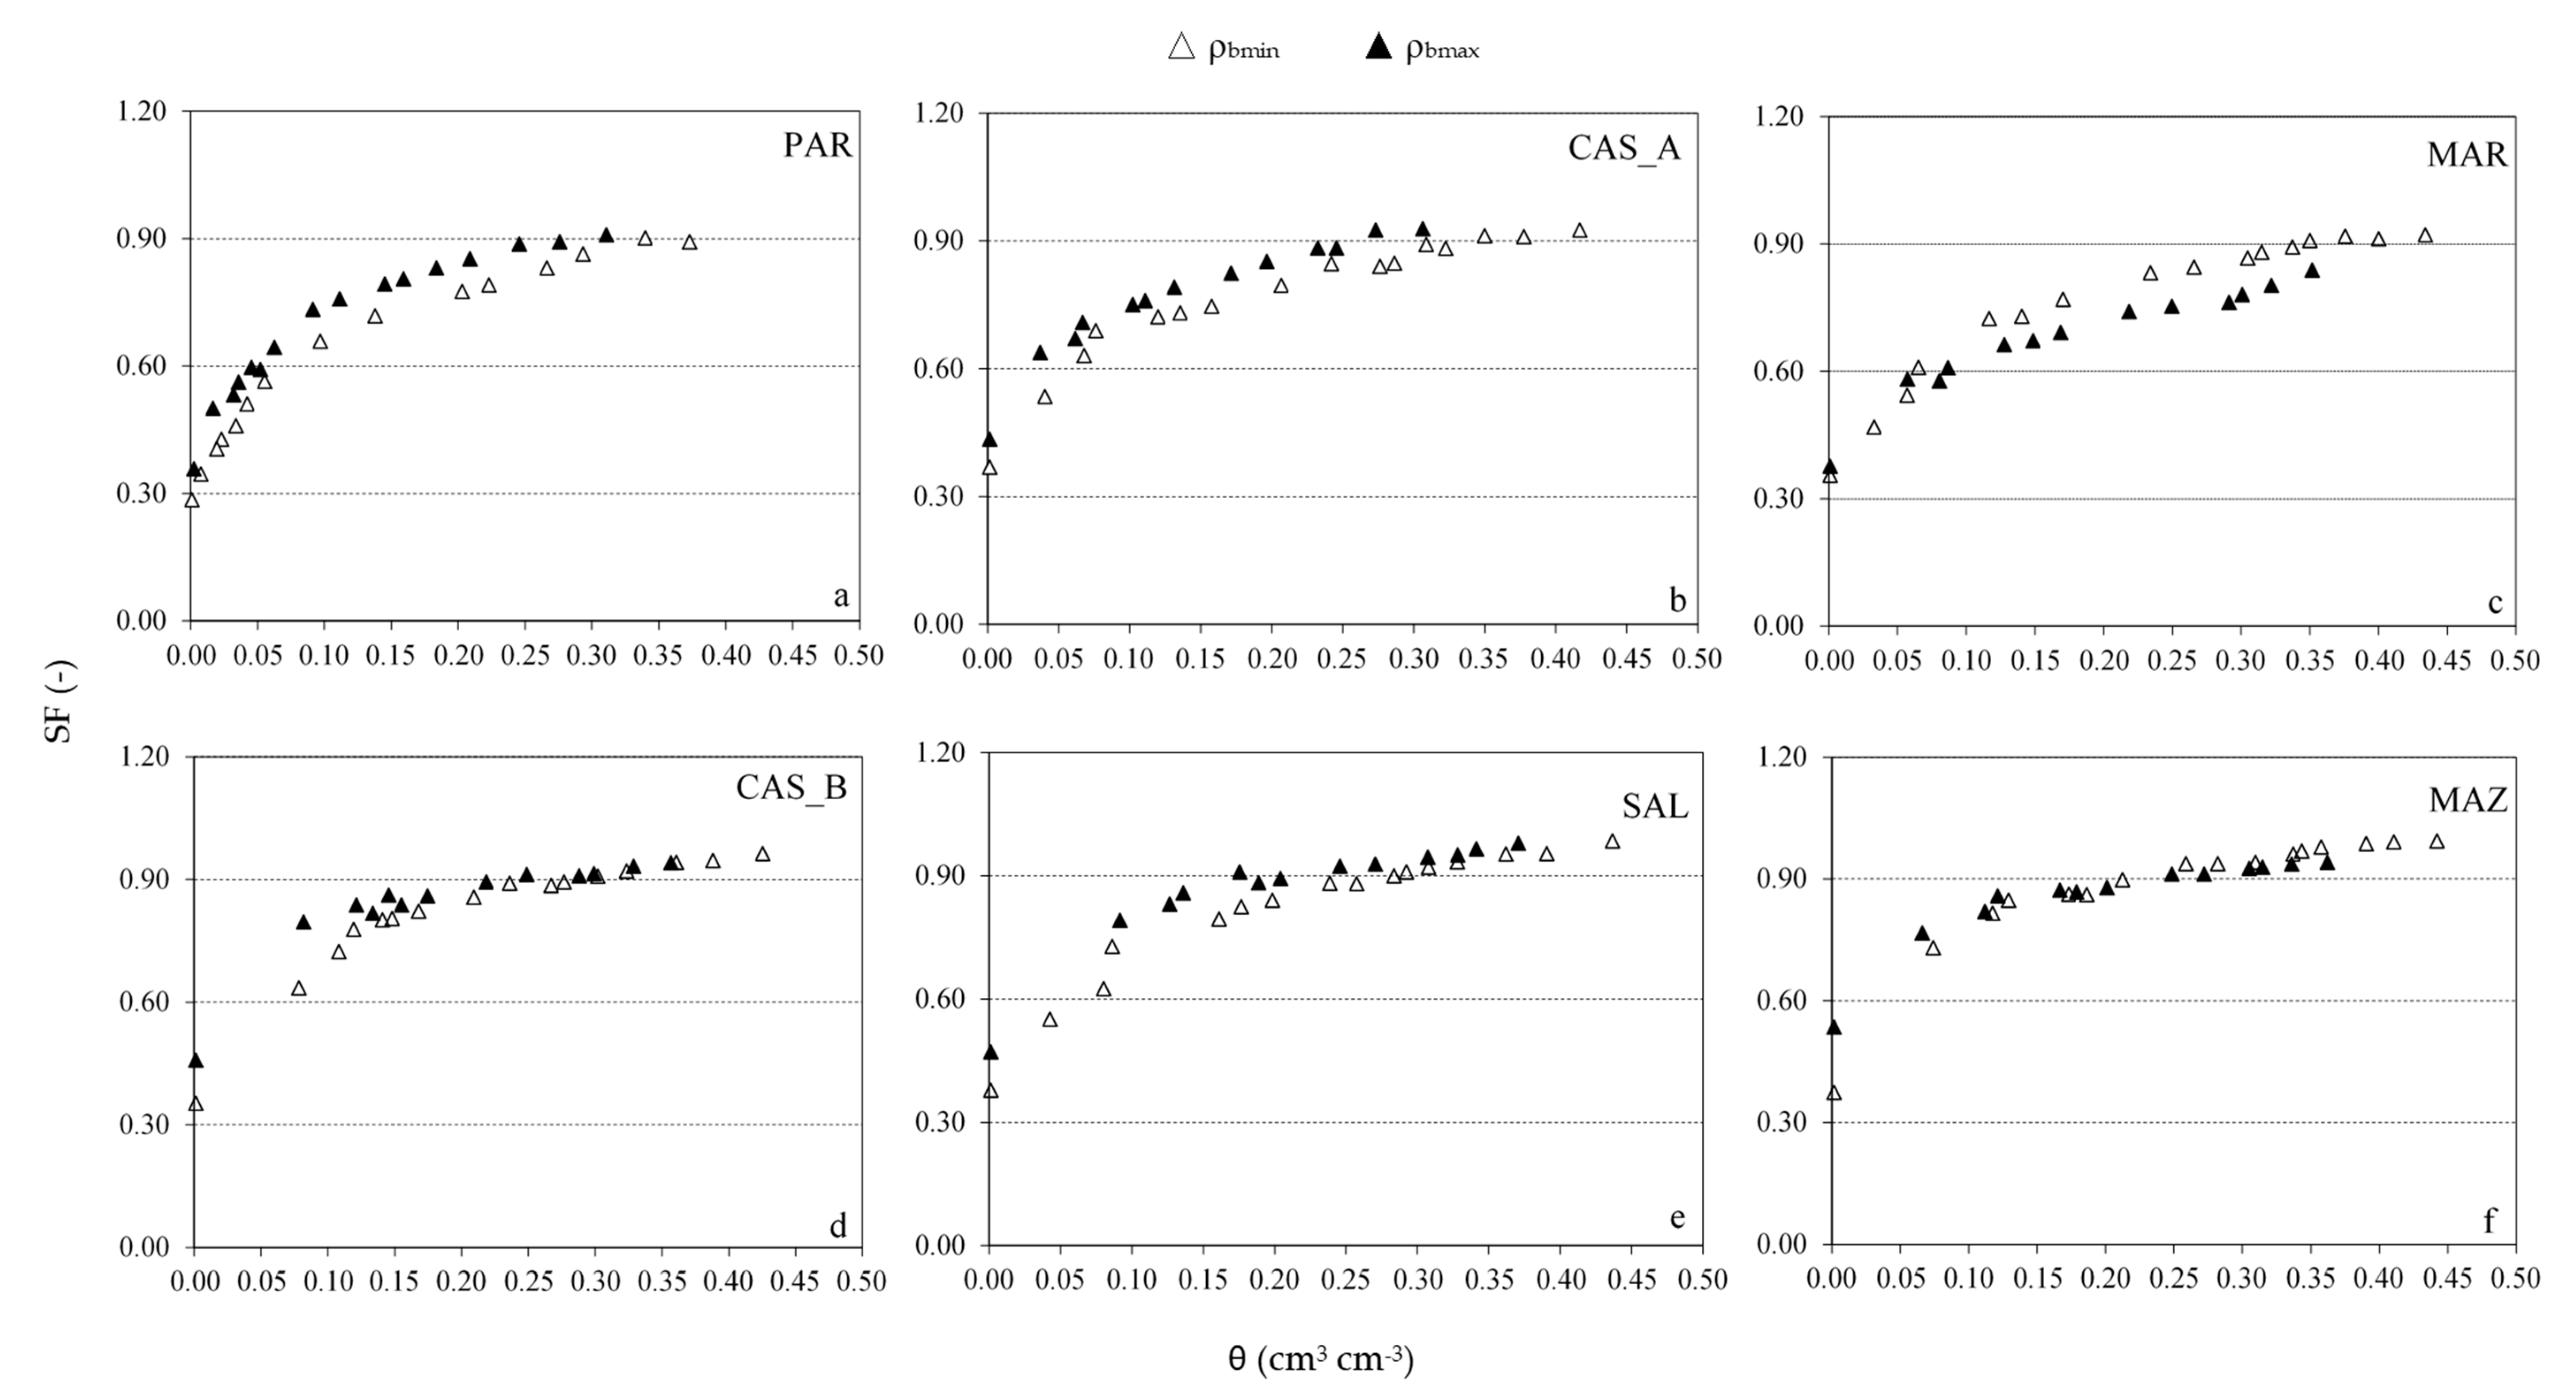
For all the investigated soils,
Figure 5 shows the scaled frequency (SF) measured by the Diviner 2000
® probe, as a function of volumetric soil water content (θ, cm
3 cm
−3), obtained on repacked monoliths. During the initial phase of the air-drying process, the variations of SF observed for a fixed reduction of θ resulted in smaller soils characterized by relatively higher clay content (
Figure 5d–f), as well as in the samples with lower clay content and repacked at the minimum ρ
b (
Figure 5a–c).
Moreover, for the soils with low clay content (
Figure 5a,b), it is possible to notice that at any fixed volumetric water content generally higher SF values corresponded to the maximum ρ
b. On the other hand, for soils with relatively higher clay content (
Figure 5d–f), the differences in SF values at a fixed θ resulted in more limited and, in some cases absent. For these soils, the SF(θ) curves obtained with maximum and minimum bulk density resulted in being very close.
Thus, the calibration equations obtained for rigid soils cannot reflect the actual soil moisture in shrinkage/swelling soils since it cannot account for the increase of soil bulk density occurring at decreasing θ.
This circumstance encouraged us to modify the manufacturer’s calibration equation to introduce ρ
b as an independent variable, in the following form:
where θ (cm
3 cm
−3) is the volumetric water content; k, j, and p are estimated parameters affecting the shape of the calibration curve; SF is the scaled frequency; and ρ
b (g cm
−3) is the soil bulk density. For rigid soils, in which ρ
b values do not change with soil water content, the term
assumes a constant value corresponding to the one appearing in the calibration equation suggested by the manufacturer.
For each soil and both the examined bulk densities, the estimation of parameters k, j, and p, summarized in
Table 3, was carried out, maximizing the Nash–Sutcliffe Efficiency (NSE) index based on the data collected on repacked monoliths. As it can be observed, the values of k ranged from 0.54 to 1.24, of j varied between 3.09 and 5.75, and, finally, p between 2.00 and 3.26.
The possibility to estimate the values k, j, and p based on physical soil attributes was then investigated. Specific empirical functions were established after identifying the dependence of k parameter from the sand content and of j and p from the clay content. The following best-fitting equations were then identified:
where S and C are the sand and clay in g g
−1.
3.3. Validation Analysis
Validation analysis was carried out on both repacked and undisturbed monoliths. For repacked soil samples, the relationships between the estimated volumetric soil water content and the scaled frequency obtained with the proposed model (Equations (5)–(8)) adapted fairly well to the experimental measurements.
For all the examined samples, in fact, RMSE values resulted in being lower than 0.067 g g
−1, with MBE values ranging between −0.035 and 0.028 g g
−1 and NSE always higher than 0.73 (
Table 4), indicating that the calibration equation accurately reproduced the volumetric soil water contents measured on repacked samples.
When referring to the undisturbed soil monoliths,
Table 5 shows the values of minimum and maximum bulk density corresponding, respectively, to saturation and oven-dried conditions, as well as the variations of soil bulk density.
As it can be noticed, the coarser soil samples (PAR, CAS_A, MAR, and CAS_B) were characterized by the lower variations of soil bulk density, while in the soils with the finer texture (SAL and MAZ), due to the presence of swelling clay, the variations of soil bulk density resulted higher than 20% (data are not shown).
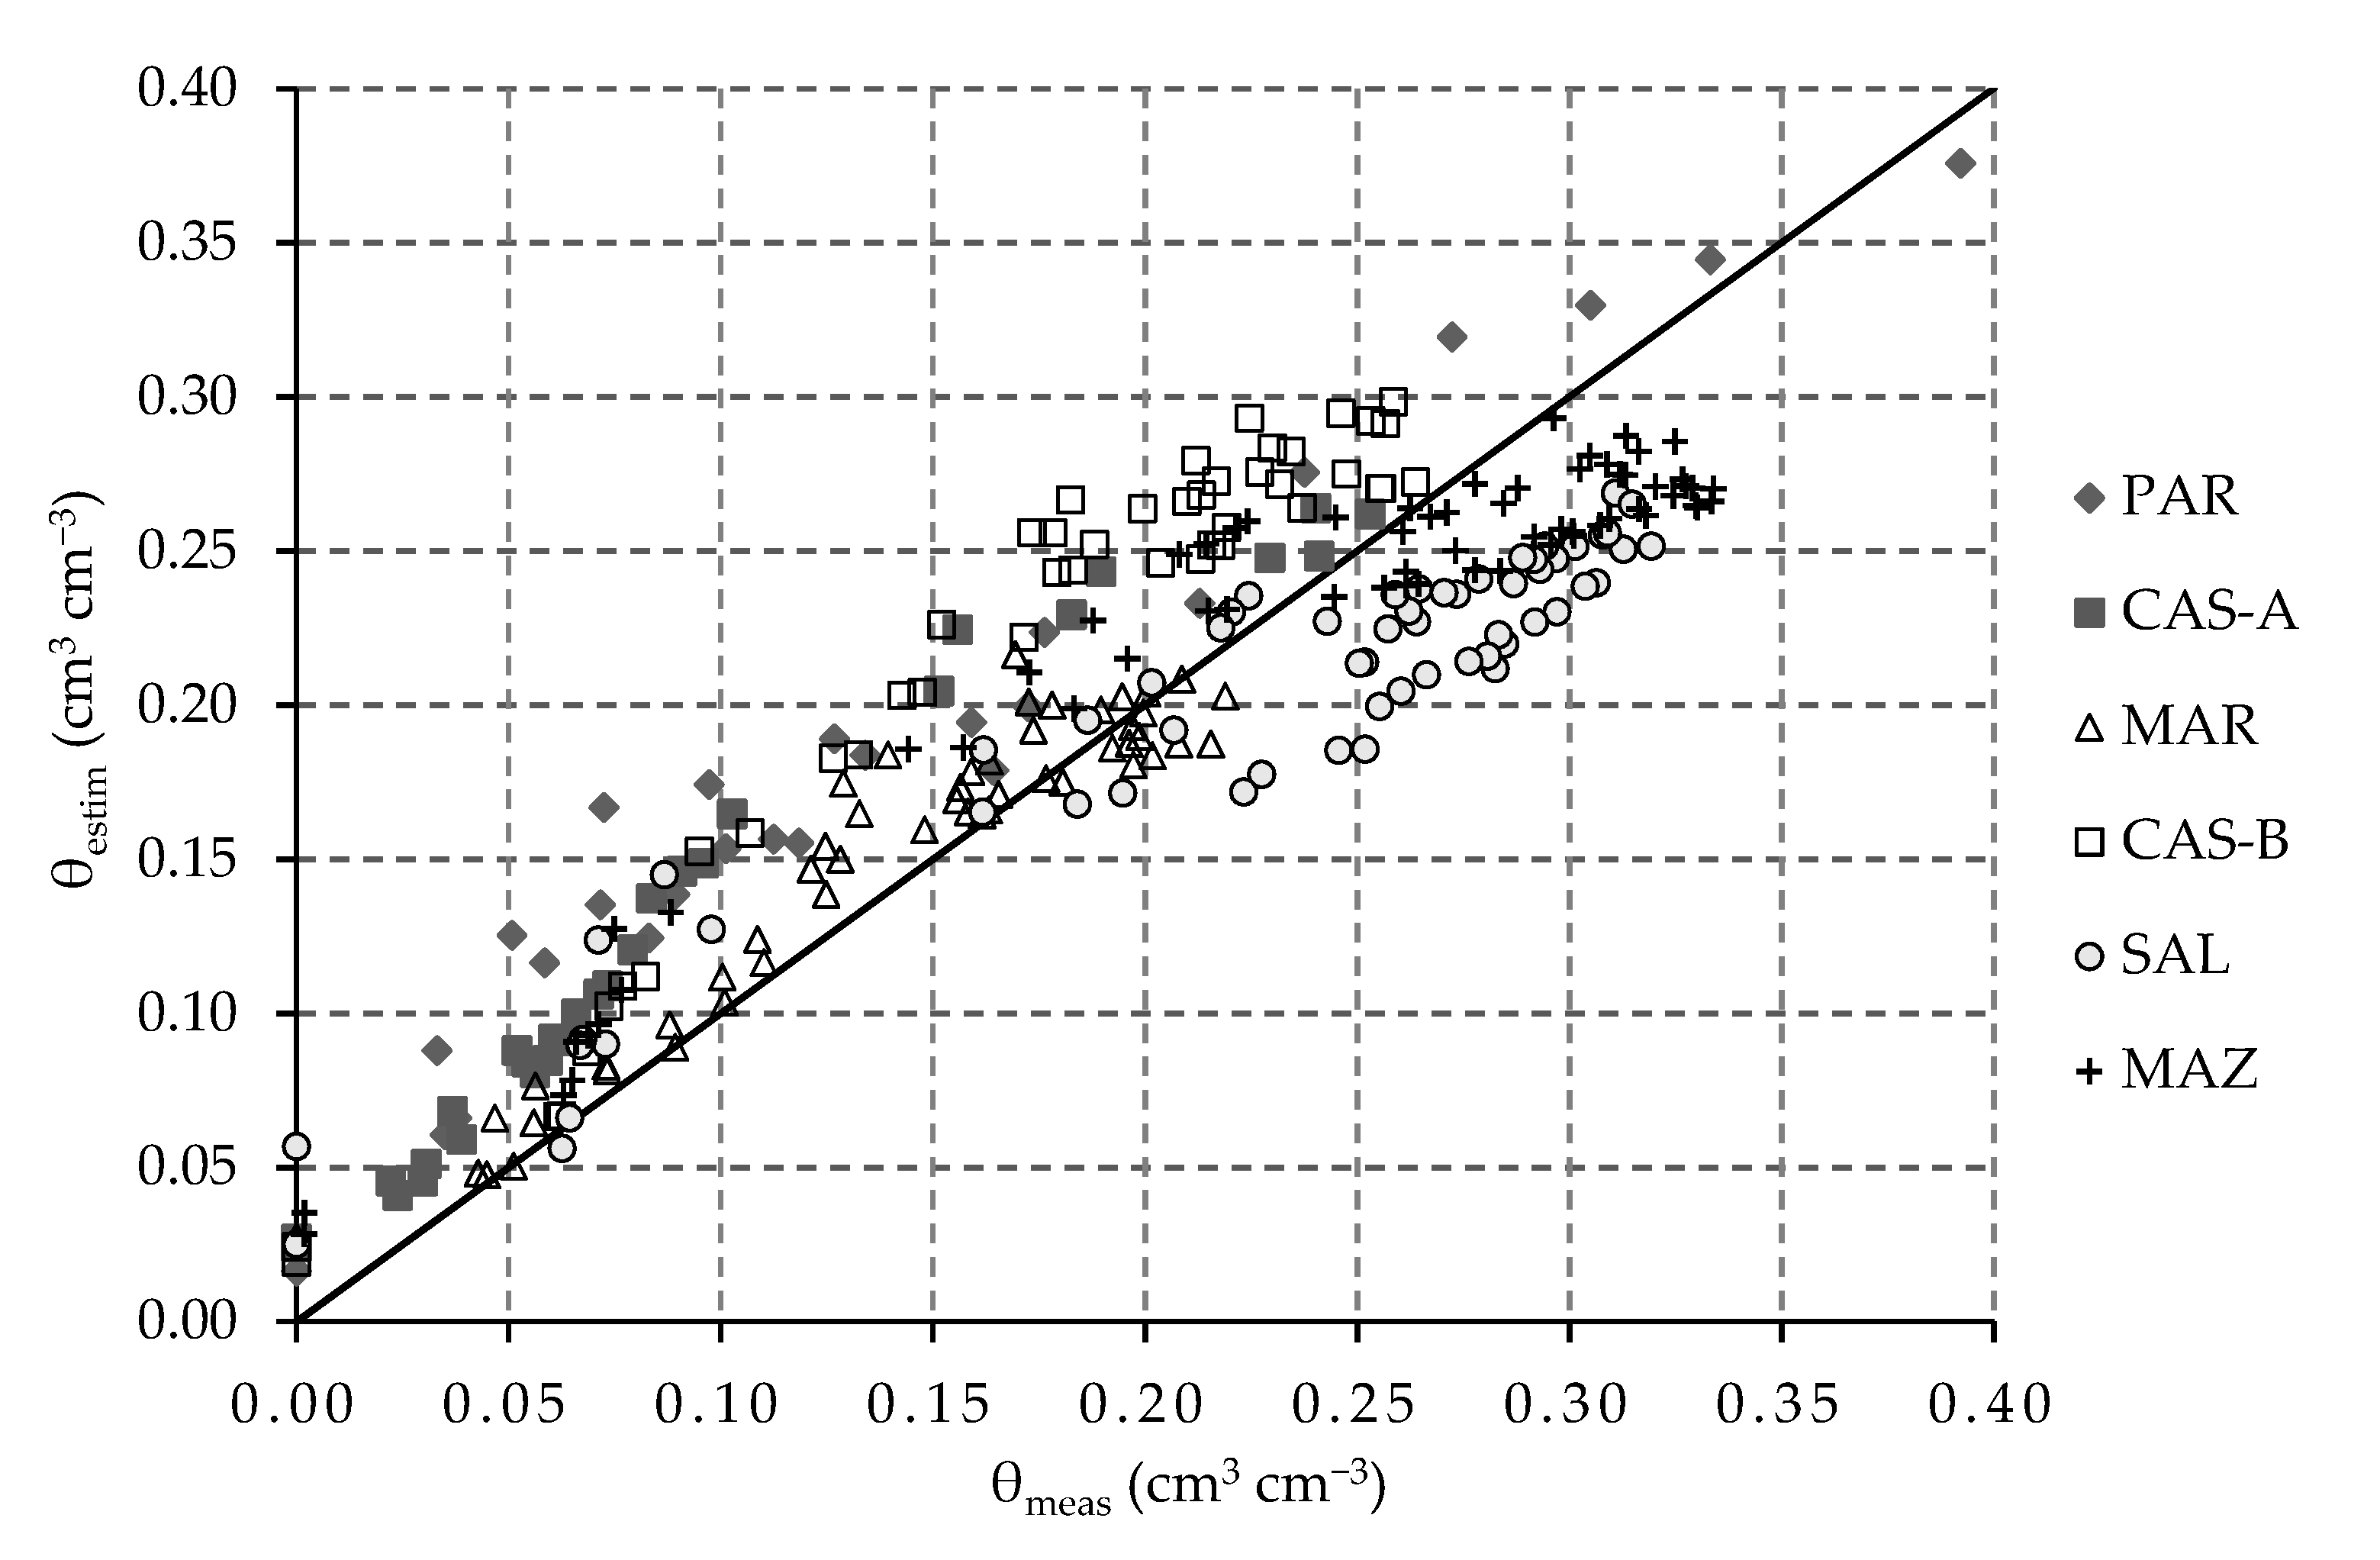
Figure 6 shows the graphical comparison between the measured volumetric soil water content (θ
meas) and the corresponding values estimated with the proposed model (θ
estim).
It can be observed that the volumetric soil water contents estimated by the proposed model were quite close to the corresponding measured, despite a slight overestimation in the whole range of the characterized samples PAR and CAS-A. A certain underestimation at the relatively higher values of θmeas was evident only for samples SAL and MAZ, characterized by the highest percentage of finer particles. It is possible to notice that the soil samples were characterized by a different dispersion around the perfect fitting line. The highest errors were associated with the samples CAS_B, SAL, and MAZ, characterized by the relatively higher content of finer particles, in which the shrinkage of soil samples occurred at decreasing soil water content starting from saturation. For these samples, the differences between estimated and measured soil water contents exceeded ±5% in 45%, 37%, and 17% of cases, respectively. On the other hand, for samples characterized by a coarser texture (PAR, CAS_A, and MAR) soil water contents resulted in general overestimation, with differences between estimated and measured values never exceeding 5% for the sample MAR, while exceeding 5% in 24% (PAR) and 23% (CAS_A) of cases.
Table 6 summarizes the statistical parameters obtained by comparing the estimated volumetric soil water contents and the corresponding values measured on undisturbed monoliths.
According to the RMSE values, always lower than 0.049 cm3 cm−3, the quite low MBE values, ranging between −0.028 and 0.045 cm3 cm−3, and the positive NSE, the suitability of the model was confirmed, even for soils in which swelling/shrinkage processes occurred. On the other hand, a worse performance (lower and negative NSE values, MBE always higher than 0.049 cm3 cm−3, and RMSE always higher than 0.057 cm3 cm−3) was associated with the calibration equation suggested by the manufacturer for the indirect estimations of volumetric soil water contents based on the actual values of soil bulk density (data are not shown).
4. Discussion and Conclusions
Considering that the soil bulk density is mainly influenced by the particle size distribution, in this study a certain amplitude of maximum and minimum bulk density values was investigated by considering soils in a range of textural class from Loamy Sand to Clay (
Table 2).
In several studies, the variations of soil bulk density with the particle size distribution were investigated [
40,
41,
42,
43]. Thus, soils with higher clay content tend to achieve lower values of bulk density with significant negative correlation [
41,
42], whereas soils with higher sand content resulted in strong positive correlations with soil bulk density [
42].
The experimental data obtained on repacked soil monoliths showed that the variations of ρ
b resulted in absent or very limited when considering the samples with the coarser texture (PAR, CAS_A, MAR, and CAS_B) and more pronounced for the other samples (SAL and MAZ). In particular, the former samples repacked with the minimum bulk density evidenced values of ρ
b almost constant or slightly variable during the drying process with variations ranging from about 3% (PAR) to 18% (CAS_B) (
Figure 2a–d). The higher variations of soil bulk density were mainly due to the rearrangement of soil particles (subsidence) and, limitedly, to the shrinkage process, except for the sample CAS_B, in which the latter process could have been dominant. On the other hand, when the samples with the coarser texture were prepared with the maximum bulk density, the variations of ρ
b resulted quite limited (
Figure 2a–d), and always lower than 7%, as a consequence of the high level of compaction achieved when the sample was prepared.
A different behavior was observed for the soils with the highest clay content (SAL and MAZ) for which the variations of ρ
b resulted quite high (up to about 25%) for the samples repacked at both minimum and maximum bulk densities (
Figure 2e–f). For these samples the soil shrinkage curves followed a similar tendency from saturation to oven-dried; the presence of the residual and basic phases of the shrinkage process [
44,
45,
46,
47] was identified in all the samples, whereas the structural phase manifested only in the samples prepared at the minimum bulk density.
Thus, it was possible to observe that, depending on the physical characteristics, the soil can achieve different degrees of compaction during an air-drying process, indicating that the shrinkage curve depends on the presence of swelling clay and its related percentage. The proposed calibration equation requires the knowledge of the soil shrinkage characteristic curve. When, for a certain soil, the SSCC is unknown, to avoid laborious and time-consuming measurements, the curve can be estimated based on the procedure suggested by Crescimanno and Provenzano [
6] for undisturbed soil cores, once the soil clay content and the gravimetric water content at saturation are known. However, in the latter case, the approximate solution of Equation (5) had to be found with an iterative process, since the term ρ
b appears in both sides of the equation, which assumes an implicit form.
Moreover, observing
Figure 2a–f, it can be noticed that for each examined soil, the range of measured U differed between the two samples repacked at maximum and minimum bulk density. Due to the higher porosity, relatively higher saturated water content corresponded to the samples prepared at ρ
bmin; to give an example, for CAS-A sample (
Figure 2b), the maximum soil water contents resulted in being equal to 0.30 g g
−1 and 0.18 g g
−1 under ρ
bmin and ρ
bmax, respectively. According to Böhme et al. [
48], the soil texture, associated to the size pore distribution, regulates the aeration status and, consequently, the soil water content. Therefore, the importance of monitoring the changes in soil bulk density is highlighted, mainly for swelling clay soils and in the drier range of soil moisture (
Figure 3). Consequently, the need to make explicit the bulk density as an independent variable in the calibration equation to estimate gravimetric soil water content is desirable.
The contextual measurements of U, SF, and ρ
b acquired on repacked soil monoliths confirmed the dependency of SF measured by capacitance sensors from ρ
b [
49]. As a consequence of the contraction process, the variations of the soil dielectric permittivity depend on the combination of the mutual proportions between the water and air present in the soil volume investigated by the sensor (
Figure 5).
In soils with the relatively higher clay content, the scaled frequency measured by the sensor for a wide range of θ close to saturation was slightly variable (
Figure 5e,f). For these soils, the changes of soil water content were compensated, totally or partially, by the variations of bulk density, so that the scaled frequency measured by the sensor resulted in being almost constant (
Figure 5e,f). These results confirmed the need to account for the changes in the bulk density in the calibration equation of capacitive sensors, as pointed out in previous investigations [
18]. In soils with the relatively higher clay content, the compensative effect on SF was mainly recognized in the structural and basic phases of the soil shrinkage curve, with the highest variations of SF observed in the residual phase of the shrinkage process, when the soil bulk density reached the maximum values (
Figure 5e,f). On the other hand, in repacked soil monoliths with relatively lower clay content, in which the variations of soil bulk density were absent or limited (PAR, CAS_A, MAR and CAS_B), the sensor readings resulted in monotonically decreasing during the air-drying process (
Figure 5a–d).
Some researchers and the manufacturer have underlined the sensibility of downhole sensors to air gaps and to the possible variations of the soil bulk density with the depth, as well as to the possible systematic errors on readings caused by the incorrect installation of the probe access tube [
14,
31,
34,
50,
51,
52]. Despite the possibility to avoid air gaps by fitting tightly the access tube in the soil, in heavy clay soils with swelling/shrinking characters, the possibility of cracks’ occurrence in the sphere of influence of the sensor, which can strongly affect the reading accuracy, cannot be avoided [
53].
As generally considered by other researchers [
14,
18,
21,
22,
51], the proposed model assumed as dependent variable the volumetric soil water content. Moreover, the possibility to estimate the equation parameters based on the particle size fractions was proposed and validated with the experimental data collected on both repacked and undisturbed soil monoliths. As a result, a simple model to estimate the volumetric soil water content as a function of soil bulk density and the scaled frequency measured by the sensor was provided.
In conclusion, this study allowed deepening the knowledge on the calibration of the capacitive Diviner 2000® sensor and to propose a new model to estimate volumetric soil water content, θ (SF, ρb), introducing the soil bulk density as an independent variable representing the characters of soil expandability.
The use of repacked monoliths having volume slightly higher than that investigated by the sensor allows determining simultaneously, during an air-drying process, the sensor calibration curve and the soil shrinking characteristic, avoiding the difficulties associated with the field calibration. Thus, repacked monoliths were prepared in the laboratory with sieved soils and the dependence of the parameters of the proposed model from sand and clay fractions was also identified. This research tried to overcome the existing gap in studies related to calibration of capacitance probes in swelling/shrinking soils, in which wide variations of soil bulk density can occur during drying.

 ,
, 


