Article

Functional Feasibility in Optimal Evaluation of Water Distribution Network Performances

1
Department of Civil and Environmental Engineering, Politecnico di Milano, 20133 Milano, Italy
2
Institute for Systems Engineering and Computers at Coimbra, Department of Civil Engineering, University of Coimbra, 3004-531 Coimbra, Portugal
*
Author to whom correspondence should be addressed.
Water 2020, 12(12), 3404; https://doi.org/10.3390/w12123404
Submission received: 5 October 2020 / Revised: 27 November 2020 / Accepted: 30 November 2020 / Published: 3 December 2020

Abstract

:
The traditional approach for the optimization of water distribution networks (WDNs) does not always lead to consistent solutions from an operational point of view. The latest optimization algorithms identify solutions that are “the best solutions” in mathematical terms but that can be less than robust against changes in operating conditions, resulting in the worst case in hydraulically infeasible configurations. Thus, this paper aims to provide a methodology that can synthesize the network performance capabilities under the change in operating conditions with two convergent strategies. The first consists of the implementation of new performance indices (PIs), the demand deficit and the pressure range, and the evaluation of their ability to criticality highlight in operating conditions. The second is the introduction of a new approach to weight the infeasible solutions in the final result, which are those inconsistent with the real hydraulic network performances. The analysis shows that the use of these new indices makes it easier to understand the behavior of the network and to identify any weaknesses. This is true if these indices consider the hydraulically inconsistent solutions that may arise from the simulations of different operation conditions; otherwise, results that poorly represent the real behavior of the network would be obtained.

1. Introduction

1.1. Multi-Objective Optimization Algorithms

Early research on the optimization of water distribution network can be dated back to the end of the 1960s, where the most popular optimization methods were linear programming [1,2] and nonlinear programming [3]. A significant advancement in water distribution network (WDN) optimization was the introduction of heuristics methods in 1990s, as they are efficient in handling discrete variables and do not require derivative calculations. In addition, as their sampling is global, it reduces the tendency to become entrapped in local optima, and the dependency on a starting point is avoided. Among the most popular methods are genetic algorithms (GA) [4,5,6,7], simulated annealing (SA) [8,9,10], and Tabu search (TS) [11,12]. Most of these works solve basic design problems, i.e., single-objective least-cost design, using benchmark networks (two loop [2], Hanoi [13], and New York City Tunnel [1]). The evolution of cities and population growth have led to the modification and expansion of existing water networks. This resulted in a growing interest in the problem of the optimization of water networks for the least-cost design system without affecting the proper operation of the hydraulic system and consumer supply. This led to the concept of multi-objective optimization, where the problem has not one unique solution, but a Pareto optimal set of solutions, which represents the best trade-off between the objectives [14]. Halhal et al. [15] were the first to solve the Anytown problem through a multi-objective approach including two objectives: minimizing the network cost and maximizing the benefit. Here, the benefit represents the improvement of the degree of service experienced by consumer associated with a system cost reduction. To solve the optimization problem, the Structured Messy GA was used.
Many real-world problems are many-objective problems, i.e., they have more than three objectives [16]. Their major complexity lies in the fact that they show problems relating to convergence, diversity, and computation time. The literature shows an evolution in the approach of the problem of WDN optimization with the development of the multi-objective evolutionary algorithms (MOEAs). One of the most popular algorithms is the nondominated sorting genetic algorithm, NSGA [17], and the later NSGA-II [18]. Even if the NSGA-II has overcome some criticisms of the NSGA, e.g., the high computational complexity and the lack of elitism, it still highlighted problems of convergence. The idea that developed in the following years was the use of a domination principle that adaptively discretized the Pareto optimal front to speed up the search process. For example, the ϵ-dominance principle [19] makes all points within an ϵ-distance from a set of Pareto-optimal points ϵ-dominated; rather than maintain a fixed-sized population, an ϵ-dominance dynamic archive is introduced, growing and retiring during the evolutionary search. This process preserves both convergence and diversity. Another strategy is represented by using predefined multiple targeted searches, instead of searching the entire search space for Pareto optimal solutions. Algorithms based on ϵ-dominance concept are ϵ-NSGA-II [20] and Borg-MOEA [21]. One of the most recent optimizers is the genetically adaptive leaping algorithm for approximation and diversity (GALAXY), a hybrid MOEA whose strengths are the alleviation of the parametrization issue and its high computational efficiency [22].
Beside these MOEAs, other methods such as the trajectory-based algorithms were improved in recent years with the aim of making them suitable for the increasing complexity of the problems. Even though they are less widespread than the population-based algorithms in the problem of the optimization of WDNs, some recent applications show that these algorithms are very promising. Cunha et al. [23] presented an upgrade of the simulated annealing multi-objective algorithm, the multi-objective simulated annealing with new generation and reannealing procedures (MOSA-GR). At the beginning, the algorithm uses different generation strategies at different stages of the search procedure to define candidate solutions. Then, based on the final solutions of this phase, a reannealing process is implemented at low temperature to enhance the search process. This make it possible to explore the solutions step by step and to find denser Pareto fronts with uniformly distributed solutions. The results show that MOSA-GR has a very good performance using a limited number of function evaluations.
Beside the problem related to the multi-objective optimization scheme, another relevant issue highlighted recently by researchers concerns the best way to take into account the uncertainty in WDN management.

1.2. Account of Uncertainty in WDN Management

The approach used to deal with the problem of optimization of WDNs has evolved over the years, leading most recently to a widespread interest in future uncertainty. A limit of the deterministic approach is the lack of consideration of both uncertainty in the model parameters and in the future operating conditions [24]. Several approaches to deal with uncertainty in model parameters were analyzed by Savic [25], for example, the use of standard safety margins for uncertain parameters such as nodal demands and pipe roughness and the use of robustness evaluation methods. The results demonstrate that neglecting uncertainty in the design process may lead to severe under-design of water distribution networks. Regarding the future uncertainty, the solution of the optimization process, although optimal for the present scenario, may worsen if reality turns out to be different. To overcome this problem, a robust optimization method was developed [26], which consists of a scenario-based proactive approach in which uncertainty is included from the beginning of the decision process. It considers a set of scenarios, each one associated with a probability of occurrence, whose purpose is to make the network works well even in adverse conditions. Certainly, the price to be paid for a more robust and secure network in the future is an increase in costs.
The idea of considering a planning horizon consisting of several construction phases was also investigated [27]; this allows planners to actively manage the configuration of the network over time as new information becomes available. The flexible design strategy determines the value of the decision variables for the first phase and for several scenarios that arise from the possible different decision paths that can be followed in the future. Basupi and Kapelan [28] developed a flexible design using a multi-objective optimization with two objectives: the total cost and the resilience. This approach was tested on the Anytown and New York Tunnels networks, and the results demonstrate that the flexible design can lead to lower economic costs and a better hydraulic performance when compared with the corresponding deterministic staged design. Marques et al. used simulated annealing to solve a two-objective optimization model, including flexible design [29], and then considering the three-objective optimization problem, they minimized the costs, pressure deficits and carbon emissions [30].
Among the most important factors that can affect the future performances of a network are the change in water demands and the deterioration of the mechanical components of the network. Wagner et al. [31] suggest that both of these aspects should be considered during water distribution system design. Later, further researchers assessed the most appropriate way to quantify both forms of performance of the WDN, mainly through the evaluation of different performance indicators [32,33]. These studies show that the combination of different indices is essential to design a network that can best cope with future changes, both in terms of hydraulic behavior and resilience to potential breakage of mechanical components. Moreover, the choice of indices is crucial too, since their optimization highlights different aspects of the network performances.
The aim of the paper is to present a new procedure for the analysis of WDN performances in order to facilitate the reliable design of networks that may be more robust to possible future changes in operation conditions. Particularly, a new approach is proposed to better take into account the infeasible solutions (inconsistent with real hydraulic network behavior) that may emerge. Moreover, two new performance indices (PIs) are also proposed, the demand deficit and the pressure range, which are able to highlight critical scenarios in network operation. The suggested procedure is based on a weight system applied to PIs evaluated in different operating scenarios. Application to three benchmark networks is presented, where a two-objective optimization model is implemented (using the GALAXY MOEA) to obtain a Pareto front of solutions, from which a subset of network settings is selected, and PIs are evaluated.
The paper is structured as follows: in Section 2, the different steps of the methodology are presented; Section 3 contains the results of its application to three benchmark networks; conclusions and main findings are shown in Section 4.

2. Materials and Methods

The first step is the application of a multi-objective optimization algorithm to obtain a Pareto set of solutions. From the Pareto front, a subset is selected to be tested under different scenarios of demands and pipe breakage. Network performances are evaluated through a system of PIs by also weighing the infeasible solutions that may derive from the scenario simulations. The methodology adopted is set out in the flowchart in Figure 1.

2.1. Optimization Model and Solution Algorithm

The two-objective formulation considers the minimization of the cost and the maximization of the network resilience [34]. The resilience is defined as the capability of the system to adapt to internal and external changes by maintaining its operative conditions. The resilience index was first introduced by Todini [35] as a measure of network benefits. Then, an improved version of the index, the network resilience index, was proposed by Prasad and Park [36]. It considers the uniformity of nodes, because if the pipes connected to a node are not widely varied in diameter, reliable loops are ensured. The total cost of the investment for the construction of a water distribution network includes several components. In addition to the cost related to the purchase and installation of pipe components, the life-cycle cost, i.e., the total money that has to be spent on the components and processes of a WDN during its existence, has to be considered. Given the complexity of such analysis and the little significance in this type of study, only the expenditure of pipe components will be considered for the total cost. To take into account the redundancy of a pipe network, the network resilience index is used as the second objective. The corresponding formulation can be written as
min C = j = 1 n p a   .   D j b   ·   L j
max I n = i = 1 n n C i q i * ( h i h i * ) ( k = 1 n k Q k H k + j = 1 n p u P j / γ ) i = 1 n n q i * h i *
C i = j = 1 n p i D j n p i · m a x { D j }
where C is the total cost; np is the number of pipes; a and b are constants depending on the specific problem; Dj and Lj are, respectively, the diameter and length of pipe j.
In Equation (2), In is the network resilience; nn is the number of demand nodes; Ci, qi*, hi and hi* are the uniformity coefficient, demand, actual head and minimum required head at node i, respectively; nk is the number of reservoirs; Qk and Hk are the discharge and the head relevant to each reservoir k; npu is the number of pumps in the network; Pj is the power supplied by pump j; γ is the specific weight of water. In Equation (3), npi is the number of pipes connected to node i, and Dj is the diameter of pipe j connected to demand node i.
The two objective Functions (1) and (2) are subjected to a set of constraints.
i = 1 n p n Q i = q i *
j = 1 n p l o o p h j = 0
h i h imin
D j { D }
where Qi is the inflows or outflows of node i, q*i is the demand at node i, npn is the set of pipes entering or leaving node i, nploop is the pipes in a loop, Δhj is the head loss in pipe j, hi and himin are the actual head and the minimum requested head at node i, and Dj and {D} are the diameter of pipe j and the set of commercial diameters.
Equations (4) and (5) represent the conservation laws of mass and energy, expressed in terms of algebraic summation. Equation (6) represents the set of constraints for the minimum pressure at each node. Equation (7) expresses that the value of the decision variables, i.e., diameter of each pipe must be selected from the available set of commercial diameters.
The GALAXY algorithm (genetically adaptive leaping algorithm for approximation and diversity)—version available in the database of the Centre for Water Systems at University of Exeter during the period March to July 2019—is used to solve the two-objective optimization problem. GALAXY is a hybrid MOEA developed to deal with a discrete, multi-objective design of water distribution systems. In the generation step, six search operators are used in a genetically adaptive way. Then, in the replacement process, the Pareto dominance and the ϵ-dominance concept are combined. Given an intermediate population whose individuals have been ranked in accordance to the non-dominated sorting, if the number of the top rank individuals is less than the population size, the Pareto dominance replacement is performed. If the number of the top rank individuals is higher than the population size, the ϵ-replacement is performed, where the ϵ-non-dominated solutions are transferred in the new population and any empty spaces are filled with some ϵ-dominated solutions, those nearest to the global optimum. Thus, this allows some ϵ-dominated solutions to not be completely removed, and despite the crowding distance procedure, it avoids the elimination of solutions belonging to the Pareto optimal front.
The strength of the GALAXY parametrization issue lies in the fact that some simplifications have been made to allow for as few parameters as possible to be implemented in GALAXY as few. Normally, the search operators require several parameters to be set before use. Here, the effective components of each operator are identified and tailored to suite the discrete nature of the WDN design problem. As a consequence, GALAXY only needs to specify the two general parameters required by any genetic algorithm: the population size (N) and the number of function evaluations (NFEs). These values are chosen based on the complexity of different WDNs.
Algorithm solutions are spread on a Pareto front, from which a subset of suboptimal elements is selected. This selection is aimed to reduce the number of network simulations and is performed along the front to cover different cases.

2.2. Performance Indices

The evaluation of WDN performances under different operating scenarios can be achieved by the assessment of the performance indices. The PIs quantify the reliability of a structure, seen as the capability of the network to satisfy the requested demand, with sufficient pressure. Together with the cost and the resilience index implemented in the optimization algorithm, two new PIs are proposed in this study:
  • Demand deficit (DD) evaluated as the percentage of undelivered demand.
  • Pressure range (PR) evaluated as the variation of the nodal pressure out of the optimal operating range.
The two indices are developed to highlight the network capability of achieving satisfactory performances. The demand deficit index is a measure of the vulnerability of the network, which represents the unacceptability of the operation conditions of the system. It is evaluated for the node with the lowest pressure value as the difference between the requested nodal discharge (Qreq) and the real delivered discharge (Qdel).
D D = ( Q r e q Q d e l ) · 100 Q r e q
The pressure range index is a measure of the network capability to meet the design constraints for an optimal hydraulic operating condition. This range refers to the minimum pressure that allows the delivery of the requested nodal discharge and to the maximum pressure that is linked both to the maximum pipe resistance and to the working standards of the hydraulic devices connected to the network. The pressure range index is calculated for each scenario through Equation (9):
P R = i = 1 n n β   | h i 2 h r e f 2 | i = 1 n n h r e f 2
where nn is the number of nodes, hi is the actual pressure at node i, and β and href are evaluated as follows:
{ β = 0           i f           h m i n h h max β = 1           i f         h < h m i n       ;     h r e f = h min β = 1           i f         h > h m a x       ;     h r e f = h max
where hmin and hmax are the minimum and the maximum pressure constraints.
Although the DD highlights the local worst operating condition, i.e., the node with the lowest pressure, the PR considers all the nodes of the network, thus giving an overview of the feasibility of the operating conditions.
For the correct assessment of these PIs, a new way to consider the infeasible solutions that may derive from scenario simulations is also proposed. For each solution, the total number of infeasible configurations among all the scenarios should be considered. The infeasible configurations are those that exhibit negative pressures, thus making it impossible to provide any outflow.
Therefore, the PR and DD values are multiplied for an IC index (infeasible configurations), resulting in two new indices, weighted pressure range (PR*) and weighted demand deficit (DD*):
I C = n i n f n t o t · 100
P R * = P R · I C
D D * = D D · I C
With the number of scenarios ntot and the number of infeasible configurations ninf.

2.3. Network Simulation: Pressure-Driven Analysis

For the correct evaluation of the indices, it is necessary to consider the real delivered flow rate based on the node pressure, i.e., to simulate the network through a pressure-driven analysis [37]. The optimized network configurations are obtained by running the optimization algorithm simultaneously with the hydraulic simulator EPANET [38], which works as demand-driven software (DDA). This type of analysis produces correct results since the GALAXY algorithm imposes pressure restrictions to be greater than the minimum required at each node. When increasing the demand scenario, the head losses will also increase, and this may result in the pressure in some nodes being less than the allowed minimum. For this reason, a pressure-driven analysis (PDA) is needed, imposing the dependency of the flow rate delivered at the node i with the pressure (pi). The idea is to consider the original system of equations consisting of two equations, i.e., the equation of continuity and the equation of energy conservation, and to add a third equation which relates the delivered flow to the nodal pressure. This is possible by including in the DD version an element which models the PD behavior, i.e., the emitter. The implementation in EPANET consists of carrying out the DDA and checking the nodal pressure by highlighting all the nodes in which the pressure is lower than the minimum one. For these nodes, the demand is set to zero and an emitter is located. To model an emitter to be introduced in EPANET, it is necessary to define the emitter coefficient (Ci) related to the node i, obtained from the following equation:
Q d e m = C i ( H i z i ) γ
where Qdem is the delivered flow rate at the node i, Hi and zi are the total head and the elevation at node i, γ is an exponent which considers the layout of the secondary network fed by the node—for the sake of simplicity here, it is imposed equal to 0.5. Three different coefficients can be evaluated based on the total head value. Table 1 shows these different situations.

2.4. Benchmark Set-Up

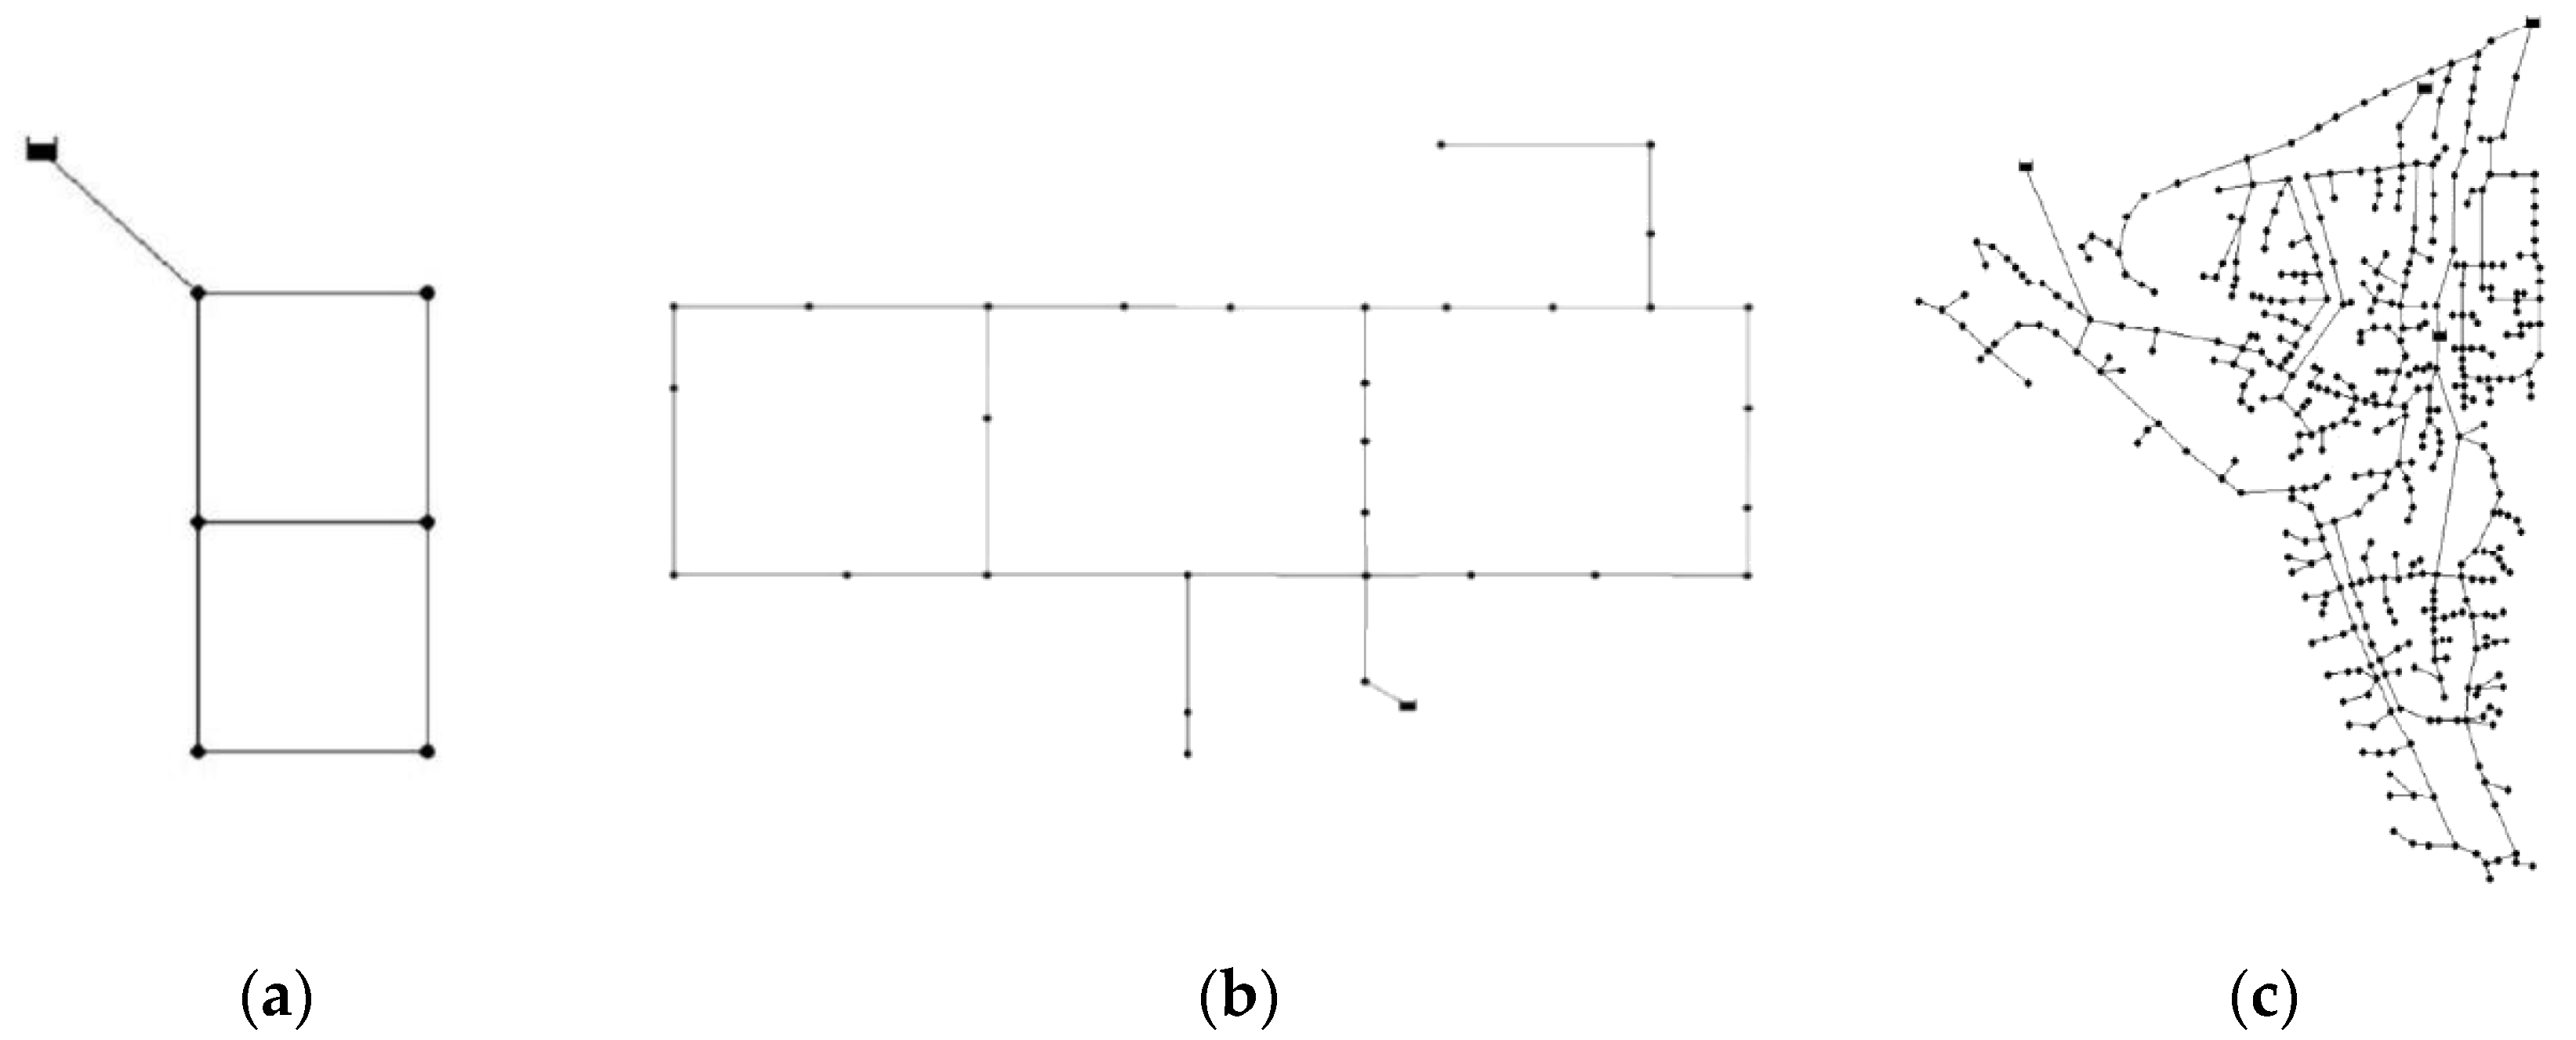
The algorithm has been applied on three benchmark networks of increasing level of complexity; the two-loop network [2], the Hanoi network [13], and the Balerma irrigation network [39], which are classified as small, medium, and large problems, respectively [34] (Figure 2). We chose these networks because they are benchmarks widely used in the literature to compare different problems and methods in WDN studies. Table 2 gives a summary of the networks’ characteristics.
The GALAXY algorithm needs two parameters to be set, N and NFEs, whose values are taken from a previous study [34]. To cover a wide range of the best-known Pareto fronts, three different population sizes are implemented, different for each of the three benchmark problems. For each group, 10 runs are performed, maintaining a fix number of function evaluations, which increases with the network complexity. For each network, a total of 30 runs are performed (Table 3).
The input parameters for the optimizer are (i) the set of commercial diameters, different for the three networks; (ii) diameter costs, expressed in USD per meter; and (iii) minimum pressure constraints. Table 4 shows the detailed values.

2.5. Pareto Fronts and Solution Subset Selection

For the analysis of the scenario simulations, Pareto fronts are needed, thus, the GALAXY algorithm is implemented to identify the Pareto optimal solutions for the three problems.
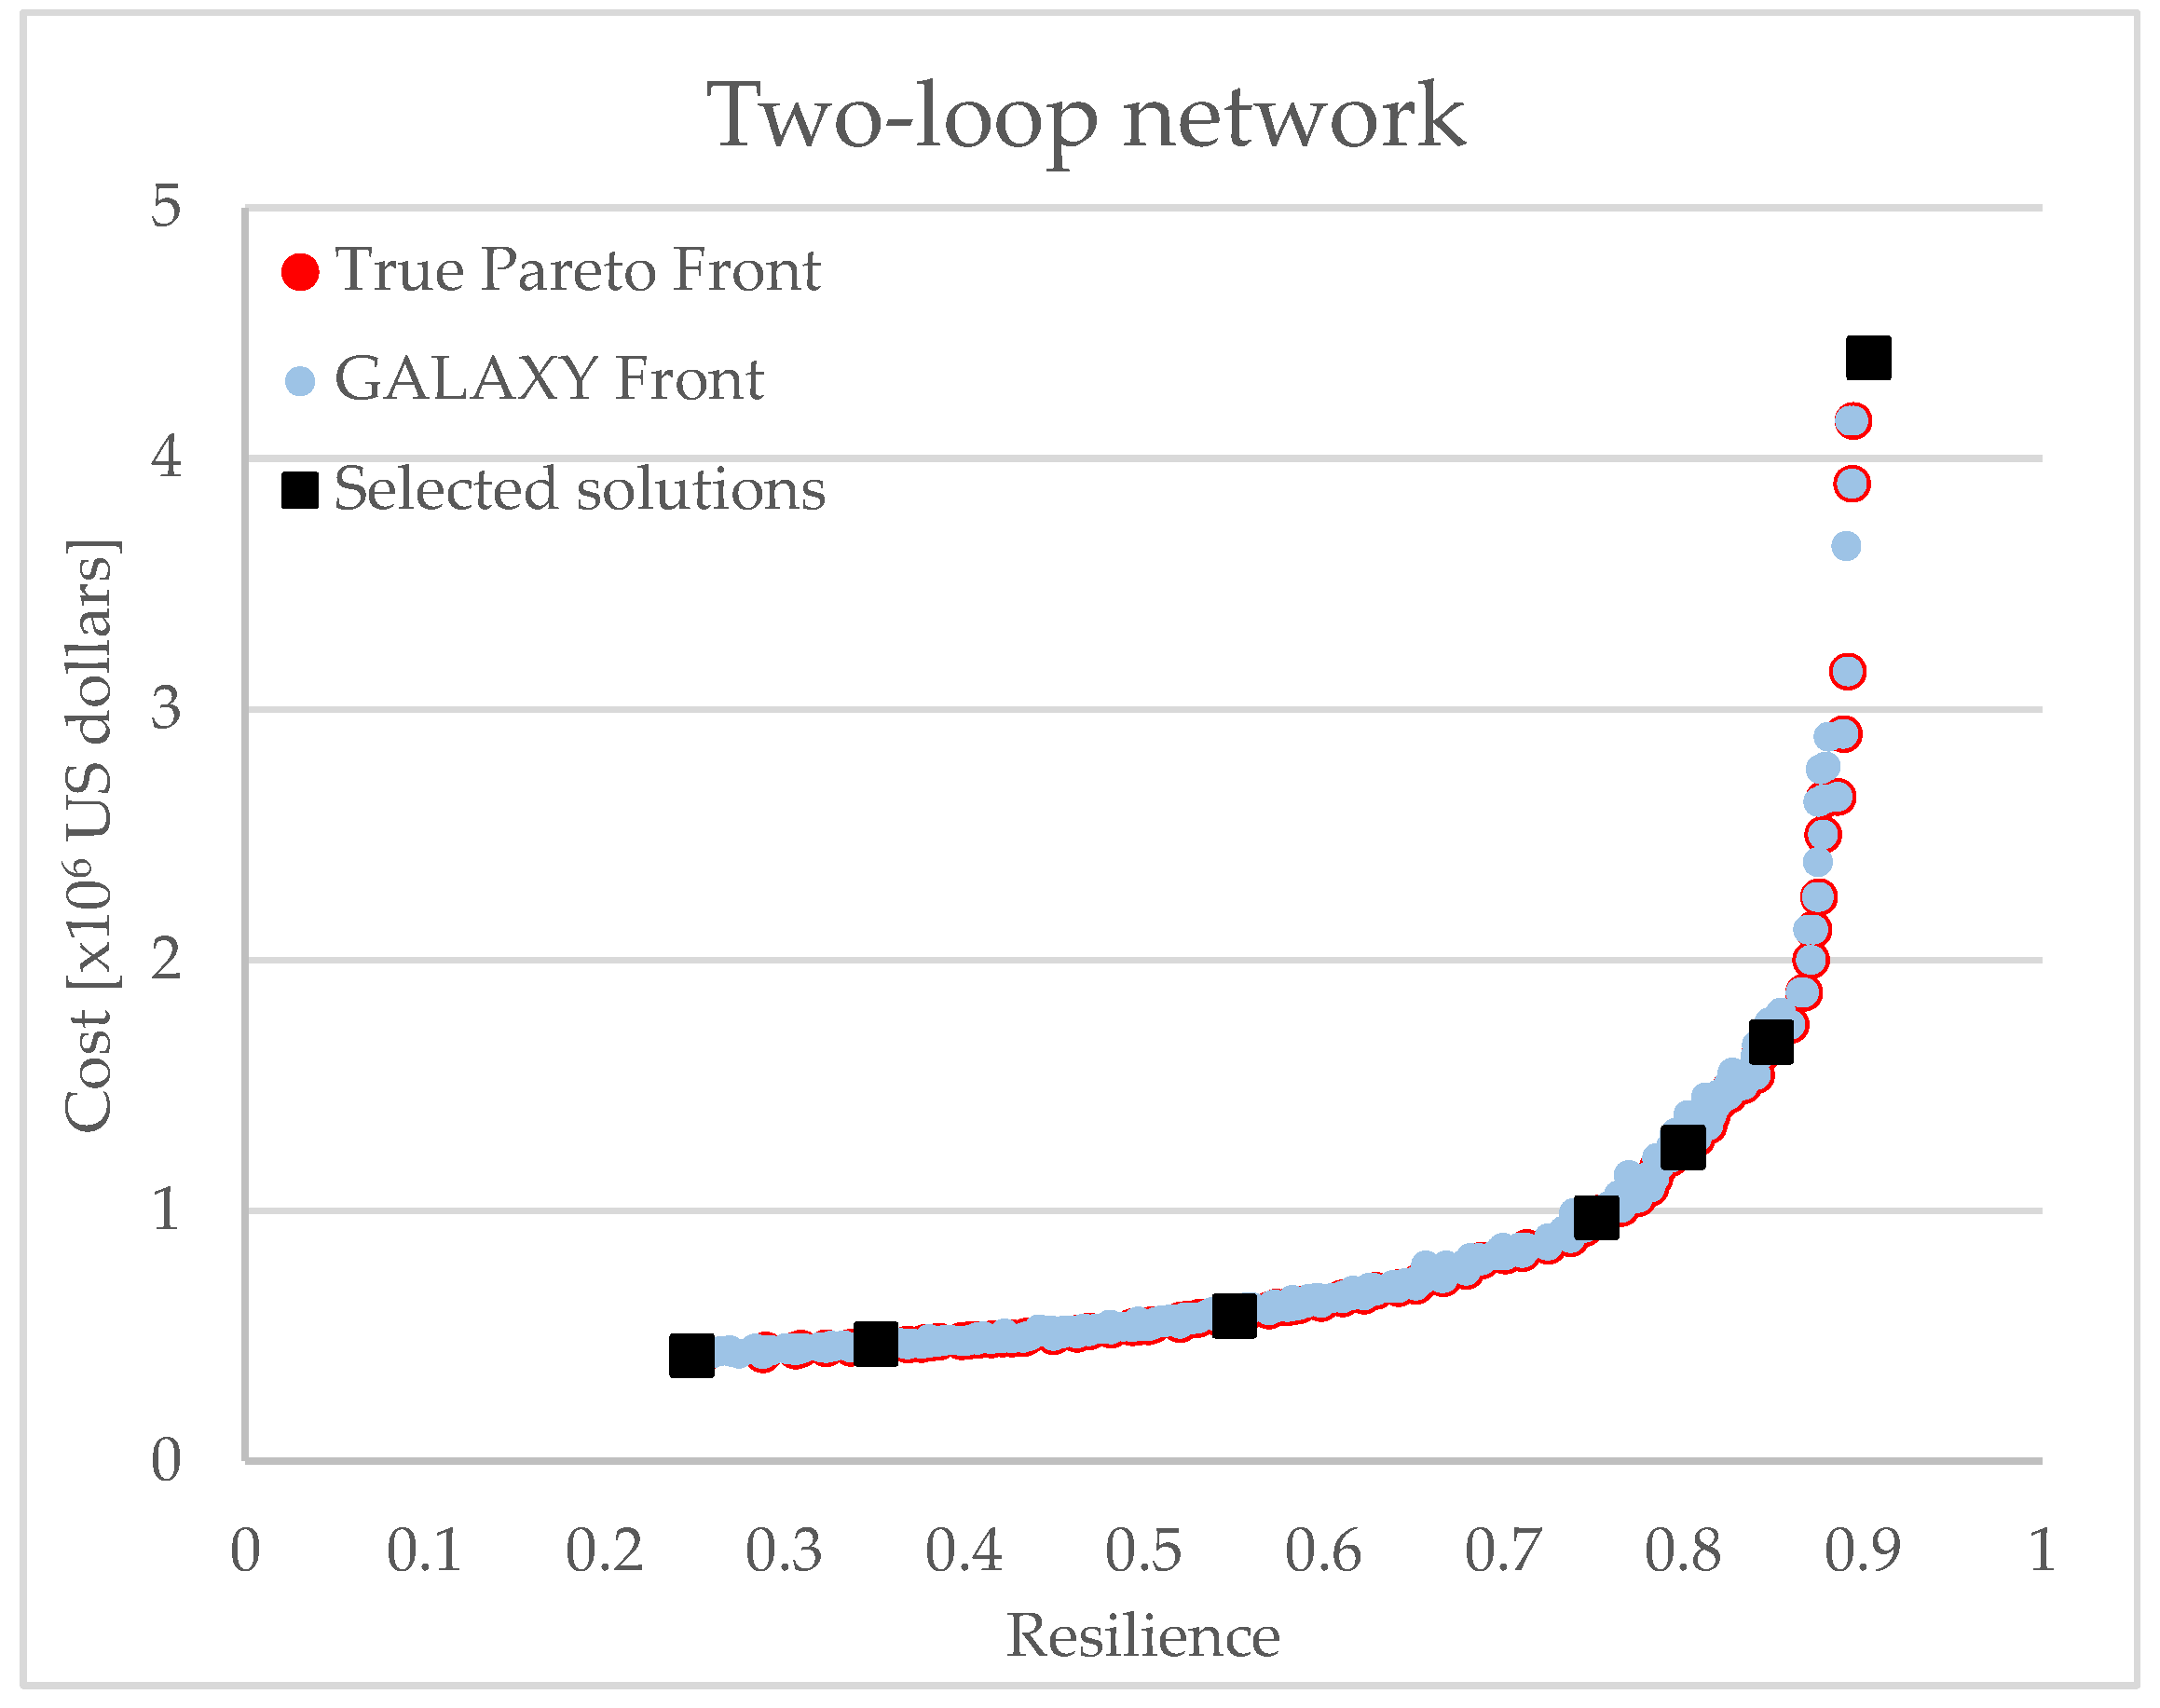
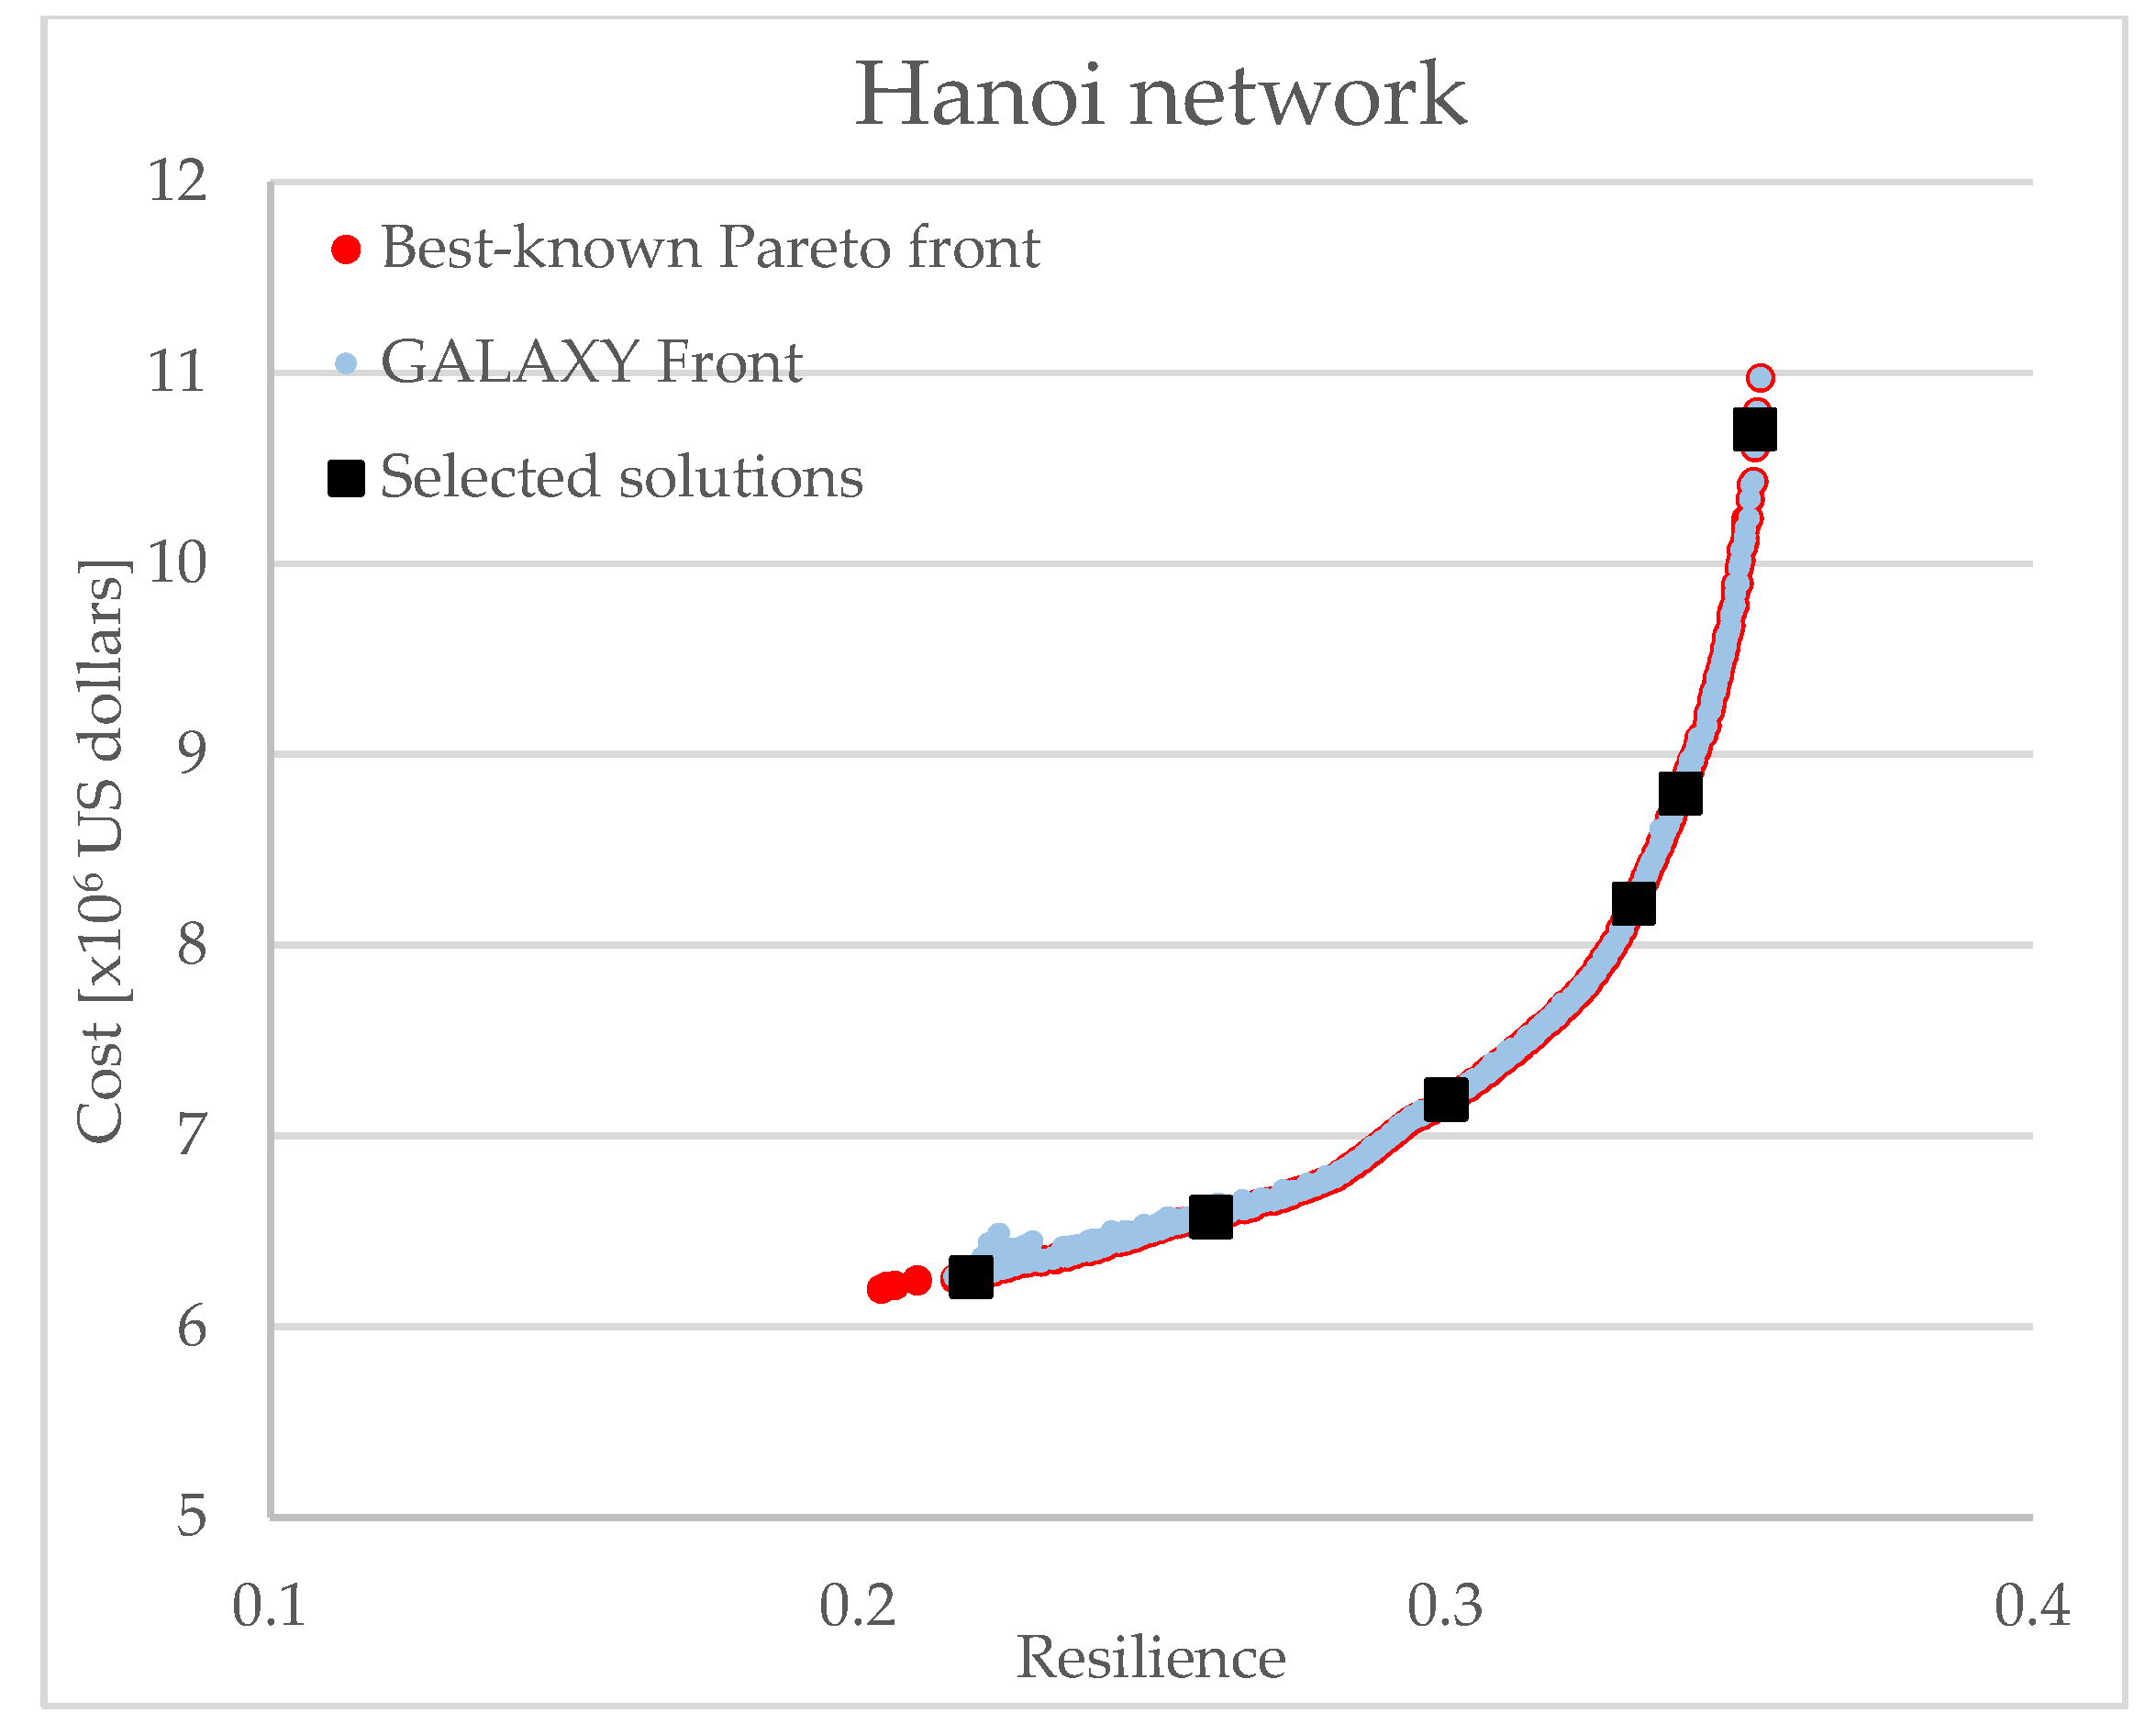
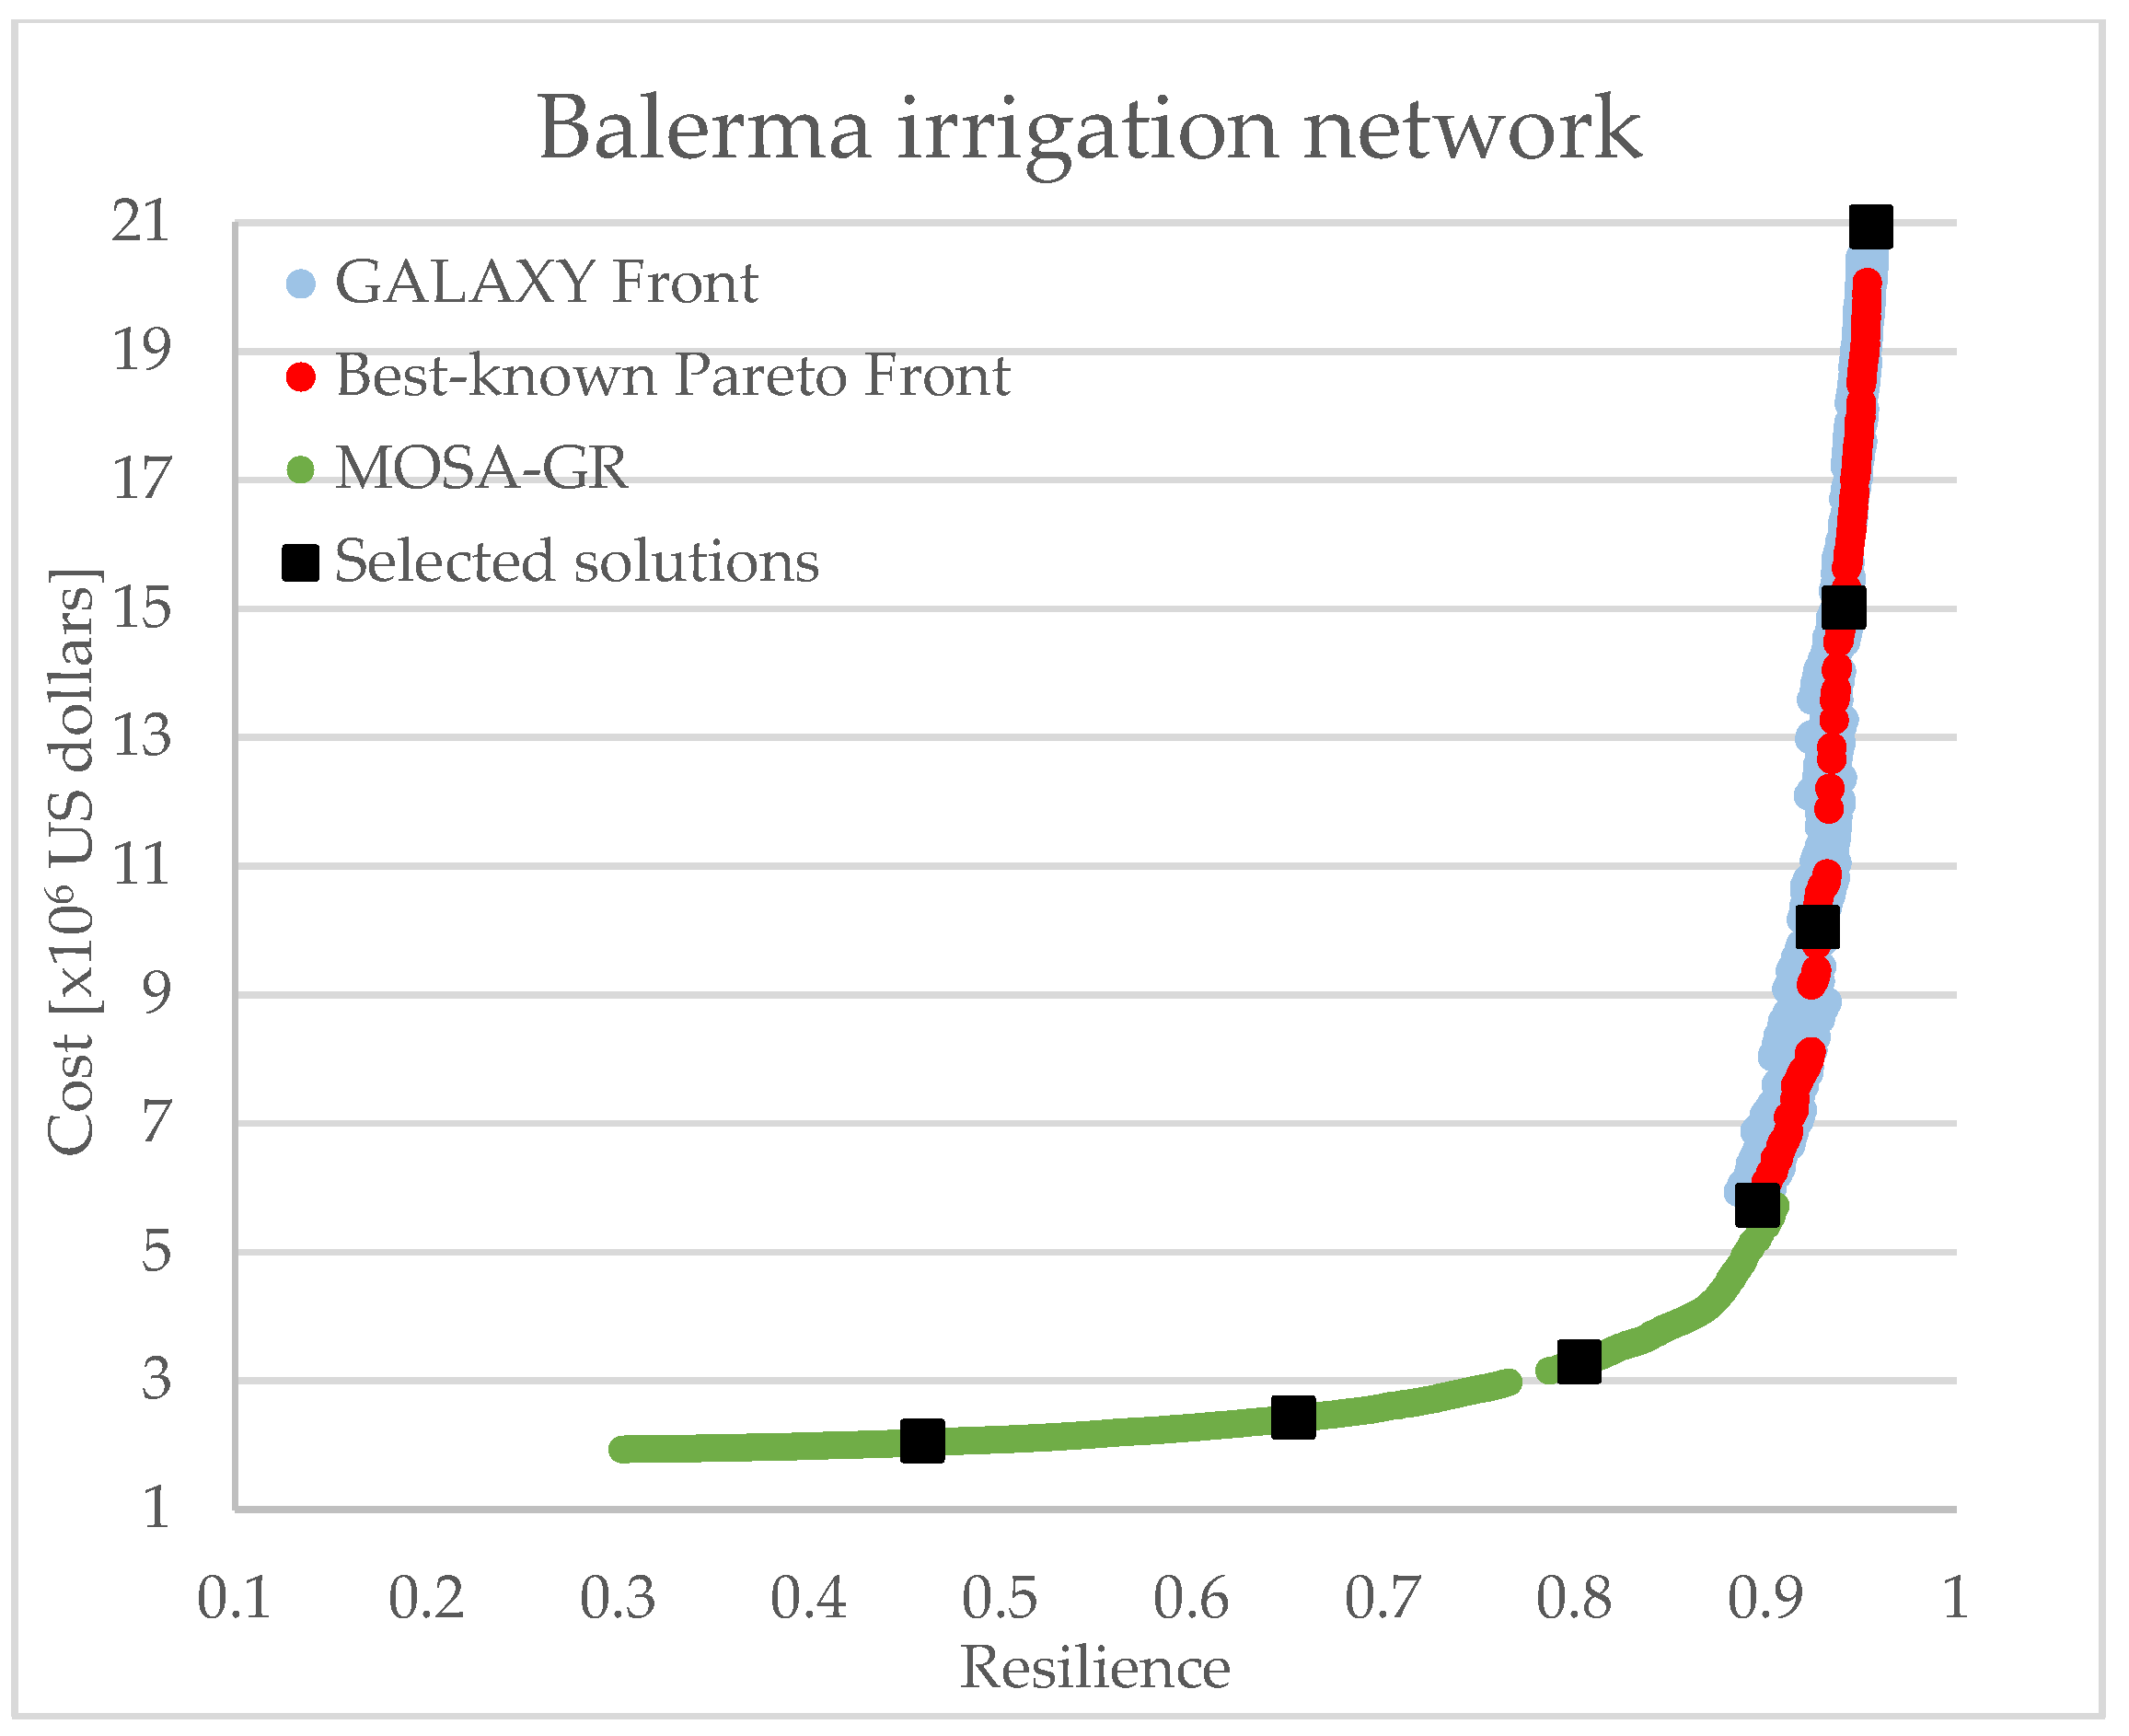
The whole analysis is developed by using the EPANET-Matlab toolkit [40]. For each network, solutions obtained by GALAXY algorithm are compared with the BKPF (best-known Pareto front) [34] (numerical results can be found at Design/Resiliance | Engineering | University of Exeter), and only the solutions which are better or equal in one or both of the objectives with respect to the BKPF are retained. This operation results in three new GALAXY fronts that are made up of 111 solutions for the two-loop network (TLN) (Figure 3), 618 solutions for the Hanoi network (HAN) (Figure 4) and 529 solutions for the Balerma irrigation network (BIN) (Figure 5).
An analysis of the results shows that GALAXY can assess all of the solutions for the two loop and even more solutions for the Hanoi when compared to the BKPF. For the Balerma irrigation, it is unlikely that the algorithm will fail to produce better solutions than those already known in the area of lower resilience value. In fact, it produces better solutions when compared to the BKPF only for a cost higher than 5.72 × 10⁶ USD. Hence, we retain the GALAXY solutions only in the upper part of the front. In contrast, in the part of the front below 5.72 × 10⁶ USD, since we need network configurations for the subsequent evaluations, we chose to consider the solutions produced by the latest version of the simulated annealing algorithm (MOSA-GR solutions), which gave rise to better fronts with respect to the BKPF [23] (Figure 4). Following the completion of the fronts calculation, the solutions to be used in the following evaluations can be selected. Well-spread solutions along the fronts are chosen with the aim of providing a range of cases as general as possible. The chosen solutions are represented in black in the following graphs, and their objective values are reported in Table 5. In total, seven solutions for the TLN, six solutions for the HAN and seven solutions for the BIN are selected.

2.6. Operation Scenarios and Performance Assessment

To assess the reliability of the system, two different aspects have to be considered: the hydraulic reliability and the mechanical reliability. The former reflects how well the system can cope with changes in water demands, and the latter express the suitability of the system to continue to work under breakage in mechanical components, e.g., pipe failure. Therefore, the networks are tested under different demand scenarios and pipe failures.
For each chosen solution, three different demand scenarios are proposed:
  • A 10% increase in the demand in all nodes;
  • A 30% increase in the demand in 1/3 nodes of the network with the maximum demand;
  • A 30% increase in the demand in 1/3 nodes of the network with the minimum demand.
For the BIN, which has an equal demand set to all nodes, the 30% increase in demand is carried out in one-third of the nodes, with the maximum and minimum pressure recorded in the optimal configurations.
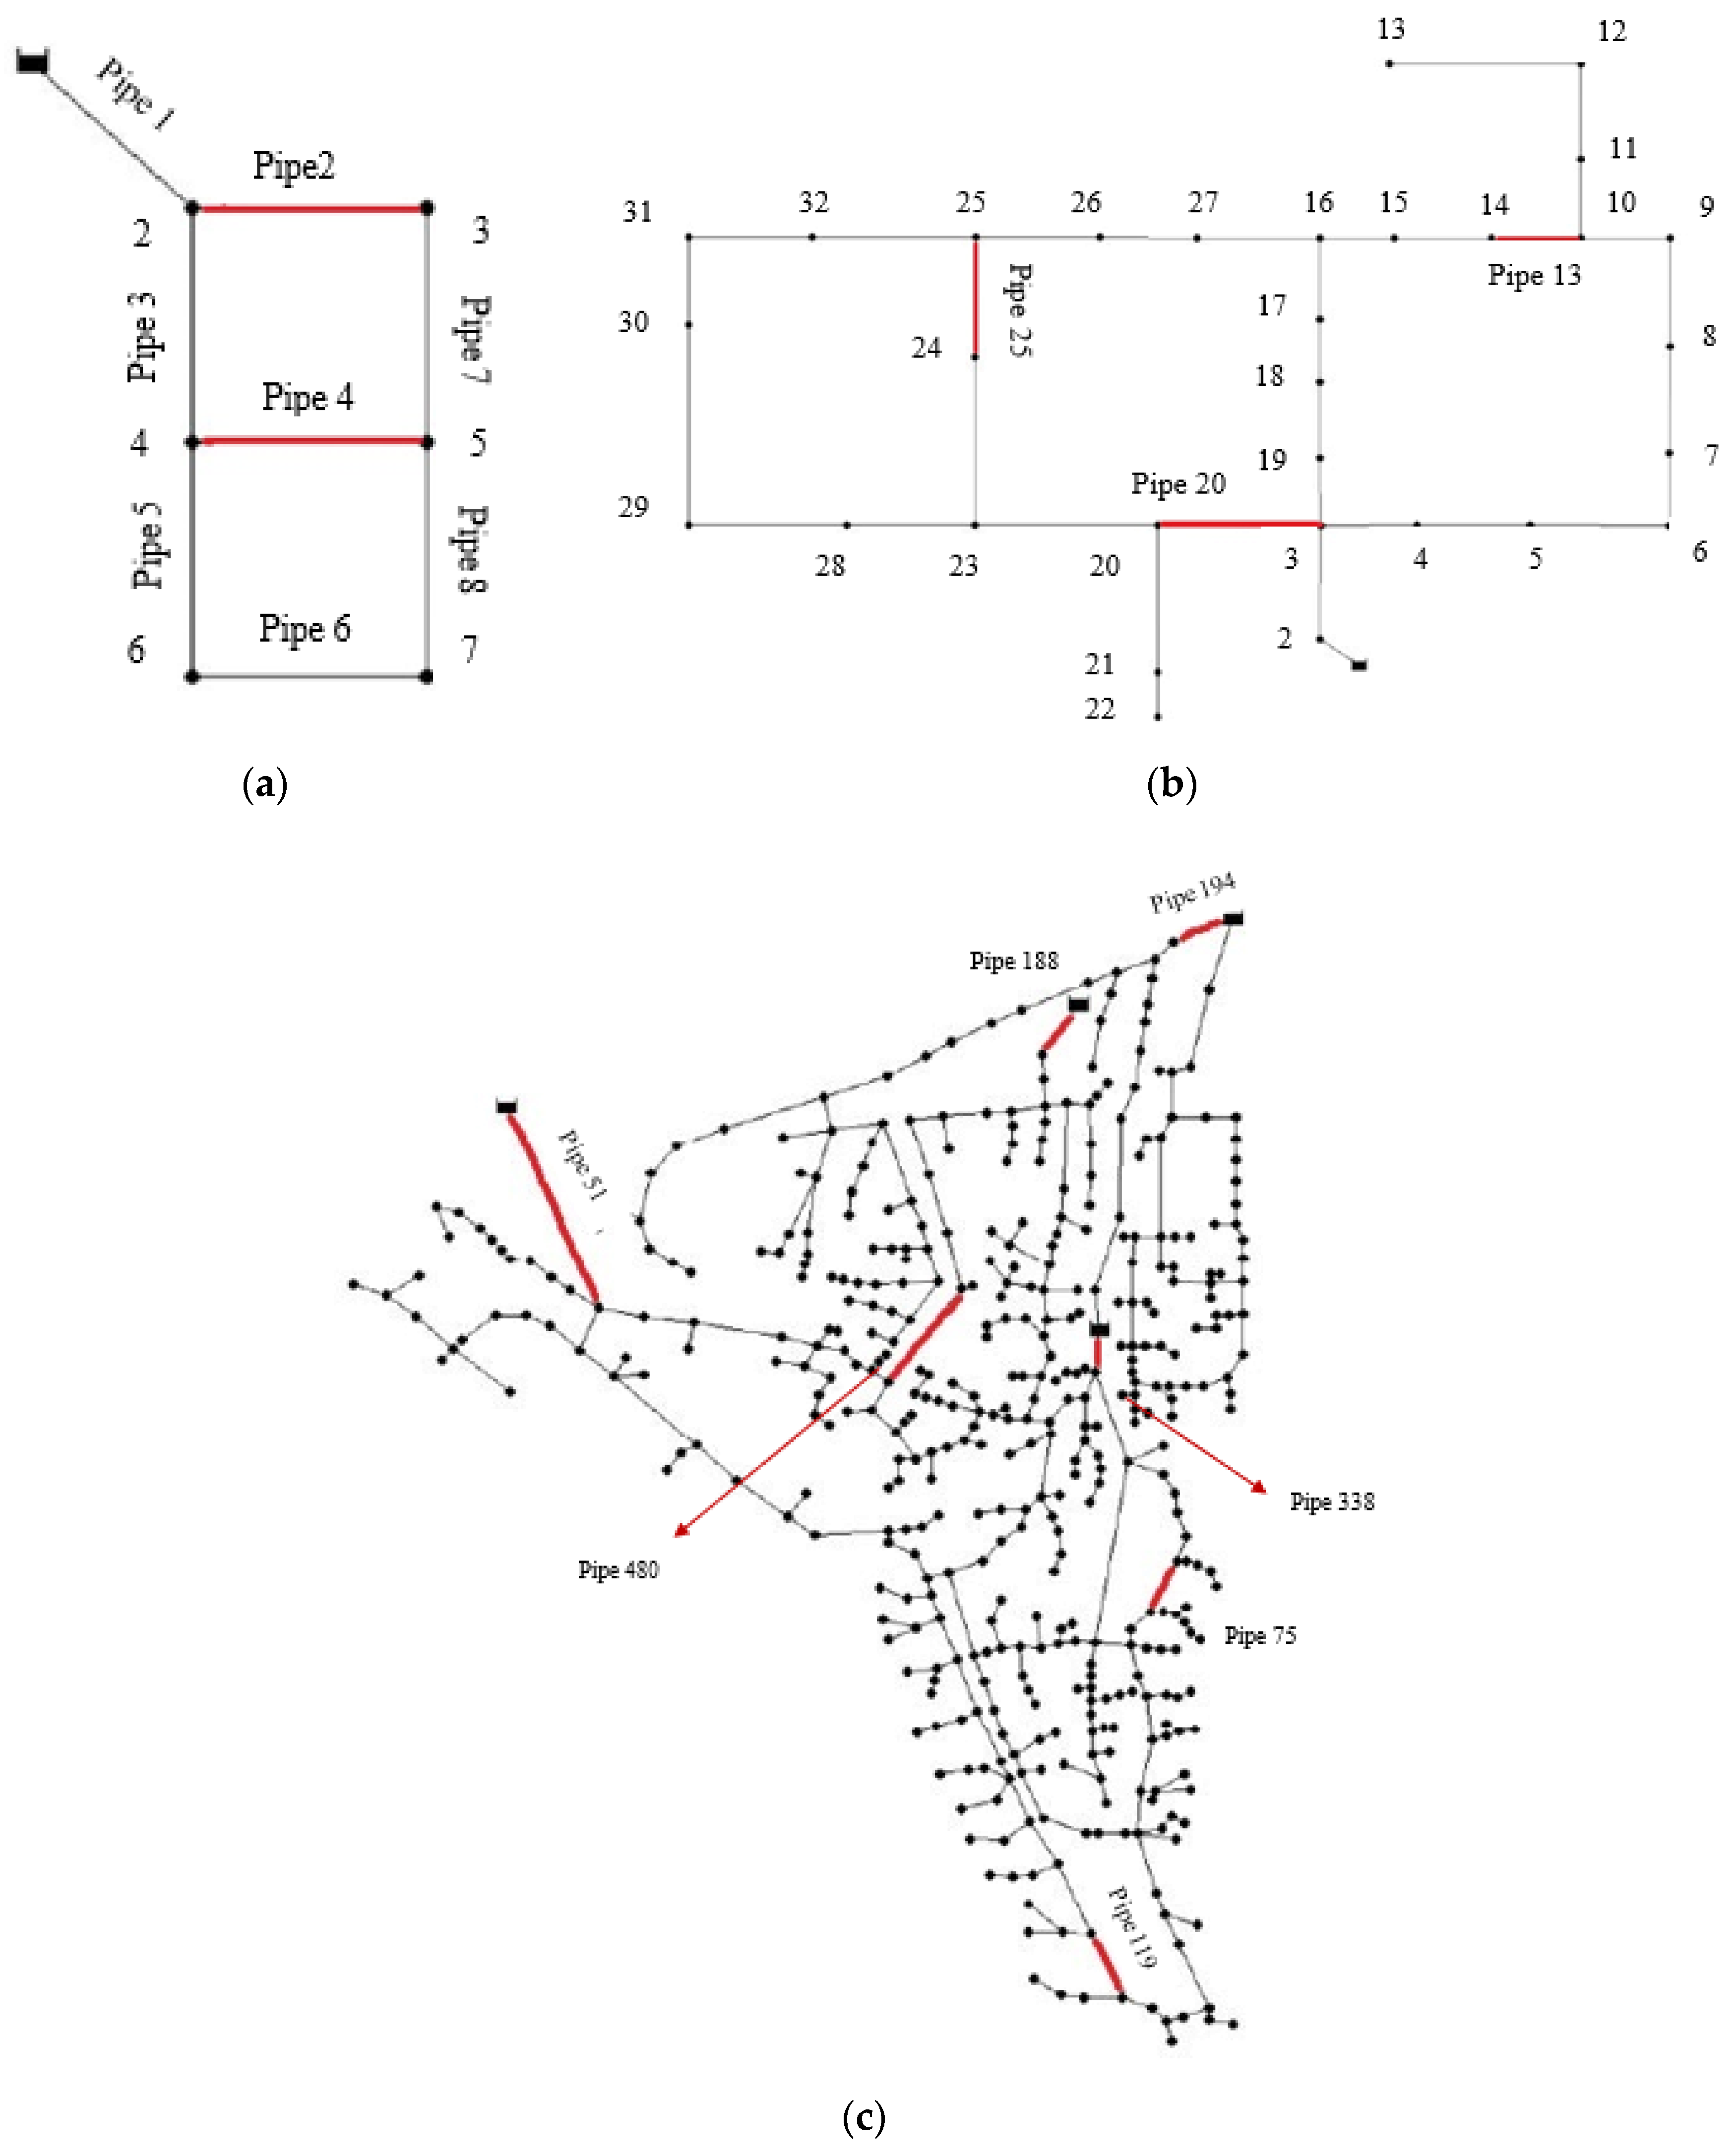
To examine the effect of individual pipe failure against the available level of supply, several pipes belonging to different areas of the networks (generally close to the reservoirs), are selected in a heuristic way. In Figure 6 and Table 6, the selected pipes for the three networks and their characteristics are reported. Those pipes are closed one at a time and the network is simulated. First, scenarios of increase demand and pipe closures are considered individually, then combined. Table 7 shows the details of scenario implementation. Scenarios 4, 5, 6, 7 are divided in turn into other scenarios for the three networks considering one pipe closure at a time.
It has to be pointed out that the simulations are performed in a single time step for the different scenarios. The single-phase simulation is used to simplify the analysis, as the aim is to assess through PIs the adaptability of existing networks to satisfy the water demand under predefined scenarios. Thus, some illustrative scenarios are considered, and if the network is able to front the increasing demands and pipe failures in all the situations, it will be considered adequate; otherwise, the network will be classified as inadequate for some aspects.

3. Results and Discussion

In this section, the results of the analysis of networks behavior under different scenarios of water demands and pipe failures are presented. To carry out the performance analysis, first, the Pareto fronts of the three benchmark networks are evaluated, then subsets of the optimal design solutions are selected to be used as a new domain for scenario simulation.
For all simulations of each network, the PIs are evaluated and compared with the optimal configuration values (Table 8). In particular, the network resilience index (In) is already inside the optimization algorithm, whereas the pressure range (PR), the minimum nodal pressure (Pmin) and the corresponding demand deficit (DD) are evaluated ex post for each solution (Sol). For the simulated configurations, the percentage of infeasible solutions (IC) among all the scenarios is also considered, and it is used to weight the pressure range and the demand deficit indices, resulting in weighted pressure range (PR*) and weighted demand deficit (DD*), respectively.
In order to provide a global view on the ability of the three networks to cope with variability in their operation, in the following paragraphs, we discuss for each network the results of the simulations, providing the average values of the PIs considering the scenarios altogether.

3.1. Two-Loop Network

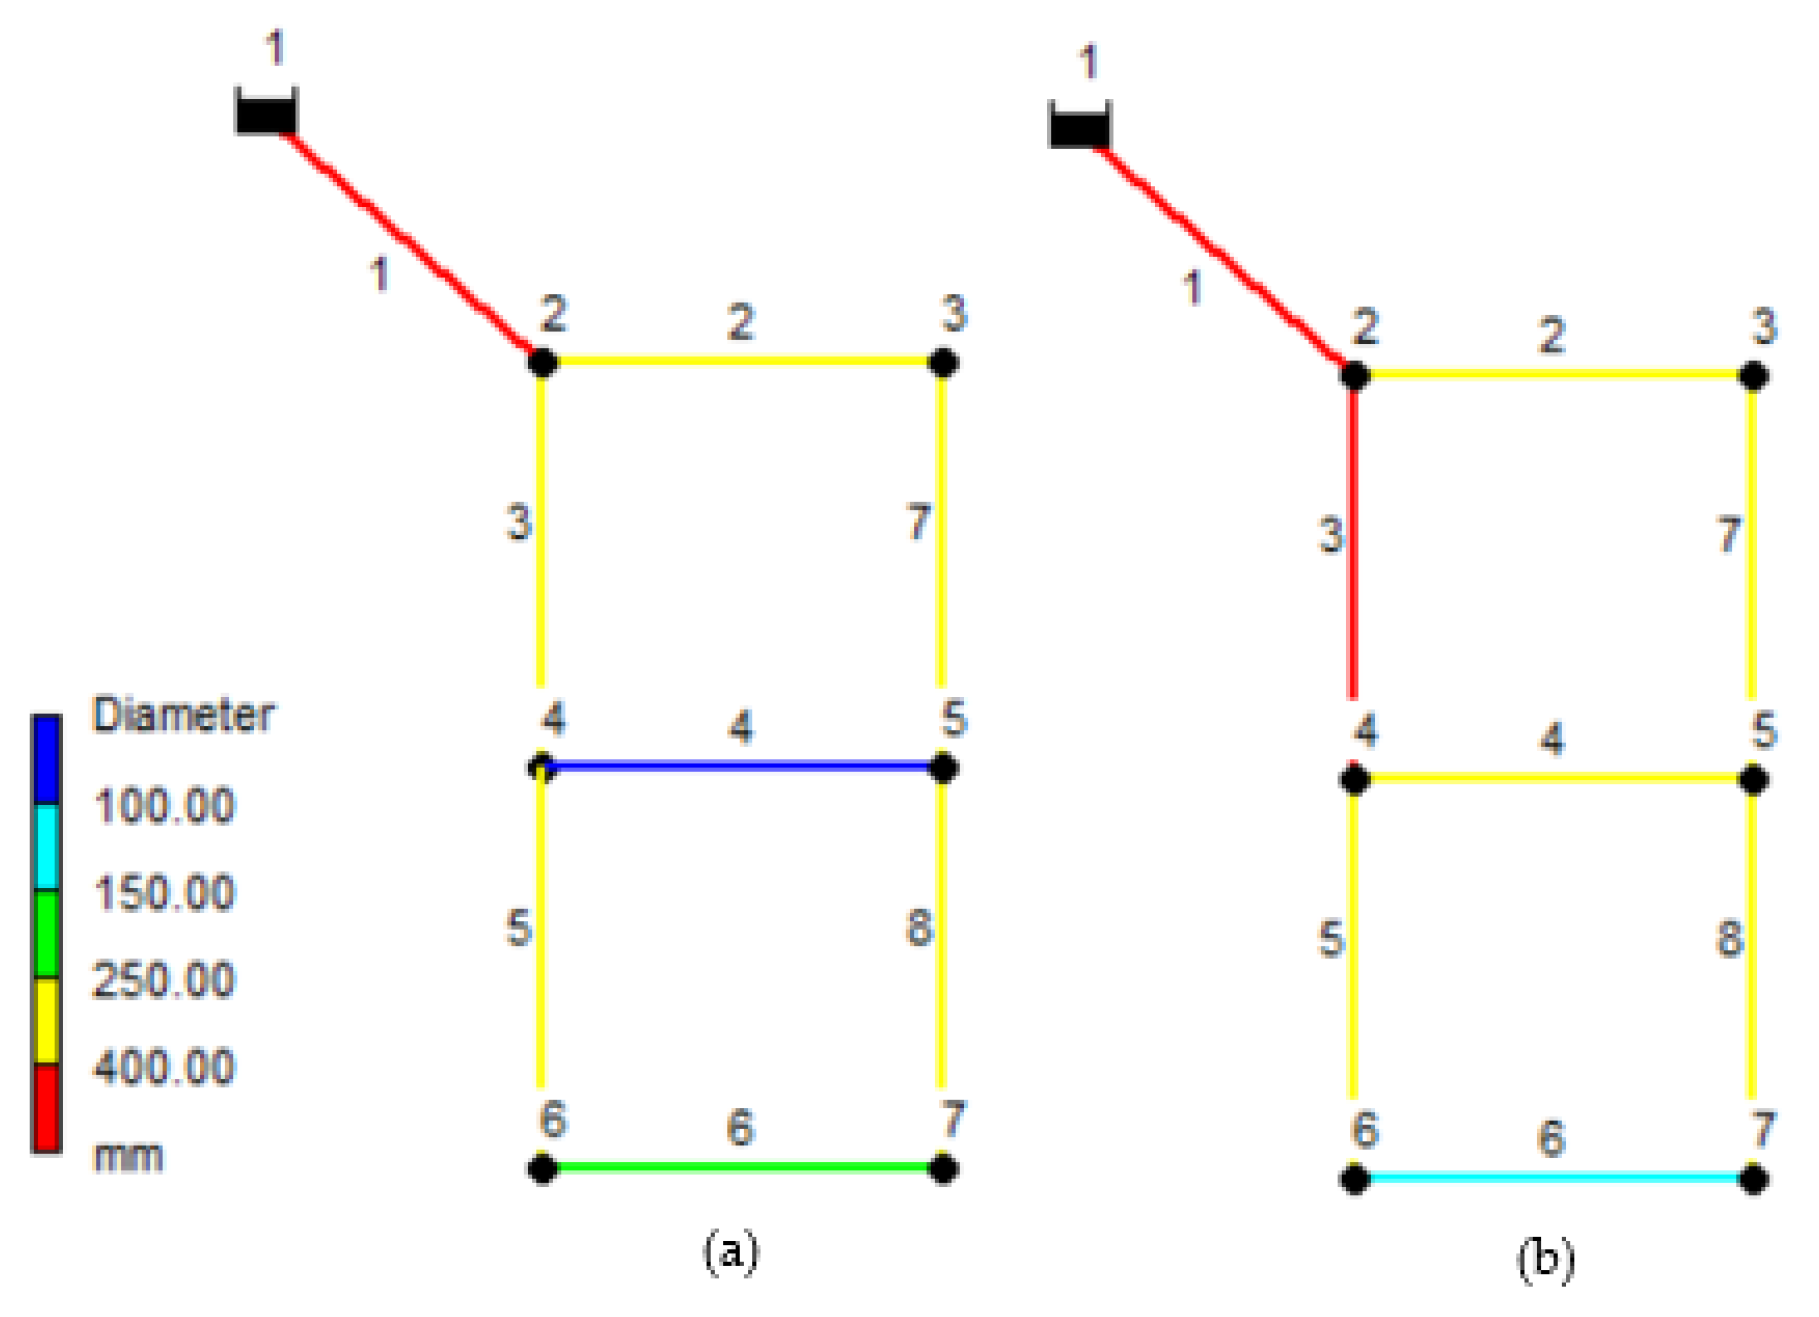
Table 9 provides the average results of the scenario simulations. The configuration associated with the lower cost shows an overall average reduction of 12.9% of the value of resilience with respect to the value of the optimize configuration (Table 8), 0.216 compared to 0.248, respectively. Despite the criticalities characterizing this configuration and the fact that the resilience index is the lowest among all the solutions, its reduction in regard to the initial value is lower compared to the two subsequent solutions, i.e., 28.4% for solution 2 and 34.87% for the solution 3. By increasing the cost, the resilience index also increases, which means higher reliability in general. For example, the average In of configuration 2 is 0.251; even if this value is higher than the first solution, this configuration shows greater criticalities related to the failure of pipe 4 in terms of minimum average pressure and average demand deficit of 24.73 m and 11.49%, respectively. This is because the cost increase in solution 2 in comparison to the solution 1 is caused by the diameter of pipe 4 passing from 25.4 mm to 254 mm (Figure 7). Thus, when this pipe is closed, the higher diameter of pipe 6 in solution 1 (152.4 mm compared to 101.6 mm of solution 2) causes high pressure at node 6 for the first solution. Even for the third solution, which is characterized by a resilience of 0.550, the situation remains worse than the first configuration with an average Pmin of 27.96 m, and an average demand deficit of 7.34%. It has to be pointed out that since this configuration does not show infeasible solutions, the DD* and the PR* are both zero. Thus, by weighting the PIs with the IC, the third solution looks more reliable than the solution 1. It should be stressed that the higher demand deficit of solutions 2 and 3 with respect to the solution 1 is due to the fact that, despite solution 1, the two solutions do not exhibit infeasibility deriving from the failure of pipe 2. Therefore, the low pressures recorded in both configurations, with corresponding high demand deficit, result in lower average pressures and higher demand deficit compared to the first configuration. The difference is that solution 2 still presents an infeasibility of 27.27% among the simulated scenarios, whereas this is not the case in the third solution, resulting in it possessing overall more reliability than the first ones. Solution 4 is the first solution that does not exhibit demand deficit even in the worst case of pipe failure, in addition to the increase in water demand. This is due to the fact that, despite the fact that solution 3 shows most of the pipes’ diameters of the network to be equal to the previous solution (solution 2), solution 4 is characterized by an increase between 10% and 28% in all of the diameters with respect to solution 3, which ensures a better arrangement of the network to face variability in its working conditions. Therefore, from the fourth solution on, the analysis does not reveal criticalities, providing that such configurations can be considered reliable.

3.2. Hanoi Network

The low value of resilience among all of the scenarios is initially notable when observing the results (Table 10). It reaches at best a value of 0.326, far below the unit. This means that the network, even in the most expensive configuration, will still be characterized by low resilience; moreover, to increase the resilience, a substantial cost increase is needed. The reason for this result may be the configuration of the network, which has a mesh with consecutive nodes on the same branch, without sufficient ramifications. This means that any change in diameter of a single pipe affects the whole mesh without any possibility for the flow to find alternative routes, resulting in a low resilience.
Starting from the solution 1, e.g., with a cost of 6.258 × 10⁶ USD and a network resilience of 0.219 (Table 8), the simulation of the scenarios shows an infeasibility of 60% and six solutions with demand deficit. The average DD* among the solutions is 18.54%, and the infeasibility derives mainly from the combined scenarios of increase in demands and pipe failures. In the other tail of the front, the most expensive solution still shows a hydraulic inconsistency only in the scenario of pipe 20 failure combined with the 30% increase in water demand in one-third of the nodes with the highest demand. Despite the previous configurations, in the other demand scenarios combined with the failure of pipe 20, the operating conditions are ensured; however, with an average demand deficit of 20.74%, which is almost the same as that of solution 1, but weighted for the IC, it decreases to 1.99%. In these cases, the pressures below the low limit are almost recorded in nodes 20–33; this is because the failure of pipe 20 leads to inhomogeneity in water distribution mainly in the right area of the network (Figure 6b), causing high head losses which result in low pressures in the nodes farthest from the source.
Solutions 2 and 3 perform four infeasible solutions (26.66%) associated with the failure of pipe 20, considering both the failure itself and the failure combined with the increase in demand. Moreover, 11 solutions with demand deficit result for solution 2, and 10 for solution 3 with an average minimum pressure of 22.40 and 23.68 m, respectively. Solutions 4 and 5 are characterized by a similar decrease in the average resilience index compared to the initial value of 35.44% and 35.95%, respectively, and both exhibit the same number of four infeasible solutions. When compared with solution 4, solution 5 has an extra deficit configuration—2 against 3, respectively. Nevertheless, a significant difference between the two solutions is the average percentage of demand deficit, 4.21% for solution 4 and 1.48% for solution 5, due to a combination of higher diameters close to the reservoir which result in a lower demand deficit.
It is interesting to note that the failure of pipe 20 alone (scenario 4) involves infeasible configurations, with negative pressures mainly in the nodes in the left part of the network (nodes 20–32), for all the solutions except the sixth one. Here, the importance of weighting the indices with respect to the infeasible solutions is evident. In fact, without considering the weight, the average PR and DD of the simulations would be 0.332 and 20.74%, respectively, basically the worst among all of the configurations. In contrast, by multiplying these PIs for the IC, their values decrease.
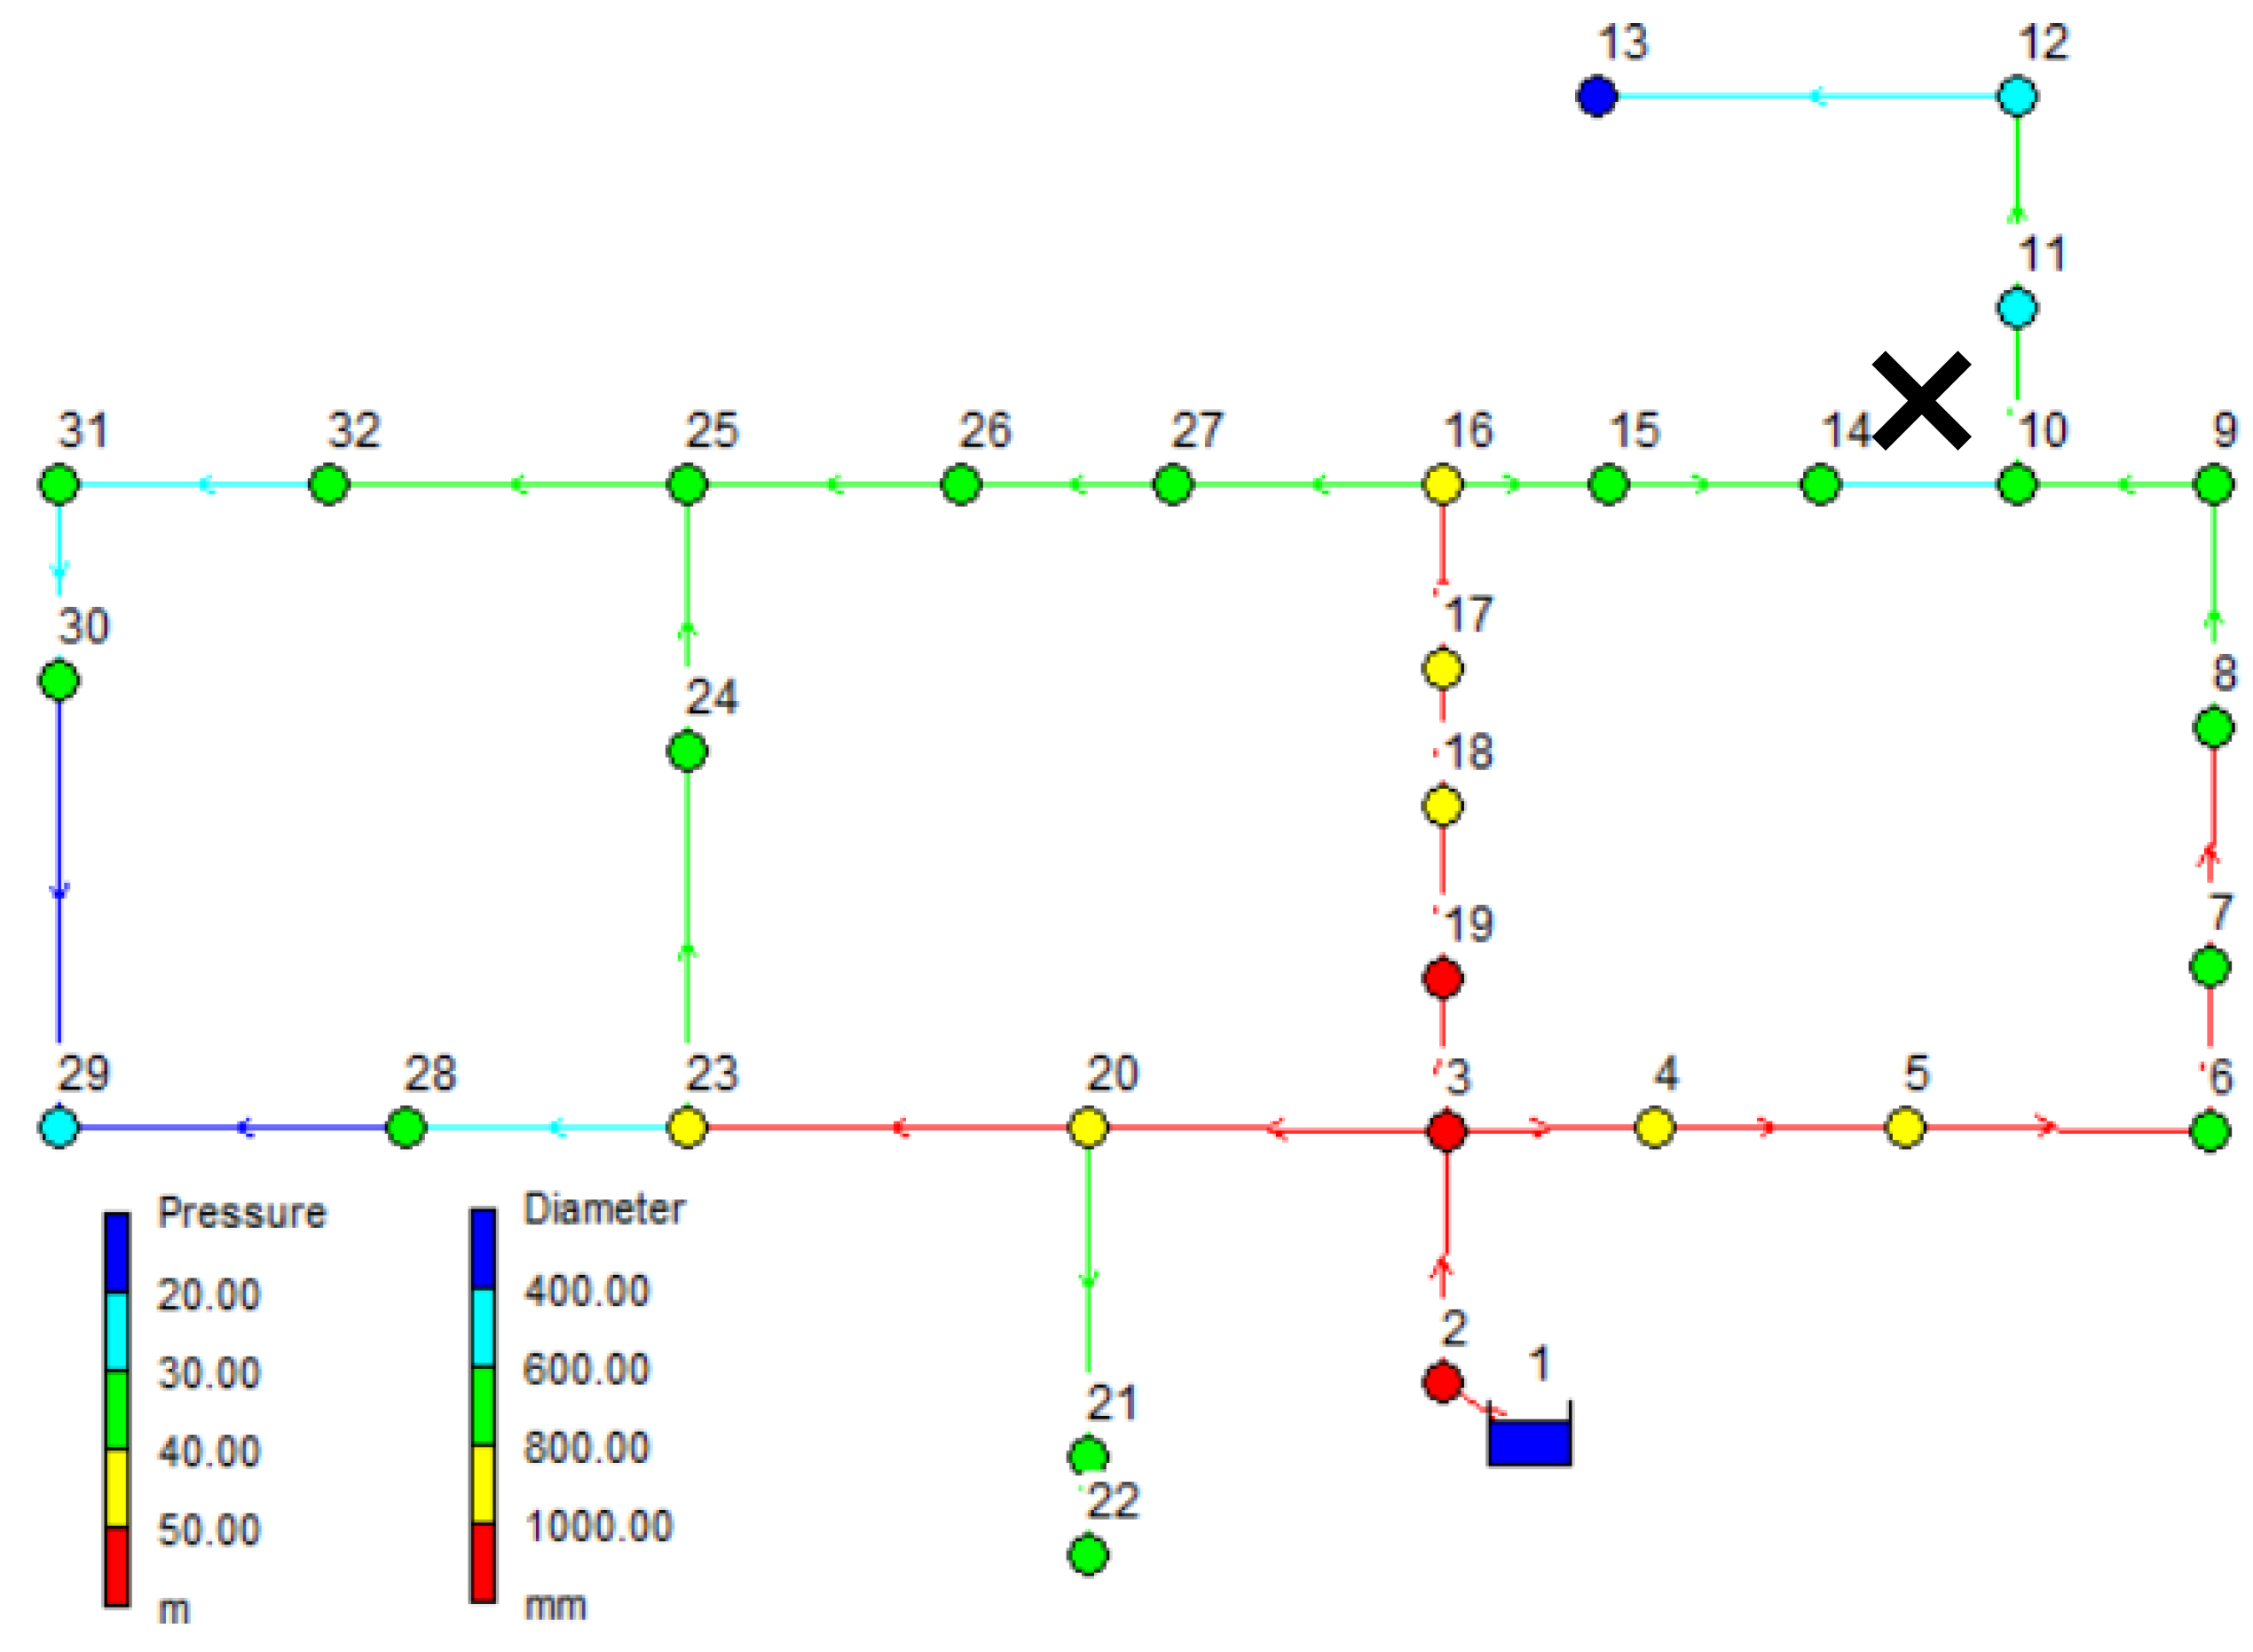
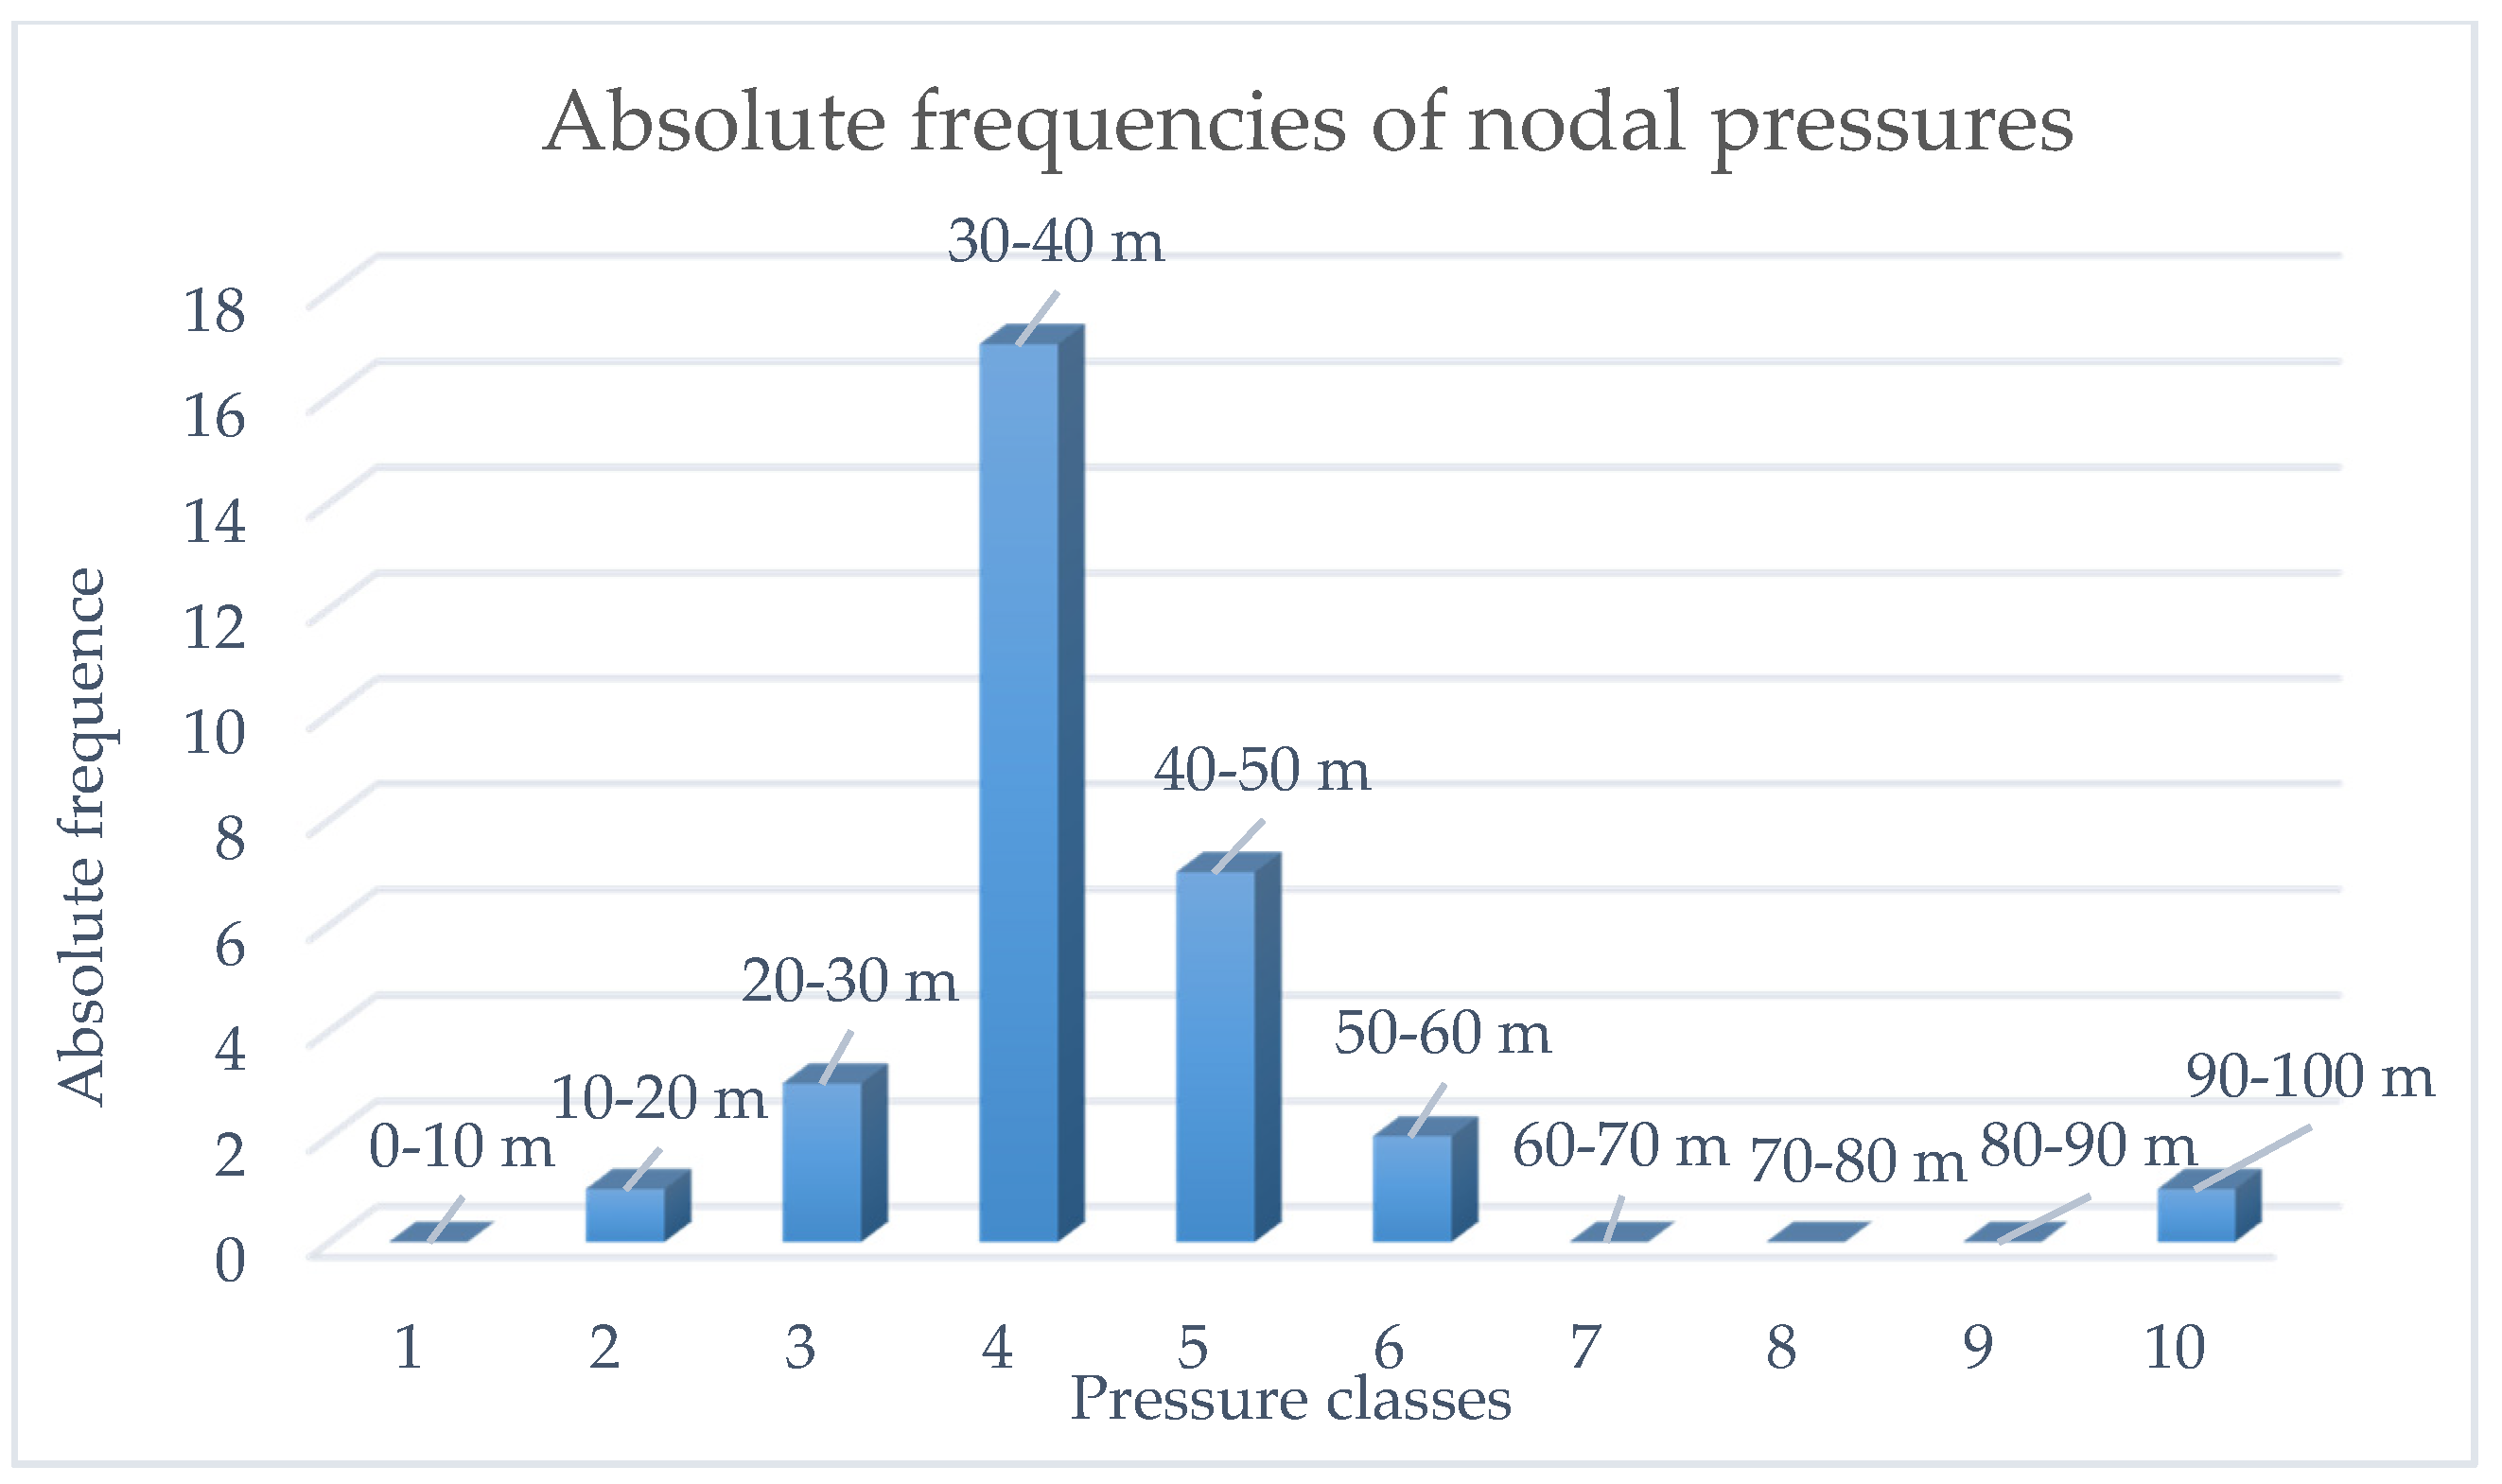
It may be useful to provide a more detailed analysis of the behavior of a single configuration. Therefore, we chose to analyze the worst configuration, which, in this case, is solution 3 subjected to the simultaneous increment of 30% in water demand in one-third of the most demanding nodes and the failure of pipe 13 (Figure 8). In this condition, an absolute minimum pressure of 16.45 m at node 13 is observed, resulting in a demand deficit of 35.97%. Despite the significant local failure, it is important to evaluate the pressure trend all over the network to identify how much the network is affected by low pressures. For this purpose, we use a histogram of absolute frequencies of the nodal pressures of the network, representing the number of nodes with pressure values falling within a given class (Figure 9). By observing the graph, we can argue that, globally, the network presents pressures with values inside the optimal operating range (30–80 m)—27 of 31 nodes with respect to the pressure limitations. Only one node exhibits a pressure higher than 90 m (node 2, near the reservoir), and four nodes are characterized by demand deficit. To conclude, the worst pressure value of 16.45 m is isolated and concerns only one node, thus, excluding a few local failures, the configuration can be considered quite reliable.

3.3. Balerma Irrigation Network

From the results of the simulations, the one-by-one breakage of the four pipes linked to the sources (pipes 188, 194, 51, 338, Figure 6c) causes negative pressures in some nodes for all the seven solutions. This is true both considering the pipe failures alone and combining them with the increase in water demands. We report in Table 11, only the outcomes for the most expensive solution as a representative, because all of the solutions show 12 infeasibilities with respect to the same scenarios. Therefore, since the IC is the same for all of the solutions, its weight on the PIs is less relevant with respect to the previous networks. On the other hand, the breakage of pipes far from the sources (pipes 480, 119 and 75; Figure 6c) does not cause infeasible solutions but only solutions with pressures below the minimum required. From Table 12, we can see that in addition to inconsistent solutions, solution 1 and solution 2 feature the mostly simulations in which some nodes show pressures below 20 m with an average demand deficit of 39.4% and 9.52%, respectively. From the third solution onwards, the pressure recorded in each node is higher than the minimum; therefore, there are no solutions with demand deficit, but the pressure at some nodes is even greater than the maximum pressure of 80 m usually imposed by the regulation (Table 13). This is reflected in a PR* that increases from solution 3 onwards. This is a criticism of the PR index since it considers likewise the upper and the lower pressure exceeded out from the optimal range, even if the cases of pressure below the lower limit are more critical than the others; the first ones result in demand deficit, increasing the vulnerability of the system, whereas in the second, the inclusion of valves can be dealt with. Solution 3, instead, due to the increase in the diameter of 209 pipes (generally near the reservoirs), with respect to solution 2, is the first configuration that is able to ensure the lack of demand deficit under every scenario, while ensuring lower operating pressure (104.5 m) when compared to the subsequent solutions and fairly lower costs.
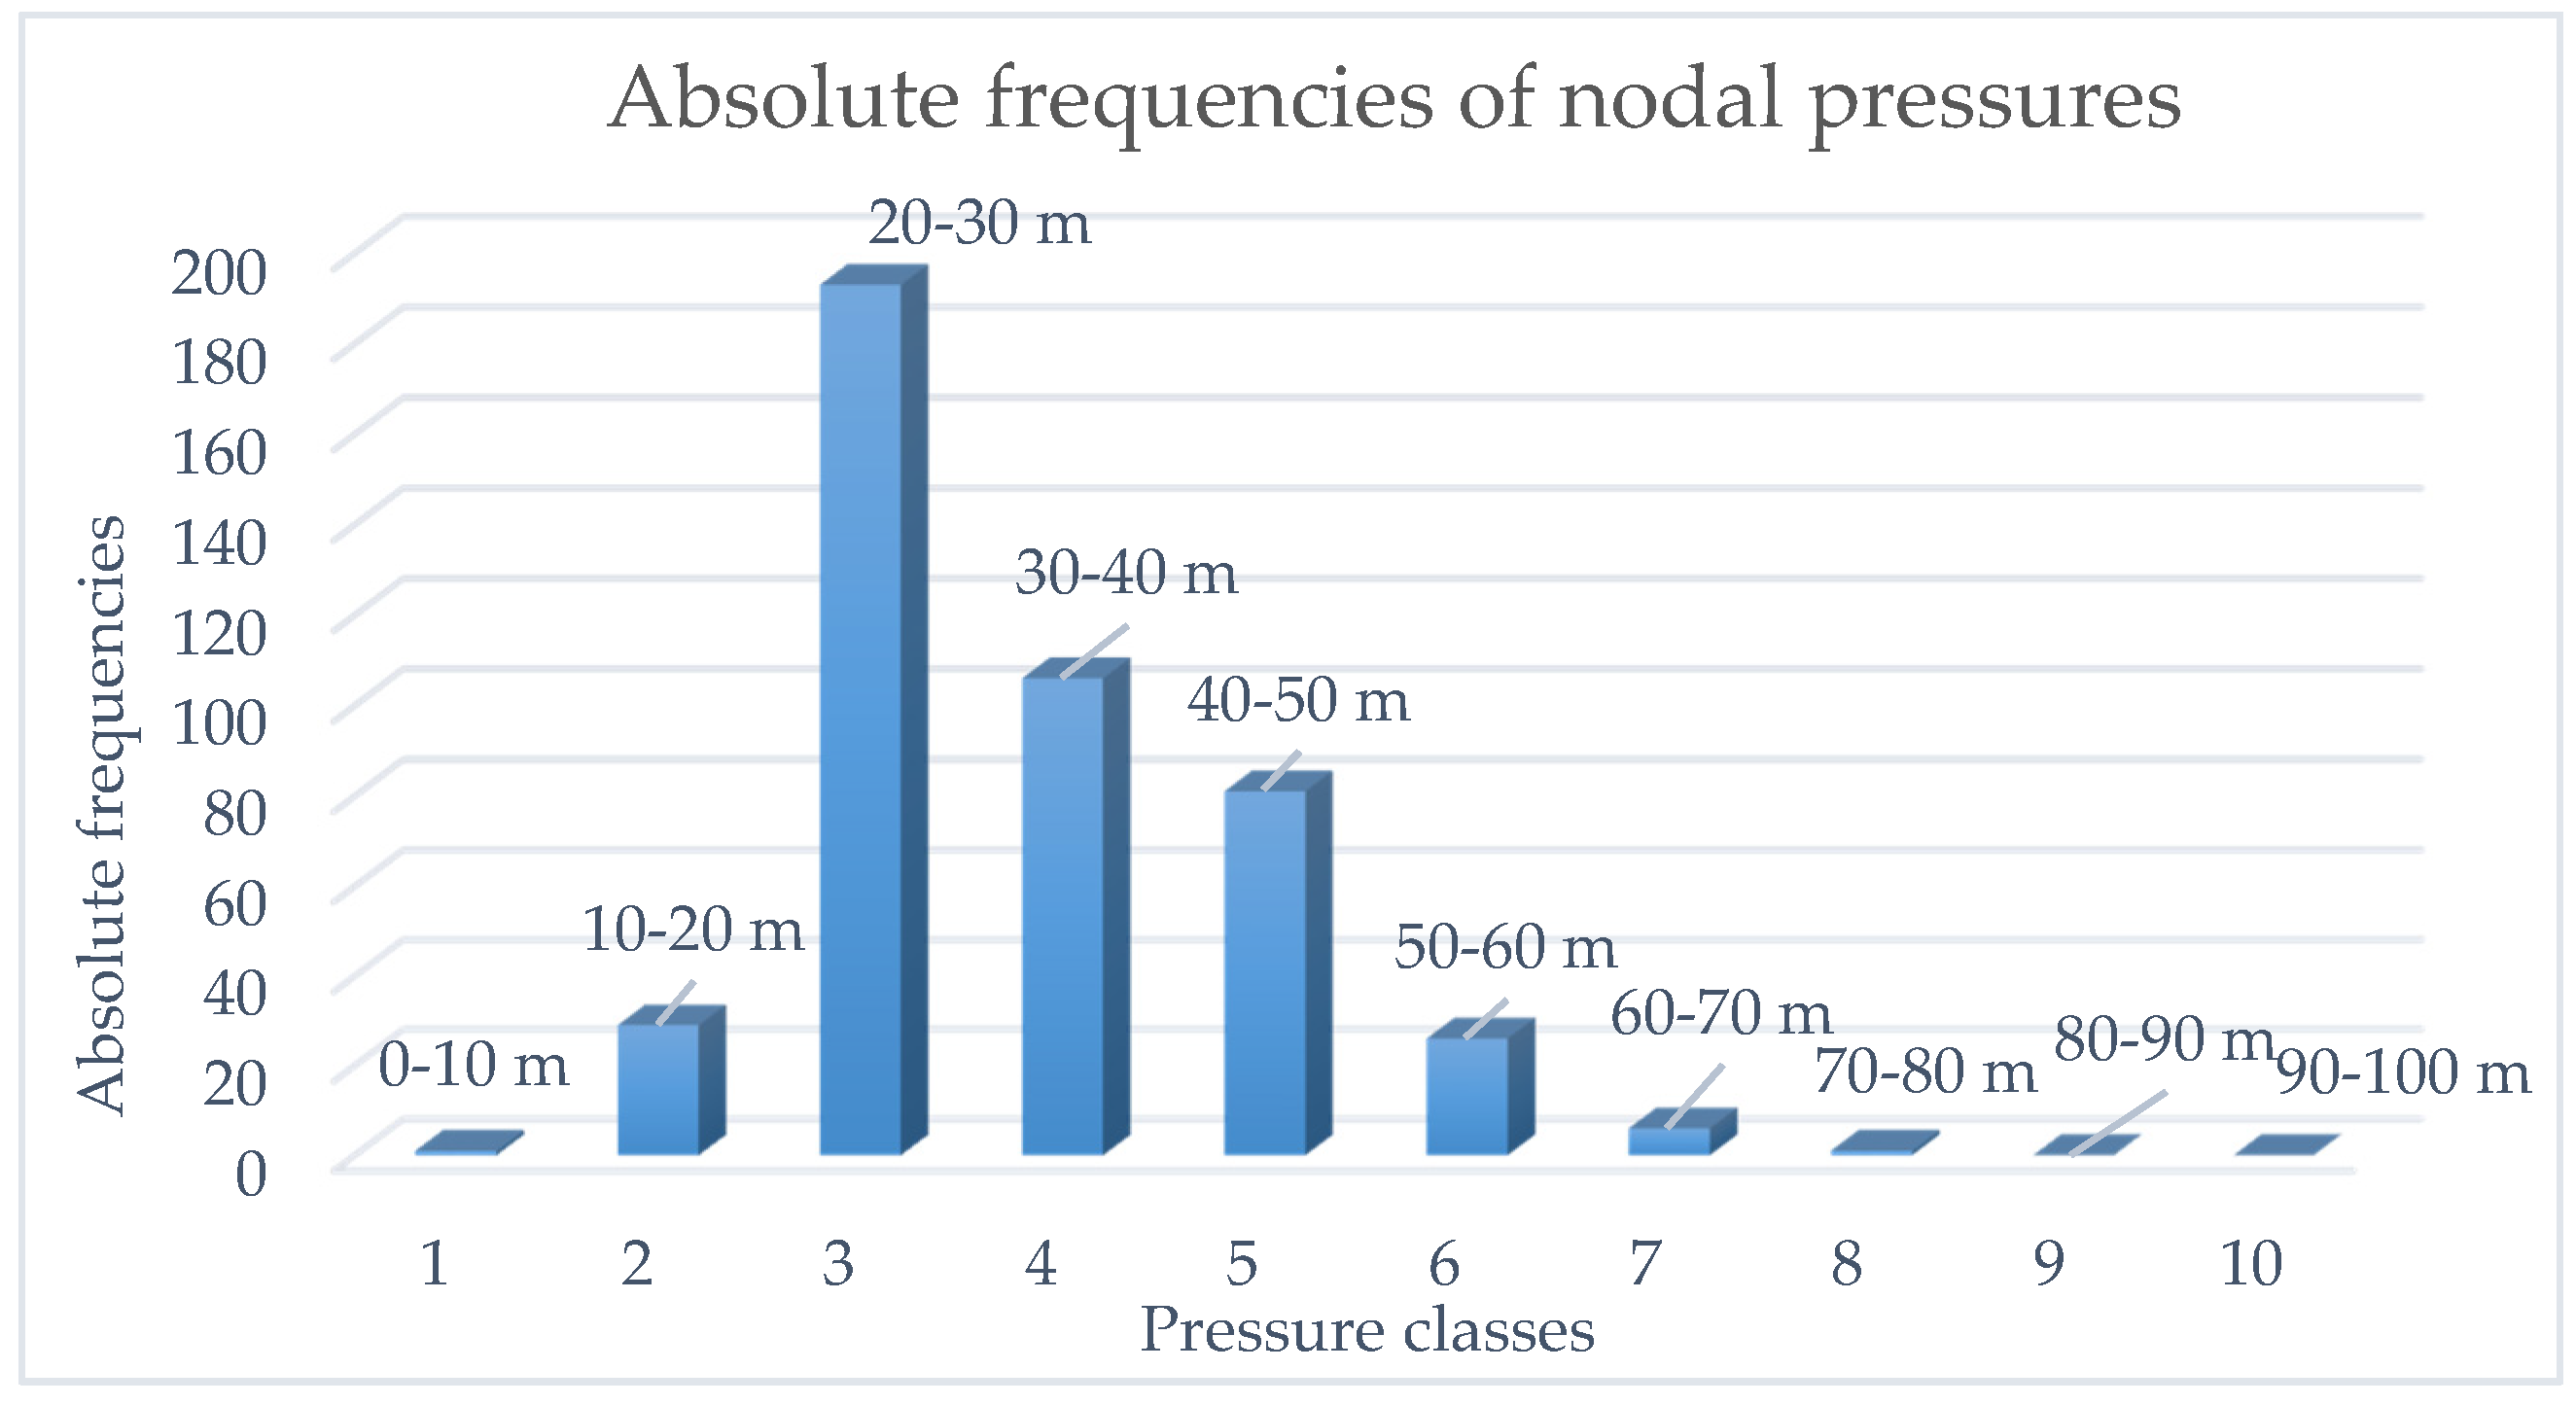
By proposing the same analysis carried out for the HAN network, we consider the most critical solution to analyze the trend of the nodal pressures in the network. The most demanding condition is configuration 1 with the increase of 30% in demand in one-third of the highest pressure nodes in addition to the failure of pipe 480. It exhibits the highest demand deficit of 88.65 % due to a minimum pressure of 9.52 m. From the histogram of the absolute frequencies of nodal pressures (Figure 10), it can be observed that only one node shows a pressure below 10 m and that 29 nodes have pressures between 10–20 m and thus are still below the minimum required. Therefore, a total of 30 nodes are characterized by demand deficit. However, considering that the BIN network has 443 nodes, we can state that most of the nodes work at acceptable pressure values of between 20 and 70 m. Although the deficit cases are outnumbered, they may be localized and possibly considered if they affect sensitive targets, for example. Once again, despite the heavy deficit of 88.65%, it represents an isolated case, and the network performs well overall in facing the changes in working conditions.

4. Conclusions

The optimal design of water distribution networks still represents a challenge issue. This is due, on the one hand, to the continuous growth of urban centers and the corresponding evolution of WDNs and, on the other hand, to the high rate of uncertainty that characterized the WDNs’ operation during their life cycle. Among the main factors that may be considered, only the breakage of pipes and the change in water demands are analyzed. Other factors, such as the operating conditions of pumps and valves and the networks extension, are considered of minor importance, and therefore are not considered.
In this complex framework, the challenge is to find a design solution which is the best in terms of performance in the present and, at the same time, also in the future. The traditional approach based on the evaluation of the Pareto optimal solutions and the successive use of classic PIs to rank them seems not always satisfactory. Particularly, the analysis of resilience and cost indices is not sufficient when choosing among optimal or sub-optimal solutions. Moreover, there is the risk that “optimal” solutions reveal themselves to be unreliable in terms of hydraulic modelling or unacceptable in terms of service compliance, for example, due to violation of pressure constrains or non-fulfilment of service goals. Thus, this study aims to outline a methodological approach to better understand the behavior of the WDNs with respect to changes in working conditions. This approach focuses on two important aspects, the evaluation of the demand fulfilment and the range of working pressures, through two new indices, the demand deficit (DD), and the pressure range (PR). The two PIs represent a measure of the vulnerability of the network, and the more they tend to zero, the more robust the network is from an operational point of view. Moreover, in the proposed approach, the importance of also taking into account the hydraulic and service feasibility of solutions in all the testing scenarios is stressed, and the use of a weighting factor, i.e., the percentage of infeasible solutions (IC), is suggested.
The methodology is tested on three case studies, the two loop, Hanoi, and Balerma irrigation networks, which are standard references in the international literature.
The results show that the two proposed indices are able to highlight the low reliability in terms of minimum pressure and demand fulfilment of some solutions, in addition to the evaluation of the resilience index alone. However, even for the most “critical scenarios”, solutions characterized by higher diameters, and thus by higher values of the resilience index, are expected to be associated with more satisfactory ranges of nodal pressures, but this is not always true due to their higher degree of spatial variation. This is particularly clear for the more complex network, the Balerma irrigation.
Moreover, a significant percentage of infeasible solutions is also observed for the scenarios that drive to more expensive and thus more resilient networks. It is interesting to note that for the networks of Hanoi and Balerma, the values of index IC are high and quite constant for all the scenarios, highlighting the limits of pure mathematical optimization procedures. In fact, the results show that carrying out a performance analysis only on average values of classical PIs, without also considering the number of infeasible configurations, may not lead to fully reliable outcomes. The joint use of the new PIs, DD, PR, and IC may be helpful to improve the analysis of functionality of WDNs, widening the range of factors to be considered in optimization procedures. This advantage may be confirmed in application to other case studies that will be performed in future research.

Author Contributions

Conceptualization F.F., M.C.C., and G.B.; definition of framework used, M.C.C.; writing original draft, F.F.; review and editing, M.C.C. and G.B. All authors have read and agreed to the published version of the manuscript.

Funding

This research received no external funding.

Conflicts of Interest

The authors declare no conflict of interest.

References

  1. Schaake, J.; Lai, D. Linear Programming and Dynamic Programming Applications to Water Distribution Network Design; Technical Report No. 116; Department of Civil Engineering, Massachusetts Institute of Technology: Cambridge, MA, USA, 1969. [Google Scholar]
  2. Alperovits, E.; Shamir, U. Design of optimal water distribution systems. Water Resour. Res. 1977, 13, 885–900. [Google Scholar] [CrossRef]
  3. Su, Y.; Mays, L.; Duan, N.; Lansey, K. Reliability-based optimization model for water distribution systems. J. Hydraul. Eng. 1987, 113, 1539–1556. [Google Scholar] [CrossRef]
  4. Goldberg, D.E.; Kuo, C.H. Genetic algorithms in pipeline optimization. J. Comput. Civil Eng. 1987, 1, 128–141. [Google Scholar] [CrossRef]
  5. Murphy, L.J.; Simpson, A.R. Pipe network optimization using genetic algorithms. In Proceedings of the Specialty Conference of Water Resources Planning and Management Division, American Society of Civil Engineers, Seattle, WA, USA, 1–5 May 1993. [Google Scholar]
  6. Simpson, A.R.; Dandy, G.C.; Murphy, J.L. Genetic algorithms compared to other techniques for pipe optimization. J. Water Resour. Plan. Manag. 1994, 120, 423–443. [Google Scholar] [CrossRef] [Green Version]
  7. Savic, D.A.; Walters, G.A. Genetic algorithms for least cost design of water distribution networks. J. Water Resour. Plan. Manag. 1997, 123, 67–77. [Google Scholar] [CrossRef]
  8. Kirkpatrick, S.; Gelatt, C.D.; Vecchi, M.P. Optimization by simulated annealing. Science 1983, 220, 671–680. [Google Scholar] [CrossRef]
  9. Aarts, L.E.H.; Van Laarhoven, P.J.M. Statistic cooling: A general approach to combinatorial optimization problems. Philips J. Res. 1985, 40, 193–226. [Google Scholar]
  10. Cunha, M.C.; Sousa, J. Water distribution design optimization: Simulated annealing approach. J. Water Resour. Plan. Manag. 1999, 125, 215–221. [Google Scholar] [CrossRef]
  11. Glover, F. Tabu search-part I. ORSA J. Comput. 1989, 1, 190–206. [Google Scholar] [CrossRef]
  12. Cunha, M.C.; Ribeiro, L. Tabu search algorithms for water network optimization. Eur. J. Oper. Res. 2004, 157, 746–758. [Google Scholar] [CrossRef] [Green Version]
  13. Fujiwara, O.; Khang, D.B. A two-phase decomposition method for optimal design of looped water distribution networks. Water Resour. Res. 1987, 23, 977–982. [Google Scholar] [CrossRef]
  14. Cohon, J.; Marks, D. A review and evaluation of multiobjective programming techniques. Water Resour. Res. 1975, 11, 208–220. [Google Scholar] [CrossRef]
  15. Halhal, D.; Walters, G.A.; Ouazar, D.; Savic, D.A. Water network rehabilitation with structured messy genetic algorithm. J. Water Resour. Plan. Manag. 1997, 123, 137–146. [Google Scholar] [CrossRef] [Green Version]
  16. Chand, S.; Wagner, M. Evolutionary many-objective optimization: A quick-start guide. Surv. Oper. Res. Manag. Sci. 2015, 20, 35–42. [Google Scholar] [CrossRef] [Green Version]
  17. Srinivas, N.; Deb, K. Multi-Objective function optimization using non-dominated sorting genetic algorithms. Evol. Comput. 1995, 3, 221–248. [Google Scholar]
  18. Deb, K.; Agrawal, S.; Pratap, A.; Meyarivan, T. A fast elitist non-dominated sorting genetic algorithm for multi-objective optimization: NSGA-II. Parallel Probl. Solving Nat. 2002, 6, 849–858. [Google Scholar]
  19. Laumanns, M.; Thiele, L.; Zitzler, E.; Deb, K. Archiving with guaranteed convergence and diversity in multi-objective optimization. In Proceedings of the Gecco-2002 Genetic and Evolutionary Computation Conference, New York, NY, USA, 9–13 July 2002; pp. 439–447. [Google Scholar]
  20. Kollat, J.B.; Reed, P.M. Comparing state-of-the-art evolutionary multi-objective algorithms for long-term groundwater monitoring design. Adv. Water Resour. 2006, 29, 792–807. [Google Scholar] [CrossRef]
  21. Hadka, D.; Reed, P. Borg: An auto-adaptive many-objective evolutionary computing framework. Evol. Comput. 2013, 21, 231–259. [Google Scholar] [CrossRef]
  22. Wang, Q.; Savic, D.A.; Kapelan, Z. GALAXY: A new hybrid MOEA for the optimal design of water distribution systems. Water Resour. Res. 2017, 53, 1997–2015. [Google Scholar] [CrossRef] [Green Version]
  23. Cunha, M.C.; Marques, J. A new multiobjective simulated annealing algorithm—MOSA-GR: Application to the optimal design of water distribution networks. Water Resour. Res. 2020, 56, e2019WR025852. [Google Scholar] [CrossRef]
  24. Becciu, G.; Mambretti, S.; Martins, P.S.; Moraes, R.L. Dealing with uncertainties in losses assessment in water supply networks: Preliminary results. WIT Trans. Built Environ. 2014, 139, 139–148. [Google Scholar]
  25. Savic, A. Coping with Risk and Uncertainty in Urban Water Infrastructure Rehabilitation Planning; Acqua e Città-I Convegno Nazionale di Idraulica Urbana, Sant’Agnello: Naples, Italy, 2005. [Google Scholar]
  26. Cunha, M.C.; Sousa, J.J.O. Robust design of water distribution networks for a proactive risk management. J. Water Resour. Plan. Manag. 2010, 136, 227–236. [Google Scholar] [CrossRef]
  27. Scarpa, F.; Lobba, A.; Becciu, G. Expeditious pump rescheduling in multisource water distribution networks. Proc. Eng. 2015, 119, 1078–1087. [Google Scholar] [CrossRef] [Green Version]
  28. Basupi, I.; Kapelan, Z. Flexible water distribution system design under future demand uncertainty. J. Water Resour. Plan. Manag. 2015, 141, 4014034. [Google Scholar] [CrossRef]
  29. Marques, J.; Cunha, M.C.; Savic, D. A multi-objective optimization of water distribution systems based on a real options approach. Environ. Model. Softw. 2015, 63, 1–13. [Google Scholar] [CrossRef] [Green Version]
  30. Marques, J.; Cunha, M.C.; Savic, D.; Giustolisi, O. Water network design using a multiobjective real options framework. J. Optim. 2017, 2017, 4373952. [Google Scholar] [CrossRef]
  31. Wagner, J.M.; Shamir, U.; Marks, D.H. Water distribution reliability: Simulation methods. J. Water Resour. Plan. Manag. 1988, 276, 276–294. [Google Scholar] [CrossRef] [Green Version]
  32. Raad, D.N.; Sinske, A.N.; Van Vuuren, J.H. Comparison of four reliability surrogate measures for water distribution systems design. Water Resour. Res. 2010, 46, W05524. [Google Scholar] [CrossRef]
  33. Atkinson, S.; Farmani, R.; Memon, F.A.; Butler, D. Reliability indicators for water distribution system design: Comparison. J. Water Resour. Plan. Manag. 2014, 140, 160–168. [Google Scholar] [CrossRef] [Green Version]
  34. Wang, Q.; Guidolin, M.; Savic, D.M.; Kapelan, Z. Two-objective design of benchmark problems of a water distribution system via MOEAs: Towards the best-known approximation of the true pareto front. J. Water Resour. Plan. Manag. 2015, 141, 04014060. [Google Scholar] [CrossRef] [Green Version]
  35. Todini, E. Looped water distribution networks design using a resilience index based heuristic approach. Urban Water 2000, 2, 115–122. [Google Scholar] [CrossRef]
  36. Prasad, T.D.; Park, N.S. Multiobjective genetic algorithms for design of water distribution networks. J. Water Resour. Plan. Manag. 2004, 73, 73–82. [Google Scholar] [CrossRef]
  37. Morley, M.S.; Tricarico, C. Pressure Driven Demand Extension for EPANET; Technical Report 2008-02; Centre for Water Systems, University of Exeter: Exeter, UK, 2008. [Google Scholar]
  38. Rossman, L.A. EPANET 2 User’s Manual; US Environmental Protection Agency: Cincinnati, OH, USA, 2000.
  39. Reca, J.; Martinez, J. Genetic algorithms for the design of looped irrigation water distribution networks. Water Resour. Res. 2006, 42. [Google Scholar] [CrossRef]
  40. Eliadas, D.G.; Kyriakou, M.; Vrachimis, S.; Polycarpou, M.M. EPANET-MATLAB Toolkit: An open-source software for interfacing EPANET with MATLAB. In Proceedings of the 14th International Conference on Computing and Control for the Water Industry (CCWI), Hague, The Netherlands, 7–9 November 2016. [Google Scholar]
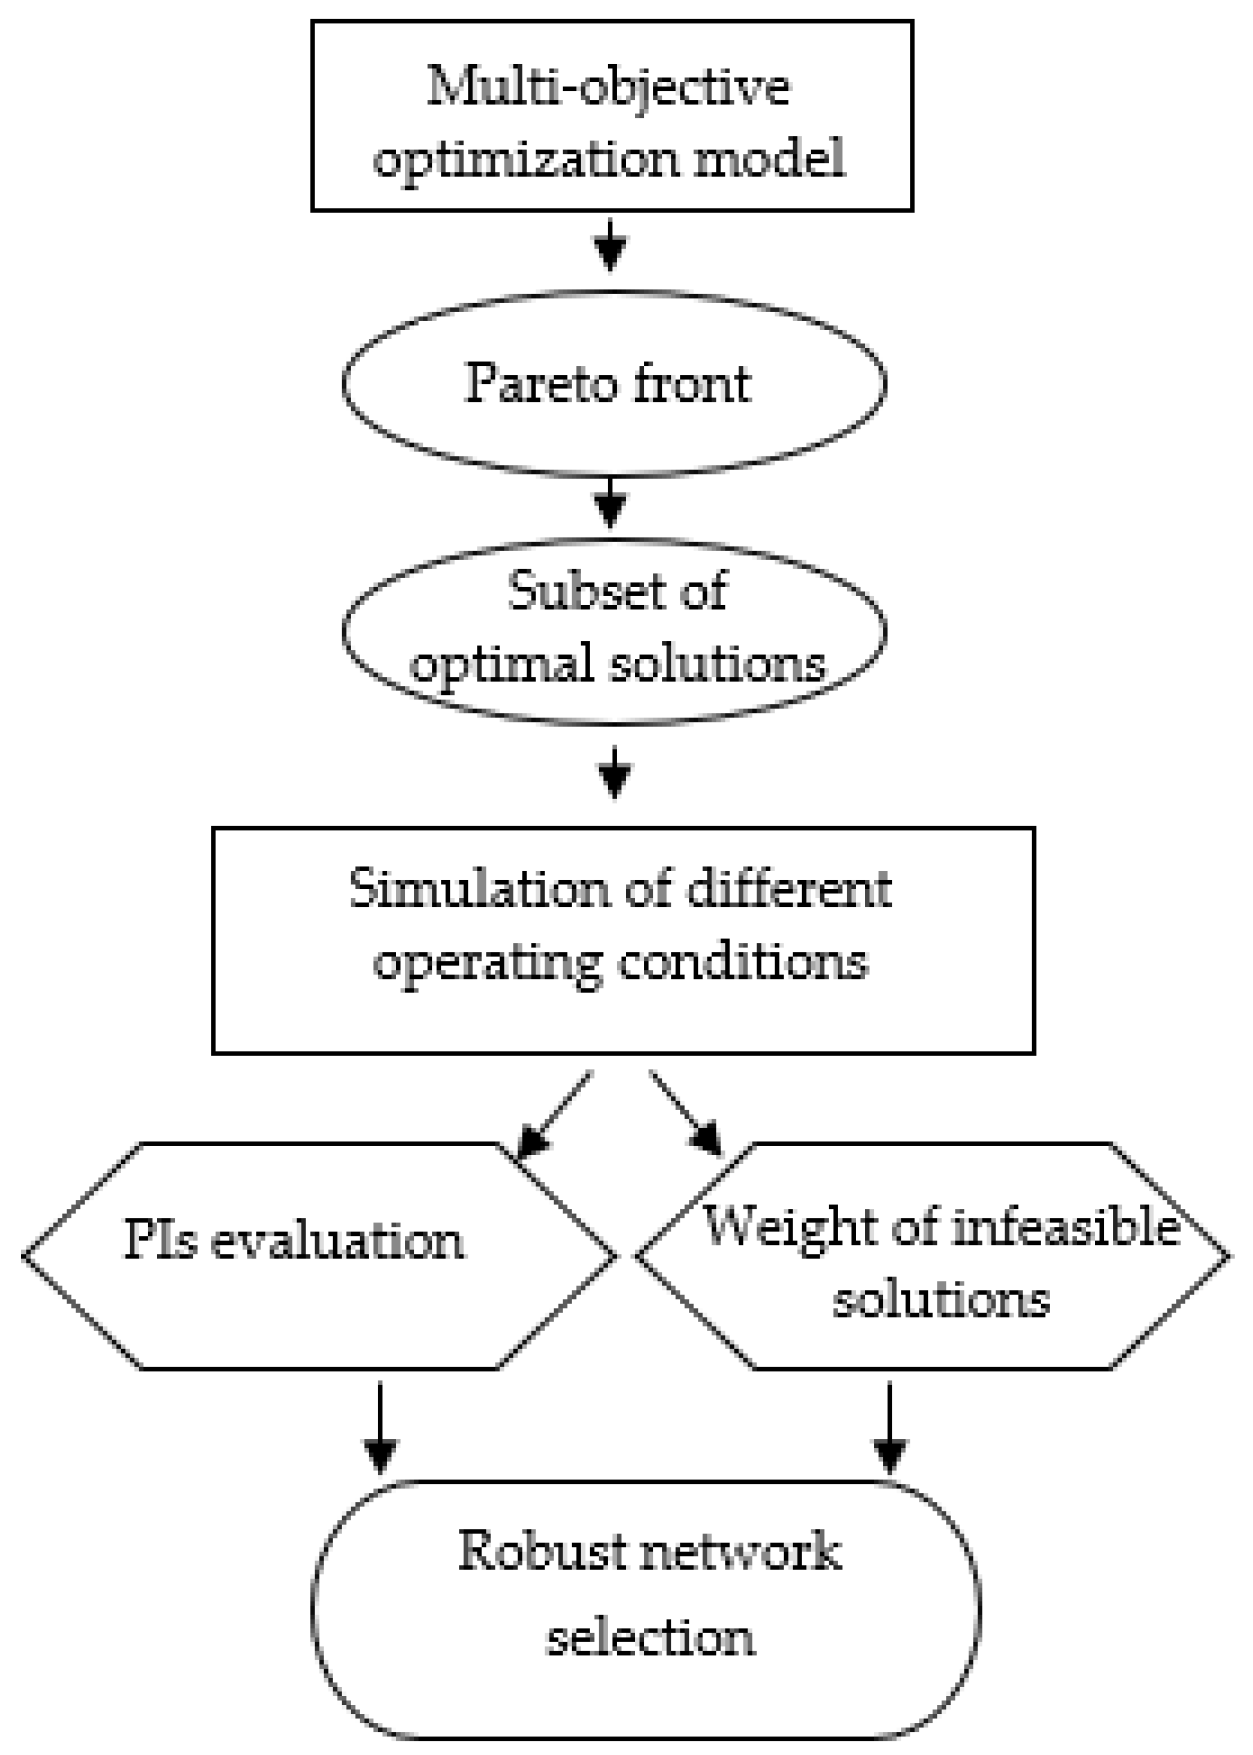
Figure 1. Flowchart of the methodology.
Water 12 03404 g001
Figure 2. Benchmark networks: (a) two loop, (b) Hanoi, (c) Balerma.
Water 12 03404 g002
Figure 3. Pareto fronts of the TLN.
Water 12 03404 g003
Figure 4. Pareto fronts of the HAN.
Water 12 03404 g004
Figure 5. Pareto fronts of the BIN.
Water 12 03404 g005
Figure 6. Pipe failures in the TLN (a), HAN (b) and BIN (c).
Water 12 03404 g006
Figure 7. Pipe diameters of Solution 1 (a) and Solution 2 (b).
Water 12 03404 g007
Figure 8. Hydraulic characteristics of solution 3 after the simulation of scenario 6.
Water 12 03404 g008
Figure 9. Histogram of absolute frequencies of nodal pressures of HAN solution 3.
Water 12 03404 g009
Figure 10. Histogram of absolute frequencies of nodal pressures of BIN solution 1.
Water 12 03404 g010
Table 1. Operating range of emitter coefficients.
ConditionEmitter CoefficientDemand
H i 0 C i = 0 Q d e m = 0
0 < H i H r e q C i = Q r e q i ( H r e q i z i ) γ Q d e m = C i ( H i z i ) γ
H i > H r e q C i = Q r e q i ( H i z i ) γ Q d e m = Q r e q
Table 2. Networks characteristics.
ProblemAcronymLCWSNPNN
Two-loop networkTLN1187
Hanoi networkHAN113432
Balerma irrigation networkBIN14454443
Note: Acronym = abbreviation of the network; LC = number of loading conditions; WS = number of water sources; NP = number of pipes; NN = number of nodes.
Table 3. Implementation features.
Population Size
ProblemNFEsGroup1Group2Group3
Two-loop network100,0004080160
Hanoi network600,00060120240
Balerma irrigation network2,000,000200400800
Table 4. Input parameters for the optimization algorithm.
NetworkDiameter (mm)Cost (USD × m)Minimum Pressure (m)
Two-loop network25.4; 50.8; 76.2; 101.6; 152.4; 203.2; 254; 304.8; 355.6; 406.4; 457.2; 508; 558.8; 609.62; 5; 8; 11; 16; 23; 32; 50; 60; 90; 130; 170; 300; 55030
Hanoi network304.8; 406.4; 508; 609.6; 762; 101645.72; 70.4; 98.38; 129.33; 180.74; 278.2830
Balerma irrigation network113; 126.6; 144.6; 162.8; 180.8; 226.2; 285; 361.8; 452.2; 581.87.22; 9.1; 11.92; 14.84; 18.38; 28.6; 45.39; 76.32; 124.64; 215.8520
Table 5. Solutions for each network.
Two-Loop Network Hanoi Network Balerma Irr Network
SolCostResilienceSolCostResilienceSolCostResilience
10.420.24816.250.21912.050.408
20.460.35126.570.26022.410.65
30.570.55037.180.30033.280.801
40.970.75248.210.33245.720.896
51.250.80058.790.340510.040.928
61.670.849610.700.352615.010.941
74.40.903 720.920.955
Table 6. Characteristics of closed pipes.
NetworkTLNHANBIN
Pipe ID 242025135118819433875480119
Length (m)100010002200130080025008003542004211450314
Table 7. Details of operation scenarios.
ScenarioSetup
110% increase in the demands in all nodes;
230% increase in the demands in 1/3 nodes with the maximum demand;
330% increase in the demands in 1/3 nodes with the minimum demand;
4Pipe failure;
510% increase in the demands in all nodes + pipe failure;
630% increase in the demands in 1/3 nodes with the maximum demand + pipe failure;
730% increase in the demands in 1/3 nodes with the minimum demand + pipe failure.
Table 8. Characteristics of optimal network solutions.
Two-Loop NetworkHanoi NetworkBalerma Irr Network
SolCost
(×106 USD)
In
(-)
Pmin
(m)
SolCost
(×106 USD)
In
(-)
Pmin
(m)
SolCost
(×106 USD)
In
(-)
Pmin
(m)
10.420.24830.0616.250.21930.0512.050.40820.02
20.460.35131.5126.570.26030.1222.410.6520.27
30.570.55035.6837.180.30031.6533.280.80122.39
40.970.75239.9248.210.33242.6345.720.89622.81
51.250.80040.5058.790.34047.06510.040.92822.82
61.670.84941.85610.700.35249.66615.010.94122.81
74.40.90342.73 720.920.95522.82
Table 9. Average characteristics of TLN solutions among all the scenarios.
NetworkSolAverage In
(-)
Average PR*
(-)
Average Pmin
(m)
Average DD*
(%)
IC
(%)
10.2160.04528.112.7436.36
20.2510.07524.7311.4927.27
30.358-27.96--
TLN40.658-34.73--
50.716-35.31--
60.789-37.05--
70.867-38.39--
Table 10. Average characteristics of HAN solutions among all of the scenarios.
NetworkSolAverage In
(-)
Average PR*
(-)
Average Pmin
(m)
Average DD*
(%)
IC
(%)
10.1840.17620.9318.5460
20.1790.07522.409.3726.66
HAN30.1990.05523.689.5926.66
40.2140.06731.264.2126.66
50.2170.02336.621.4826.66
60.3260.02236.261.996.66
Table 11. Characteristics of BIN solution 7 for each demand scenario combined with pipe failure.
SolScenarioPipe ID FailureInPmin (m)
188-Infeasible
194-Infeasible
54800.94722.78
51-Infeasible
1190.93822.78
750.93522.78
338-Infeasible
188-Infeasible
194-Infeasible
764800.94622.82
51-Infeasible
1190.94922.82
750.94822.82
338-Infeasible
188-Infeasible
194-Infeasible
74800.94822.72
51-Infeasible
1190.95022.72
750.94922.72
338-Infeasible
Table 12. Average characteristics of BIN solutions among all the scenarios.
NetworkSolAverage In
(-)
Average PR*
(-)
Average Pmin
(m)
Average DD*
(%)
IC
(%)
10.3380.09313.8739.444.44
20.5990.07317.669.5244.44
30.7740.16721.94-44.44
BIN40.8880.22922.79-44.44
50.9180.22222.78-44.44
60.9350.23722.78-44.44
70.9480.23722.78-44.44
Table 13. Maximum nodal pressures of BIN solutions.
Sol1234567
Pmax [m]75.4693.70104.95110.53111.93112.66113.18
Publisher’s Note: MDPI stays neutral with regard to jurisdictional claims in published maps and institutional affiliations.