Sustainable Exploitation of Dominant Fishes in the Largest Estuary in Southeastern China


1
Fisheries College, Ocean University of China, Qingdao 266003, China
2
Third Institute of Oceanography, Ministry of Natural Resources, Xiamen 361005, China
*
Author to whom correspondence should be addressed.
Water 2020, 12(12), 3390; https://doi.org/10.3390/w12123390
Submission received: 20 October 2020
/
Revised: 23 November 2020
/
Accepted: 30 November 2020
/
Published: 2 December 2020
(This article belongs to the Section Water, Agriculture and Aquaculture)
Abstract
:Globally, marine fisheries have declined under multiple stresses including overfishing, climate change, and habitat degradation. The Min River Estuary, as the largest estuary in southeastern China, has confronted this situation over recent decades. In this study, the dominant species of fish stocks in the Min River Estuary, including Coilia mystus, Cynoglossus abbreviates, Collichthys lucidus, Amblychaeturichthys hexanema, Polydactylus sextarius, Harpodon nehereus, and Secutor ruconius, were evaluated by the length-based Bayesian biomass estimator method (LBB). Outcomes could be grouped into three categories as healthy, showing the lowest exploitation rate (E: 0.31–0.43) and highest relative biomass (B/Bmsy: 1.30–1.90), including S. ruconius, C. mystus, and H. nehereus; overfished, with a medium E (0.50–0.58) and B/Bmsy (0.68–0.79), including A. hexanema and C. abbreviates; and collapsed, with the highest E (0.89–0.92) and lowest B/Bmsy (0.03–0.21), including C. lucidus and P. sextarius. Corresponding imperative countermeasures such as using larger-sized mesh gears and reducing fishing intensity should be deployed according to the current status of each species for sustainable fishery exploitation and fish conservation.
1. Introduction
Worldwide fisheries are severely damaged under overfishing [1], and higher requirements have been put forward for stock management [2]. The reasonable estimation of resource exploitation and reliable stock assessment of target fish species are greatly encouraged in rebuilding the fishery resources. Corresponding methods were developed by the data support such as catch trends, life history, and the ratio of the empirical estimation of biomass in the final year to the unfished resource (B/B0) as a priori input [3,4,5,6,7].
The length-based Bayesian biomass estimation method (LBB), combining species length frequencies data and Bayesian Monte Carlo Markov chain (MCMC), could rapidly estimate the status of fish exploitation [8,9]. The LBB method rejects the dependency of catch data and life history information but mitigates the subjectivity caused by prior estimation of the remaining biomass in the final year. Most indicators, including estimated relative biomass (B/B0), length at first capture (Lc), optimum length in the first capture (Lc_opt), and the ratio of current relative biomass to the biomass capable of producing maximum sustainable yields (B/Bmsy), could be extracted from LBB for fishery management and applied as inputs in other stock assessment models. LBB has a promising application by providing better performance and more reliable results that are closer to the “true” values [8].
China possessed the largest marine fisheries in the world with a total catch of 11.1 million tons in 2017 [10], which accounted for 19.2% of the global capture [11]. However, the catch composition has shifted from traditional large-sized species with high trophic levels to small-sized and low-valued fish species (“feed-grade fish”). These low-valued fishes accounted for 35% of the total catch in China’s exclusive economic zones [12], reflecting a common phenomenon of “fishing down” [13]. The excessive and aimless exploitation without fishery stock assessment resulted in a short-term increase but subsequently a long-term decline in both the yield and the economic value of Chinese coastal fisheries [14].
The Min River Estuary, as the largest estuary in southeastern China, plays a vital role in the local economy, culture, and ecology [15,16,17]. Characterized by a complex and unique ecosystem structure under the synergic effect of discharge dilution, peripheral seawater salinization, and the Taiwan Warm Current [18], the Min River Estuary is highly productive and has been used as spawning grounds, feeding grounds, and natural habitats for more than 222 fish species [19]. The most important economic and dominant species in the estuary showed a high spatio-temporal niche breadth, supporting a longer time of inhabiting and a wider range of distribution [15,20]. Through the top-down control, bottom-up control, or wasp-waist control among different species, variations in economic species abundance would lead to the reaction of the whole fish community structure and even the ecosystem. Recent investigations had discovered that fishery resources in the estuary tended to decrease [21,22,23]. Unfortunately, there were few reports regarding the fish stock assessment in this area, which impeded the application of effective management.
In this study, stocks of dominant fish species in the Min River Estuary were evaluated based on investigations from 2015 to 2017. Fish length frequency data during the three years were applied for LBB modeling, based on which the current status of exploitation in dominant species was evaluated. The results could provide insights into fish stock assessment in the estuary, further contributing to fish conservation and fishery management.
2. Material and Method
2.1. Ethical Statement
All animal experimental procedures used in this study were approved by the Animal Care and Ethics Committee of the Ocean University of China.
2.2. Study Area, Sampling, and Dominant Species
The Min River Estuary, located in the east of Fujian Province at a range of latitude 25°45′00″–26°30′00″ and longitude 119°30′00″–120°00′00″ (Figure 1), is the largest in southeastern China, with an annual discharge of 57.5 billion m3 [24]. Twelve consecutively seasonal surveys were conducted over three years in January, May, August, and November from 2015 to 2017. Fish samples were collected by a commercial fishing vessel through a benthic trawling net with a mesh size of 25 mm. A total of 11 stations were set up (Figure 1), and trawling lasted approximately 30 min per station at an average speed of three knots. The collected fishes were identified to the lowest taxonomic level according to ‘The Fishes of Fujian Province’ [25]. The taxonomy was then revised according to Fishbase (www.fishbase.org) to avoid invalid species, synonyms, and homonyms. Data including abundance, body length, and body weight were measured. Index of relative importance (IRI) was calculated as in Formula (1) [26]:
where Ni signifies the relative abundance of species i in all sampling sites; Wi designates the relative weight of species i out of the total fish weight; and Fi indicates the occurrence of species i out of the number of total stations. Species with IRI > 500 were defined as dominant species [27].
IRIi = (Ni + Wi) × Fi
2.3. LBB Modeling
LBB modeling was performed using the “TropFishR” package [28] in R 3.6.1 [29]. The basic assumption in this model was that fish grew continuously and reached the maximum body length at the maximum age, which ensured that somatic growth and natural mortality of adults could be expressed in a ratio [8,30]. In LBB, relative natural mortality (M/K) and relative fishing mortality (F/K) were induced to estimate the ratio of fishing mortality to natural mortality (F/M) and the ratio of current exploited biomass to original stock without fishing (B/B0). In this way, the number of input parameters can be effectively reduced [8].
The model firstly estimated the asymptotic length (L∞), the length where 50% of the fish were captured (Lc), M/K, and F/K. However, the practical value of L∞ was recommended if it was directly available and reliable, to reduce the model uncertainty. The body length of the fish was confirmed by the von Bertalanffy growth function (2) [31]:
where Lt is the length at age t, L∞ is the asymptotic length, K is the growth rate (year−1), t0 is the age of fish at zero length, and t is the age of the fish.
Parameters L∞, Lc, M/K, and F/K were estimated by LBB following a series of equations [8]. With the input of L∞, Lc, M/K, and F/K, the length corresponding to the maximum unexploited cohort biomass (Lopt) was measured by Equation (3) [32]:
The relative biomass in the exploited phase of the population without fishing activity (B0’/R) was given by Equation (7) [34] (B0′> Lc):
When re-running these equations with F = M and Lc = Lc_opt, the relative biomass capable of producing maximum sustainable yields (Bmsy/B0) was estimated. The current biomass relative to the biomass capable of producing maximum sustainable yields (B/Bmsy) was obtained via Equation (9) [8]:
3. Results
3.1. Relative Importance and Length Frequency of the Fishes
Species with IRI > 500 in at least two seasons in the Min River Estuary were identified (Table 1), including Osbeck’s grenadier anchovy Coilia mystus (Feng-ji in Chinese), three-lined tongue sole Cynoglossus abbreviatus (Duan-she-ta in Chinese), big head croaker Collichthys lucidus (Ji-tou-mei-tong-yu in Chinese), pinkgray goby Amblychaeturichthys hexanema (Liu-si-dun-wei-xia-hu-yu in Chinese), blackspot threadfin Polydactylus sextarius (Liu-zhi-ma-ba in Chinese), Bombay duck Harpodon nehereus (Long-tou-yu in Chinese), and deep pugnose ponyfish Secutor ruconius (Lu-ban-yang-kou-bi in Chinese). The highest IRI was 6502.4 of species P. sextarius in summer, followed by 6086.6 of species C. mystus in winter.
The probability density curve of total body length was unimodal for all fishes except S. ruconius. The widest range of body length (72.0–350.0 mm) was determined in C. abbreviatus, while the minimum range (21.0–107.0 mm) was in S. ruconius (Figure 2, Supplementary Table S1).
3.2. Current Exploitation Status of the Fishes
The fishes were classified into three categories of exploitation status. Species S. ruconius, C. mystus, and H. nehereus were grouped in healthy; A. hexanema and C. abbreviates were in overfished; and C. lucidus and P. sextarius were in collapsed (Figure 3). Specific indices regarding the exploitation are listed in Table 2. Species S. ruconius showed the lowest exploitation rate (0.31), the highest Lmean/Lopt (1.30) and Lc/Lc_opt (1.50), the highest B/B0 (0.64) and B/Bmsy (1.90), but the lowest F/M (0.48). Species C. mystus and H. nehereus showed a lower exploitation rate (0.53 and 0.35, respectively) and fishing mortality (0.78 and 0.55, respectively), but higher B/B0 (0.47 and 0.51, respectively), B/Bmsy (1.30 and 1.40, respectively), Lmean/Lopt (1.10 and 0.89, respectively), and Lc/Lc_opt (1.20 and 0.90, respectively). Species A. hexanema and C. abbreviatus were detected as slightly overfished in view of the E values (0.50 and 0.58, respectively) and B/Bmsy (0.68 and 0.79, respectively). Species C. lucidus and P. sextarius had extremely high E values close to “1” (0.92 and 0.89, respectively) and the lowest B/Bmsy (0.21 and 0.03, respectively).
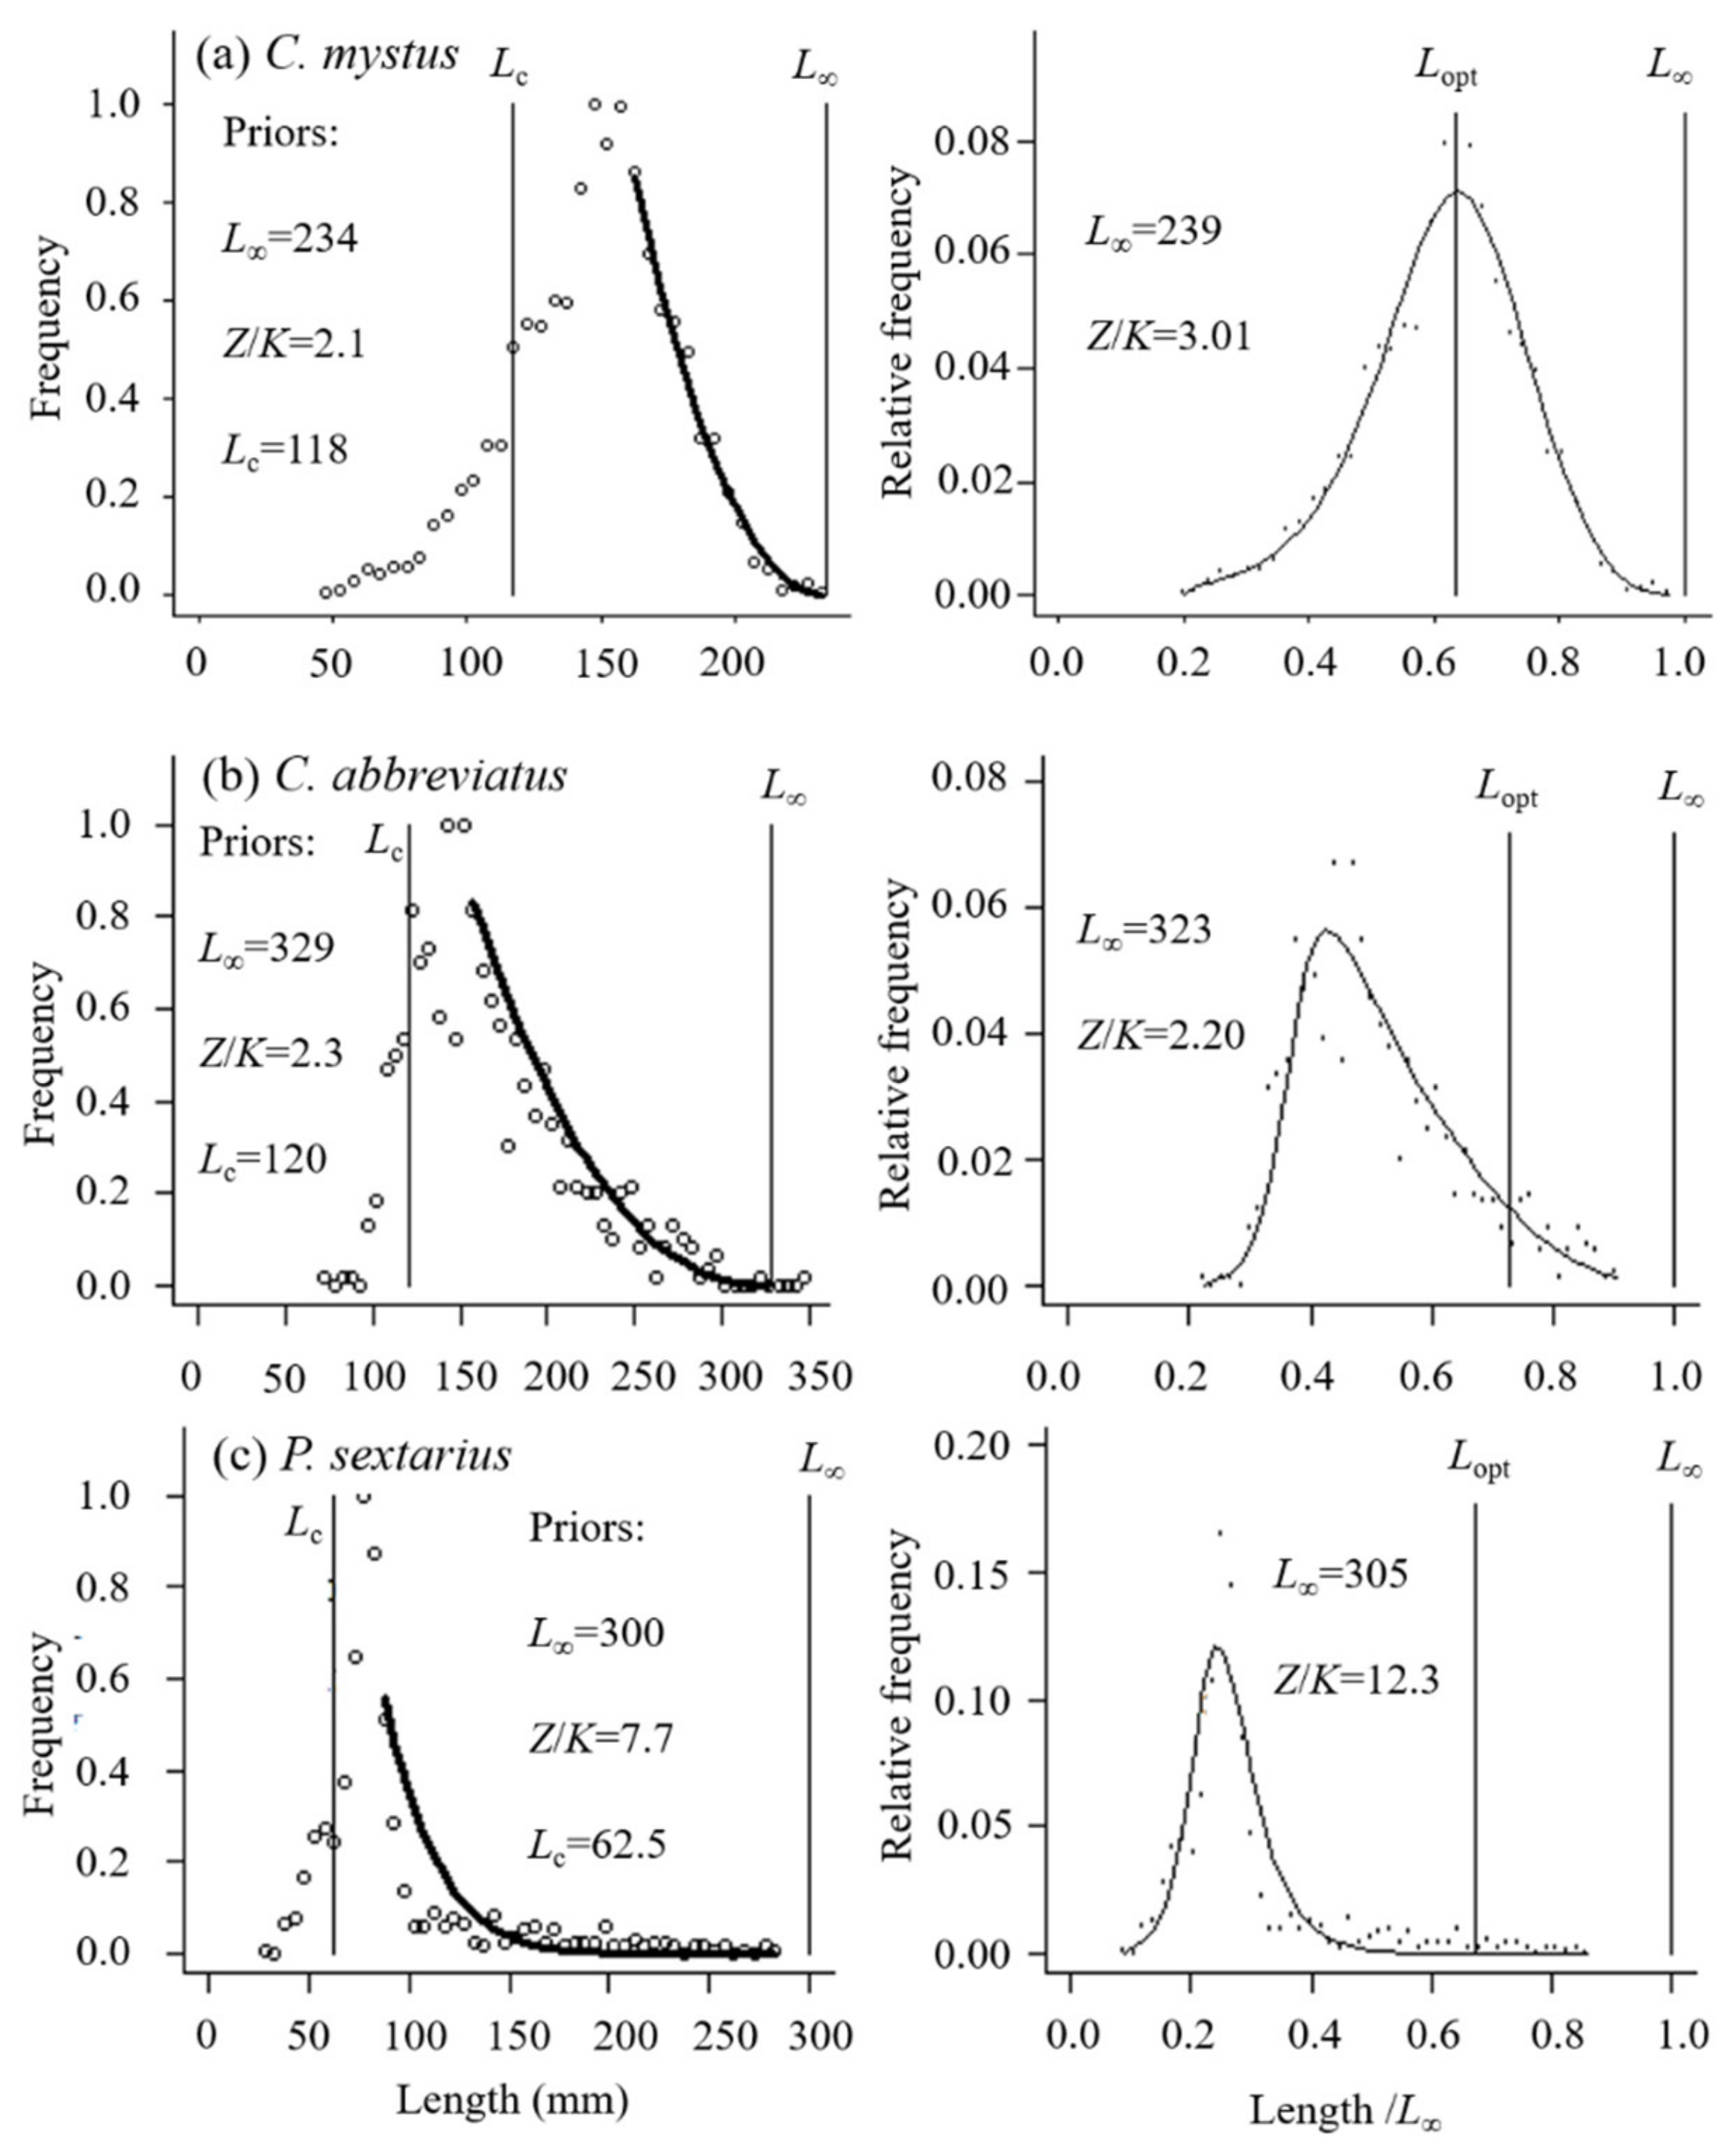
Three species, C. mystus, C. abbreviatus, and P. sextarius, were selected as the surrogates of these three categories, i.e., healthy, overfished, and collapsed, to demonstrate the modeling procedure of LBB (Figure 4). The LBB model was well fitted to all three fishes with Z/K values of 3.01, 2.20, and 12.30, respectively.
4. Discussion
In recent years, the dramatic decrease in coastal fish resources and significant changes in catch composition in China caused by continuously increasing fishing pressure have attracted a lot of concerns [12,41,42]. For instance, a drastic decline was reported in CPUE in 2011 down to 0.86% of 1959 in the Bohai Sea [12,43] and to 53% of 1991 in the Yellow Sea and the East China Sea in 2000 [44]. Meanwhile, local high-valued and large-sized catches disappeared while small fishes with lower trophic levels and minor economic value became dominant. For example, from 1991 to 2000, dominant fish species in the northern East China Sea changed from black scraper Thamnaconus modestus, red bigeye Priacanthus macracanthus, and silver croaker Pennahia argentata to small-sized Indian perch Jaydia lineata, Snyder’s gaper Champsodon snyderi, and skinnycheek lanterfish Benthosema pterotum. Besides, overfishing also contributed to reducing the proportion of elder fishes in the catch and the average weight of individuals [44], suggesting trends of miniaturization and early maturing of the species. For example, in the Yellow Sea, the average first maturity length of small yellow croaker Larimichthys polyactis dramatically decreased from 152.8 in 1960 to 105.3 mm in 2003, accompanying the population collapse [45].
When Lc > L50 (first maturity length, where 50% of the individuals are mature), the fishing gears give up catching immature individuals, leaving the fish a chance to be mature and reproduce at least once before being caught. This is beneficial to the healthy and sustainable development of fish stocks [30]. In the Min River Estuary, the fishing mortalities of species S. ruconius, C. mystus, and H. nehereus were all lower than the respective natural mortalities, and exploitation rates (E) were relatively low. Besides, Lmean/Lopt and Lc/Lc_opt were close to or even bigger than 1, suggesting little harm from the commercial fishing activity on the juveniles and the supplement was abundant for the population. These three species were relatively healthy in terms of natural resources stock and possessing potential economic value for further exploitation and utilization.
Though the L50 for C. mystus was unavailable, mature female individuals with a body length of less than 71.7 mm were discovered in the Yangtze River Estuary [46], much smaller than its Lc (147.6 mm) in the Min River Estuary. Therefore, a considerable proportion of mature female individuals in the Min River Estuary presumably were not caught, leaving opportunities for the recovery of the population. Benefitting from its largest spatio-temporal niche breadth in the Min River Estuary, C. mystus showed the strongest competitive ability, the widest distribution [20], and higher growth rate (K = 1.30) to ensure the strong resilience of the population [22]. It was reported that the stock of C. mystus in the Min River Estuary significantly increased from 1990 to 2006, as well as its dominance in the community [47].
The L50 of S. ruconius at 65.3 mm [38] was smaller than the Lc at 72.0 mm in this study. Similar to the status of C. mystus, the stock of S. ruconius in the Min River Estuary had steadily increased in recent years [22]. As a small economic fish feeding on plankton, S. ruconius had expanded its population, accounted by the decreasing prey pressure caused by the decline in large species and support of sufficient food.
For H. nehereus, Lc (156 mm) was shorter than L50 (200–220 mm) [48,49,50,51], causing difficulties in leaving enough mature individuals out of the catch. However, as a ferocious, cannibalistic, and highly active hunter [48,50], with a rapid growth rate (K = 0.94) [21] and strong resistance to external interference, H. nehereus had expanded its population in the East China Sea in recent decades when the traditional commercial species population declined [52]. Besides, in the East China Sea, the peak spawning season for H. nehereus from July to September [53] totally fell into the official “closed fishing season”, ensuring its population supplement [21]. Even so, the fact that its Lc in current exploitation was still too small should be taken into cautious consideration in the long-term management for sustainable exploitation.
For A. hexanema and C. abbreviatus, if only concerning the F/M and E, the ratio of fishing mortality to natural mortality was close to “1” and the exploitation rates were around “0.5”, both indicating an acceptable state of exploitation and no need of human countermeasures for extra resource protection [54]. However, their stocks were unsustainable when taking Lmean/Lopt and Lc/Lc_opt into consideration. Lmean and Lc were smaller than Lopt and Lc_opt, respectively, which indicated that too many immature individuals were included in commercial catches. No limitation on fish size in fishing would further reduce the fish biomass [55].
As estuarine benthic species, A. hexanema and C. abbreviatus showed a wide niche breadth and high competitiveness in the Min River Estuary [20]. However, in recent years, the extensive use of bottom trawls seriously damaged the population, as well as the seabed environment [56]. Responsive management strategies should be implemented immediately before the population collapse of these species. Based on the results from the LBB analysis, Lc_opt values for these two species (103 and 196 mm, respectively) were determined as appropriate sizes of the first-capture individuals.
There was no doubt that the worst conditions had happened to C. lucidus and P. sextarius. Fishing mortalities for these two species were much higher than their natural mortalities, reflecting drastic declines in fish stocks (B/B0 = 0.08 and 0.01, respectively). Unfortunately, C. lucidus and P. sextarius showed relatively smaller growth rates [22] and weak interspecific competitiveness [20]. In addition, C. lucidus was one of the most favorable aquatic products for coastal residents [57], which further aggravated the loss of its population. Catches of C. lucidus in Fujian Province recorded by the Chinese Fishery Statistical Yearbook had declined from 30 thousand tons in 2005 to 21 thousand tons in 2017 [10], accompanied by a trend of species miniaturization [22]. The present extensive capturing capability of the fishing gears with small mesh sizes and the overloaded fishing efforts not only captured a large number of immature individuals [12,58] but also ruined the fish habitats [14]. Under this scenario, urgent and effective countermeasures should be deployed so as to prevent further resource degradation or even species extinction in the Min River Estuary. To relieve the pressure put on the stocks, the most basic but very effective step by using larger-sized mesh gears should be suggested to allow individuals to reproduce at least once before being caught. Furthermore, more specific and delicate measures including closed fishing systems (i.e., “summer closed fishing”) and establishment of protected areas should be effectively and strictly executed.
5. Conclusions
In this paper, LBB was used to evaluate the exploitation status of seven dominant fish species in the Min River Estuary. LBB successfully classified these fishes into three categories: healthy stocks, including S. ruconius, C. mystus, and H. nehereus, with B/Bmsy between 1.30 and 1.90; overfished stocks, including A. hexanema and C. abbreviates, with B/Bmsy between 0.68 and 0.79; and collapsed stocks, including C. lucidus and P. sextarius, with B/Bmsy between 0.03 and 0.21. The Lc_opt estimated by LBB provided references for the exploitation and stock recovery of these species. Correspondingly, management measures, such as reducing fishing intensity, cutting down the number of fishing boats, and limiting fishing time, should be considered for fisheries sustainability.
Supplementary Materials
The following are available online at https://www.mdpi.com/2073-4441/12/12/3390/s1, Table S1: The length frequency data of seven dominant fishes in the Min River Estuary.
Author Contributions
Conceptualization, L.W. and B.K.; formal analysis, L.W.; methodology, L.W.; software, Y.L.; writing—original draft preparation, L.W.; writing—review and editing, L.L., Y.X. and B.K.; validation, B.K. All authors have read and agreed to the published version of the manuscript.
Funding
This study was supported by the National Nature Science Foundation of China (No. 41976091), the Fundamental Research Funds for the Central Universities (201964002), and the National Program on Global Change and Air-Sea Interaction (GASI-02-PAC-YDaut).
Conflicts of Interest
The authors declare no conflict of interest.
References
- Watson, R.; Pauly, D. Systematic distortions in world fisheries catch trends. Nature 2001, 414, 534–536. [Google Scholar] [CrossRef]
- Froese, R.; Winker, H.; Coro, G.; Demirel, N.; Tsikliras, A.C.; Dimarchopoulou, D.; Scarcella, G.; Quaas, M.; Matz-Lück, N. Status and rebuilding of European fisheries. Mar. Policy 2018, 93, 159–170. [Google Scholar] [CrossRef]
- Free, C.M.; Jensen, O.P.; Wiedenmann, J.; Deroba, J.J. The refined ORCS approach: A catch-based method for estimating stock status and catch limits for data-poor fish stocks. Fish. Res. 2017, 193, 60–70. [Google Scholar] [CrossRef]
- Martell, S.; Froese, R. A simple method for estimating MSY from catch and resilience. Fish Fish. 2013, 14, 504–514. [Google Scholar] [CrossRef]
- Zhou, S.; Punt, A.E.; Ye, Y.; Ellis, N.; Dichmont, C.M.; Haddon, M.; Smith, D.C.; Smith, A.D. Estimating stock depletion level from patterns of catch history. Fish Fish. 2017, 18, 742–751. [Google Scholar] [CrossRef] [Green Version]
- Froese, R.; Demirel, N.; Coro, G.; Kleisner, K.M.; Winker, H. Estimating fisheries reference points from catch and resilience. Fish Fish. 2017, 18, 506–526. [Google Scholar] [CrossRef] [Green Version]
- Thorson, J.T.; Cope, J.M. Catch curve stock-reduction analysis: An alternative solution to the catch equations. Fish. Res. 2015, 171, 33–41. [Google Scholar] [CrossRef]
- Froese, R.; Winker, H.; Coro, G.; Demirel, N.; Tsikliras, A.C.; Dimarchopoulou, D.; Scarcella, G.; Probst, W.N.; Dureuil, M.; Pauly, D. A new approach for estimating stock status from length frequency data. ICES J. Mar. Sci. 2018, 75, 2004–2015. [Google Scholar] [CrossRef]
- Froese, R.; Winker, H.; Coro, G.; Demirel, N.; Tsikliras, A.C.; Dimarchopoulou, D.; Scarcella, G.; Probst, W.N.; Dureuil, M.; Pauly, D. On the pile-up effect and priors for Linf and M/K: Response to a comment by Hordyk et al. on “A new approach for estimating stock status from length frequency data”. ICES J. Mar. Sci. 2019, 76, 461–465. [Google Scholar] [CrossRef]
- Ministry of Agriculture of China. China Fishery Statistical Yearbook; China Agriculture Press: Beijing, China, 2005–2017. [Google Scholar]
- FAO. Fishery and Aquaculture Statistics; Food and Agriculture Organization of the United Nation: Rome, Italy, 2016. [Google Scholar]
- Zhang, W.; Liu, M.; Sadovy De Mitcheson, Y.; Cao, L.; Leadbitter, D.; Newton, R.; Little, D.C.; Li, S.; Yang, Y.; Chen, X.; et al. Fishing for feed in China: Facts, impacts and implications. Fish Fish. 2019, 21, 47–62. [Google Scholar] [CrossRef]
- Pauly, D.; Christensen, V.; Dalsgaard, J.; Froese, R.; Torres, F.J. Fishing down marine food webs. Science 1998, 279, 860–863. [Google Scholar] [CrossRef]
- Zhai, L.; Pauly, D. Yield-per-recruit, utility-per-recruit, and relative biomass of 21 exploited fish species in China’s coastal seas. Front. Mar. Sci. 2019, 6. [Google Scholar] [CrossRef]
- Li, J.; Kang, B. Dominant species drive seasonal dynamics of the fish community in the Min estuary, China. Oceanol. Hydrobiol. Stud. 2020, 49, 34–48. [Google Scholar] [CrossRef]
- Wang, J.Q.; Huang, L.M.; Li, J.; Zhang, Y.Z.; Zhu, G.P.; Chen, X.J. Length-weight relationships of 45 fish species in the Min River Estuary, East China Sea. J. Appl. Ichthyol. 2016, 32, 131–133. [Google Scholar] [CrossRef]
- Zhu, D. Chinese Water Dictionary, 1st ed.; Qingdao Publishing Press: Qingdao, China, 2007; pp. 457–464. [Google Scholar]
- Feng, C.; He, X.B.; Zhao, C.X.; Li, J.; Kang, B. Functional diversity of fishes in the Minjiang Estuary, Southeast China. Chin. J. Appl. Ecol. 2019, 30, 3589–3595. (In Chinese) [Google Scholar]
- Xu, Z.L. Comparison of fish density between the Minjiang Estuary and Xinghua Bay during spring and summer. J. Fish. China 2010, 34, 1395–1403. (In Chinese) [Google Scholar]
- He, X.B.; Li, J.; Shen, C.; Shi, Y. The breadth and overlap of ecological niche of major fish species in the Minjiang River Estuary, China. Chin. J. Appl. Ecol. 2018, 29, 3085–3092. (In Chinese) [Google Scholar]
- He, X.; Li, J.; Shen, C.; Shi, Y.; Feng, C.; Guo, J.; Yan, Y.; Kang, B. Length-weight relationship and population dynamics of Bombay duck (Harpadon nehereus) in the Min River Estuary, East China Sea. Thalass. Int. J. Mar. Sci. 2018, 35, 253–261. [Google Scholar] [CrossRef]
- Guo, J.H. Research on Growth Characteristic and Resource Dynamic of Four Dominant Fishes in the Min River Estuary, East China Sea. Master’s Thesis, Jimei University, Xiamen, China, 2019. [Google Scholar]
- Huang, L.M. Study on Fishery Resources and Fish Diversity in Minjiang River Estuary and Jiulong River Estuary and Their Adjacent Waters. Ph.D. Thesis, Ocean University of China, Qingdao, China, 2011. [Google Scholar]
- The Editorial Board of Fujian Local Chronicles. Fujian Province Annals: Water Conservancy; China Social Sciences Publishing House: Beijing, China, 1999. [Google Scholar]
- Fishes of Fujian Province Editorial Committee. The Fishes of Fujian Province; Fujian Science and Technology Press: Fuzhou, China, 1984. [Google Scholar]
- Pianka, E.R. Ecology of the Agamid lizard Amphibolurus isolepis in Western Australia. Copeia 1971, 527–536. [Google Scholar] [CrossRef]
- Cheng, J.S. The structure and diversity of demersal fish communities in winter in the East China Sea and the Yellow Sea. Mar. Fish. Res. 2000, 21, 1–8. (In Chinese) [Google Scholar]
- Mildenberger, T.K.; Taylor, M.H.; Wolff, M. TropFishR: An R package for fisheries analysis with length-frequency data. Methods Ecol. Evol. 2017, 8, 1520–1527. [Google Scholar] [CrossRef] [Green Version]
- R Development Core Team. R: A Language and Environment for Statistical Computing; R Foundation for Statistical Computing: Vienna, Austria, 2020. [Google Scholar]
- Baldé, B.S.; Fall, M.; Kantoussan, J.; Sow, F.N.; Diouf, M.; Brehmer, P. Fish-length based indicators for improved management of the sardinella fisheries in Senegal. Reg. Stud. Mar. Sci. 2019, 31, 100801. [Google Scholar] [CrossRef]
- Von Bertalanffy, L. A quantitative theory of organic growth (inquiries on growth laws. II). Hum. Biol. 1938, 10, 181–213. [Google Scholar]
- Holt, S.J. The evaluation of fisheries resources by the dynamic analysis stocks, and notes on the time factors involved. Int. Comm. Northwest Atl. Fish. Spec. Publ. 1958, 1, 77–95. [Google Scholar]
- Froese, R.; Winker, H.; Gascuel, D.; Sumaila, U.R.; Pauly, D. Minimizing the impact of fishing. Fish Fish. 2016, 17, 785–802. [Google Scholar] [CrossRef]
- Beverton, R.J.; Holt, S.J. Manual of Methods for Fish Stock Assessment: Part 2-Tables of Yield Functions; (Fisheries Report No. 38); FAO: Rome, Italy, 1966. [Google Scholar]
- Xue, L.J.; Zhou, Y.D.; Xu, K.D.; Zhang, H.D. Estimation of biological parameter, biomass, sustaining yield for Coilia mystus in the offshore of Zhoushan. J. Fujian Fish. 2011, 33, 18–23. (In Chinese) [Google Scholar]
- Masuda, H.; Amaoka, K.; Arage, C.; Uyeno, T.; Yoshino, T. The Fishes of the Japanese Archipelago; Tokai University Press: Tokyo, Japan, 1984; p. 437. [Google Scholar]
- Wang, L.J.; You, F.; Wang, Q.X.; Wu, Z.H.; Liu, M.X. Length-weight and length-length relationships of 11 fish species from Zhimai River estuary, China. J. Appl. Ichthyol. 2015, 31, 435–436. [Google Scholar] [CrossRef]
- James, P.S.; Fisher, W.; Bianchi, G. FAO Species Identification Sheets for Fishery Purposes; Western Indian Ocean (Fishing Area 51); FAO: Rome, Italy, 1984; Volume 2. [Google Scholar]
- Sommer, C.; Schneider, W.; Poutiers, J.M. FAO Species Identification Field Guide for Fishery Purposes. The Living Marine Resources of Somalia; FAO: Rome, Italy, 1996; Volume 376. [Google Scholar]
- Palomares, M.L.D.; Froese, R.; Derrick, B.; Noel, S.L.; Tsui, G.; Woroniak, J.; Pauly, D. A Preliminary Global Assessment of the Status of Exploited Marine Fish and Invertebrate Populations. 2018. Available online: https://oceanrep.geomar.de/43547/1/OceanaReportFinal.pdf (accessed on 10 September 2020).
- Zhang, C.; Seo, Y.; Kang, H.; Lim, J. Exploitable carrying capacity and potential biomass yield of sectors in the East China Sea, Yellow Sea, and East Sea/Sea of Japan large marine ecosystems. Deep Sea Res. Top. Stud. Oceanogr. 2019, 163, 16–28. [Google Scholar] [CrossRef]
- Kang, B.; Liu, M.; Huang, X.; Li, J.; Yan, Y.; Han, C.; Chen, S. Fisheries in Chinese seas: What can we learn from controversial official fisheries statistics? Rev. Fish Biol. Fish. 2018, 28, 503–519. [Google Scholar] [CrossRef]
- Shan, X.; Sun, P.; Jin, X.; Li, X.; Dai, F. Long-term changes in fish assemblage structure in the Yellow River Estuary ecosystem, China. Mar. Coast. Fish. 2013, 5, 65–78. [Google Scholar] [CrossRef]
- Cheng, J.S.; Yu, L.F. The change of structure and diversity of demersal fish communities in the Yellow Sea and East China Sea in winter. J. Fish. China 2004, 1, 29–35. (In Chinese) [Google Scholar]
- Li, Z.; Shan, X.; Jin, X.; Dai, F. Long-term variations in body length and age at maturity of the small yellow croaker (Larimichthys polyactis Bleeker, 1877) in the Bohai Sea and the Yellow Sea, China. Fish. Res. 2011, 110, 67–74. [Google Scholar] [CrossRef]
- Guan, W.B.; Chen, H.H.; He, W.H. Reproductive characteristics and condition status of Coilia mystus (Linnaeus) in the Changjiang River Estuary. Process Fish. Sci. 2011, 32, 1–9. [Google Scholar]
- Xie, Y.; Huang, L.M.; Li, J.; Li, W.W.; Zhang, Y.Z. Resource assessment of Clupeiformes fishes in Fujian coastal waters. Mar. Fish. 2012, 34, 285–294. (In Chinese) [Google Scholar]
- Ghosh, S. Fishery, reproductive biology and diet characteristics of Bombay duck Harpadon nehereus from the Saurashtra coast. Indian J. Mar. Sci. 2014, 43, 418–426. [Google Scholar]
- Bapat, S.; Banerji, S.; Bal, D. Observations on the biology of Harpodon nehereus (Hamilton). J. Zool. Soc. India 1951, 3, 341–356. [Google Scholar]
- Bapat, S.V. The Bombay duck, Harpodon nehereus (Ham.). Bull. Cent. Mar. Fish. Res. Inst. 1970, 21, 1–87. [Google Scholar]
- Laga, A.; Affandi, R.; Muchsin, I.; Kamal, M.M. Growth and exploitation rate of the Bombay duck (Harpodon nehereus Hamilton, 1822) (Fish: Synodontidae) in Tarakan Island waters, Indonesia. Int. J. Sci. Basic Appl. Res. 2015, 22, 341–353. [Google Scholar]
- Lin, L.S. Spatial distribution and environmental characteristics of Harpodon nehereus in the East China Sea region. J. Shanghai Ocean Univ. 2009, 18, 66–71. (In Chinese) [Google Scholar]
- Luo, H.D. Study of Main Biology Character and Analysis of Resources Status on the Harpodon nehereus. Master’s Thesis, Zhejiang Ocean University, Zhoushan, China, 2012. [Google Scholar]
- Alverson, D.L.; Pereyra, W.T. Demersal fish explorations in the northeastern Pacific Ocean-an evaluation of exploratory fishing methods and analytical approaches to stock size and yield forecasts. J. Fish. Res. Can. 1969, 26, 1985–2001. [Google Scholar] [CrossRef]
- Froese, R.; Winker, H.; Gascuel, D. Size still matters. A response to Svedäng (2013): Size matters: Ne quid nimis. Fish. Res. 2015, 164, 329–330. [Google Scholar] [CrossRef]
- McConnaughey, R.A.; Hiddink, J.G.; Jennings, S.; Pitcher, C.R.; Kaiser, M.J.; Suuronen, P.; Sciberras, M.; Rijnsdorp, A.D.; Collie, J.S.; Mazor, T.; et al. Choosing best practices for managing impacts of trawl fishing on seabed habitats and biota. Fish Fish. 2019, 21, 319–337. [Google Scholar] [CrossRef] [Green Version]
- Ma, C.; Ma, H.; Ma, L.; Cui, H.; Ma, Q. Development and characterization of 19 microsatellite markers for Collichthys lucidus. Conserv. Genet. Resour. 2011, 3, 503–506. [Google Scholar] [CrossRef]
- Liang, C.; Pauly, D. Growth and mortality of exploited fishes in China’s coastal seas and their uses for yield-per-recruit analyses. J. Appl. Ichthyol. 2017, 33, 746–756. [Google Scholar] [CrossRef]
Figure 1.
Fish sampling stations in the Min River Estuary, the biggest estuary in southeastern China.
Figure 1.
Fish sampling stations in the Min River Estuary, the biggest estuary in southeastern China.
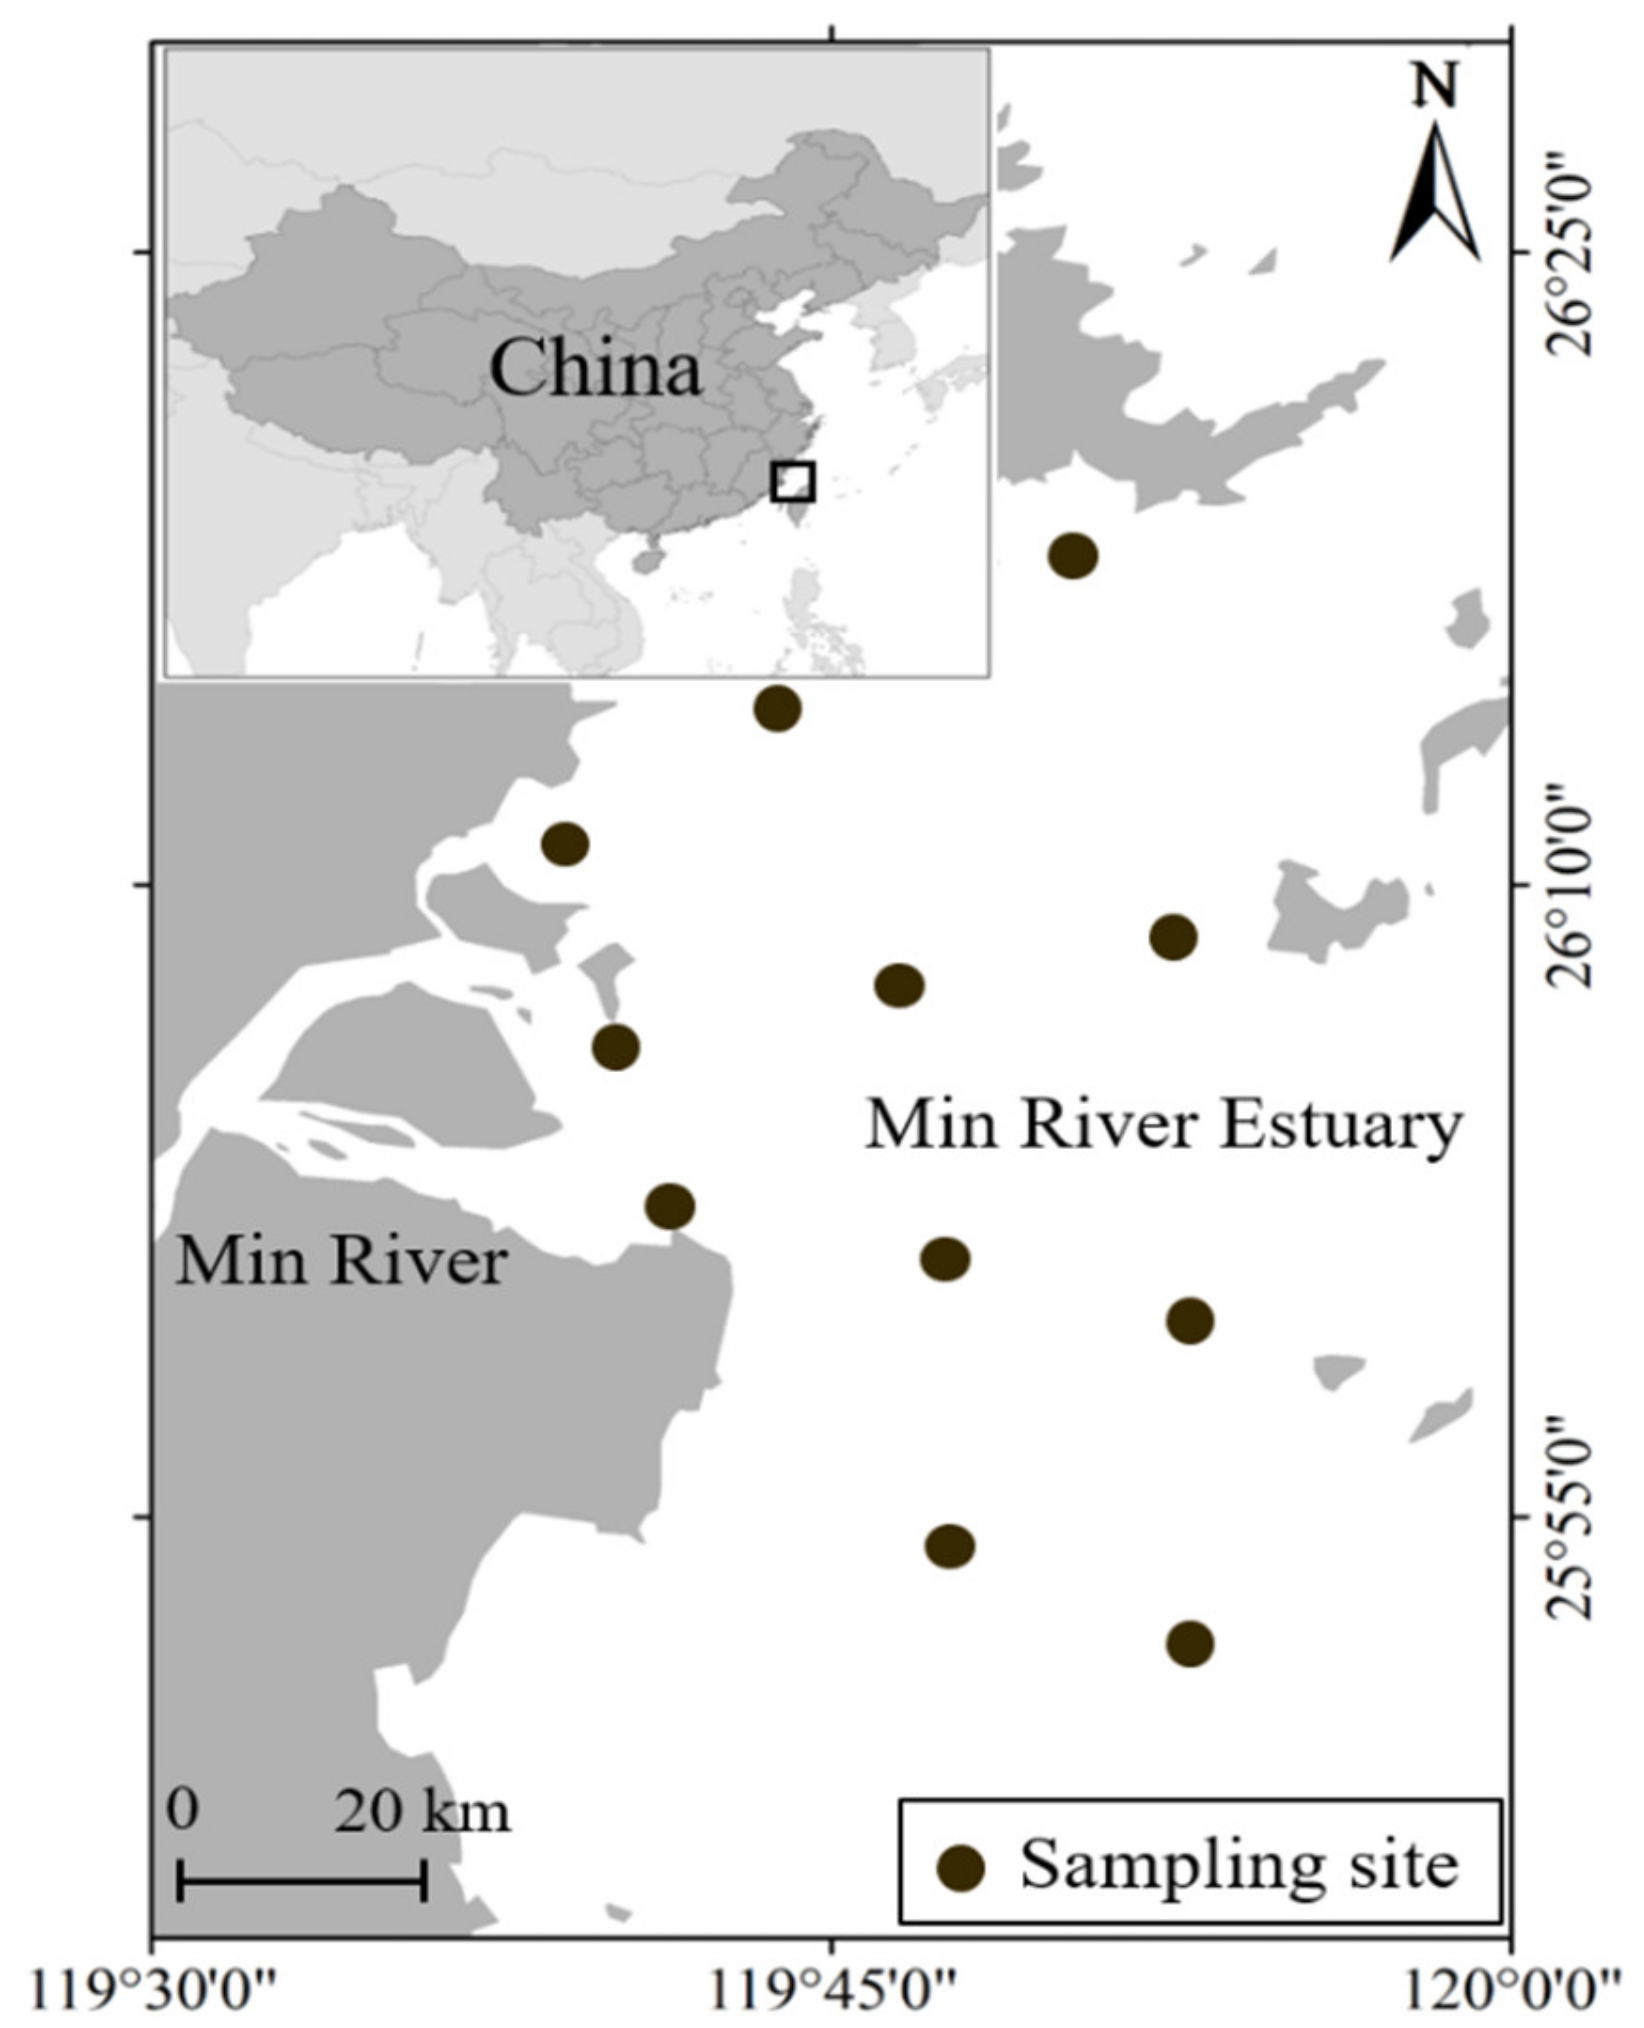
Figure 2.
Probability density curve of length distribution for seven dominant fishes in the Min River Estuary during 2015–2017.
Figure 2.
Probability density curve of length distribution for seven dominant fishes in the Min River Estuary during 2015–2017.

Figure 3.
The current exploitation status of seven dominant fish species in the Min River Estuary in 2015–2017. “B/B0” signifies the ratio of current biomass to the unfished biomass, while “B/Bmsy” designates the ratio of the current biomass to the biomass under the condition of maximum sustainable yields. The horizontal black dotted line at y = 1 represents the situation of B = Bmsy. Symbol “×” represents the optimum B/B0 when F = M and Lc = Lc_opt for specific species.
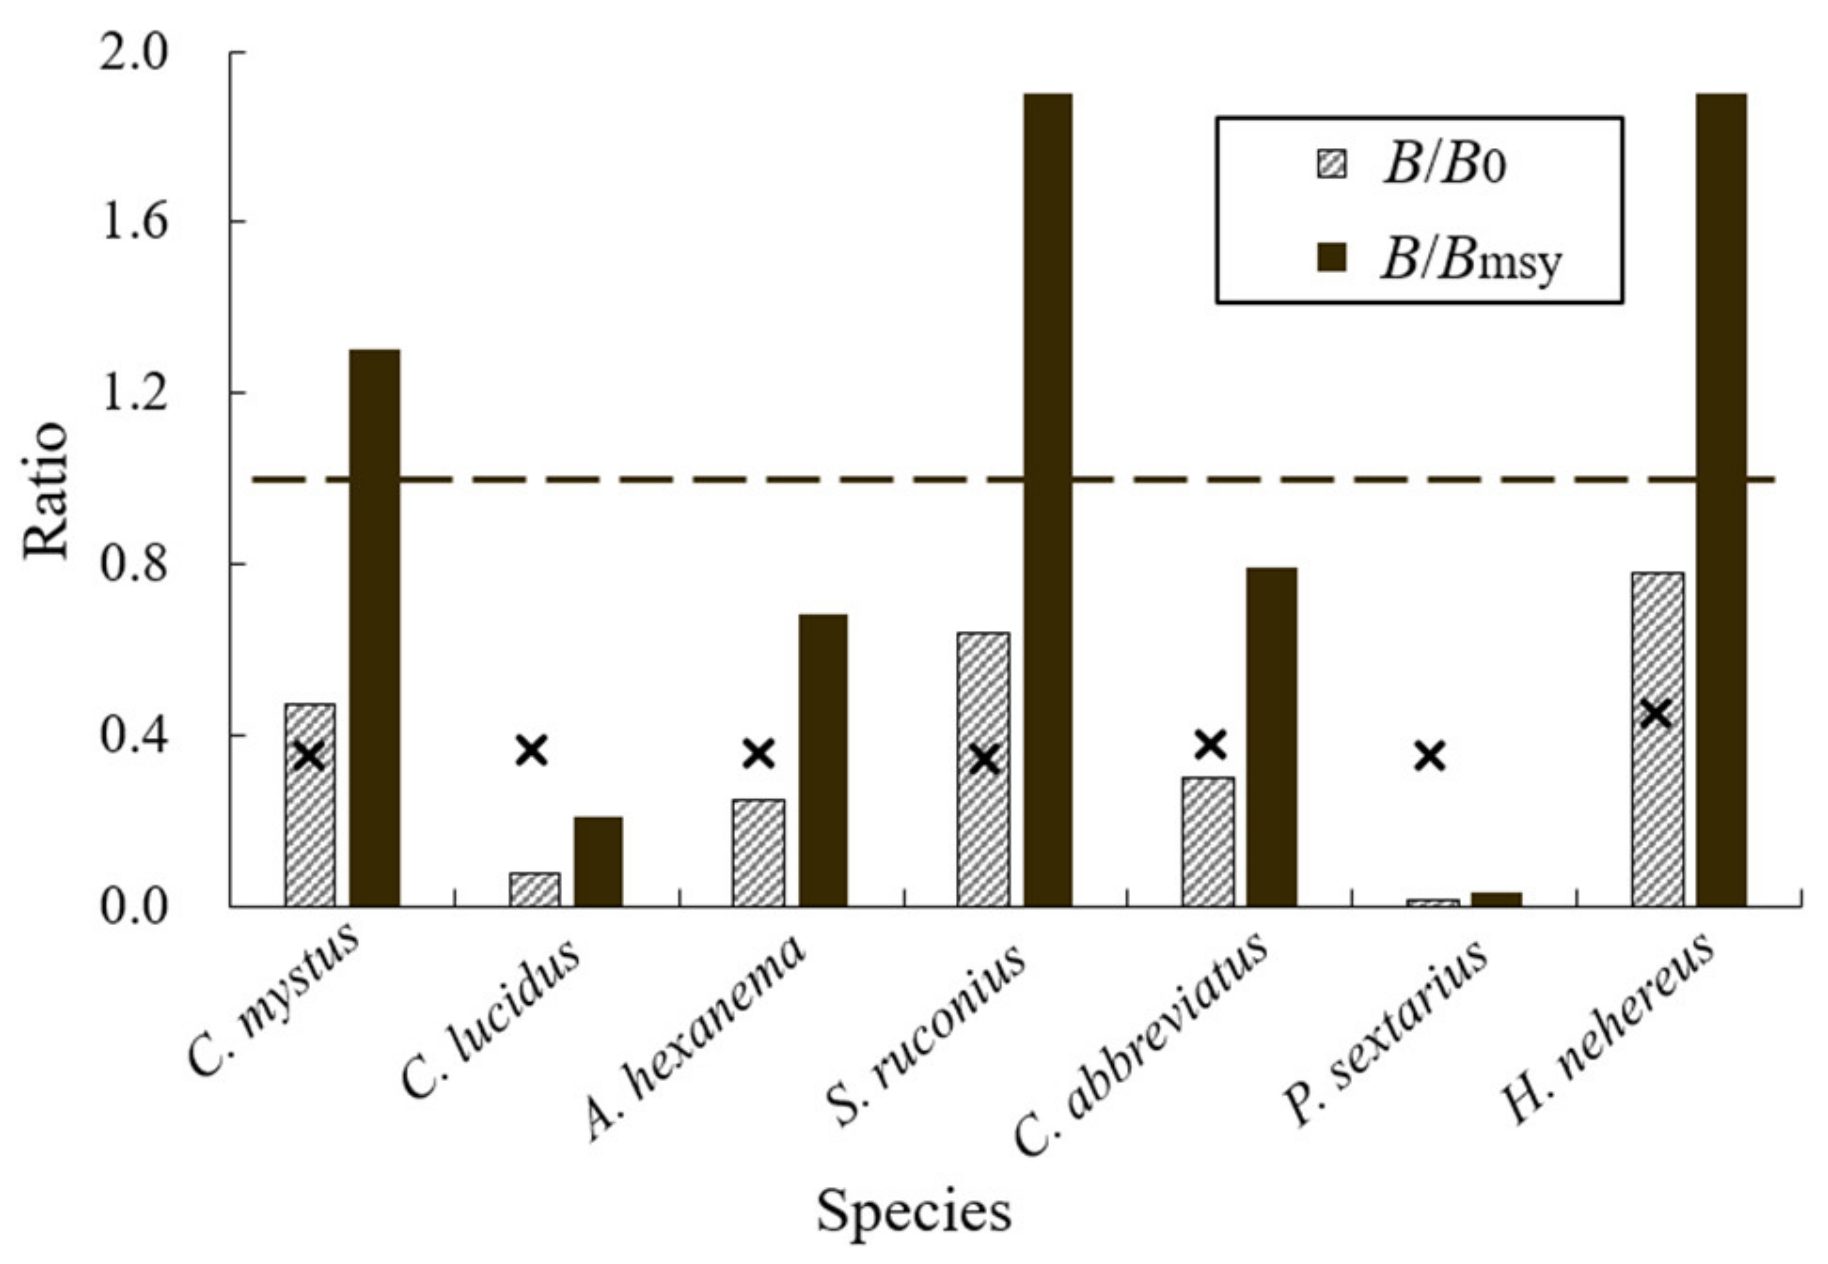
Figure 4.
LBB modeling for the surrogate species. L∞ represents the asymptotic length, Lc signifies the length at first capture, Lopt represents the length where the unexploited cohort biomass was maximized, and Z/K represents the ratio of total mortality to the somatic growth rate. The relative length frequencies in the left panel were used to estimate the prior values of L∞, Z/K, and Lc. The curves in the right panel were fitted to the LBB master equation, which provided the information of Lopt.

Table 1.
The index of relative importance (IRI) for seven dominant fish species in the Min River Estuary in different seasons in 2015.
Table 1.
The index of relative importance (IRI) for seven dominant fish species in the Min River Estuary in different seasons in 2015.
| Species | Spring | Summer | Autumn | Winter |
|---|---|---|---|---|
| Coilia mystus | 516.0 | 6.9 | 506.2 | 6086.6 |
| Collichthys lucidus | 709.5 | 5.7 | 579.1 | 3693.1 |
| Amblychaeturichthys hexanema | 867.5 | 12.0 | 703.4 | 506.2 |
| Secutor ruconius | 1866.3 | 831.1 | 224.1 | 231.2 |
| Cynoglossus abbreviatus | 1440.1 | 223.8 | 334.3 | 1878.5 |
| Polydactylus sextarius | - | 6502.4 | 3208.8 | - |
| Harpodon nehereus | 155.2 | 2222.5 | 4211.9 | 2413.6 |
Note: Values in bold and italic represent the dominant species with IRI > 500; the symbol “-” means absence of corresponding species.
Table 2.
Descriptive variables concerning the exploitation of seven dominant fish species in the Min River Estuary in 2015–2017.
Table 2.
Descriptive variables concerning the exploitation of seven dominant fish species in the Min River Estuary in 2015–2017.
| Variables | Coilia mystus | Collichthys lucidus | Amblychaeturichthys hexanema | Secutor ruconius | Cynoglossus abbreviatus | Polydactylus sextarius | Harpodon nehereus |
|---|---|---|---|---|---|---|---|
| quantity | 2104 | 1355 | 1175 | 968 | 897 | 805 | 487 |
| length range | 47–235 | 22–205 | 36–190 | 21–107 | 72–350 | 29–284 | 50–350 |
| L∞ by user (mm) | 234.0 [16,35] | 213.0 [36] | 174.0 [37] | 101.0 [38] | 329.0 [16] | 300.0 [39] | 323.0 [16,21] |
| L∞ by LBB (mm) | 239.0 | 214.0 | 180.0 | 104.0 | 323.0 | 305.0 | 314.0 |
| Lc (mm) | 147.6 | 174.0 | 83.4 | 72.0 | 117.6 | 65.0 | 156.0 |
| M/K | 1.71 | 1.42 | 1.50 | 2.07 | 1.10 | 1.30 | 1.27 |
| F/K | 1.30 | 17.00 | 2.10 | 0.95 | 1.10 | 11.00 | 0.67 |
| Z/K | 3.01 | 18.40 | 3.60 | 3.02 | 2.20 | 12.30 | 1.94 |
| F/M | 0.78 | 12.00 | 1.40 | 0.48 | 0.98 | 7.40 | 0.55 |
| E (i.e., F/Z) | 0.43 | 0.92 | 0.58 | 0.31 | 0.50 | 0.89 | 0.35 |
| Lmean (mm) | 168.0 | 185.0 | 107.0 | 77.5 | 181.0 | 127.0 | 202.0 |
| Lopt (mm) | 152.0 | 144.0 | 119.0 | 62.0 | 235.0 | 205.0 | 222.0 |
| Lmean/Lopt | 1.10 | 1.30 | 0.88 | 1.30 | 0.72 | 0.47 | 0.89 |
| Lc_opt (mm) | 123.0 | 140.0 | 103.0 | 48.0 | 196.0 | 197.0 | 174.0 |
| Lc/Lc_opt | 1.20 | 1.20 | 0.81 | 1.50 | 0.60 | 0.33 | 0.90 |
| B/B0 | 0.47 | 0.08 | 0.25 | 0.64 | 0.30 | 0.01 | 0.51 |
| B/B0 (when F = M) | 0.357 | 0.367 | 0.364 | 0.345 | 0.383 | 0.368 | 0.377 |
| B/Bmsy | 1.30 | 0.21 | 0.68 | 1.90 | 0.79 | 0.03 | 1.40 |
| Y′/R | 0.0300 | 0.0180 | 0.0440 | 0.0140 | 0.0640 | 0.0007 | 0.0480 |
| status [40] | healthy | collapsed | overfished | healthy | overfished | collapsed | healthy |
Notes: L∞, asymptotic length; Lc, length at first capture; M, natural mortality; K, growth rate; F, fishing mortality; Z, total mortality; E, exploitation rate; Lmean, the mean length of exploited stock; Lopt, the length where the unexploited cohort biomass is maximum; Lc_opt, the optimum length in first capture; B, current exploited biomass; B0, unfished biomass; Bmsy, the biomass capable of producing maximum sustainable yields; Y′/R, yield per recruit.
Publisher’s Note: MDPI stays neutral with regard to jurisdictional claims in published maps and institutional affiliations. |
© 2020 by the authors. Licensee MDPI, Basel, Switzerland. This article is an open access article distributed under the terms and conditions of the Creative Commons Attribution (CC BY) license (http://creativecommons.org/licenses/by/4.0/).
Share and Cite
MDPI and ACS Style
Wang, L.; Lin, L.; Li, Y.; Xing, Y.; Kang, B. Sustainable Exploitation of Dominant Fishes in the Largest Estuary in Southeastern China. Water 2020, 12, 3390. https://doi.org/10.3390/w12123390
AMA Style
Wang L, Lin L, Li Y, Xing Y, Kang B. Sustainable Exploitation of Dominant Fishes in the Largest Estuary in Southeastern China. Water. 2020; 12(12):3390. https://doi.org/10.3390/w12123390
Chicago/Turabian StyleWang, Linlong, Li Lin, Yuan Li, Yankuo Xing, and Bin Kang. 2020. "Sustainable Exploitation of Dominant Fishes in the Largest Estuary in Southeastern China" Water 12, no. 12: 3390. https://doi.org/10.3390/w12123390
Note that from the first issue of 2016, this journal uses article numbers instead of page numbers. See further details here.