Why Flash Floods Occur Differently across Regions? A Spatial Analysis of China


Abstract
:1. Introduction
2. Materials and Methods
2.1. Materials
2.2. Data Processing
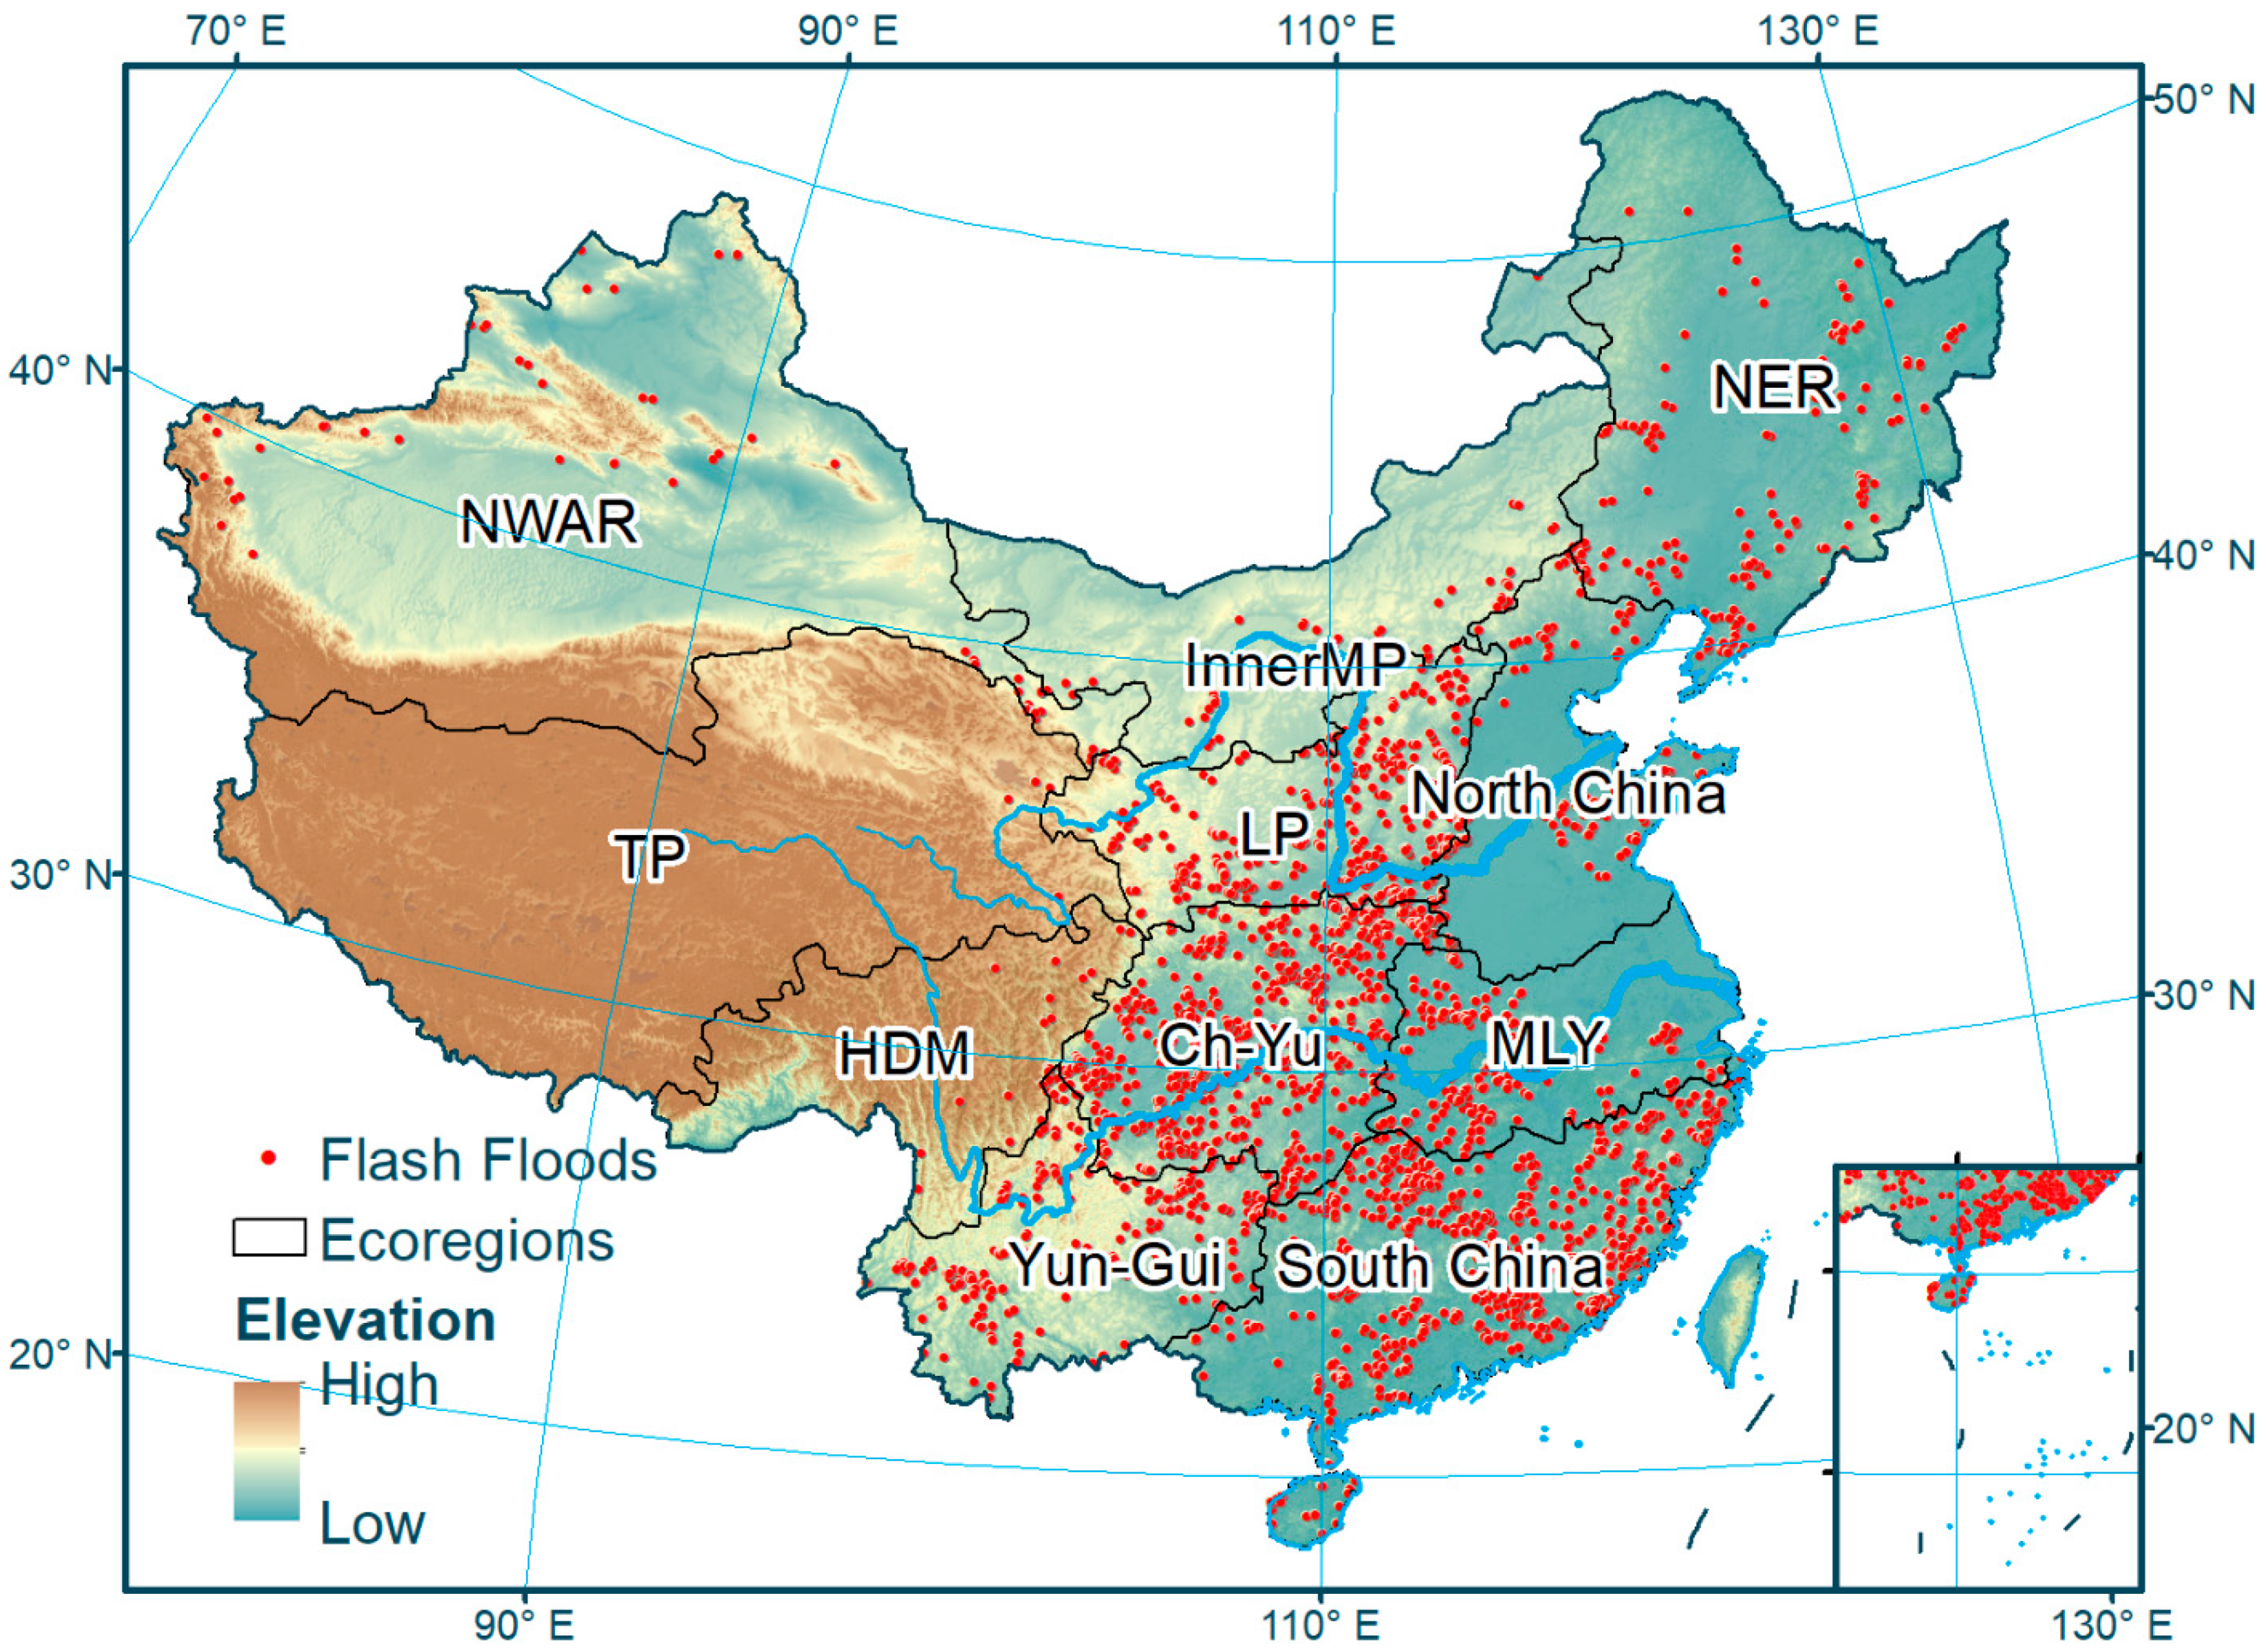
2.2.1. Flash Flood Records
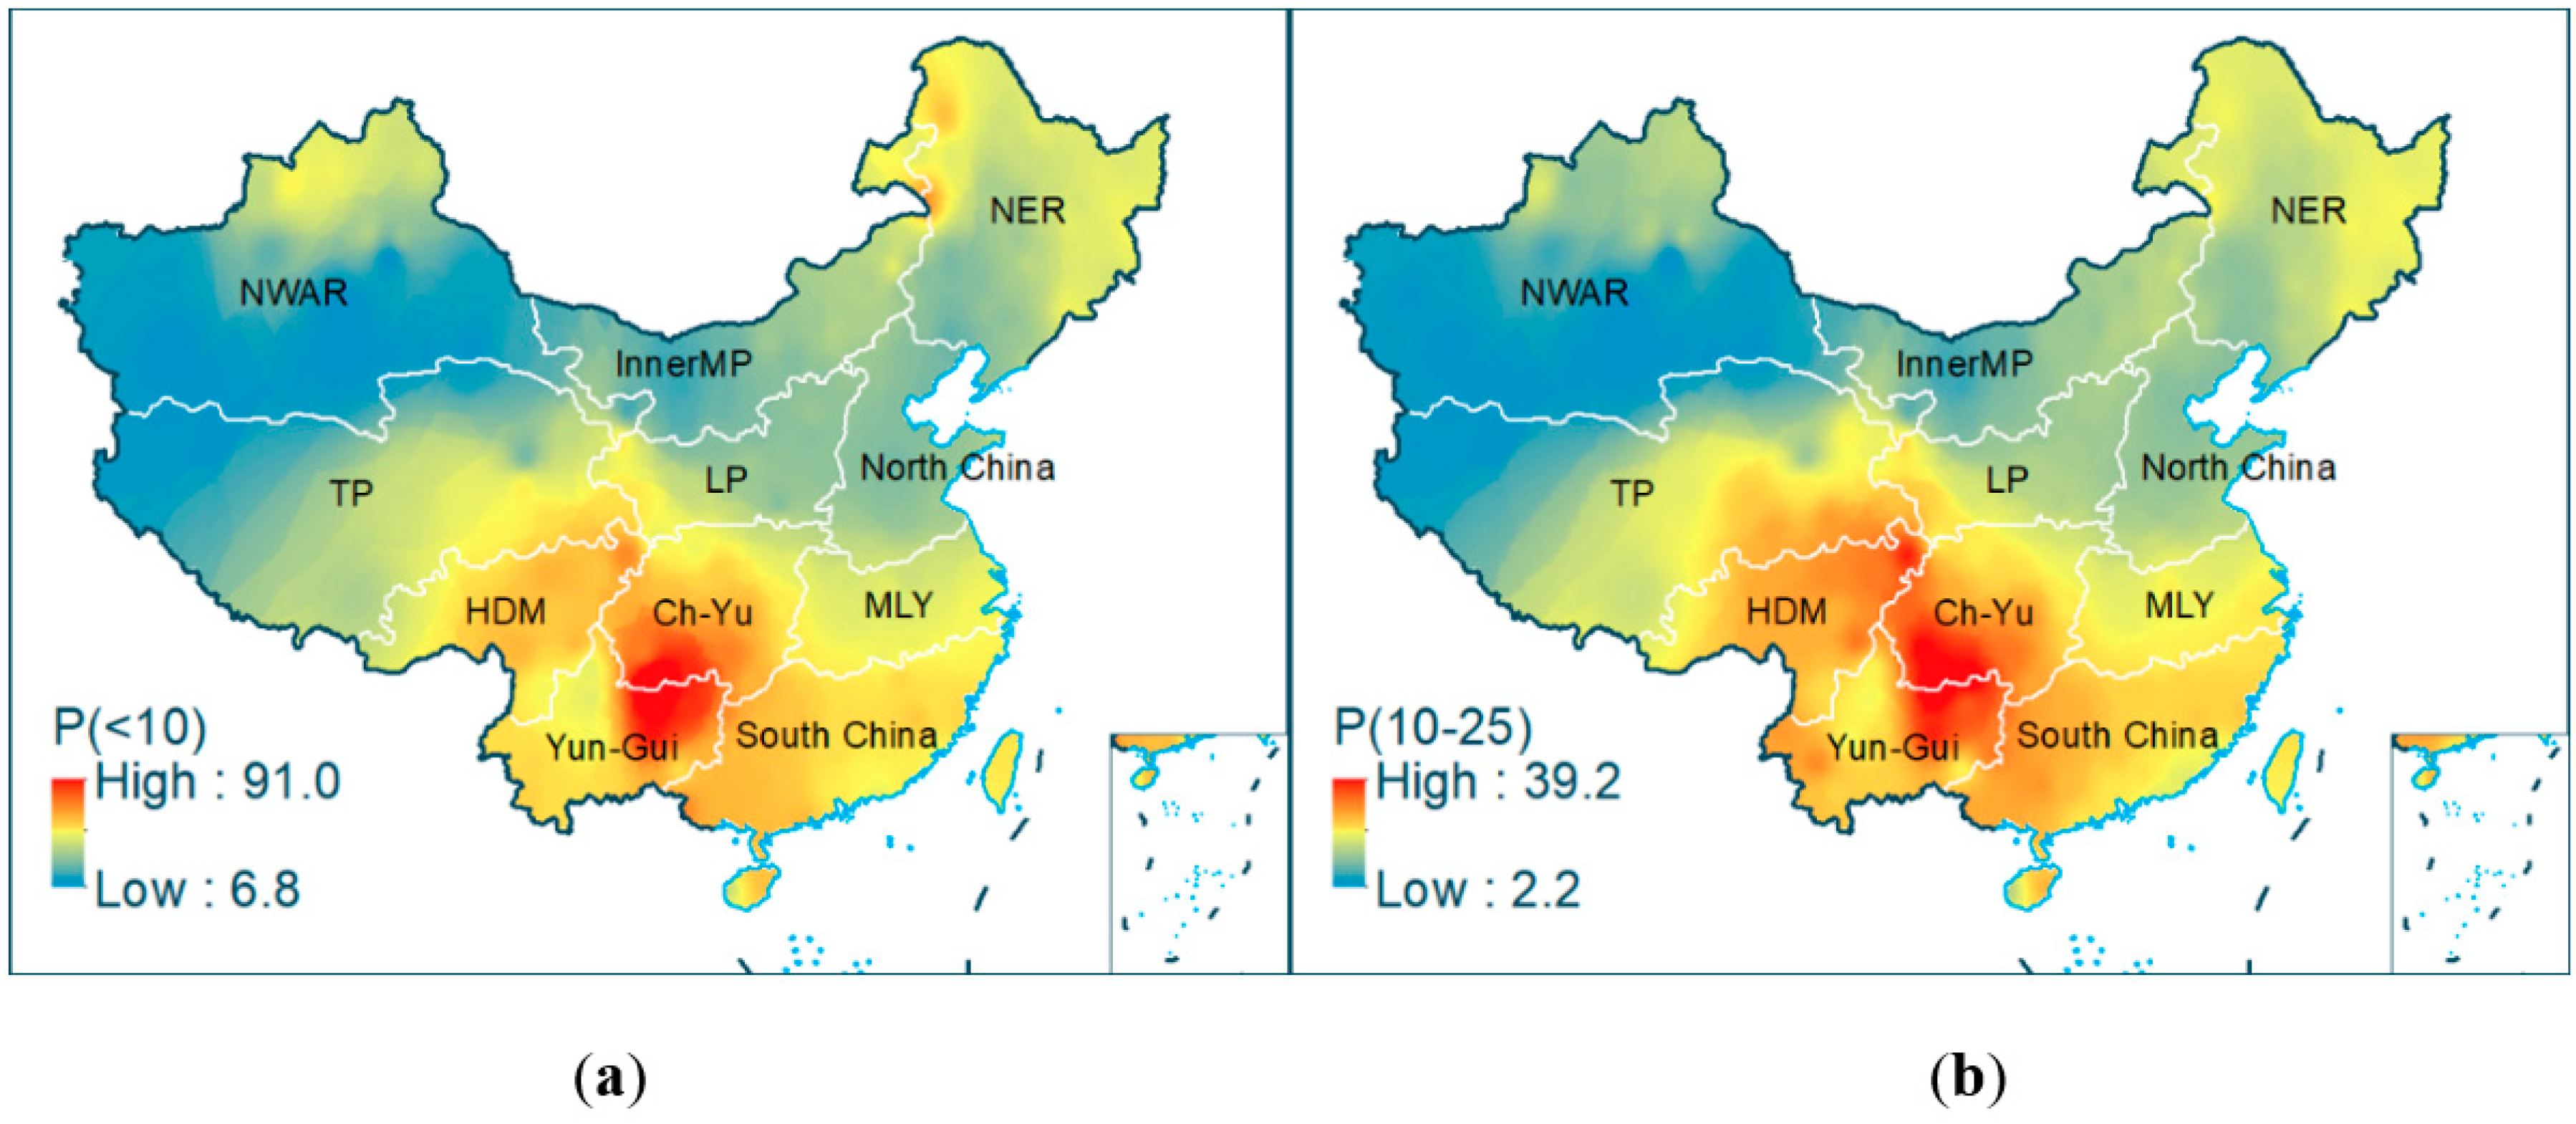
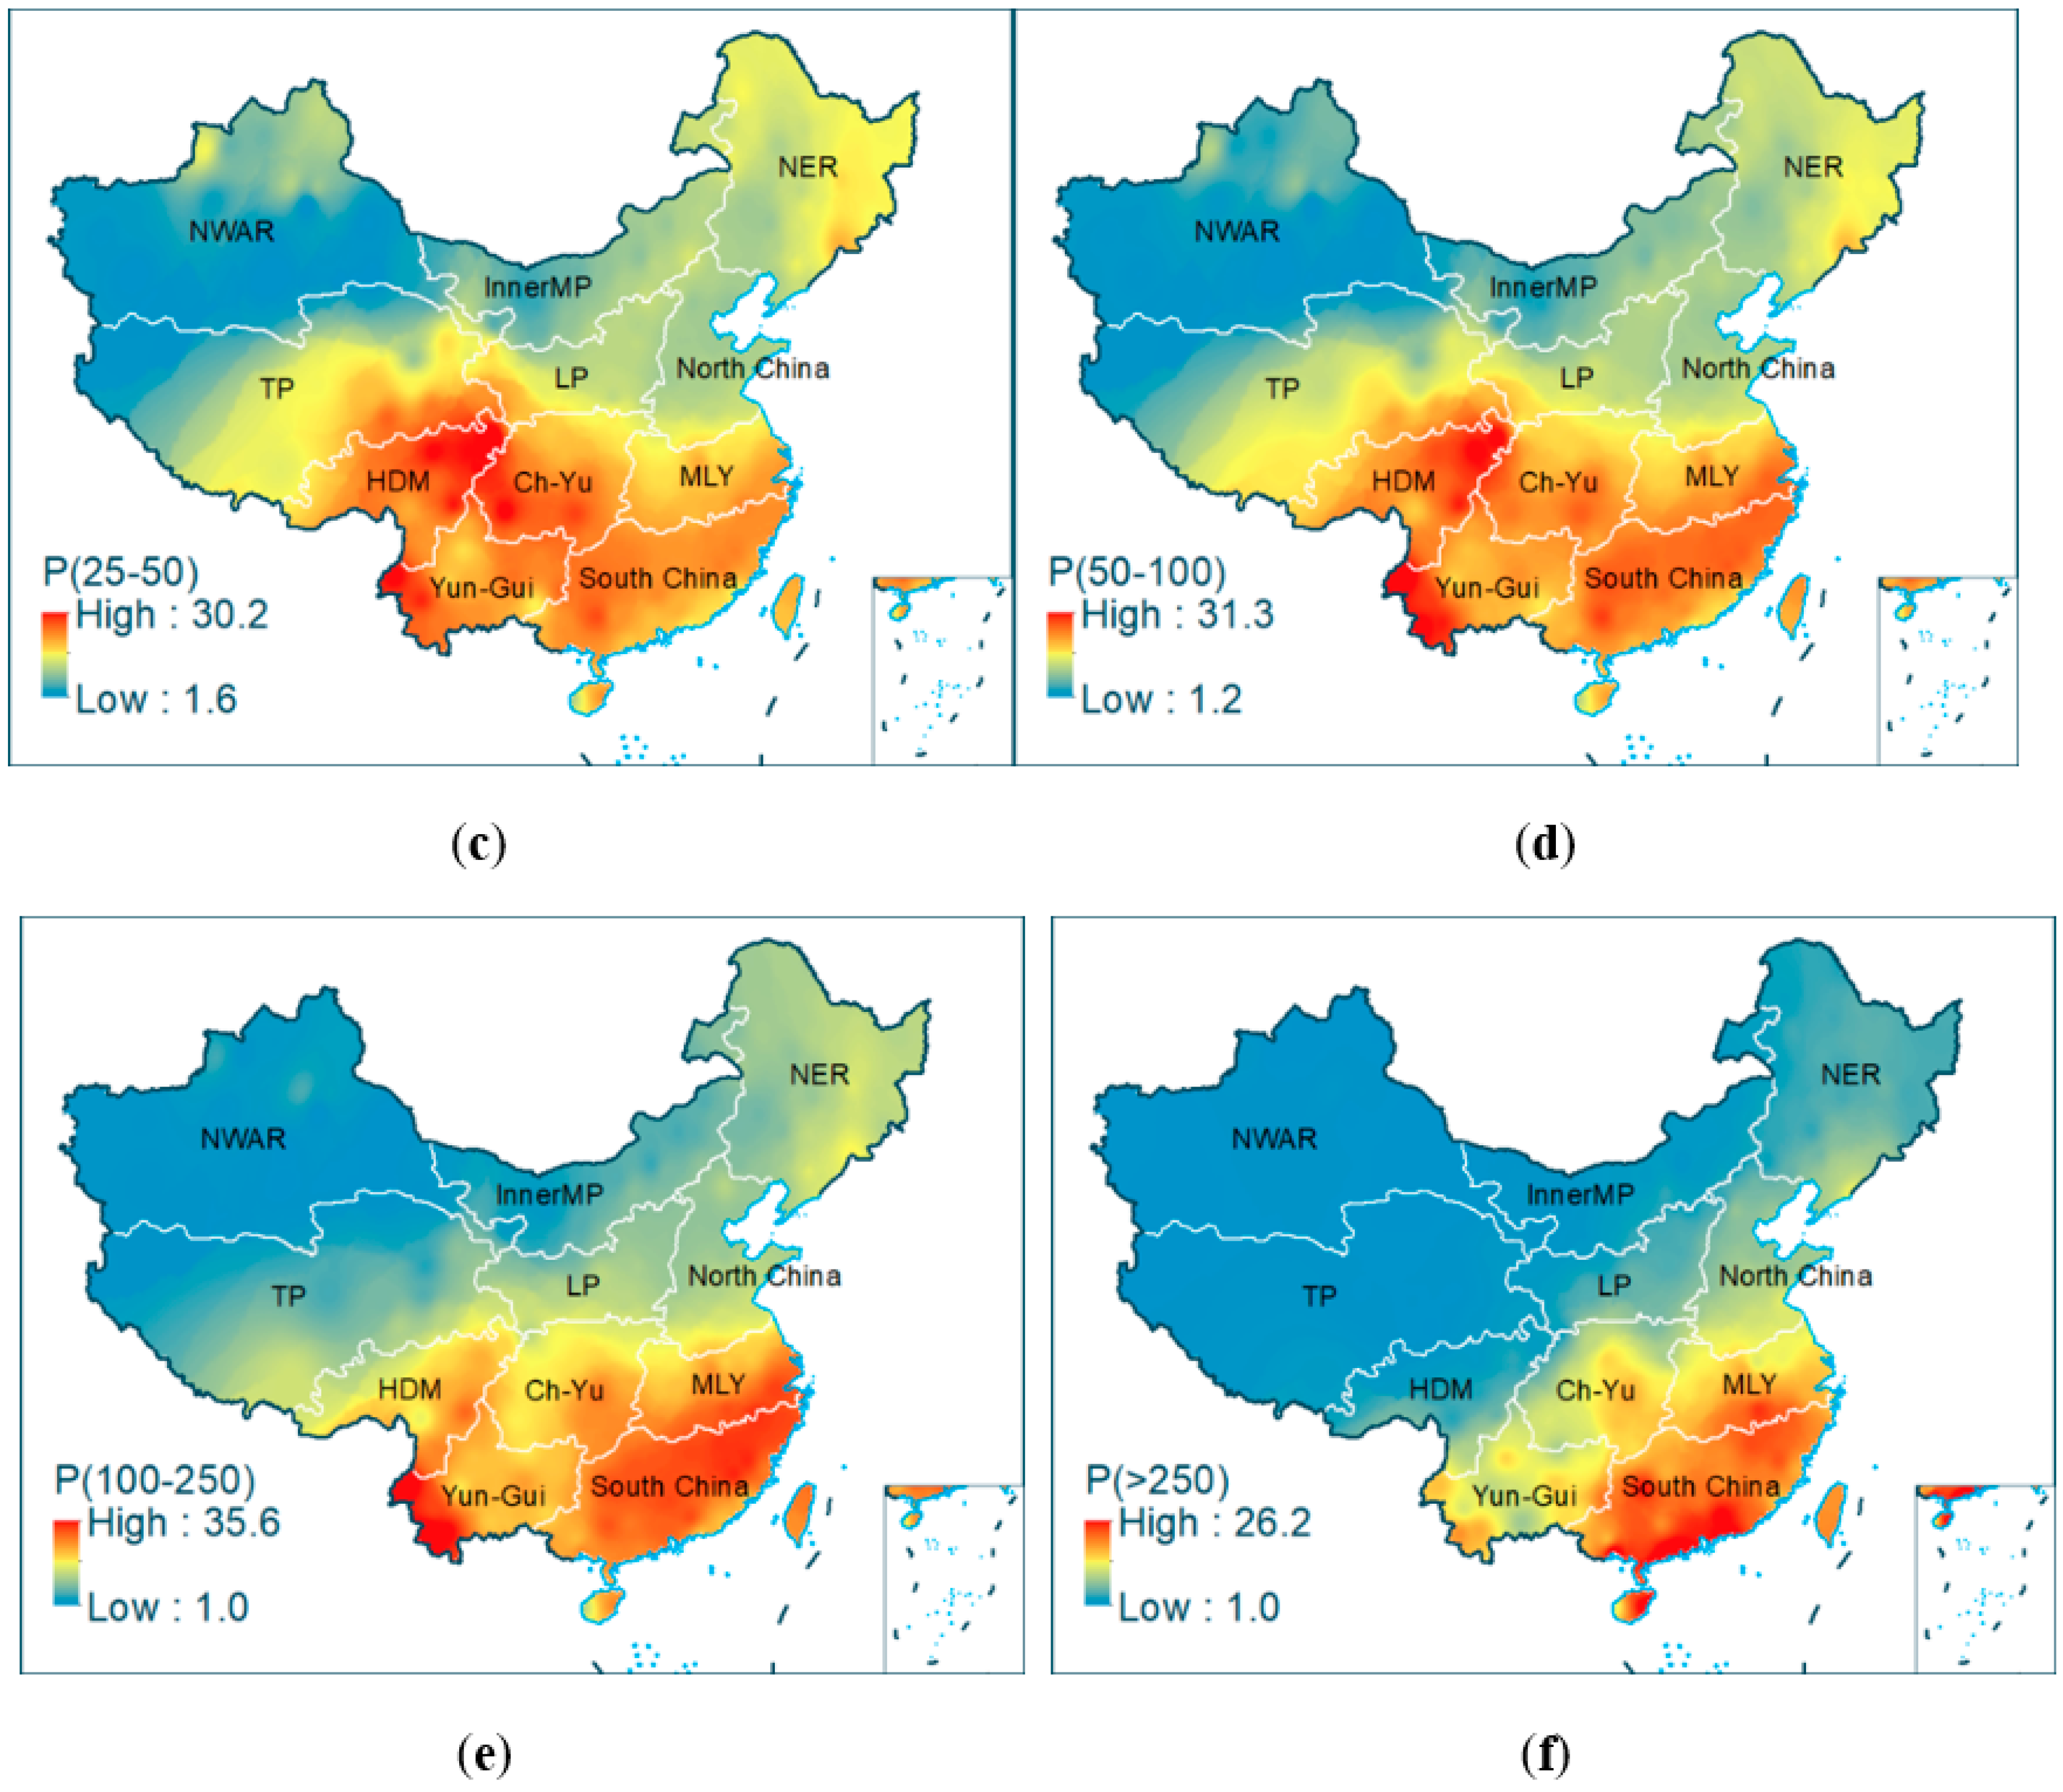
2.2.2. Processing of Precipitation Data
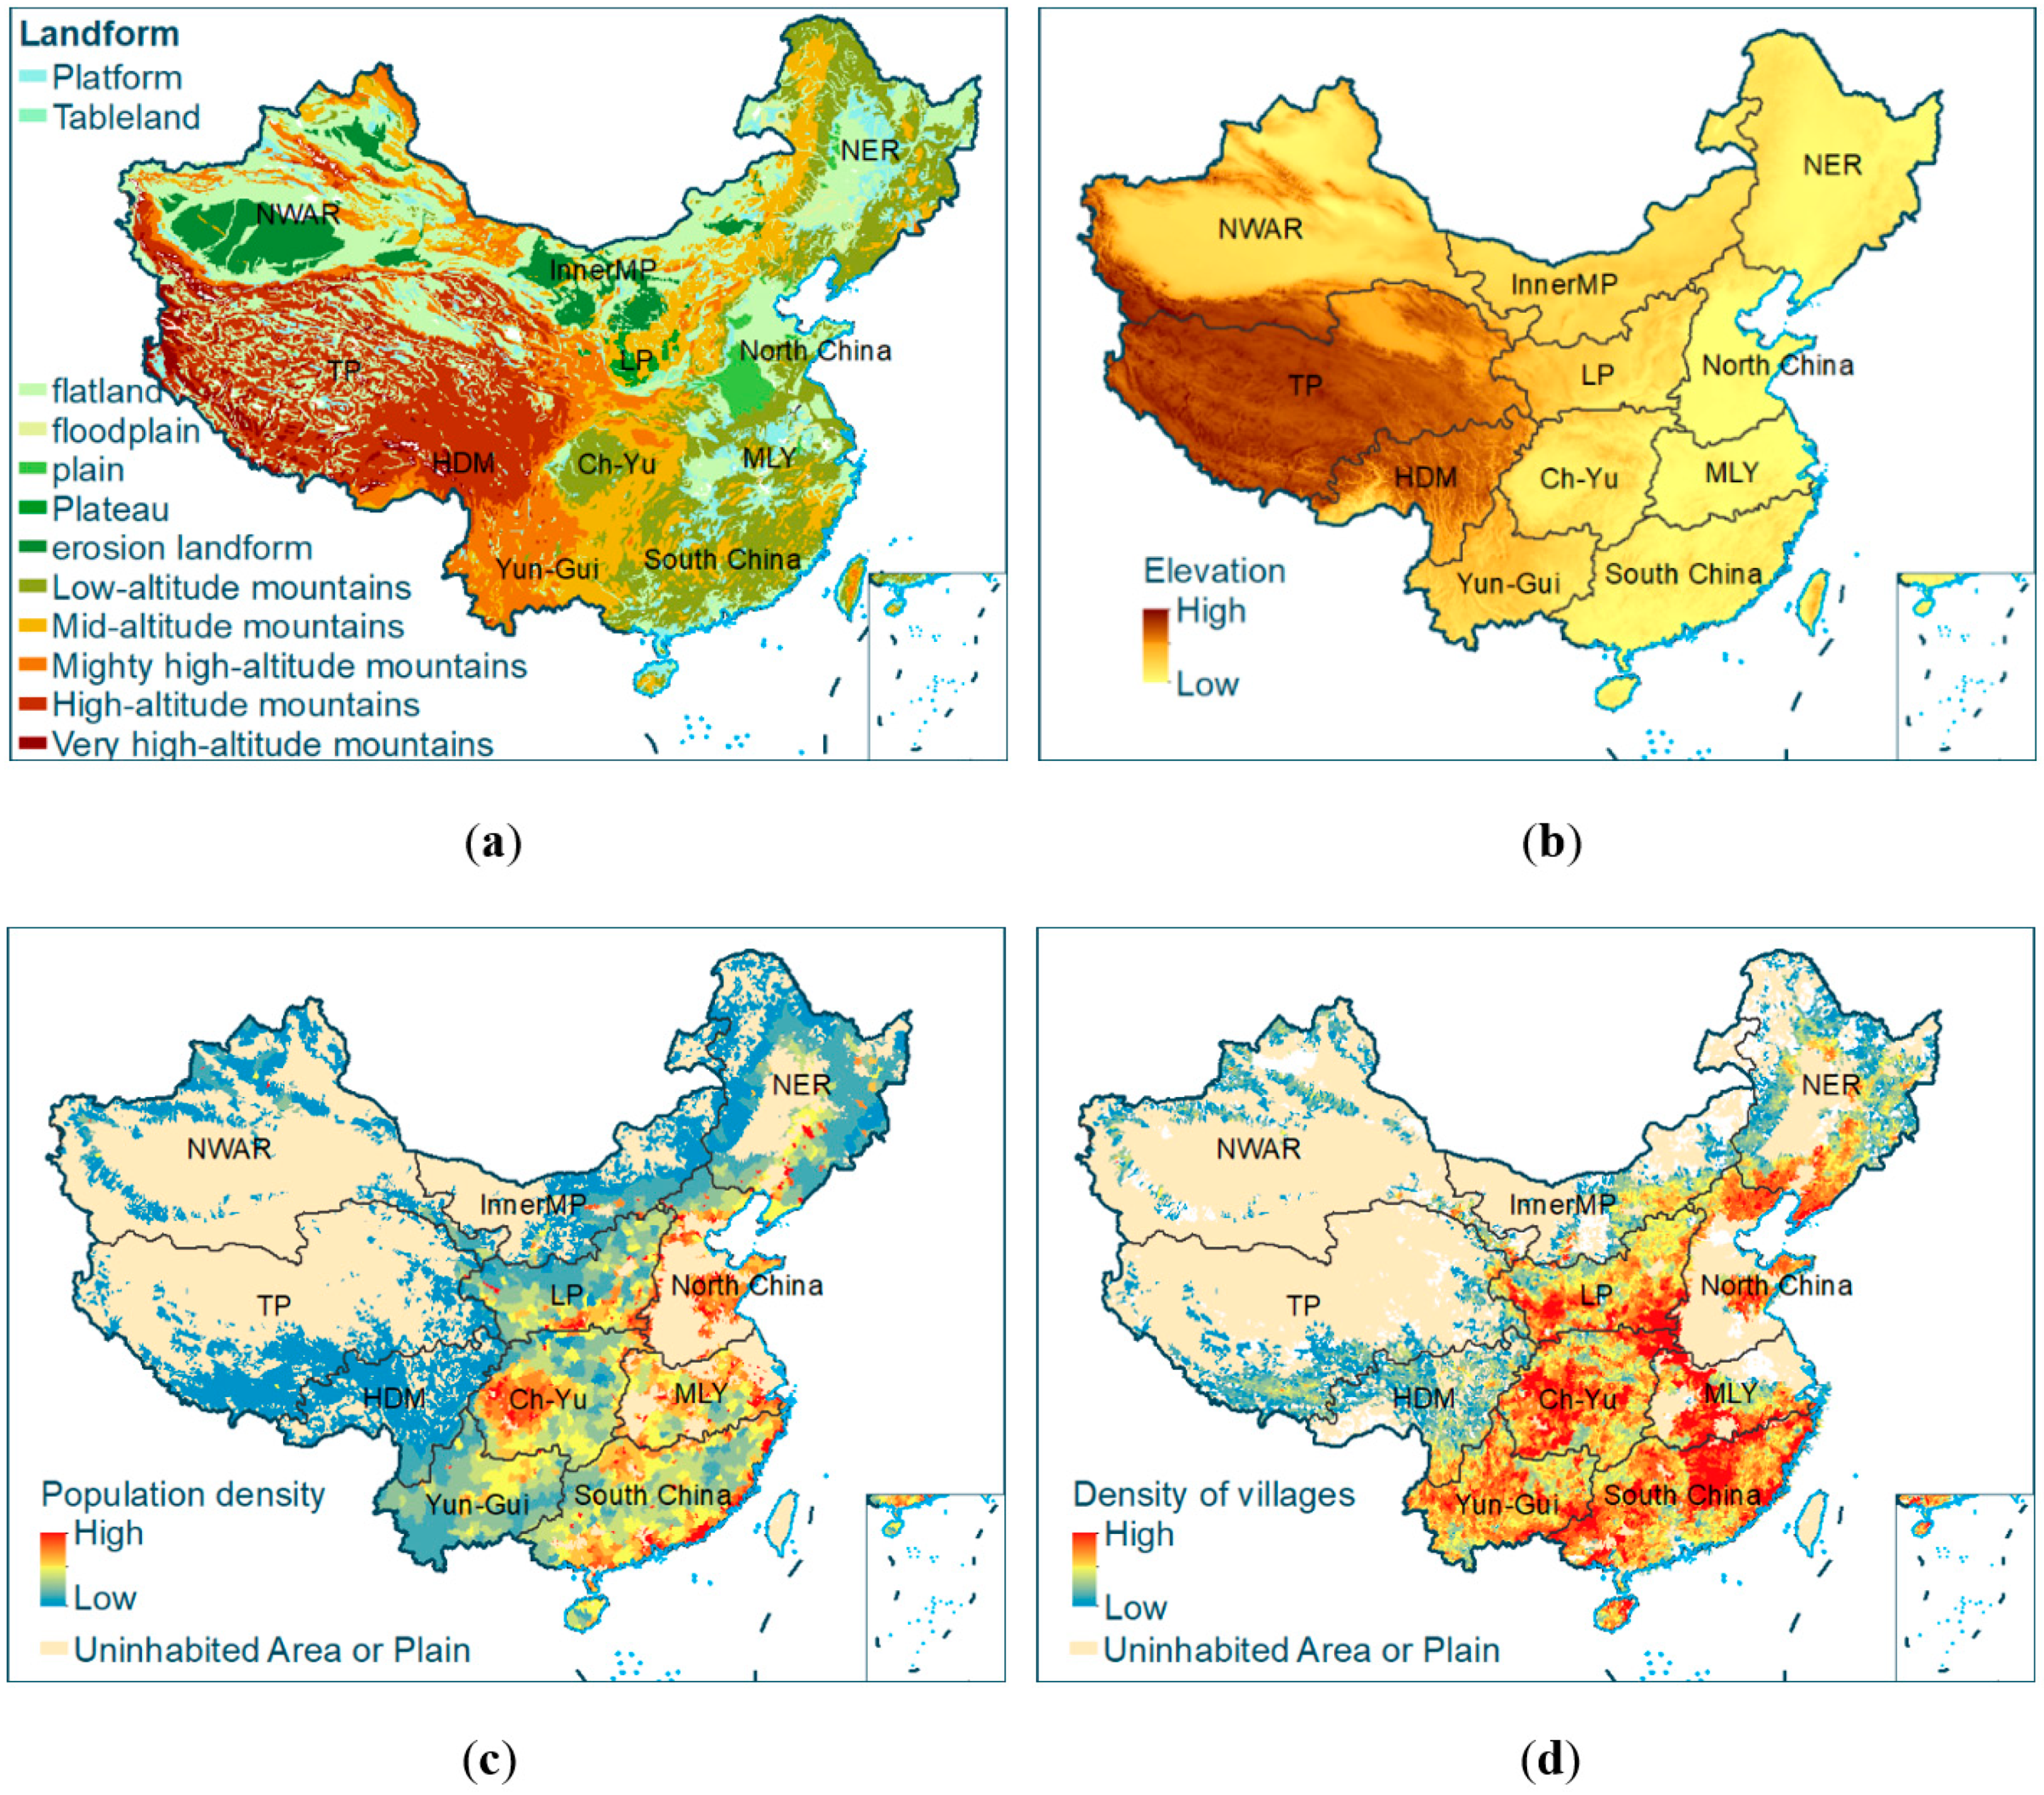
2.2.3. Processing of Human Activity Data
2.2.4. Integration of Numerical Factors at Watershed Scale
2.3. Methods
2.3.1. Factor Detector
2.3.2. Interaction Detector
2.3.3. Spatial Zoning Scheme
3. Results
3.1. Spatial Variation in the FFs and Factors
3.2. Driving Factors of Flash Floods Across Different Ecoregions
3.3. Interaction of Influential Factors Driving Flash Floods
4. Discussion
5. Conclusions
Author Contributions
Funding
Conflicts of Interest
Appendix A

| NWAR | HDM | Inner MP | LP | MLY | North | NER | TP | Ch-Yu | South China | Yun-Gui | ||
|---|---|---|---|---|---|---|---|---|---|---|---|---|
| Number of Flash Floods | 148 | 93 | 146 | 1078 | 621 | 231 | 301 | 38 | 1468 | 1688 | 638 | |
| P(<10) | Mean | 21.9 | 42.58 | 22.38 | 26.64 | 35.01 | 22.46 | 29.19 | 27.93 | 46.02 | 42.5 | 46.9 |
| Min | 7.26 | 28.36 | 14.63 | 17.86 | 28.6 | 18.04 | 17.35 | 9.3 | 25.96 | 29.4 | 34.47 | |
| Max | 39.71 | 53.25 | 37.48 | 41.21 | 40.91 | 31.98 | 51.26 | 48.41 | 90.98 | 54.82 | 90.48 | |
| P(10–25) | Mean | 10.04 | 25.72 | 12.31 | 15.23 | 19.59 | 12.39 | 15.82 | 16.72 | 25.76 | 23.22 | 25.85 |
| Min | 2.92 | 17.11 | 7.03 | 10.65 | 14.82 | 10.64 | 10.81 | 4.11 | 14.18 | 13.59 | 19.13 | |
| Max | 22.18 | 35.35 | 17.47 | 25.18 | 22.69 | 17.76 | 20.16 | 31.36 | 39.2 | 30.35 | 39.06 | |
| P(25–50) | Mean | 6.99 | 22.85 | 9.62 | 12.51 | 18.03 | 10.23 | 13.19 | 13.91 | 20.81 | 20.36 | 21.22 |
| Min | 2.02 | 14.74 | 4.71 | 7.81 | 13.32 | 8.72 | 9.29 | 2.59 | 11.77 | 10 | 14.99 | |
| Max | 16.67 | 30.14 | 12.59 | 21.62 | 21.46 | 15.9 | 19.02 | 27.29 | 28.21 | 24.66 | 27.79 | |
| P(50–100) | Mean | 5.09 | 22.46 | 8.58 | 11.72 | 19.83 | 10.06 | 12.4 | 13.65 | 19.57 | 21.86 | 21.53 |
| Min | 1.49 | 15.47 | 3.94 | 6.98 | 13.83 | 8.88 | 7.59 | 2.09 | 12.13 | 10.18 | 15.71 | |
| Max | 12.73 | 29.04 | 11.06 | 20.17 | 24.35 | 16.9 | 18.67 | 26.46 | 27.18 | 25.94 | 31.35 | |
| P(100–250) | Mean | 2.95 | 19.19 | 6.98 | 10.36 | 24.01 | 10.34 | 11.63 | 9.81 | 19.27 | 26.62 | 23.62 |
| Min | 1.18 | 8.96 | 2.49 | 5.15 | 14.9 | 8.19 | 7.01 | 1.55 | 11.6 | 11.51 | 17.8 | |
| Max | 8.29 | 31.04 | 9.2 | 15.07 | 30.35 | 19.32 | 16.95 | 18.85 | 25.51 | 30.88 | 35.63 | |
| P(>250) | Mean | 1.2 | 3.88 | 2.4 | 3.85 | 15.23 | 5.87 | 4.82 | 1.66 | 10.09 | 18.08 | 11.28 |
| Min | 1 | 1.22 | 1.19 | 1.5 | 7.4 | 2.37 | 2.28 | 1.03 | 2.44 | 10.51 | 5.25 | |
| Max | 1.69 | 12.43 | 3.54 | 7.52 | 21 | 12.49 | 11.16 | 2.77 | 15.14 | 26.23 | 18.05 | |
| Elevation (m) | Mean | 1764.17 | 3472.59 | 1347.03 | 1325.57 | 167.76 | 410.48 | 385.15 | 4275.7 | 709.48 | 290.53 | 1493.78 |
| Min | −26.84 | 765 | 545.19 | 75.11 | 1.46 | 0 | 0 | 1481.37 | 40.23 | −0.65 | 97.13 | |
| Max | 5322.5 | 5565 | 15,544.65 | 4245.85 | 1222.22 | 1891.95 | 1640.33 | 6086 | 3832.46 | 1776.13 | 4106.74 | |
| Slope (°) | Mean | 13.33 | 28.5 | 7.44 | 18.11 | 14.09 | 11.77 | 8.4 | 18.39 | 21.59 | 17.03 | 21.76 |
| Min | 0 | 0 | 0 | 0 | 0 | 0 | 0 | 0 | 0 | 0 | 0 | |
| Max | 55.59 | 55.69 | 39.68 | 74.3 | 43.5 | 40.97 | 31.35 | 48.31 | 53.38 | 48.29 | 51.09 | |
| land use (%) | field | 19.50% | 2.00% | 36.30% | 43.80% | 39.80% | 51.10% | 34.90% | 3.40% | 43.30% | 25.40% | 18.10% |
| forest | 4.90% | 50.40% | 4.10% | 15.40% | 48.10% | 20.60% | 49.80% | 6.30% | 42.70% | 61.60% | 63.60% | |
| grass | 75.60% | 47.60% | 59.60% | 40.80% | 12.10% | 28.30% | 15.30% | 90.30% | 14.10% | 13.00% | 18.30% | |
| Soil (%) | loam | 78.40% | 78.90% | 85.30% | 83.30% | 51.50% | 86.50% | 72.70% | 87.30% | 65.50% | 50.70% | 38.00% |
| clay | 19.00% | 19.70% | 11.60% | 15.90% | 42.80% | 11.00% | 26.60% | 7.70% | 33.80% | 48.00% | 60.90% | |
| other | 2.70% | 1.40% | 3.10% | 0.80% | 5.80% | 2.50% | 0.70% | 5.10% | 0.70% | 1.40% | 1.10% | |
| Vegetation (%) | natural | 88.00% | 97.20% | 79.80% | 52.70% | 71.60% | 50.00% | 71.10% | 89.80% | 68.20% | 82.90% | 92.40% |
| agricultural | 8.60% | 1.00% | 19.60% | 47.30% | 28.20% | 49.60% | 28.90% | 5.20% | 31.60% | 17.10% | 7.50% | |
| other | 3.40% | 1.80% | 0.60% | 0.00% | 0.20% | 0.30% | 0.00% | 5.10% | 0.10% | 0.10% | 0.10% | |
| Landform (%) | low mountain | 10.60% | 0.10% | 37.00% | 43.30% | 69.80% | 68.40% | 71.50% | 0.00% | 80.20% | 79.60% | 34.70% |
| high mountain | 33.00% | 94.90% | 6.30% | 25.50% | 0.00% | 0.40% | 0.40% | 81.10% | 13.70% | 0.10% | 60.60% | |
| plain | 56.40% | 5.00% | 56.60% | 31.20% | 30.20% | 31.20% | 28.10% | 18.90% | 6.20% | 20.30% | 4.70% | |
| population density (/km²) | Mean | 30 | 17 | 83 | 190 | 322 | 385 | 125 | 16 | 289 | 283 | 137 |
| Min | <1 | <1 | <1 | <1 | <1 | <1 | <1 | <1 | <1 | <1 | <1 | |
| Max | 2112 | 542 | 2642 | 3398 | 6342 | 12,672 | 4339 | 2413 | 7468 | 3808 | 8191 | |
| village density (/100km²) | Mean | 3 | 8 | 15 | 39 | 70 | 44 | 21 | 4 | 51 | 58 | 35 |
| Min | <1 | <1 | <1 | <1 | <1 | <1 | <1 | <1 | <1 | <1 | <1 | |
| Max | 62 | 77 | 80 | 1370 | 1497 | 344 | 1045 | 370 | 394 | 261 | 275 | |
References
- Moreno-Rueda, G.; Pizarro, M. Relative influence of habitat heterogeneity, climate, human disturbance, and spatial structure on vertebrate species richness in Spain. Ecol. Res. 2009, 24, 335–344. [Google Scholar] [CrossRef]
- Hale, R.L.; Grimm, N.B.; Vorosmarty, C.J. Spatial-Temporal Heterogeneity in Regional Watershed Phosphorus Cycles Driven by Changes in Human Activity over the Past Century. In Proceedings of the AGU Fall Meeting, San Francisco, CA, USA, 15–19 December 2014. [Google Scholar]
- Qin, C. China Environmental Economic General Equilibrium Analysis System and Its Application; China Science Press: Beijing, China, 2014. [Google Scholar]
- Weizhong, S.U.; Duan, H. Catchment-based Imperviousness Metrics Impacts on Floods in Niushou River Basin, Nanjing City, East China. Chin. Geogr. Sci. 2017, 27, 229–238. [Google Scholar]
- Li, C.; Yuan, B.; Zhang, M. Response of Flash Flood Early Warning Critical Rainfall to Storm Pattern in South Branch of Censhui Watershed. J. Environ. Sci. Eng. B 2015, 4, 637–648. [Google Scholar]
- Guo, L.; He, B.; Ma, M. A comprehensive flash flood defense system in China: Overview, achievements, and outlook. Nat. Hazards 2018, 92, 727–740. [Google Scholar] [CrossRef]
- Sun, D.; Zhang, D.; Cheng, X. Framework of National Non-Structural Measures for Flash Flood Disaster Prevention in China. Water 2012, 4, 272–282. [Google Scholar] [CrossRef]
- Bajabaa, S.; Masoud, M.; Al-Amri, N. Flash flood hazard mapping based on quantitative hydrology, geomorphology and GIS techniques (case study of Wadi Al Lith, Saudi Arabia). Arab. J. Geosci. 2014, 7, 2469–2481. [Google Scholar] [CrossRef]
- Lu, G.; Ling, Z.; Wu, Z. Zoning of Mountain Torrent Hazards in Medium-Small River Basins. Earth Sci. 2014, 39, 1438–1444. [Google Scholar]
- Guo, L.; Liu, C.; Ding, L. Working plan for mountain flood investigation and evaluation in China. China Water Resour. 2012, 23, 10–12. [Google Scholar]
- Gang, Z.; Bo, P.; Zongxue, X.U. Assessment on the hazard of flash flood disasters in China. J. Hydraul. Eng. 2016, 47, 1133–1142. [Google Scholar]
- Liu, Y.; Yang, Z.; Huang, Y. Spatiotemporal evolution and driving factors of China’s flash flood disasters since 1949. Sci. China (Earth Sci.) 2018, 61, 1804–1817. [Google Scholar] [CrossRef]
- Tang, C.; Zhu, J.A. GIS based regional torrent risk zonation. Acta Geogr. Sin. 2005, 60, 87–94. [Google Scholar]
- Liu, Y.; Yuan, X.; Guo, L. Driving Force Analysis of the Temporal and Spatial Distribution of Flash Floods in Sichuan Province. Sustainability 2017, 9, 1527. [Google Scholar] [CrossRef] [Green Version]
- Xiong, J.; Ye, C.; Cheng, W. The Spatiotemporal Distribution of Flash Floods and Analysis of Partition Driving Forces in Yunnan Province. Sustainability 2019, 11, 2926. [Google Scholar] [CrossRef] [Green Version]
- Gruntfest, E.; Handmer, J. Coping with Flash Floods; Springer: Dordrecht, The Netherlands, 2001. [Google Scholar]
- Terti, G.; Ruin, I.; Anquetin, S. Dynamic vulnerability factors for impact-based flash flood prediction. Nat. Hazards 2015, 79, 1481–1497. [Google Scholar] [CrossRef]
- Blöschl, G.; Ardoin-Bardin, S.; Bonell, M. At what scales do climate variability and land cover change impact on flooding and low flows? Hydrol. Process. 2007, 21, 1241–1247. [Google Scholar] [CrossRef]
- Shi, P.; Lili, L.; Ming, W. Disaster system: Disaster cluster, disaster chain and disaster compound. J. Nat. Disasters 2014, 23, 1–12. [Google Scholar]
- Zhong, D.; Xie, H.; Wei, F. Discussion on Mountain Hazards Chain. J. Mt. Sci. 2013, 31, 314–326. [Google Scholar]
- Cui, P.; Zou, Q. Theory and method of risk assessment and risk management of debris flows and flash floods. Prog. Geogr. 2016, 35, 137–147. [Google Scholar]
- Chang, H.-S.; Chen, T.-L. Spatial heterogeneity of local flood vulnerability indicators within flood-prone areas in Taiwan. Environ. Earth Sci. 2016, 75, 1484.1–1484.14. [Google Scholar] [CrossRef]
- Borga, M. Forecasting, Early Warning and Event Management: Non-structural Protection Measures for Flash Floods and Debris Flows. In Dating Torrential Processes on Fans and Cones: Methods and Their Application for Hazard and Risk Assessment; Schneuwly-Bollschweiler, M., Stoffel, M., Rudolf-Miklau, F., Eds.; Springer: Dordrecht, The Netherlands, 2013; pp. 391–398. [Google Scholar]
- Guo, L.; Zhang, X.; Liu, R. Achievements and Preliminary Analysis on China National Flash Flood Disasters Investigation and Evaluation. J. Geo-Inf. Sci. 2017, 19, 1548–1669. [Google Scholar]
- Yuan, X.; Liu, Y.; Huang, Y. An approach to quality validation of large-scale data from the Chinese Flash Flood Survey and Evaluation (CFFSE). Nat. Hazards 2017, 89, 693–704. [Google Scholar] [CrossRef]
- Xing-Hua, L.I. Regularity and cause of mountain torrents in Inner Mongolia in recent 50 years. J. Nat. Disasters 2006, S1, 241–246. [Google Scholar]
- Gaume, E.; Bain, V.; Bernardara, P. A compilation of data on European flash floods. J. Hydrol. 2009, 367, 70–78. [Google Scholar] [CrossRef] [Green Version]
- Terti, G.; Ruin, I.; Gourley, J.J. Toward Probabilistic Prediction of Flash Flood Human Impacts. Risk Anal. 2017, 110, 1779. [Google Scholar] [CrossRef] [PubMed]
- Getis, A.; Ord, J.K. The Analysis of Spatial Association by Use of Distance Statistics. Geogr. Anal. 1992, 24, 189–206. [Google Scholar] [CrossRef]
- Ord, J.K.; Getis, A. Local Spatial Autocorrelation Statistics: Distributional Issues and an Application. Geogr. Anal. 1995, 27, 286–306. [Google Scholar] [CrossRef]
- Huawei, L.I.; Wan, Q. Study on Rainfall Index Selection for Hazard Analysis of Mountain Torrents Disaster of Small Watersheds. J. Geo-Inf. Sci. 2017, 19, 425–435. [Google Scholar]
- Liu, Y.H.; Tang, C.; Jian-Bo, W.U. Spatial and temporal distribution characteristics of geo-hazards and rainfall in different scales. Chin. J. Geol. Hazard Control 2011, 22, 74–83. [Google Scholar]
- Liu, Z.J.; Yu, X.X.; Wang, S.S.; Shang, G.D. Comparative analysis of three covariates methods in Thin-Plate Smoothing Splines for interpolating precipitation. Progr. Geogr. 2012, 31, 56–62. [Google Scholar]
- You, S.; Li, Z.; You, S. Comparison on methods for resterization of air temperature data. Resour. Sci. 2003, 6, 83–88. [Google Scholar]
- Yang, X.H.; Huang, Y.H.; Dong, P.L. An updating system for the gridded population database of China based on remote sensing, GIS and spatial database technologies. Sensors 2009, 9, 1128. [Google Scholar] [CrossRef] [PubMed] [Green Version]
- Smith, J.A.; Baeck, M.L.; Meierdiercks, K.L. Radar rainfall estimation for flash flood forecasting in small urban watersheds. Adv. Water Resour. 2007, 30, 2087–2097. [Google Scholar] [CrossRef]
- Prasad, R.N.; Pani, P. Geo-hydrological analysis and sub watershed prioritization for flash flood risk using weighted sum model and Snyder’s synthetic unit hydrograph. Model. Earth Syst. Environ. 2017, 3, 1–12. [Google Scholar] [CrossRef]
- Wang, J.; Chengdong, X.U. Geodetector: Principle and prospective. Acta Geogr. Sin. 2017, 72, 116–134. [Google Scholar]
- Wang, J.F.; Zhang, T.L.; Fu, B.J. A measure of spatial stratified heterogeneity. Ecol. Indic. 2016, 67, 250–256. [Google Scholar] [CrossRef]
- Wang, J.; Gao, B.; Stein, A. The spatial statistic trinity: A generic framework for spatial sampling and inference. Environ. Model. Softw. 2020, 134, 104835. [Google Scholar] [CrossRef]
- Wang, J.F.; Li, X.H.; Christakos, G. Geographical Detectors-Based Health Risk Assessment and its Application in the Neural Tube Defects Study of the Heshun Region, China. Int. J. Geogr. Inf. Sci. 2010, 24, 107–127. [Google Scholar] [CrossRef]
- Xie, G.D.; Zhang, C.S.; Zhang, L.B. China’s County-Scale Ecological Regionalization. J. Nat. Resour. 2012, 27, 154–162. [Google Scholar]
- Jiaming, L.I.; Dadao, L.U.; Chengdong, X.U. Spatial heterogeneity and its changes of population on the two sides of Hu Line. Acta Geogr. Sin. 2017, 72, 148–160. [Google Scholar]
- Mao, R.; Gong, D.-Y.; Yang, J. Linkage between the Arctic Oscillation and winter extreme precipitation over central-southern China. Clim. Res. 2011, 50, 187–201. [Google Scholar] [CrossRef] [Green Version]
- Zomer, R.J.; Trabucco, A.; Metzger, M.J. Projected climate change impacts on spatial distribution of bioclimatic zones and ecoregions within the Kailash Sacred Landscape of China, India, Nepal. Clim. Chang. 2014, 125, 445–460. [Google Scholar] [CrossRef]
- Tao, Y.; Tang, C. The influence of human activity and precipitation change on mid-long term evolution of landslide and debris flow disasters. Sci. Cold Arid Reg. 2013, 5, 715–721. [Google Scholar]
- Huang, G.; Chen, Z. Research on critical rainfall of mountain torrent disasters based on effective antecedent rainfall. J. Nat. Disasters 2014, 23, 192–197. [Google Scholar]
- Miao, Q.; Yang, D.; Yang, H. Establishing a rainfall threshold for flash flood warnings in China’s mountainous areas based on a distributed hydrological model. J. Hydrol. 2016, 541, 371–386. [Google Scholar] [CrossRef]
- Garambois, P.A.; Larnier, K.; Roux, H. Analysis of flash flood-triggering rainfall for a process-oriented hydrological model. Atmos. Res. 2014, 137, 14–24. [Google Scholar] [CrossRef] [Green Version]


| Data | Period | Source | Format | Description |
|---|---|---|---|---|
| Flash floods | 1950–2015 | Investigation Project of Chinese Flash Floods (IPCFF) | Point layer | Location, time, etc. |
| Ecoregion | 2012 | Xie et al. | Polygon layer | Classified into 11 Ecoregion |
| Precipitation | 1950–2015 | CMA | Table | Daily data of 175 national meteorological station |
| DEM | 2003 | NASA | 90 m × 90 m grid | Shuttle Radar Topography Mission (STRM) |
| Land use | 2010 | RESDC 1 | Polygon layer | Based on 1:1,000,000 land use dataset |
| Soil | 2010 | RESDC | Polygon layer | integrated from 1:1,000,000 soil type maps and the 2nd national soil census data |
| Landform | 1994 | RESDC | Polygon layer | 1:4,000,000 geomorphological map of China |
| Vegetation | 1996 | RESDC | Polygon layer | 1:4,000,000 geomorphological map of China |
| Population | 2000 | RESDC | 1 km × 1 km grid | Grid value is population |
| Village | 2000 | RESDC | Point layer | Village layer of national basic geography layer |
| Interaction | Description |
|---|---|
| Weaken, nonlinear | PD(L1∩L2) < Min(PD(L1), PD(L2)) |
| Weaken, unilinear | Min(PD(L1), PD(L2)) < PD(L1∩ L2) < Max(PD(L1)), PD(L2)) |
| Bilinear enhanced | PD(L∩L2) > Max(PD(L), PD(L2)) |
| Independent | PD(L∩L2) = PD(L) + PD(L2) |
| Nonlinear enhanced | PD(L∩L2) > PD(L) + PD(L2) |
| Ecoregion | NWAR | TP | Inner MP | NER | LP | North China | HDM | Ch-Yu | LMY | Yun-Gui | South China |
|---|---|---|---|---|---|---|---|---|---|---|---|
| P(<10) | 0.368 | 0.349 | 0.346 | 0.613 | 0.253 | 0.294 | 0.111 | 0.27 | 0.135 | 0.212 | 0.315 |
| P(10–25) | 0.567 | 0.348 | 0.216 | 0.466 | 0.297 | 0.176 | 0.276 | 0.336 | 0.176 | 0.353 | 0.205 |
| P(25–50) | 0.589 | 0.28 | 0.17 | 0.233 | 0.257 | 0.171 | 0.215 | 0.33 | 0.086 | 0.065 | 0.098 |
| P(50–100) | 0.707 | 0.337 | 0.289 | 0.134 | 0.289 | 0.2 | 0.365 | 0.334 | 0.075 | 0.104 | 0.084 |
| P(100–250) | 0.756 | 0.104 | 0.434 | 0.162 | 0.422 | 0.065 | 0.255 | 0.392 | 0.059 | 0.062 | 0.126 |
| P(>250) | 0.704 | 0.206 | 0.44 | 0.306 | 0.564 | 0.044 | 0.231 | 0.301 | 0.134 | 0.06 | 0.199 |
| population density | 0.501 | 0.384 | 0.22 | 0.11 | 0.194 | 0.033 | 0.252 | 0.053 | 0.033 | 0.081 | 0.013 |
| village density | 0.597 | 0.321 | 0.236 | 0.273 | 0.155 | 0.446 | 0.194 | 0.031 | 0.087 | 0.018 | 0.011 |
| elevation | 0.116 | 0.672 | 0.034 | 0.122 | 0.231 | 0.019 | 0.266 | 0.024 | 0.011 | 0.009 | 0.02 |
| Slope | 0.034 | 0.063 | 0.178 | 0.113 | 0.012 | 0.019 | 0.069 | 0.052 | 0.014 | 0.017 | 0.019 |
| land use | 0.104 | 0.248 | 0.069 | 0.136 | 0.173 | 0.071 | 0.039 | 0.026 | 0.052 | 0.033 | 0.1 |
| vegetation | 0.192 | 0.146 | 0.131 | 0.234 | 0.173 | 0.044 | 0.155 | 0.158 | 0.124 | 0.078 | 0.181 |
| soil | 0.285 | 0.343 | 0.093 | 0.149 | 0.067 | 0.125 | 0.149 | 0.031 | 0.11 | 0.146 | 0.08 |
| landform | 0.509 | 0.714 | 0.312 | 0.209 | 0.22 | 0.558 | 0.189 | 0.306 | 0.086 | 0.049 | 0.401 |
| Ecoregion | Factors with Highest Interactive Power of Determinant (PD) | PD of Interaction Detector | Relationship of the Two Factors |
|---|---|---|---|
| NWAR | Landform, P(>250) | 0.901 | Bilinear enhanced |
| TP | Landform, P(>250) | 0.861 | Bilinear enhanced |
| Inner MP | Landform, P(100–250) | 0.737 | Bilinear enhanced |
| NER | P(<10), P(>250) | 0.800 | Bilinear enhanced |
| LP | P(25–50), P(>250) | 0.819 | Bilinear enhanced |
| North China | Landform, P(100–250) | 0.770 | Nonlinear enhanced |
| HDM | P(10–25), P(>250) | 0.690 | Nonlinear enhanced |
| Ch-Yu | P(50–100), P(>250) | 0.617 | Bilinear enhanced |
| LMY | P(<10), P(>250) | 0.478 | Nonlinear enhanced |
| Yun-Gui | P(10–25), P(>250) | 0.532 | Nonlinear enhanced |
| South China | Landform, P(>250) | 0.641 | Nonlinear enhanced |
Publisher’s Note: MDPI stays neutral with regard to jurisdictional claims in published maps and institutional affiliations. |
© 2020 by the authors. Licensee MDPI, Basel, Switzerland. This article is an open access article distributed under the terms and conditions of the Creative Commons Attribution (CC BY) license (http://creativecommons.org/licenses/by/4.0/).
Share and Cite
Liu, Y.; Huang, Y. Why Flash Floods Occur Differently across Regions? A Spatial Analysis of China. Water 2020, 12, 3344. https://doi.org/10.3390/w12123344
Liu Y, Huang Y. Why Flash Floods Occur Differently across Regions? A Spatial Analysis of China. Water. 2020; 12(12):3344. https://doi.org/10.3390/w12123344
Chicago/Turabian StyleLiu, Yesen, and Yaohuan Huang. 2020. "Why Flash Floods Occur Differently across Regions? A Spatial Analysis of China" Water 12, no. 12: 3344. https://doi.org/10.3390/w12123344