Article

Spatial Assessment of Groundwater Quality and Health Risk of Nitrogen Pollution for Shallow Groundwater Aquifer around Fuyang City, China

1
School of Resources and Environmental Engineering, Hefei University of Technology, Hefei 230009, China
2
Anhui Geological Environment Monitoring Station, Hefei 230001, China
*
Authors to whom correspondence should be addressed.
Water 2020, 12(12), 3341; https://doi.org/10.3390/w12123341
Submission received: 29 September 2020 / Revised: 24 November 2020 / Accepted: 25 November 2020 / Published: 28 November 2020
(This article belongs to the Section Water Quality and Contamination)

Abstract

:
Prolonged exposure to intensive and extensive agricultural and industrial activities is leading to an increased deterioration of groundwater quality, especially nitrogen pollution in shallow groundwater aquifers. This study was carried out using the fuzzy comprehensive method to assess the overall groundwater quality, and the noncarcinogenic risks were estimated using the human health risk assessment method recommended by the United States Environmental Protection Agency (USEPA) via drinking water intake pathways around Fuyang City, China. A total of 34 samples were collected from shallow groundwater private wells, and 16 parameters were analyzed for each groundwater sample. The evaluation results of groundwater quality show 14.7% of groundwater samples classified as poor and very poor quality, and NO3-N, TH, TDS, Fe3+, and Mn are of high potential to affect the quality of potable drinking water. These are mainly derived from anthropogenic pollutants, predominantly due to uncontrolled agricultural and industrial activities, as well as some natural processes. The noncarcinogenic risk of nitrate indicates that 8.82% of groundwater samples surpass the permissible limit recommended by the USEPA for both adults and children. This study may provide the local authority with insights into making scientific decisions for exploiting groundwater in a sustainable manner so as to protect public health.

1. Introduction

Groundwater plays an indispensable role in healthy human life and ecosystem sustainability. It is also the predominant source for different uses (e.g., domestic, agriculture, and industrial) [1]. This is particularly true in arid and semi-arid regions, owing to insufficient rainfall and surface water availability [2,3]. An overwhelming number of people depend on groundwater for drinking purposes, either directly or indirectly [4,5]. The majority of the rural population (exceeding 70%) in China rely on groundwater for domestic purposes [6]. Recently, the demand for fresh groundwater is enhanced more than ever. However, groundwater quality is severely deteriorating, which is greatly attributed to huge population growth, rapid industrialization, increasing discharge of domestic sewage, overexploitation of groundwater, excessive application of agrochemicals, as well as the geogenic process that causes groundwater pollution through water–rock interaction, strong evaporation, and ion exchange in many countries and regions all over the world [7,8]. The World Health Organization (WHO) report states that, as significant as four-fifths of diseases are due to poor quality of drinking water in the world, as cited in [8,9]. Hence, the purpose of groundwater quality assessment is not only to rate groundwater quality, but it is also closely related to human health and to save a lot of people from suffering from various diseases. Therefore, it is necessary to evaluate groundwater quality correctly. Various scientific approaches that contributed to significant quality improvements in water quality have been reported [10,11,12]. Some of these methods include set pair analysis [13,14], matter element extension analysis [15,16], water quality index [17], and others that were mainly studied before. All these methods mentioned above have their own merits and demerits. For example, in groundwater quality assessment, set pair analysis and matter element extension analysis can be more important to deal with the uncertainties, but their calculation processes are complex, so they are not easy for common engineers to understand their basic principles and concepts. Water quality index is easy to calculate, but unable to deal with uncertainties associated with the water quality standards and water quality parameters [12]. Fuzzy comprehensive assessment method was used to overcome the shortcomings associated with the above methods in this study. Fuzzy comprehensive assessment method removes the influence of some uncertain factors, as compared to water quality indices [18,19]. Furthermore, the method treats main pollutants based on weights of evaluation factors in each sample site, which is another crucial reason to opt for the fuzzy comprehensive assessment method over other methods. Overdose and deficiency ingestion of hydrochemical effluents of groundwater can pose negative impacts on human health [20]. In the past two decades, intensive agricultural input and management have greatly increased production despite a high population increase [6]. However, this improvement has brought unexpected negative impacts on groundwater quality as well, because with the supply of rainwater or irrigation water, nitrogen can easily penetrate into groundwater through the soil [21]. With the continued rapid expansion of irrigation and intensive use of agrochemicals, groundwater nitrate pollution is becoming a serious problem that needs a great deal of attention [22,23,24]. In groundwater, Hudak reviewed that agricultural activities (especially fertilization) were a principal source of high nitrate levels throughout the country [25]. Rahmati et al. showed that the amount of applied nitrogenous fertilizer is closely related to high concentration nitrate in groundwater [26].
Owing to the rapid development of industry and the widespread use of agricultural fertilizers, groundwater nitrogen pollution has become more serious than ever, leading to multiple human health problems [27,28]. Several studies have revealed that nitrogen pollution (particularly nitrate) level in groundwater exceeds the standards set; this is further deteriorating water quality by creating eutrophication in surface water when groundwater discharges to surface water in their study areas [29,30]. Wu et al. [31] conducted a study on severe nitrate pollution and the health risks of a coastal aquifer and found that the groundwater nitrate concentrations exerted noncarcinogenic health risks for different age groups in the northern Shandong Peninsula of China. Furthermore, exposure to excessive nitrate concentration through drinking water is one of the reasons for methemoglobinemia in infants, miscarriage, and certain types of cancers, including gastric and stomach cancer [6,32]. Considering the importance of groundwater in arid and semi-arid regions, many interesting and comprehensive studies have been conducted on groundwater pollution and related health hazards around the world [33,34,35]. For example, in order to quantify the impact of different hazardous substances on human health, Batayneh [36], Chen et al. [6], and Ryu et al. [37] conducted a health risk assessment of hazardous substances in groundwater. All these studies indicated that the main route to expose carcinogenic and noncarcinogenic risks was the intake of contaminated groundwater, while a few also considered the dermal contact pathway [15,38]. Knowledge of human health risk assessments proposed by the USEPA is useful for evaluating potential health risks from water contaminants and provides scientific guidance for differential water supplies and cost-effective water treatments [5].
In Weining Plain, China, Li et al. reported that the pollution of nitrogen, Mn, and other pollutants in groundwater is predominantly due to intensive and extensive agricultural and industrial activities [27]. These factors help us to better understand the sources of nitrogen pollution and to investigate appropriate measures to control such pollution. WHO has set a permissible limit for nitrate in drinking water, which is 50 mg/L; the corresponding national standard for China is 20 mg/L, as N [39]. So far, many scholars not only notify about human health risk assessment of groundwater pollution around the world, but also provide useful insights for the protection of human health. Batheja et al. reported that a higher concentration of nitrate was found in the groundwater wells around the agricultural areas [40]. Su et al. suggested that health risk from nitrate-nitrogen in groundwater in an agricultural area was higher than that in urban areas of northeast China [38]. The study of [41] points out that a comprehensive understanding of the potential health risks of nitrate in drinking water is essential for making proper decisions to reduce the contamination and protect residents from health hazards. Researchers and organizations never stop worrying about the deterioration of groundwater quality and its potential human health risks.
A geographic information system (GIS) is one of the most powerful techniques commonly used for spatial information analysis and management. GIS can be used to delineate the spatial extent of contaminated sites both in natural and anthropogenic affected areas [42]. Moreover, it can be used to generate real-time figures of water-related problems in inaccessible areas [43]. The spatial distribution map of groundwater quality parameters, health risk, and water quality assessment can be outlined using spatial interpolation techniques in ArcGIS software. Inverse distance weight (IDW) is a widely used spatial interpolation method in assessing spatial distribution of groundwater quality [44]. Therefore, the IDW interpolation technique was used for analyzing spatial distribution of groundwater quality and health risk of nitrate around Fuyang City, Anhui Province, China.
The specific aims of this study were to (i) assess shallow groundwater quality around Fuyang City and (ii) assess noncarcinogenic human health risks of nitrogen for adults and children through drinking water intakes. The findings of the study could be helpful for local authorities to make sustainable decisions that imply mitigation measures to protect the groundwater quality in Fuyang City, in specific, and in China, in general. Finally, the research approach and findings might help global scholars to conduct further and future research in similar case studies around the world.

2. Description of the Study Area

Fuyang City is located in the northwest of Anhui Province, China (Figure 1). The study area is located in the southern part of the Huang-Huai-Hai and western Huaibei Plain. The topography of the area can be divided into two types of alluvial plain and denudation-alluvial plain based on their genetic morphology with 26 to 36 m elevation ranges above mean sea level (a.m.s.l.). Generally, the average land elevation is higher in the northwest and lower in the southeast, with an average ground surface slope of about 1/8000 [45].
The study area belongs to a warm temperature, semi-humid, monsoon climate, which is mild and humid, with adequate sunshine, moderate rainfall, and four distinct seasons. According to the meteorological data of the Fuyang Meteorological Bureau, the average annual temperature and annual precipitation are 14.9 °C and 901 mm, respectively. The maximum annual precipitation occurred in 1956, with a value of 1618.7 mm, and the minimum occurred in 1953 with a value of 440.8 mm. Generally, precipitation is subject to high temporal and spatial variation in the study area. The concentration of precipitation mostly occurs in June, July, and August in each annual flood season, accounting for about 48.3% of the annual precipitation. The rainfall was the highest in July, with an average monthly value of 217.9 mm. The annual average evaporation is 1604.2 mm.
The rivers around Fuyang City belong to the Huaihe River system. The main rivers flowing through the city include the Ying River, Quanhe River, and Cihuaixinhe River. All these rivers and ditches converge into the Huaihe River.

3. Geological and Hydrogeological Settings

The stratigraphic lithology of the study area is mainly covered by Quaternary strata, with a thickness of about 130–150 m [45], and it varies from one location to another, which is thin in the northeast and thick in the northwest. Geologically, the strata of shallow groundwater are the upper Pleistocene and the Holocene. The upper Pleistocene is widely outcropped on the land surface, with a total thickness of 27–48 m, and it consists of silty clay, silty sand, and fine sand. The Holocene is exposed on both sides of the Yinghe River and the Laoquanhe River, the alluvial origin with a width of 2.6–6.5 km and an average thickness of 14.4 m [45]. The lithologies are mainly silty sand, sand, and silty clay, and there are weak interlayers composed of mud clay in some parts of the study area.
The aquifer formation in the study area is characterized by loose, sandy, and porous Cenozoic aquifers. Shallow groundwater occurs in shallow Holocene and late Pleistocene strata with a depth of about 50 m, which is closely related to atmospheric precipitation and surface water. The first aquifer group (shallow groundwater) is widely distributed throughout the region. The lithology of shallow aquifers is mainly loose structure and well-sorted silt sand.
The terrain in the area is flat, and the lithology of unsaturated zone is dominated by clay with micro-fissures and sub-sandy soil with a loose structure, which easily seeps into the atmospheric precipitation. Under the present conditions, atmospheric precipitation is the main source for shallow groundwater recharge. Farmland irrigation is more common in the area, and irrigation seepage and lateral runoff are other sources of recharge for shallow groundwater. Evaporation, water exploitation by rural residents, and lateral runoff are the ways of their discharge. According to the groundwater monitoring data of Fuyang City in 2014, the depth to groundwater is generally within the range of 2.5–4.7 m. The annual peak of water level occurred in the flood season from July to September, and the water level is lower from January to March, and the difference of water level in the other periods is small. The amplitude of the annual variation of the groundwater level ranges from 1 to 2 m. Generally, the flow of shallow groundwater in the study area is from northwest to southeast, with water level elevation varying from 25 to 28 m [45].

4. Materials and Methods

4.1. Sampling and Analysis

The sampling process was carried out with prescribed national technical guidelines, and recommended precautions were taken to avoid misinterpretation of data and induced contamination. Before sampling, the selected groundwater wells were pumped for ten minutes to remove the stagnant water stored at the well screen, and the water samples were stored in polyethylene containers, and each of the sampling containers was previously washed and rinsed thoroughly with the groundwater before sampling. In this sampling investigation, we have 10% duplicate samples, which were sent to another testing laboratory to test for quality control. Therefore, we had one sample at each of the 34 locations, in which we had one more parallel sample at each of 4 locations. Excluding the four parallel samples, a total of 34 samples (Figure 1) were collected from private groundwater wells, with depth less than 38 m, during January 2015, and their locations were obtained by using a portable GPS device. Part wells that are located in the urban areas and towns are not used for supplying drinking water now. Others are located in villages. Most of them were used for drinking purposes in our field investigation. All samples were sealed tightly to prevent contamination and timely sent to the Laboratory of Anhui Geological Environment Monitoring Station within a holding time of 24 h and stored in ice-box until analyzed for further processing. The samples were analyzed within 5 days. For this study, pH, total dissolved solids (TDS), total hardness (TH), potassium (K+), sodium (Na+), calcium (Ca2+), magnesium (Mg2+), chloride (Cl), sulfate (SO42–), bicarbonate (HCO3), ammonia nitrogen (NH4-N), nitrate (NO3-N), nitrite (NO2-N), chlorides (Cl), fluoride (F), ferric iron (Fe3+) and manganese (Mn), etc., were analyzed as the indicators of groundwater pollution.

4.2. Groundwater Quality Assessment

For groundwater quality assessment, several scientific approaches have been proposed, in which fuzzy comprehensive assessment method is extensively used in appraisal water quality assessment [10]. In this study, the overall groundwater quality assessment was carried out using fuzzy comprehensive assessment method to determine the suitability for human consumption [10,46,47]. With respect to national groundwater quality standards [39], groundwater quality can be classified into five grades: excellent (grade I), good (grade II), fair (grade III), poor (grade IV), and very poor (grade V), as displayed in Table 1.
The principle procedure of fuzzy comprehensive assessment method is described as shown below.
The membership function at the first level is expressed as:
r i j = { 1 , x i s i j s i ( j + 1 ) x i s i j s i ( j + 1 )   , s i j < x i s i ( j + 1 ) 0 , x i > s i ( j + 1 ) ,
The membership function from level 2 to m − 1 is:
r i j = { 0 , x i s i ( j 1 )   or   x i > s i ( j + 1 ) x i s i ( j 1 ) s i j s i ( j 1 )   , s i ( j 1 ) < x i < s i j 1 , x i = s i j s i ( j + 1 ) x i s i ( j + 1 ) s i j , s i j < x i s i ( j + 1 ) , ,
The membership function at j = m is:
r i j = { 0 , x i s i ( j 1 ) x i s i ( j 1 ) s i j s i ( j 1 ) , s i ( j 1 ) < x i s i j 1 , x i > s i j ,
where r i j is the fuzzy membership degree of parameter i (i = 1, …, n) to grade j (j = 1, …, m), x i is the measured value of concentration for ith parameter, and s i j is the standard value of the given parameter i at grade j. The evaluation of fuzzy membership matrix R obtains the water quality parameters and classes for each groundwater sample (k) and is expressed as follows:
R ( n × m ) ( k ) =   [ r 11 r 12 r 1 m r 21 r 22 r 2 m r n 1 r n 2 r n m ] ,
The weight vector of water quality indicator is defined as [10,48]:
w i k =   x i j = 1 m s i j i = 1 n x i j = 1 m s i j ,
where w i k is the weight vector of parameter i to the kth sample, x i is the measured value of the ith parameter, and the variables of n, m, and k signify the number of parameters, water quality grades, and sample, respectively. Through the above Equation (5), the single weight vector can be constructed as A k = [ w 1 k , w 2 k , , w n k ] .
After the fuzzy weight vector A and the fuzzy relation matrix R are obtained, the fuzzy membership subset B of evaluation of the groundwater quality can be obtained by the compound operation of A and R; finally, the comprehensive evaluation results of each sample B k × m is formed as follows:
B n × m =   [ w 1 k , w 2 k , , w n k ]   ×   [ r 11 r 12 r 1 m r 21 r 22 r 2 m r n 1 r n 2 r n m ]   =   { b 11 , b 12 , , b 1 m } ,
B k × m   =   [ A ( 1 ) × R n × m ( 1 ) A ( 2 ) × R n × m ( 2 ) A ( k ) × R n × m ( k ) ]   =   { b 11 b 12 b 1 m b 21 b 22 b 2 m b k 1 b k 2 b k m } ,
The fuzzy B k × m indicates the membership degree of the water quality of the evaluated water body (sample) to the standard water quality at all levels, which reflects the fuzziness of the determination of comprehensive water quality level based on the principle of maximum membership degree.

4.3. Health Risk Assessment

Health risk assessment is an important role to appraise the negative impacts of pollutants on human health. Hence, gaining a comprehensive knowledge of human health risk assessment is essential to protect human health hazards from various toxic chemical elements, to ascertain groundwater quality assessment and management [28,41]. Contaminated groundwater enters the human body through different pathways such as drinking water intake and dermal contact, and it may pose several risks to human health [15]. Numerous studies have recommended that the health risks of contaminated groundwater through dermal contact can be negligible as compared to drinking water intake [6,49,50]. Therefore, this study only focuses on the noncarcinogenicity risk assessment through drinking water intake on the health of local residents. The human health risk assessment models recommended by the Ministry of Environmental Protection of the P.R. China [51] are based on the model of the United States Environmental Protection Agency (USEPA) [52]. Considering USEPA models, many scholars broadly used these four steps including hazard identification, dose–response assessment, exposure assessment, and risk characterization during the assessment [28,53]. In the present study, nitrogen pollutants, mainly ammonia nitrogen (NH4-N), nitrate (NO3-N), and nitrite (NO2-N), were selected as parameters for human health risk assessment. The calculated health risk assessment which is greater than one is unsafe for drinking purposes. Therefore, the noncarcinogenic risk through drinking water intake pathways can be calculated as follows [28,52]:
E = C × IR × EF × ED BW × AT ,
H Q = E RfD ,
where E indicates the average daily dose through drinking water intake per unit weight (mg/(kg·d)), C is the concentration of the pollutant in water (mg/L). IR indicates the water ingestion rate (L/day). In this study, the ingestion rate with a value of 1.5 and 0.7 L/day was used respectively for adults and children [15,50]. EF is the exposure frequency (365 days/year), ED is the exposure duration, with a suggested value of 30 years for adults and 12 years for children. BW represents the body mass of a person (kg), with a proposed value of 56.8 kg for adults and 15.9 kg for children in this study [50]. AT represents the average exposure time for noncarcinogenic effect (days), which is 10,950 days for adults and 4380 days for children. HQ and RfD represent the hazard quotient and reference dosage, respectively, for noncarcinogenic pollutants through the drinking water intake pathway (mg/(kg·d)). In this study, the values of RfD are 0.97, 1.6, and 0.1 mg/(kg·d) for NH4-N, NO3-N, and NO2-N, respectively [49,51,54].
To calculate the overall adverse effect of noncarcinogenic multiple pollutants through the drinking water intake exposure pathways on the human body, the total risk (HItotal) can be calculated as follows:
H I total = i = 1 n H Q i
where HItotal indicates hazard index; it is the sum of each of the noncarcinogenic chemical pollutants of hazard quotients, i refers to target pollutants in groundwater. Additionally, when the value of HQ exceeds 1, which is vulnerable to health risks, the HQ < 1 indicates an acceptable level of noncarcinogenic risk. Alike the HQ, HItotal > 1 means that the noncarcinogenic risk of contaminant is beyond the acceptable limit, while HItotal < 1 indicates that the risk is within the acceptable limit.

5. Results and Discussion

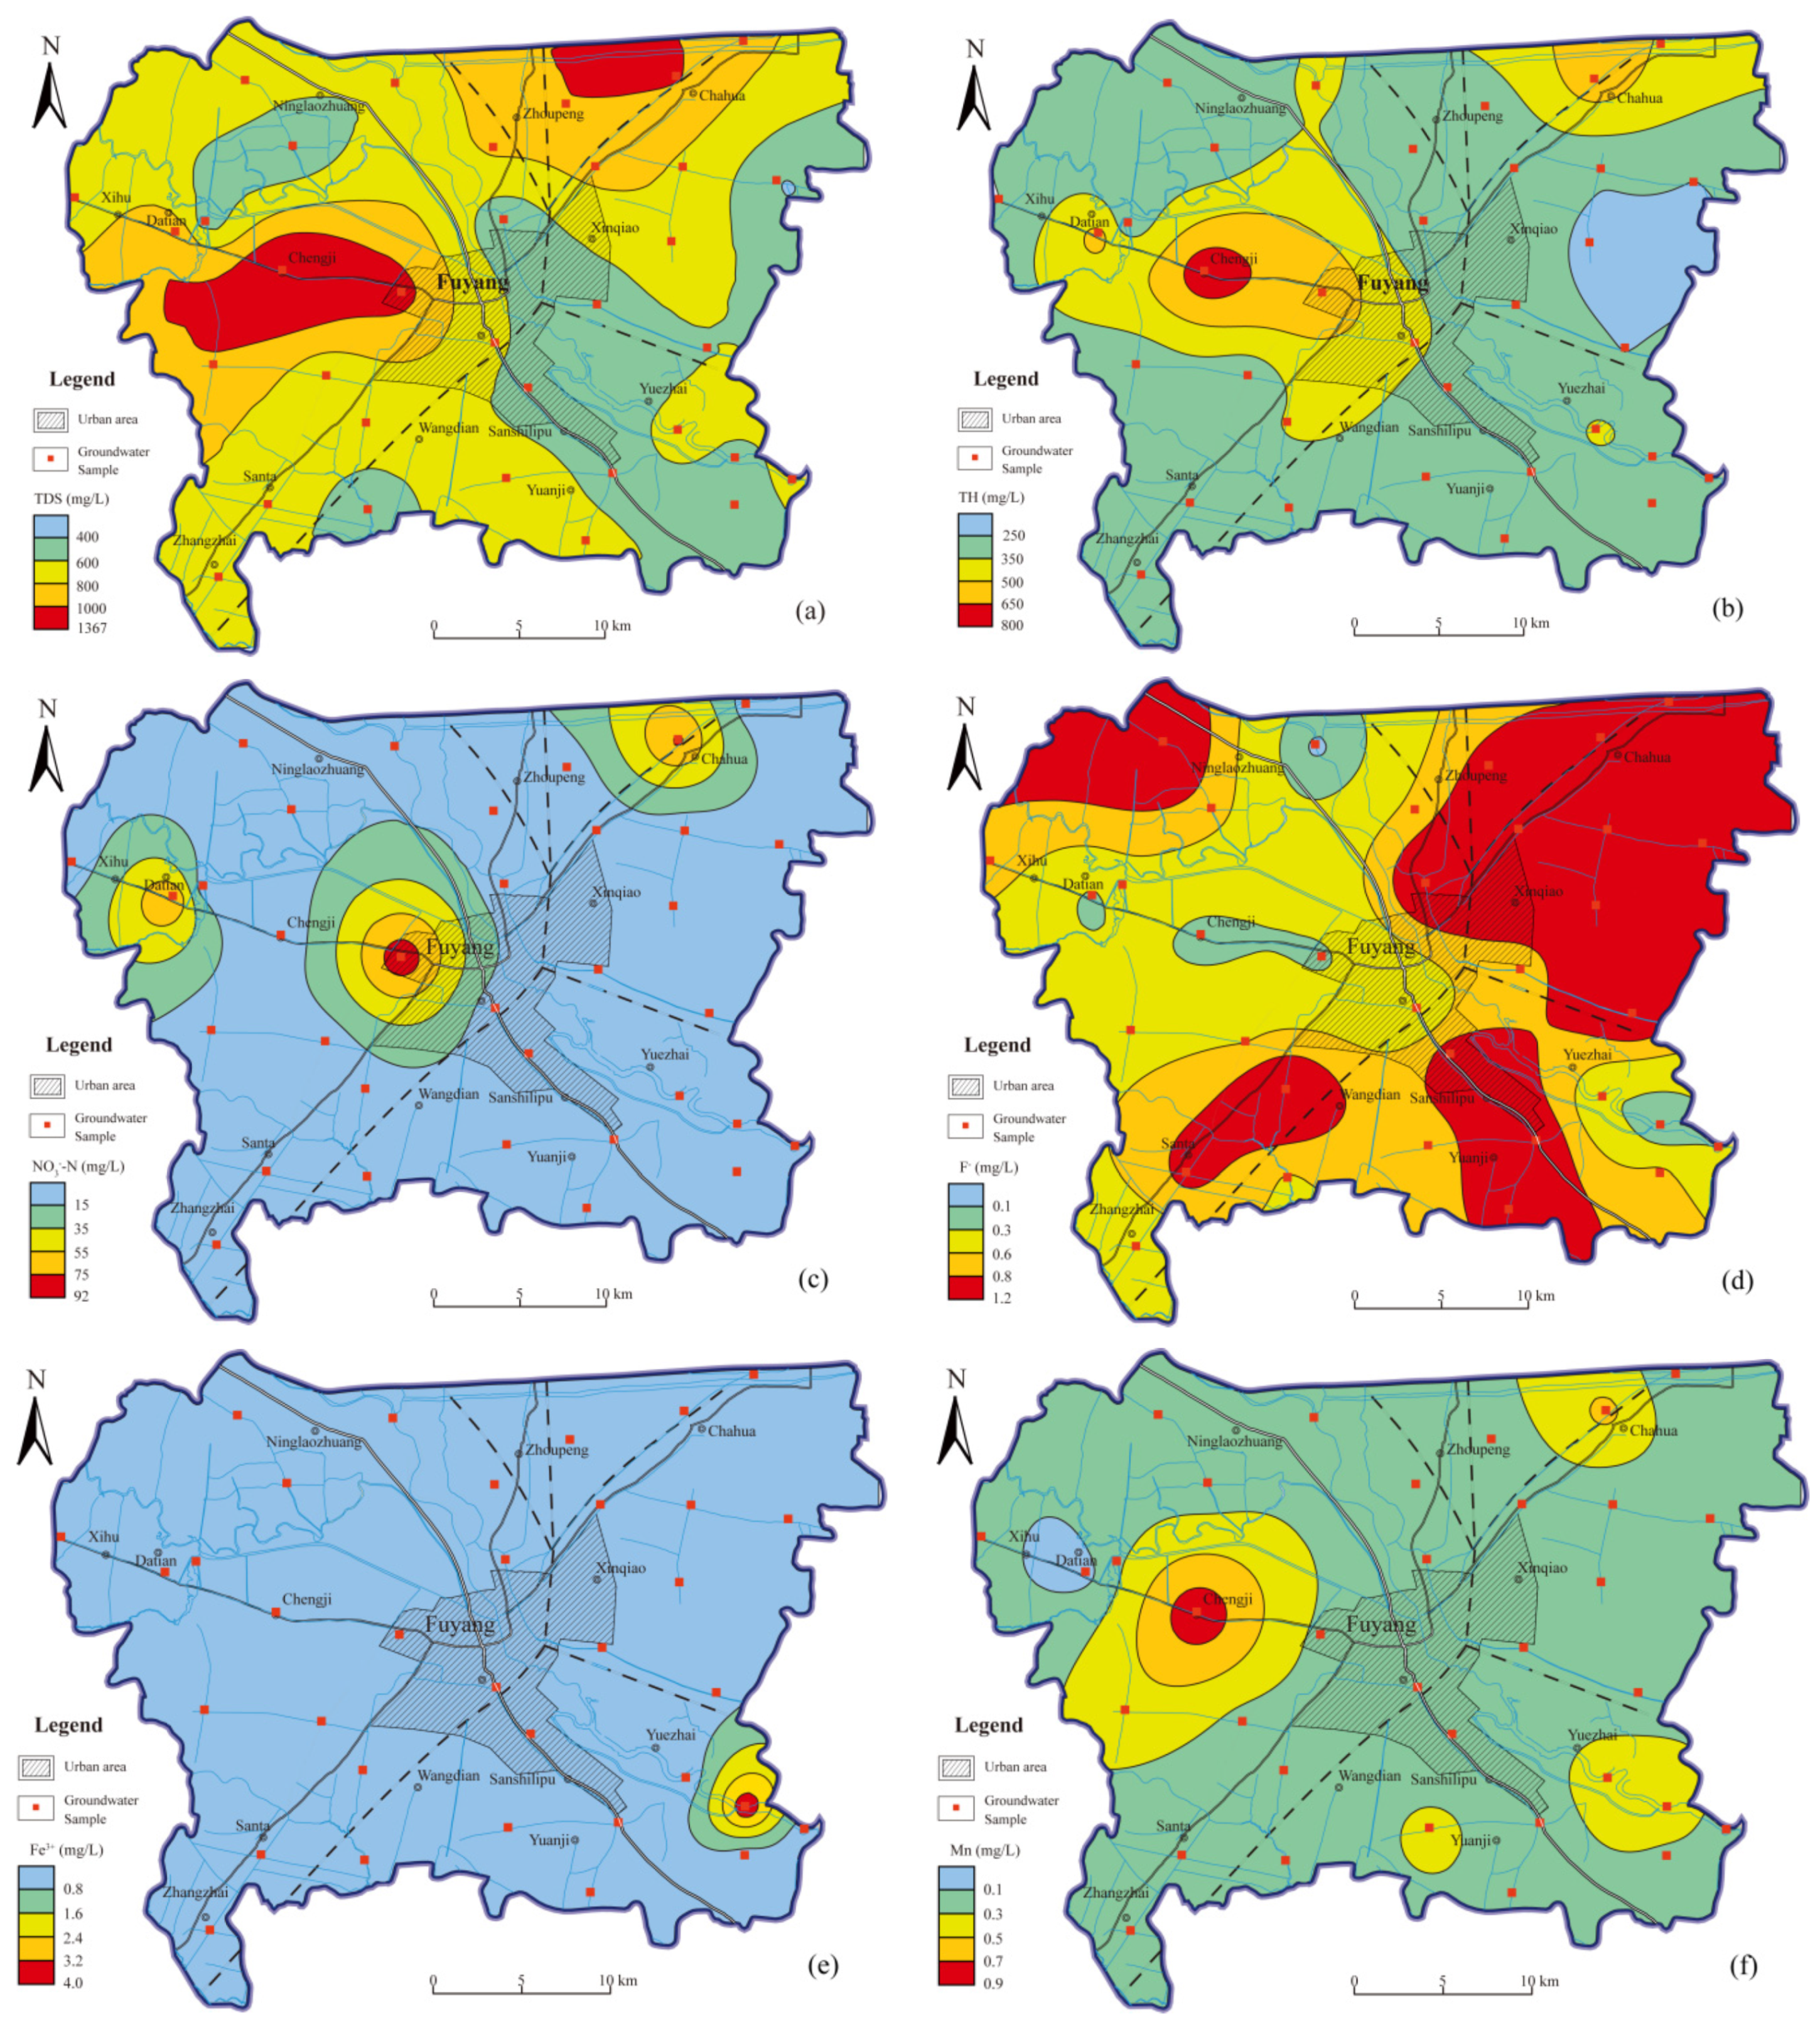
5.1. Nitrogen Pollution in Groundwater and Other Parameters

The groundwater samples of different physicochemical parameters were analyzed, and the concentration of physicochemical parameters such as pH, TDS, TH, K+, Na+, Ca2+, Mg2+, Cl, SO42−, HCO3, NH4-N, NO3-N, NO2-N, F, Fe3+, and Mn were determined, and statistically described in terms of minimum (Min), maximum (Max), mean, standard deviation (SD), and coefficient of variation (CV), as illustrated in Table 2. The national standard prescribes that the limit for pH value of drinking water is 6.5–8.5, while if it is not within the acceptable limit, it causes impacts on human health. As shown in Table 2, the groundwater pH of the study area shows neutral to slightly alkaline ranging values (7.26 to 8.57, averaging at 7.99). The TDS and TH of shallow groundwater samples in the study area ranged between 423.77 and 1366.50 and 194.33 and 785.34 mg/L, averaging at 706.11 and 310.23 mg/L, respectively (see Figure 2b). The spatial distribution of TDS and TH concentration is shown in Figure 3a,b. As shown in Figure 3a,b, both TDS and TH show some high concentration spots in the study area. The highest TDS concentration was observed in Chengji and the northeast part of the area (Figure 3a), and the highest TH was found in Chengji and Chahua (Figure 3b). TDS and TH exceeded recommended limits in nine sample sites and accounted for 11.8 and 14.7% of the entire samples, respectively. Yet, the averages of both TDS and TH were within the prescribed limit, indicating that mixing can effectively control their concentrations, as reported in [15]. The TDS and TH enrichment in groundwater may be due to soluble salts and minerals dissolving into groundwater, and human intervention [8,46,49,55]. As shown in Table 2, the concentrations of major cations, namely K+, Ca2+, and Mg2+, were in the range of 0.28 to 0.72, 44.89 to 222.70, and 17.28 to 73.31, with an average of 0.45, 78.33, and 27.84 mg/L, respectively, signifying that all concentrations were within the acceptable limit. The HCO3 concentration ranged between 266.39 and 821.58 with a means of 458.59 mg/L and it exceeded the recommended value of drinking water quality of WHO standards. Sodium (Na) plays an important role in a certain amount, but the excessive use of Na concentration may lead to various health problems such as hypertension, vomiting, and kidney disorders [55,56]. In this study, Na concentration varied from 20.34 to 184.50 mg/L with an average of 70.65 mg/L and was acceptable for drinking purpose. The concentration of Cl and SO42− anions ranged between 1.77 and 160.23 mg/L and 0.25 and 160.22 mg/L, with an average of 28.52 and 31.99 mg/L, respectively, and both were within the permissible limits of the Chinese standards (250 mg/L for each).
As several researchers have reported, an intensive amount of nitrogenous fertilizer utilization in agricultural practices is one of the most common sources of nitrogen in groundwater [6,8,56]. The results for NH4-N and NO2-N were found to vary from 0.04 to 0.24 and 0.004 to 0.22 mg/L, with a mean of 0.06 and 0.01 mg/L, respectively (see Figure 2a). The range concentration of nitrate-nitrogen reported in this study was varied from 0.5 to 92.44 mg/L, with an average value of 8.25 mg/L (Figure 2b). In this study, high NO3-N pollution of groundwater may be related to extensive agricultural activities. The safeguard limits set for NH4-N, NO3-N, and NO2-N are 0.5, 20, and 1.0 mg/L, respectively, out of which only NO3-N was shown to deviate out and, in turn, can be considered as a major contaminant. The spatial distribution of NO3-N concentration was shown in Figure 3c. As can be seen from Figure 3c, NO3-N concentration is not uniformly distributed in the study region, and also very higher NO3-N concentration was observed in the Datian, Chahua, and Central parts of the area. Three samples (accounting for 8.82%) were beyond acceptable limits according to the national Chinese drinking water standards.
Fluoride in drinking water within the permissible limit (1.0 mg/L) is essential to protect dental caries (tooth decay). However, taking too much fluoride concentration frequently can cause health problems such as dental and skeletal fluorosis [58,59,60,61]. The obtained fluoride water sample ranged between 0.04 and 1.2 mg/L, with a mean of 0.69 mg/L (Figure 2a), and the spatial distribution was shown in Figure 3d. Sites with high concentrations of fluoride were mainly found in the southwest, southeast, northwest, and northeastern parts of the study area. The high concentration of fluoride in groundwater mainly related to lithological reasons and related to fluoride-bearing minerals [62]. Seven samples (20.6% of all samples) exceeded the permissible limit according to the national Chinese drinking water standard in the present study.
Measured values of Fe3+ and Mn were in the range of 0.04–4.02 and 0.01–0.89 mg/L, respectively, whose concentration distributions were shown as in Figure 3e,f. According to the national standard, this stipulates that both Fe3+ and Mn are not meeting the requirement for drinking water (Figure 2a). Eight samples (about 23.5% of the total samples) and thirty samples (about 88.2% of the total samples) for Fe3+ and Mn concentration, respectively, exceeded permissible limits. Fe3+ with high concentrations was mainly distributed in the southeast part of the study area, whereas Mn with high concentrations mainly existed in Chengji, Chahua, and southeast regions. The enrichment of Fe3+ and Mn trace elements in groundwater is considered through natural interactions of water with rocks and soils [34]. Generally, according to the Chinese standard values, pH, TDS, TH, NO3-N, F, Fe3+, and Mn in this study area exceed the standard concentration for drinking purposes [39], and their spatial distributions are depicted in Figure 3.

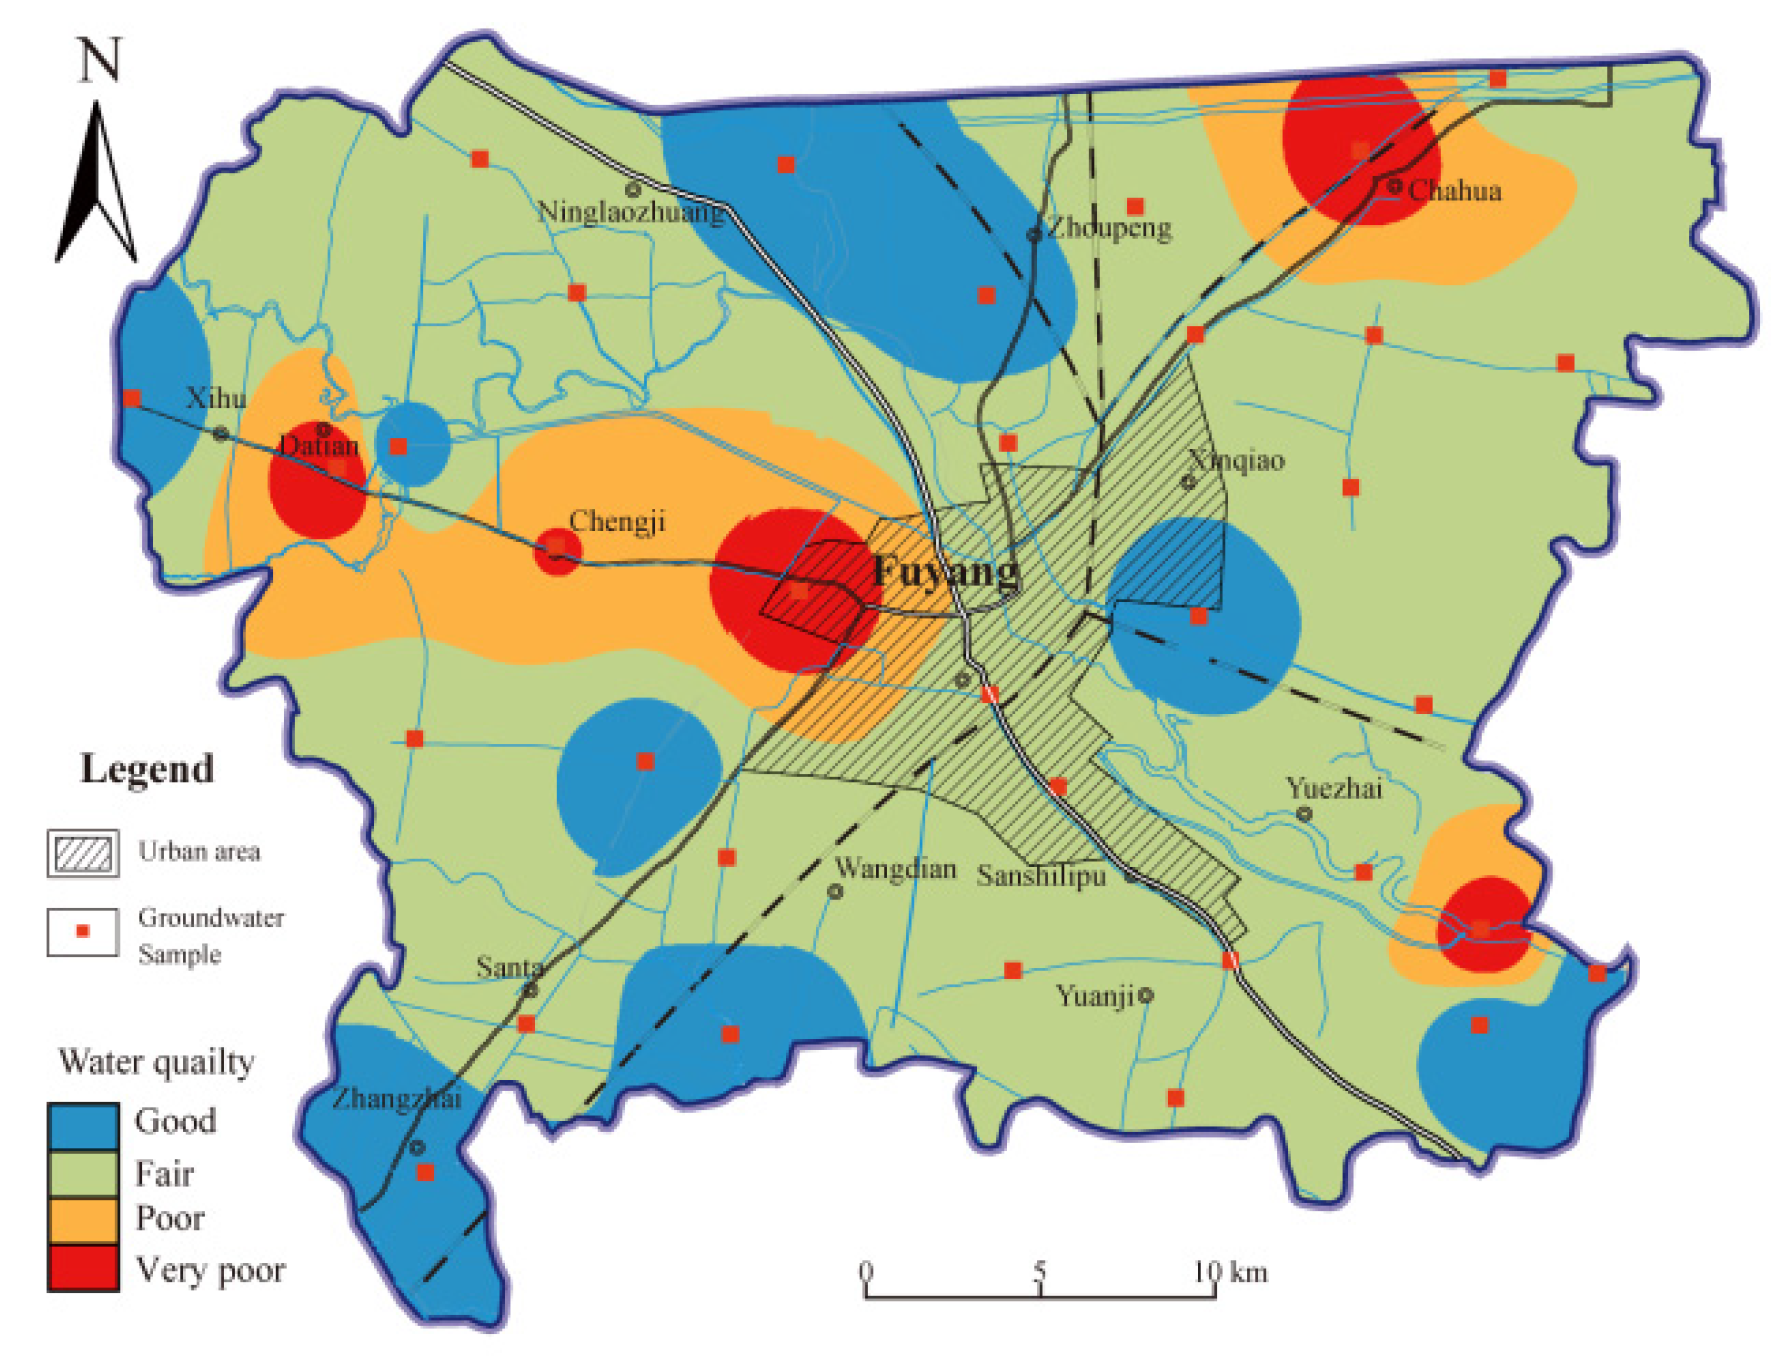
5.2. Groundwater Quality Assessment

Fuzzy comprehensive assessment method was applied to evaluate the overall groundwater quality in this study. The obtained results of NH4-N, NO3-N, NO2-N, Fe3+, Mn, Cl, F, TDS, and TH were selected as parameters to investigate groundwater quality assessment in this study. This selection is based on regular monitoring by local environmental authorities for their critical importance to drinking water quality and their potential impacts on human health [11]. The calculated results are presented in Table 3. As shown in Table 3, the assessment results of the study area exhibit of groundwater samples were classified into grade II, III, IV, and V.
In the present study region, as compared with the Chinese national classification of the groundwater quality standards values, the observed parameters of NO3-N, TH, and Fe3+ content fall within very poor water quality (V) in 8.82, 5.88, and 2.94% of the groundwater samples, respectively, while Mn, Fe3+, F, TDS, and TH come under poor water quality (IV) in 88.24, 20.59, 20.59, 11.76, and 8.82% of the groundwater samples, respectively (Figure 4).
Out of the 34 sampling sites, ten groundwater sampling sites (accounting for 29.4%) belong to grade II (good quality), which is suitable for various purposes. The water quality samples at nineteen sampling sites (about 55.9% of all samples) are classified as grade III (fair quality), which can be used as drinking water with precaution. Only five samples are categorized as poor and very poor quality, accounting for 2.9% and 11.8% of the total groundwater samples, respectively. The poor and very poor quality water is not suitable for drinking, but after proper treatment, it might be used for recreation and irrigation purposes.
The assessment results of groundwater quality were used for spatial interpolation. The spatial distribution of groundwater quality assessment was obtained as shown in Figure 5. As shown in Table 3 and Figure 5, the evaluated groundwater quality of more than half of the total samples, is dominated by fair quality water and may require some treatment measures to improve the quality of drinking water. The main pollutants in deterioration of groundwater quality at sampling site S04 (poor quality) are TH, TDS, and Mn. The very poor quality (S03, S05, S16, and S23,) are severely polluted with NO3-N, TH, TDS, and Fe3+ (Figure 4). In recent years, with the infiltration of fertilizers, discharge of industrial and domestic sewage was the main reason for the increase in NO3-N concentration in groundwater. TH, TDS, Fe3+, and Mn could be both the geogenic process that causes groundwater pollution through water–rock interaction and relatively strong evaporation, and the area with poor and very poor quality water was mainly observed in the Chahua, Datian, Chengji, central and southeast areas.
From the spatial distribution of groundwater quality assessment, we can easily identify the contaminated site and also provide an insight into potentially contaminated areas, in which serious efforts should be taken to mitigate or reduce the deterioration of groundwater quality and to satisfy the municipal groundwater demand. In addition, regular monitoring should be carried out to prevent pollution and consumption by residents. That could be useful for government officials and local residents.

5.3. Health Risk Assessment

Seriously polluted groundwater by nitrogen is unsafe for drinking and poses a high risk to human health. In this study, the concentration of nitrate, nitrite, and ammonium was investigated. As mentioned above, the obtained concentrations of ammonium and nitrite in the present study were within acceptable limits [39,63]. According to the results, only the concentration of nitrate was higher than the acceptable standard values, and therefore, the noncarcinogenic risk assessment through drinking water intake is calculated only for it. The result of the health risk assessment was calculated based on the approach mentioned above. The calculated results of health risk incurred by noncarcinogenic nitrate pollution through drinking water intake are shown in Table 4, for adults and children, respectively.
As shown in Table 4, the range of HQ values of NO3-N for adults is 0.008–1.526, with means of 0.136. For children, it varies from 0.014 to 2.544, with an average value of 0.227. The hazard quotient of nitrate through drinking water intake was higher than the acceptable standards [15,52]. This indicates that NO3-N is the most deleterious effect for high human health risk in the present study. The highest risks of nitrate are 1.526 and 2.544, with the means of 0.136 and 0.227 for adults and children, respectively, which demonstrated that children are more susceptible to groundwater nitrogen contamination as mentioned in Table 3, when the groundwater quality of wells S03, S05, and S16, and categorized as being grade V, which is classified as very poor groundwater quality, was also deemed to be unsuitable for drinking purposes. Also, these three sites will pose noncarcinogenic health risks to adults and children. This indicates that the noncarcinogenic risks of NO3-N in very poor groundwater quality are beyond the permissible limit. Regions of poor and very poor groundwater quality can be targeted for more detailed investigation and tight monitoring programs. On the contrary, the sample sites of S04 and S23 fall under poor and very poor groundwater quality, but the noncarcinogenic health risks of NO3-N were within an acceptable limit. For NO3-N, the HQ values of about 88.2% of all samples were less than 1 for both adults and children when groundwater was classified as good and fair groundwater quality in the present study. In general, compared to the overall groundwater quality assessment results, it can be found that some water samples which are classified as unsuitable water for drinking purposes are not associated with a high risk to adults and children, suggesting that even groundwater with unacceptable quality cannot pose acceptable potential health risks on humans. Therefore, health risk assessment should always be accompanied by overall groundwater quality assessment.
Therefore, government officials and public health workers should pay more attention to groundwater polluted by nitrogen pollution, especially the noncarcinogenic risk induced by nitrate in the present study. Furthermore, the contaminated groundwater should be urgently treated before direct consumption by local residents. Similarly, several studies were conducted with regard to health risk assessment all over the world, which indicates that the noncarcinogenic risk of nitrate via drinking water should be of high concern and cannot be ignored.
In the present study, the content of NO3-N and other chemical components in groundwater was analyzed. Then, the risk assessment results were obtained. Health risk assessment has some sources of uncertainty resulting from parameter and input data uncertainty [15], such as unevenly distributed sampling, sample analyses, and strong spatial variability of groundwater quality. Despite uncertainty in health risk assessment due to the uncertainty of parameters and input data, the research results are still of significance and practical value for scientific decision-making. For instance, Chen et al. used the USEPA human health risk assessment method to evaluate health risks of nitrate contamination in an agricultural area of Ningxia, northwest China, only by drinking water pathways to humans [6]. They found that eight and four collected samples would have unacceptable noncarcinogenic risks for infants and adults, respectively. Similarly, Su et al. (2018) conducted a detailed study on the health risk of nitrogen pollution in the Shenfu mining area. They found that 30.3% and 40.8% of all collected samples have noncarcinogenic risk exceeding the permissible limit recommended by the USEPA for adults and children, respectively. The study results are valid and meaningful, despite these uncertain factors in the research process and results.

6. Conclusions

In this study, 34 groundwater samples from Fuyang City were collected and analyzed for physicochemical parameters based on national technical regulations. The overall groundwater quality assessment was conducted using fuzzy comprehensive assessment method, and the noncarcinogenic health risk due to groundwater pollution was assessed for adults and children through drinking water intake.
The pH values of shallow groundwater in this study area are generally neutral to slightly alkaline in nature. The TDS and TH fall under the brackish and very-hard water category, accounting for 11.8% and 14.7% of total samples, respectively, and very-higher concentration was found in Chengji and the northeast part of the area. According to the national groundwater quality standards, the analyzed parameter of water samples of pH, TDS, TH, NO3-N, F, Fe3+, and Mn were beyond the acceptable limits for drinking purposes. The results revealed that the concentrations of K+, Na+, Ca2+, Mg2+, Cl, SO42−, HCO3, NH4-N, and NO2-N of groundwater samples were within acceptable limits. In the study, the concentration of NO3-N ranged from 0.5 to 92.4 mg/L; 8.8% of groundwater samples were above the acceptable limit, which mainly results from extensive agricultural activities in the region. Hence, higher NO3-N concentrations were mainly distributed in the Datian, Chahua, and central part of the study area.
The map of evaluated groundwater quality results was categorized into four regions, in which 29.4%, 55.9%, 2.9%, and 11.8% of the area belong to good, fair, poor, and very poor quality water, respectively. The good and fair quality water can be used for drinking purposes, but poor and very poor quality water is unsuitable for drinking and requires deep treatment before utilization. The poor and very poor quality groundwater were mainly collected from the Chahua, Datian, Chengji, central and southeast areas, which are not recommended to be the water-source region for the study area. NO3-N, TH, TDS, Fe3+, and Mn are the major pollutants in the study area determined through fuzzy comprehensive evaluation, which mainly originates from natural and anthropogenic activities.
Nitrogen pollution of groundwater can have a potential negative impact on the health of the local residents through drinking water intake, particularly nitrate-nitrogen in the present study area. The noncarcinogenic risk of nitrate-nitrogen ranges from 0.008 to 1.526 and from 0.014 to 2.544 with the means of 0.136 and 0.227 for adults and children, respectively. This indicates that children are more susceptible to nitrate-nitrogen pollution. In addition, nitrate-nitrogen contributes the most to human risk in this study, which requires more attention from authorities and decision-makers. Therefore, polluted groundwater should be urgently treated before direct consumption by local residents.

Author Contributions

All authors contributed to the results of this work. N.K.W. wrote the original draft; L.M. designed the research and revised the manuscript; J.L. surveyed the hydrogeological conditions and sampled groundwater; T.H. drew maps; Q.L. analyzed the data; J.Q. improved the manuscript with constructive discussions. All authors have read and agreed to the published version of the manuscript.

Funding

This research was financially supported by the National Natural Science Foundation of China (No. 41831289 and 41772250) and the Science and Technology Project of Land and Resources of Anhui Province (2016-k-11).

Acknowledgments

Authors are also grateful to anonymous reviewers for their extremely valuable comments and suggestions to improve the quality of the paper.

Conflicts of Interest

The authors declare no conflict of interest.

References

  1. Zabala, M.E.; Martínez, S.; Manzano, M.; Vives, L. Groundwater chemical baseline values to assess the Recovery Plan in the Matanza-Riachuelo River basin, Argentina. Sci. Total Environ. 2016, 541, 1516–1530. [Google Scholar] [CrossRef]
  2. Li, P.; He, X.; Li, Y.; Xiang, G. Occurrence and health implication of fluoride in groundwater of Loess Aquifer in the Chinese Loess Plateau: A case study of Tongchuan, Northwest China. Expo. Health 2018, 11, 95–107. [Google Scholar] [CrossRef]
  3. Zhang, Q.; Xu, P.; Qian, H. Groundwater quality assessment using improved water quality index (WQI) and human health risk (HHR) evaluation in a semi-arid region of Northwest China. Expo. Health 2020, 1–14. [Google Scholar] [CrossRef]
  4. Connor, R. The United Nations World Water Development Report 2015: Water for a Sustainable World; UNESCO Publishing: Paris, France, 2015; Volume 1. [Google Scholar]
  5. Yin, S.; Xiao, Y.; Han, P.; Hao, Q.; Gu, X.; Men, B.; Huang, L. Investigation of groundwater contamination and health implications in a typical semiarid basin of North China. Water 2020, 12, 1137. [Google Scholar] [CrossRef] [Green Version]
  6. Chen, J.; Wu, H.; Qian, H. Groundwater nitrate contamination and associated health risk for the rural communities in an agricultural area of Ningxia, Northwest China. Expo. Health 2016, 8, 349–359. [Google Scholar] [CrossRef]
  7. Subba Rao, N.; Marghade, D.; Dinakar, A.; Chandana, I.; Sunitha, B.; Ravindra, B.; Balaji, T. Geochemical characteristics and controlling factors of chemical composition of groundwater in a part of Guntur district, Andhra Pradesh, India. Environ. Earth Sci. 2017, 76, 747. [Google Scholar] [CrossRef]
  8. Adimalla, N. Controlling factors and mechanism of groundwater quality variation in semiarid region of South India: An approach of water quality index (WQI) and health risk assessment (HRA). Environ. Geochem. Health 2019, 42, 1–28. [Google Scholar] [CrossRef]
  9. Amalraj, A.; Pius, A. Health risk from fluoride exposure of a population in selected areas of Tamil Nadu South India. Food Sci. Hum. Wellness 2013, 2, 75–86. [Google Scholar] [CrossRef] [Green Version]
  10. He, S.; Wu, J. Hydrogeochemical characteristics, groundwater quality, and health risks from hexavalent chromium and nitrate in groundwater of Huanhe formation in Wuqi County, Northwest China. Expo. Health 2018, 11, 125–137. [Google Scholar] [CrossRef]
  11. Mohamed, A.K.; Liu, D.; Mohamed, M.A.A.; Song, K. Groundwater quality assessment of the quaternary unconsolidated sedimentary basin near the Pi river using fuzzy evaluation technique. Appl. Water Sci. 2018, 8. [Google Scholar] [CrossRef] [Green Version]
  12. Wu, J.; Zhou, H.; He, S.; Zhang, Y. Comprehensive understanding of groundwater quality for domestic and agricultural purposes in terms of health risks in a coal mine area of the Ordos basin, north of the Chinese Loess Plateau. Environ. Earth Sci. 2019, 78, 446. [Google Scholar] [CrossRef]
  13. Feng, L.; Sang, G.; Hong, W. Statistical prediction of changes in water resources trends based on set pair analysis. Water Resour. Manag. 2014, 28, 1703–1711. [Google Scholar] [CrossRef]
  14. Tian, R.; Wu, J. Groundwater quality appraisal by improved set pair analysis with game theory weightage and health risk estimation of contaminants for Xuecha drinking water source in a loess area in Northwest China. Hum. Ecol. Risk Assess. Int. J. 2019, 25, 132–157. [Google Scholar] [CrossRef]
  15. Li, P.; Li, X.; Meng, X.; Li, M.; Zhang, Y. Appraising groundwater quality and health risks from contamination in a Semiarid region of Northwest China. Expo. Health 2016, 8, 361–379. [Google Scholar] [CrossRef]
  16. Li, P.; He, S.; He, X.; Tian, R. Seasonal hydrochemical characterization and groundwater quality delineation based on matter element extension analysis in a paper wastewater irrigation area, northwest China. Expo. Health 2018, 10, 241–258. [Google Scholar] [CrossRef]
  17. Rabeiy, R.E. Assessment and modeling of groundwater quality using WQI and GIS in Upper Egypt area. Environ. Sci. Pollut. Res. 2018, 25, 30808–30817. [Google Scholar] [CrossRef] [PubMed]
  18. Zhang, B.; Song, X.; Zhang, Y.; Han, D.; Tang, C.; Yu, Y.; Ma, Y. Hydrochemical characteristics and water quality assessment of surface water and groundwater in Songnen plain, Northeast China. Water Res. 2012, 46, 2737–2748. [Google Scholar] [CrossRef]
  19. Mujumdar, P.; Sasikumar, K. A fuzzy risk approach for seasonal water quality management of a river system. Water Resour. Res. 2002, 38, 5-1–5-9. [Google Scholar] [CrossRef] [Green Version]
  20. Rapant, S.; Cveckova, V.; Fajcikova, K.; Sedlakova, D.; Stehlikova, B. Impact of calcium and magnesium in groundwater and drinking water on the health of inhabitants of the Slovak Republic. Int. J. Environ. Res. Public Health 2017, 14, 278. [Google Scholar] [CrossRef]
  21. Gao, Y.; Yu, G.; Luo, C.; Zhou, P. Groundwater nitrogen pollution and assessment of its health risks: A case study of a typical village in rural-urban continuum, China. PLoS ONE 2012, 7, e33982. [Google Scholar] [CrossRef] [Green Version]
  22. Adimalla, N. Spatial distribution, exposure, and potential health risk assessment from nitrate in drinking water from semi-arid region of South India. Hum. Ecol. Risk Assess. Int. J. 2020, 26, 310–334. [Google Scholar] [CrossRef]
  23. Chica-Olmo, M.; Peluso, F.; Luque-Espinar, J.A.; Rodriguez-Galiano, V.; Pardo-Iguzquiza, E.; Chica-Rivas, L. A methodology for assessing public health risk associated with groundwater nitrate contamination: A case study in an agricultural setting (southern Spain). Environ. Geochem. Health 2017, 39, 1117–1132. [Google Scholar] [CrossRef] [PubMed]
  24. Elisante, E.; Muzuka, A.N.N. Occurrence of nitrate in Tanzanian groundwater aquifers: A review. Appl. Water Sci. 2015, 7, 71–87. [Google Scholar] [CrossRef] [Green Version]
  25. Hudak, P. Regional trends in nitrate content of Texas groundwater. J. Hydrol. 2000, 228, 37–47. [Google Scholar] [CrossRef]
  26. Rahmati, O.; Samani, A.N.; Mahmoodi, N.; Mahdavi, M. Assessment of the contribution of N-fertilizers to nitrate pollution of groundwater in western Iran (Case study: Ghorveh–Dehgelan aquifer). Water Qual. Expo. Health 2015, 7, 143–151. [Google Scholar] [CrossRef]
  27. Li, P.; Wu, J.; Qian, H.; Lyu, X.; Liu, H. Origin and assessment of groundwater pollution and associated health risk: A case study in an industrial park, northwest China. Environ. Geochem. Health 2014, 36, 693–712. [Google Scholar] [CrossRef]
  28. Wu, J.; Sun, Z. Evaluation of shallow groundwater contamination and associated human health risk in an Alluvial Plain impacted by agricultural and industrial activities, Mid-west China. Expo. Health 2015, 8, 311–329. [Google Scholar] [CrossRef]
  29. Carey, R.O.; Migliaccio, K.W.; Brown, M.T. Nutrient discharges to Biscayne Bay, Florida: Trends, loads, and a pollutant index. Sci. Total Environ. 2011, 409, 530–539. [Google Scholar] [CrossRef]
  30. Ji, X.; Xie, R.; Hao, Y.; Lu, J. Quantitative identification of nitrate pollution sources and uncertainty analysis based on dual isotope approach in an agricultural watershed. Environ. Pollut. 2017, 229, 586–594. [Google Scholar] [CrossRef]
  31. Wu, J.; Lu, J.; Wen, X.; Zhang, Z.; Lin, Y. Severe nitrate pollution and health risks of coastal aquifer simultaneously influenced by saltwater intrusion and intensive anthropogenic activities. Arch. Environ. Contam. Toxicol. 2019, 77, 79–87. [Google Scholar] [CrossRef]
  32. Bao, Z.; Hu, Q.; Qi, W.; Tang, Y.; Wang, W.; Wan, P.; Chao, J.; Yang, X.J. Nitrate reduction in water by aluminum alloys particles. J. Environ. Manag. 2017, 196, 666–673. [Google Scholar] [CrossRef] [PubMed]
  33. Golekar, R.B.; Patil, S.N.; Baride, M. Human health risk due to trace element contamination in groundwater from the Anjani and Jhiri river catchment area in northern Maharashtra, India. Earth Sci. Res. J. 2013, 17, 17–23. [Google Scholar]
  34. Bempah, C.K.; Ewusi, A. Heavy metals contamination and human health risk assessment around Obuasi gold mine in Ghana. Environ. Monit. Assess. 2016, 188, 261. [Google Scholar] [CrossRef] [PubMed]
  35. Li, P.; Feng, W.; Xue, C.; Tian, R.; Wang, S. Spatiotemporal variability of contaminants in lake water and their risks to human health: A case study of the Shahu Lake tourist area, Northwest China. Expo. Health 2017, 9, 213–225. [Google Scholar] [CrossRef]
  36. Batayneh, A. Toxic (aluminum, beryllium, boron, chromium and zinc) in groundwater: Health risk assessment. Int. J. Environ. Sci. Technol. 2012, 9, 153–162. [Google Scholar] [CrossRef]
  37. Ryu, H.; Han, J.K.; Jung, J.W.; Bae, B.; Nam, K. Human health risk assessment of explosives and heavy metals at a military gunnery range. Environ. Geochem. Health 2007, 29, 259–269. [Google Scholar] [CrossRef]
  38. Su, X.; Wang, H.; Zhang, Y. Health risk assessment of nitrate contamination in groundwater: A case study of an agricultural area in Northeast China. Water Resour. Manag. 2013, 27, 3025–3034. [Google Scholar] [CrossRef]
  39. General Administration of Quality Supervision, Inspection and Quarantine of the People’s Republic of China; Standardization Administration of China. Standards for Groundwater Quality (GB/T 14848-2017); Standards Press of China: Beijing, China, 2017. (In Chinese)
  40. Rezaei, H.; Jafari, A.; Kamarehie, B.; Fakhri, Y.; Ghaderpoury, A.; Karami, M.A.; Ghaderpoori, M.; Shams, M.; Bidarpoor, F.; Salimi, M. Health-risk assessment related to the fluoride, nitrate, and nitrite in the drinking water in the Sanandaj, Kurdistan County, Iran. Hum. Ecol. Risk Assess. Int. J. 2018, 25, 1242–1250. [Google Scholar] [CrossRef]
  41. Qasemi, M.; Afsharnia, M.; Farhang, M.; Bakhshizadeh, A.; Allahdadi, M.; Zarei, A. Health risk assessment of nitrate exposure in groundwater of rural areas of Gonabad and Bajestan, Iran. Environ. Earth Sci. 2018, 77, 551. [Google Scholar] [CrossRef]
  42. Ferchichi, H.; Ben Hamouda, M.F.; Farhat, B.; Ben Mammou, A. Assessment of groundwater salinity using GIS and multivariate statistics in a coastal Mediterranean aquifer. Int. J. Environ. Sci. Technol. 2018, 15, 2473–2492. [Google Scholar] [CrossRef]
  43. El-Hames, A.S.; Al-Ahmadi, M.; Al-Amri, N. A GIS approach for the assessment of groundwater quality in Wadi Rabigh aquifer, Saudi Arabia. Environ. Earth Sci. 2010, 63, 1319–1331. [Google Scholar] [CrossRef]
  44. Islam, A.R.M.T.; Shen, S.; Haque, M.A.; Bodrud-Doza, M.; Maw, K.W.; Habib, M.A. Assessing groundwater quality and its sustainability in Joypurhat district of Bangladesh using GIS and multivariate statistical approaches. Environ. Dev. Sustain. 2017, 20, 1935–1959. [Google Scholar] [CrossRef]
  45. Ma, L.; Qian, J.; Yan, X.; Luo, Q.; Chen, L.; Zhao, W. Using GIS methods for determining the spatial distribution of groundwater hydrochemical facies: A case study for a shallow aquifer in Fuyang, China. Environ. Earth Sci. 2019, 78, 335. [Google Scholar] [CrossRef]
  46. Mohamed, A.K.; Dan, L.; Kai, S.; Mohamed, M.A.A.; Aldaw, E.; Elubid, B.A. Hydrochemical analysis and fuzzy logic method for evaluation of groundwater quality in the North Chengdu Plain, China. Int. J. Environ. Res. Public Health 2019, 16, 302. [Google Scholar] [CrossRef] [PubMed] [Green Version]
  47. Dahiya, S.; Singh, B.; Gaur, S.; Garg, V.K.; Kushwaha, H.S. Analysis of groundwater quality using fuzzy synthetic evaluation. J. Hazard. Mater. 2007, 147, 938–946. [Google Scholar] [CrossRef] [PubMed]
  48. Zhang, X.-H. A study on the water environmental quality assessment of Fenjiang River in Yaan city of Sichuan Province in China. IERI Procedia 2014, 9, 102–109. [Google Scholar] [CrossRef] [Green Version]
  49. Su, H.; Kang, W.; Xu, Y.; Wang, J. Assessing groundwater quality and health risks of nitrogen pollution in the Shenfu mining area of Shaanxi Province, Northwest China. Expo. Health 2017, 10, 77–97. [Google Scholar] [CrossRef]
  50. Su, H.; Kang, W.; Xu, Y.; Wang, J. Evaluation of groundwater quality and health risks from contamination in the north edge of the Loess Plateau, Yulin City, Northwest China. Environ. Earth Sci. 2017, 76, 467. [Google Scholar] [CrossRef]
  51. MEP. Technical Guidelines for Risk Assessment of Contaminated Sites; HJ 25.3-2014; China Environmental Science Press: Beijing, China, 2014. (In Chinese) [Google Scholar]
  52. USEPA. Risk Assessment Guidance for Superfund: Human Health Evaluation Manual (Part A); Office of Emergency and Remedial Response: Washington, DC, USA, 1989; Volume 1.
  53. Ji, Y.; Wu, J.; Wang, Y.; Elumalai, V.; Subramani, T. Seasonal variation of drinking water quality and human health risk assessment in Hancheng City of Guanzhong Plain, China. Expo. Health 2020, 12, 469–485. [Google Scholar] [CrossRef]
  54. Li, P. Groundwater quality in Western China: Challenges and paths forward for groundwater quality research in Western China. Expo. Health 2016, 8, 305–310. [Google Scholar] [CrossRef] [Green Version]
  55. Amalraj, A.; Pius, A. Assessment of groundwater quality for drinking and agricultural purposes of a few selected areas in Tamil Nadu, South India: A GIS-based study. Sustain. Water Resour. Manag. 2017, 4, 1–21. [Google Scholar] [CrossRef]
  56. Adimalla, N.; Qian, H. Groundwater quality evaluation using water quality index (WQI) for drinking purposes and human health risk (HHR) assessment in an agricultural region of Nanganur, south India. Ecotoxicol. Environ. Saf. 2019, 176, 153–161. [Google Scholar] [CrossRef]
  57. Raju, A.; Singh, A. Assessment of groundwater quality and mapping human health risk in Central Ganga Alluvial Plain, Northern India. Environ. Process. 2017, 4, 375–397. [Google Scholar] [CrossRef]
  58. Haji, M.; Wang, D.; Li, L.; Qin, D.; Guo, Y. Geochemical evolution of fluoride and implication for F—Enrichment in groundwater: Example from the Bilate River Basin of Southern Main Ethiopian Rift. Water 2018, 10, 1799. [Google Scholar] [CrossRef] [Green Version]
  59. Adimalla, N.; Li, P. Occurrence, health risks, and geochemical mechanisms of fluoride and nitrate in groundwater of the rock-dominant semi-arid region, Telangana State, India. Hum. Ecol. Risk Assess. Int. J. 2018, 25, 81–103. [Google Scholar] [CrossRef]
  60. Mukherjee, I.; Singh, U.K. Groundwater fluoride contamination, probable release, and containment mechanisms: A review on Indian context. Environ. Geochem. Health 2018, 40, 2259–2301. [Google Scholar] [CrossRef] [PubMed]
  61. Narsimha, A.; Rajitha, S. Spatial distribution and seasonal variation in fluoride enrichment in groundwater and its associated human health risk assessment in Telangana State, South India. Hum. Ecol. Risk Assess. Int. J. 2018, 24, 2119–2132. [Google Scholar] [CrossRef]
  62. Xiao, J.; Jin, Z.; Zhang, F. Geochemical controls on fluoride concentrations in natural waters from the middle Loess Plateau, China. J. Geochem. Explor. 2015, 159, 252–261. [Google Scholar] [CrossRef]
  63. WHO. Guidelines for Drinking-Water Quality: Fourth Edition Incorporating the First Addendum; World Health Organization: Geneva, Switzerland, 2017. [Google Scholar]
Figure 1. Map of the study area and location of shallow groundwater sampling sites.
Water 12 03341 g001
Figure 2. Box plots with respect to the reference Chinese national standards values for the selective chemical parameters (in mg/L) of the groundwater. (a) concentrations of relatively low-content chemical constituents; (b) concentrations of relatively high-content chemical constituents.
Water 12 03341 g002
Figure 3. Spatial distribution of contaminants in groundwater: (a) TDS, (b) TH, (c) NO3-N, (d) F, (e) Fe3+, and (f) Mn.
Water 12 03341 g003
Figure 4. Percentage of the shallow groundwater samples for drinking purposes in five water quality categories.
Water 12 03341 g004
Figure 5. Spatial distribution of shallow groundwater quality based on fuzzy comprehensive assessment result.
Water 12 03341 g005
Table 1. Classification of quality of groundwater according to national Chinese standard [39].
VariablesGrades
IIIIIIIVV
NH4-N≤0.02≤0.1≤0.5≤1.5>1.5
NO3-N≤2≤5≤20≤30>30
NO2-N≤0.01≤0.1≤1≤4.8>4.8
Fe3+≤0.1≤0.2≤0.3≤2>2
Mn≤0.05≤0.05≤0.1≤1.5>1.5
Cl≤50≤150≤250≤350>350
F≤0.2≤0.5≤1≤2>2
TDS≤300≤500≤1000≤2000>2000
TH≤150≤300≤450≤550>550
Water qualityExcellentGoodFairPoorVery poor
Table 2. Statistical analysis of the physicochemical parameters of shallow groundwater samples in the study area.
VariableUnitMinMaxMeanSDCVChinese StandardWHO
pH-7.268.577.990.280.046.5–8.56.5–8.5
TDSmg/L423.771366.50706.11218.310.3110001500
THmg/L194.33785.34310.23142.090.46450500
K+mg/L0.280.720.450.120.26-12 **
Na+mg/L20.34184.5070.6544.040.62200200
Ca2+mg/L44.89222.7078.3343.480.56400 ***-
Mg2+mg/L17.2873.3127.8412.350.44-150 **
Clmg/L1.77160.2328.5239.231.38250250
SO42–mg/L0.25160.2231.9940.631.27250250
HCO3mg/L266.39821.57458.89116.130.25-600 **
NH4-Nmg/L0.040.240.060.050.910.50.5
NO3-Nmg/L0.5092.448.2523.952.902050
NO2-Nmg/L0.004 *0.220.010.043.0413
Fmg/L0.04 *1.200.690.330.4811.5
Fe3+mg/L0.04 *4.020.300.682.310.30.3
Mnmg/L0.01 *0.890.230.170.730.10.1
*: limit value of detection; ** refer to [57]; *** refer to [49].
Table 3. Assessment results of shallow groundwater quality based on fuzzy comprehensive approach.
SampleMembership DegreeGradeWater Quality
j = Ⅰj = Ⅱj = Ⅲj = Ⅳj = Ⅴ
S010.1690.4610.3650.0050.000good
S020.1600.6300.1700.0400.000good
S030.0750.0310.1180.1620.614very poor
S040.0600.1190.1060.3990.316poor
S050.0570.0390.1310.0700.703very poor
S060.1860.5420.2510.0210.000good
S070.1800.2610.4680.0920.000fair
S080.0940.4370.3710.0980.000good
S090.1370.4070.4540.0020.000fair
S100.1220.3000.4980.0800.000fair
S110.2240.3770.3820.0170.000fair
S120.0380.3080.5590.0950.000fair
S130.0750.4970.4010.0260.000good
S140.1610.1990.6330.0080.000fair
S150.0550.2230.6220.1000.000fair
S160.0270.0790.2020.1230.570very poor
S170.1810.2010.4540.1650.000fair
S180.1680.2100.6170.0050.000fair
S190.2300.2290.4480.0920.000fair
S200.2030.2960.5010.0000.000fair
S210.2280.2500.4340.0880.000fair
S220.1440.2080.5740.0740.000fair
S230.0260.1530.0970.0570.667very poor
S240.1300.3610.4050.1040.000fair
S250.2510.4630.2710.0150.000good
S260.2050.4030.3930.0000.000good
S270.1290.5210.2790.0710.000good
S280.0710.3680.4520.1080.000fair
S290.1740.3350.4690.0220.000fair
S300.1500.5650.2620.0230.000good
S310.1920.5970.2020.0090.000good
S320.1800.4050.4120.0020.000fair
S330.2170.2880.4560.0390.000fair
S340.2350.3310.4320.0020.000fair
Table 4. The exposure dosage through drinking water intake (E) and the hazard quotient of nitrate-nitrogen (mg/L) for the drinking water in Fuyang City.
SampleNitrate-NitrogenRfDEHQ
AdultChildAdultChild
S010.51.60.0130.0220.0080.014
S020.51.60.0130.0220.0080.014
S0378.661.62.0773.4631.2982.164
S040.561.60.0150.0250.0090.015
S0592.441.62.4414.0701.5262.544
S060.51.60.0130.0220.0080.014
S070.51.60.0130.0220.0080.014
S080.51.60.0130.0220.0080.014
S090.51.60.0130.0220.0080.014
S103.171.60.0840.1400.0520.087
S110.51.60.0130.0220.0080.014
S120.51.60.0130.0220.0080.014
S136.941.60.1830.3060.1150.191
S140.51.60.0130.0220.0080.014
S154.731.60.1250.2080.0780.130
S1680.181.62.1173.5301.3232.206
S170.51.60.0130.0220.0080.014
S180.51.60.0130.0220.0080.014
S190.51.60.0130.0220.0080.014
S200.51.60.0130.0220.0080.014
S210.51.60.0130.0220.0080.014
S220.51.60.0130.0220.0080.014
S230.51.60.0130.0220.0080.014
S240.521.60.0140.0230.0090.014
S250.51.60.0130.0220.0080.014
S260.51.60.0130.0220.0080.014
S270.51.60.0130.0220.0080.014
S280.51.60.0130.0220.0080.014
S290.51.60.0130.0220.0080.014
S300.51.60.0130.0220.0080.014
S310.691.60.0180.0300.0110.019
S320.651.60.0170.0290.0110.018
S330.51.60.0130.0220.0080.014
S340.51.60.0130.0220.0080.014
Publisher’s Note: MDPI stays neutral with regard to jurisdictional claims in published maps and institutional affiliations.

