Predicting the Water Requirement for Rice Production as Affected by Projected Climate Change in Bihar, India

 ,
,  , and
, and
Abstract
1. Introduction
2. Material and Methods
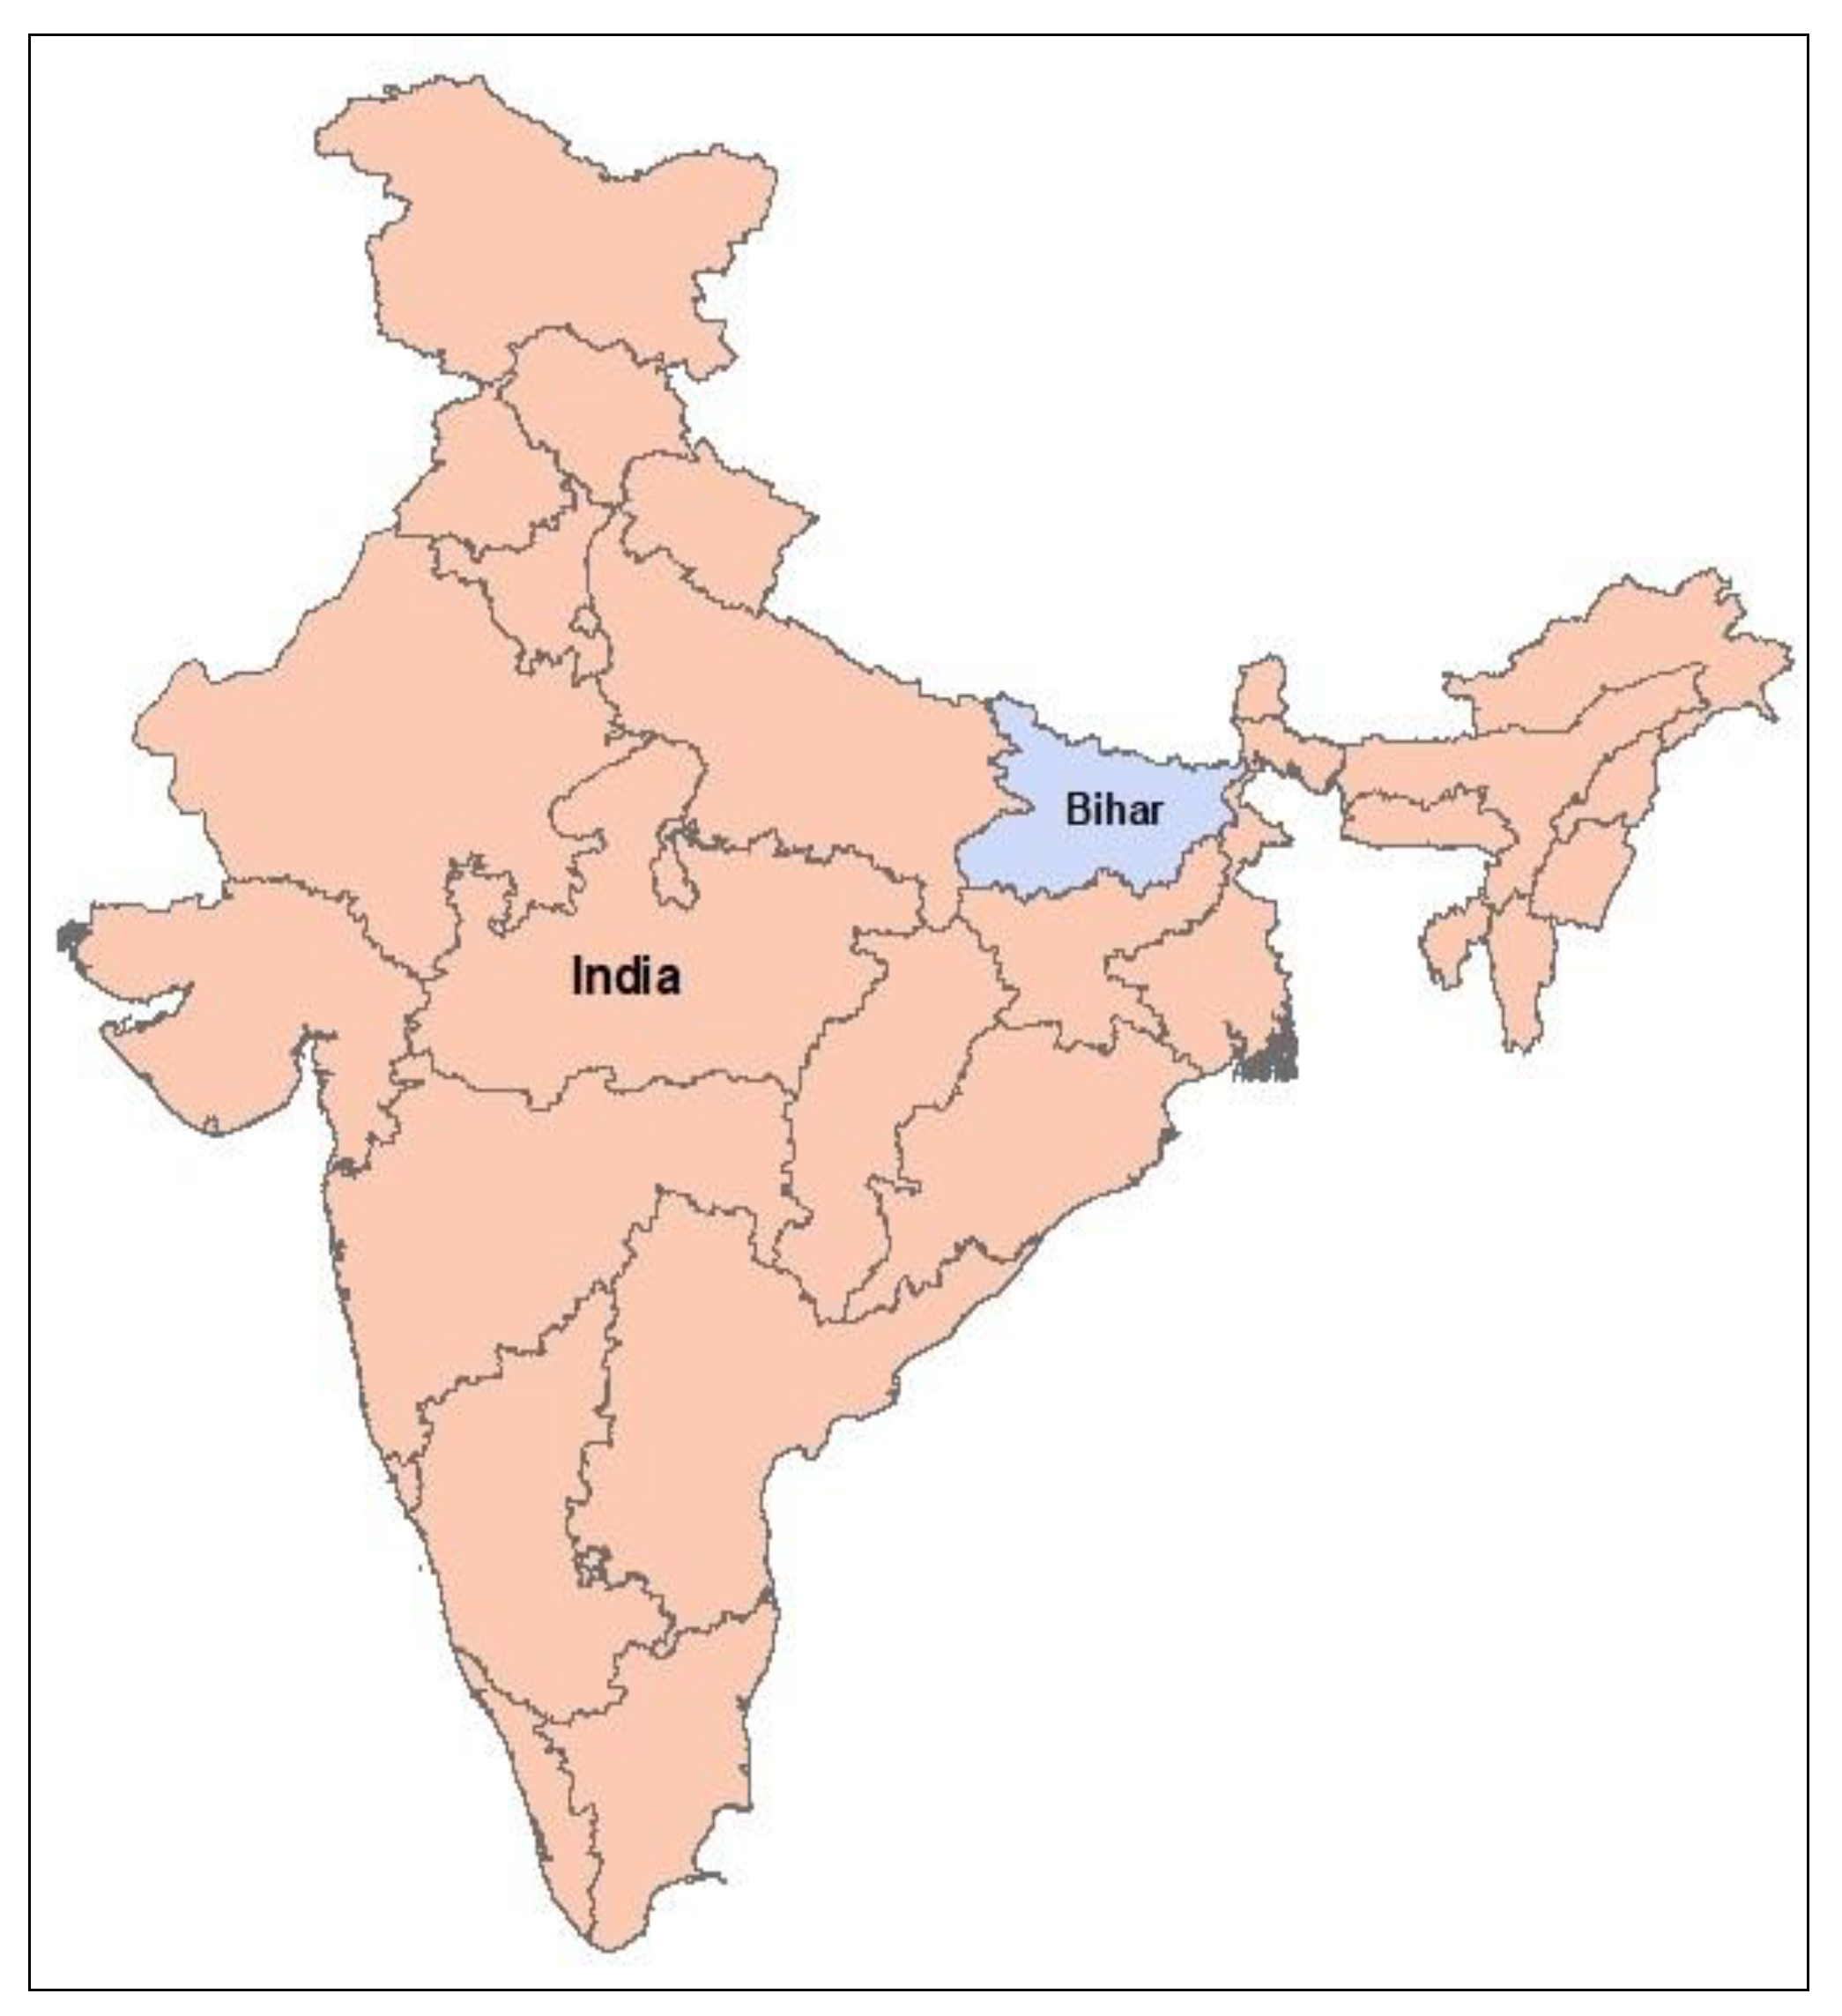
2.1. Study Area Description and Agricultural Dataset for Crop Modeling
2.2. Climate Data
2.3. Processing of Climate Data
2.4. DSSAT Simulation to Assess the Impact of Climate Change on Rice Yield, Phenology and Water Demand
2.5. Estimation of Irrigation Water Requirement for Rice Production
2.6. Management Scenarios for Predicting the Rice Yield and Irrigation Water Requirement
- (a)
- Estimate the change in irrigation water requirement for increasing the rice yield by 60% with current agronomic practice and climate change scenarios—RCP 2.6, RCP 4.5, RCP 6.0 and RCP 8.5;
- (b)
- Estimate the change in irrigation water requirement for increasing the rice yield by 60% with conservation agricultural practices and under climate change scenarios—RCP 2.6, RCP 4.5, RCP 6.0 and RCP 8.5;
- (c)
- Estimate the change in the irrigation water requirement for increasing the rice yield by 30% (assuming that the other 30% increase in yield would be achieved by reducing the post-harvest losses by 30%) with the current agronomic practice and under climate change scenarios—RCP 2.6, RCP 4.5, RCP 6.0 and RCP 8.5;
- (d)
- Estimate the change in irrigation water requirement for increasing the rice yield by 30% with conservation agricultural practices (and assuming a post-harvest loss reduction by 30%) and under climate change scenarios—RCP 2.6, RCP 4.5, RCP 6.0 and RCP 8.5.
3. Results
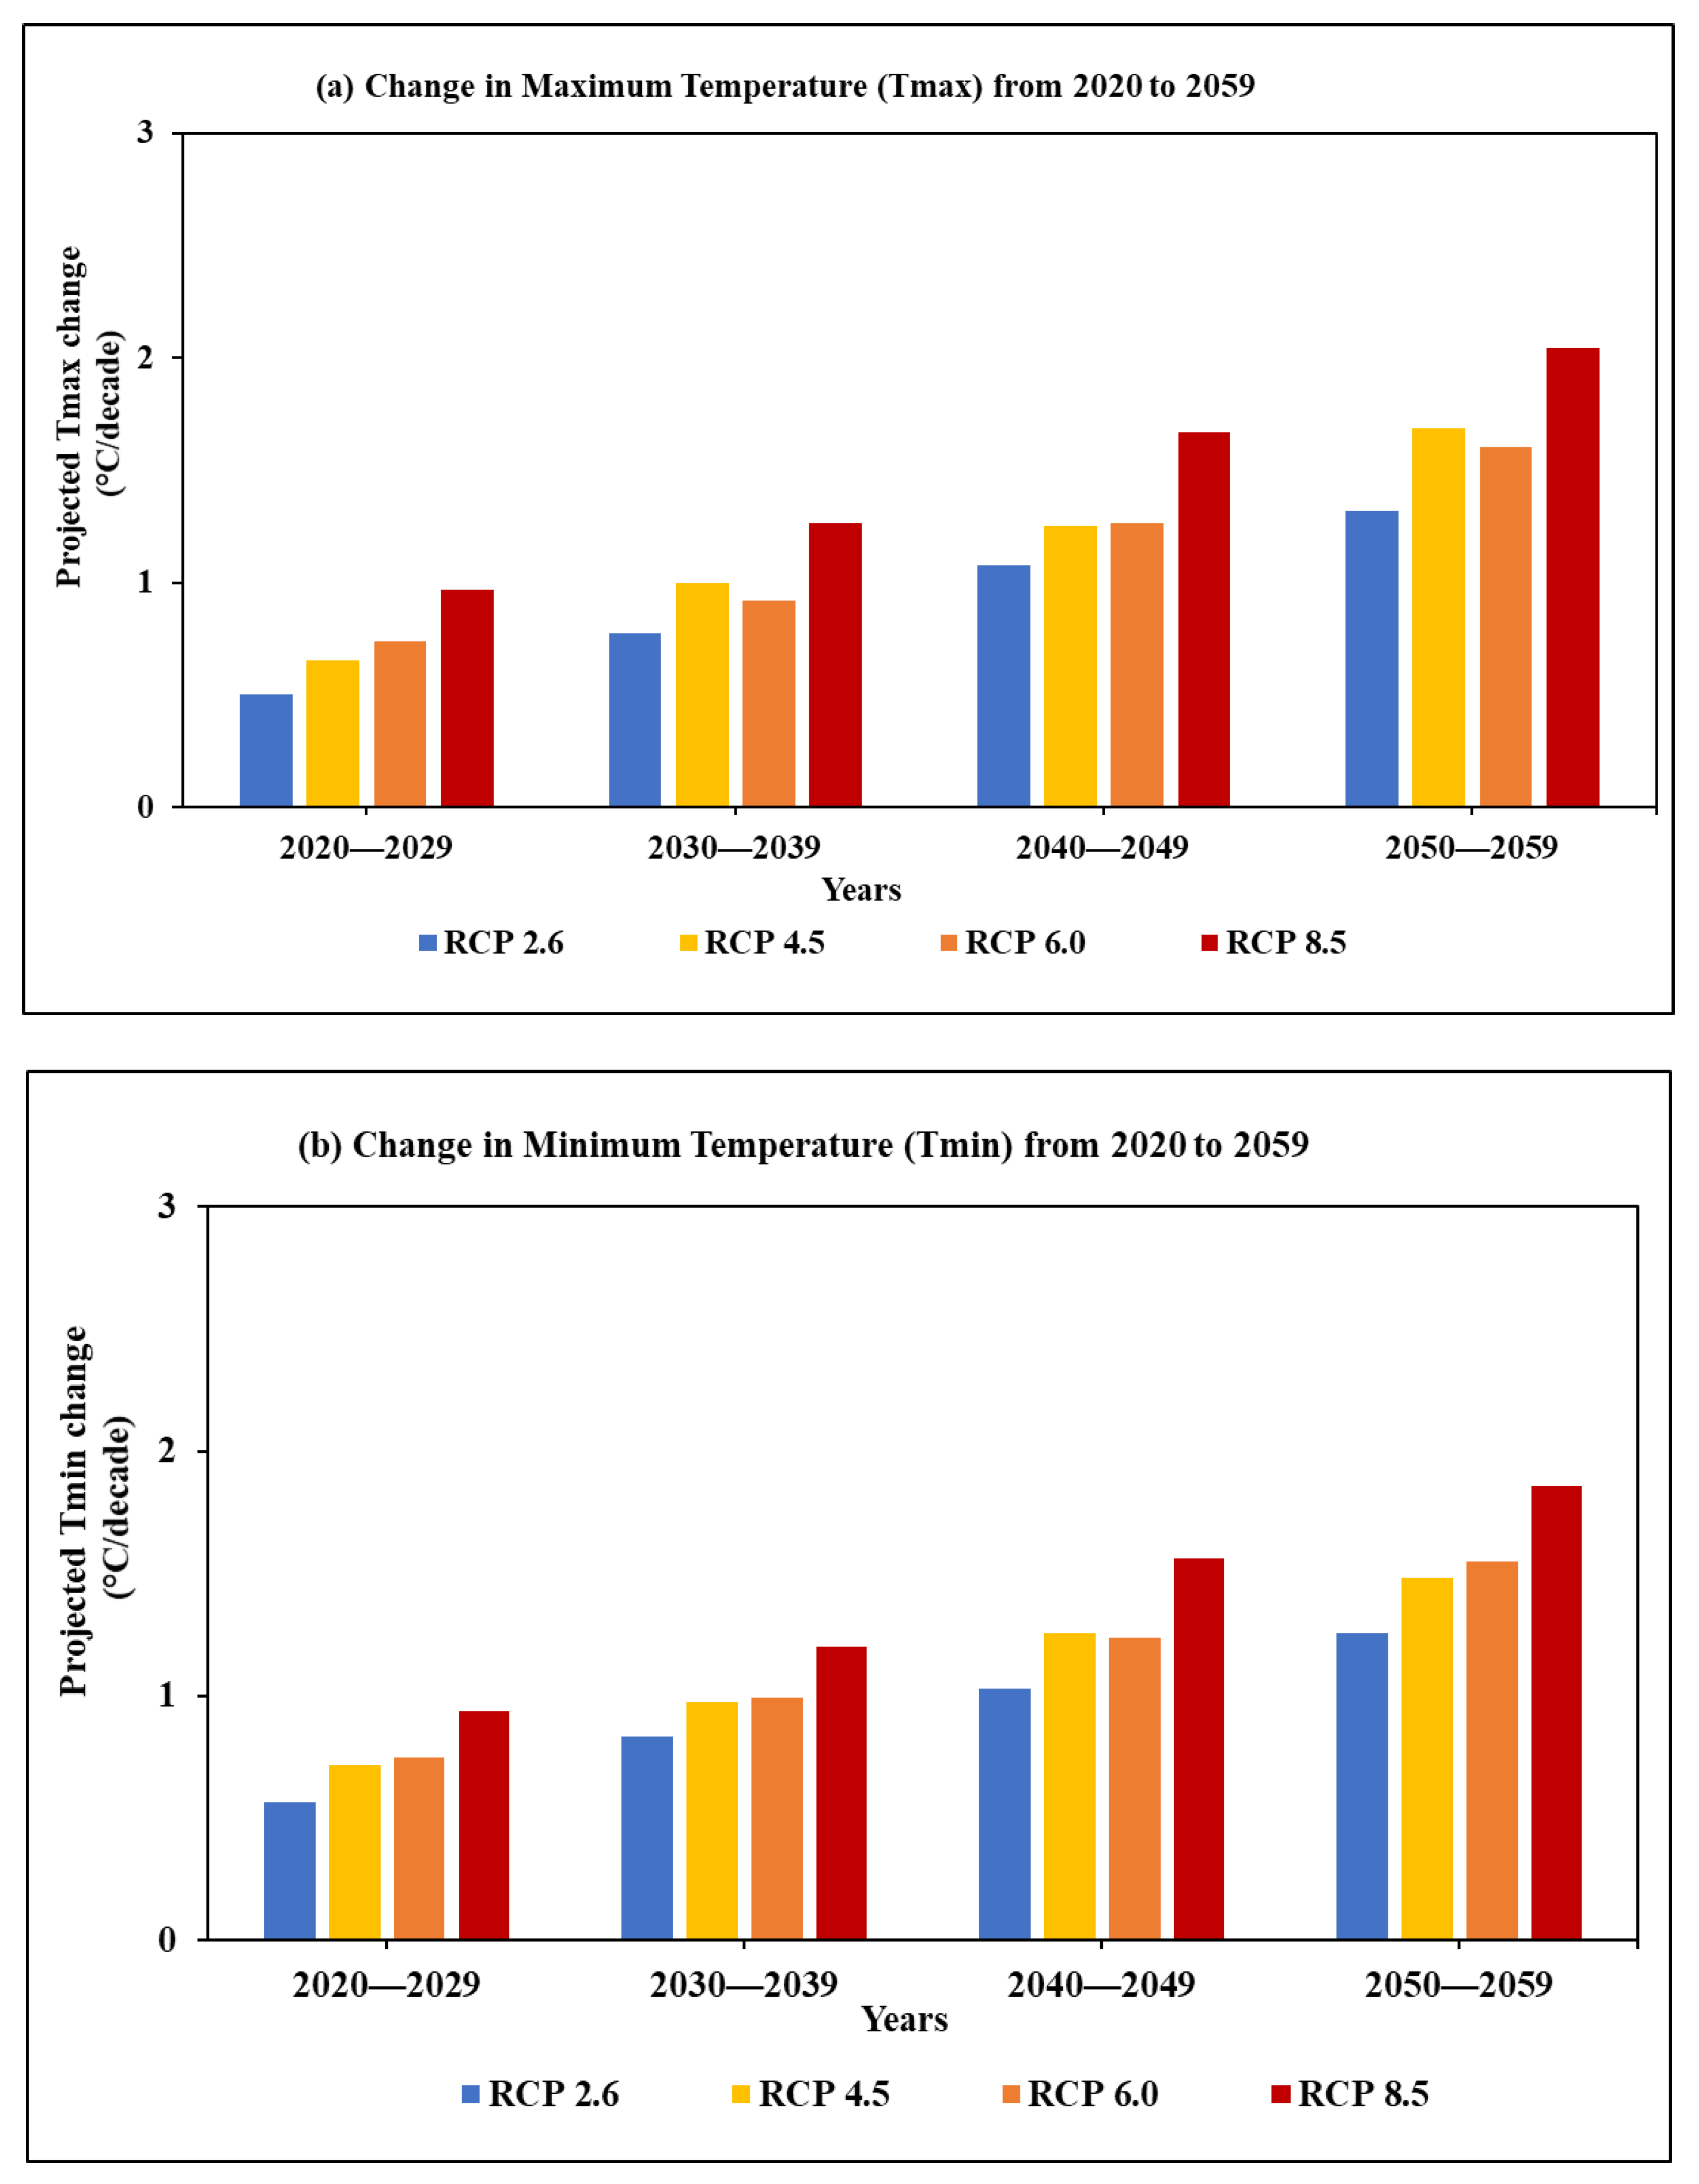
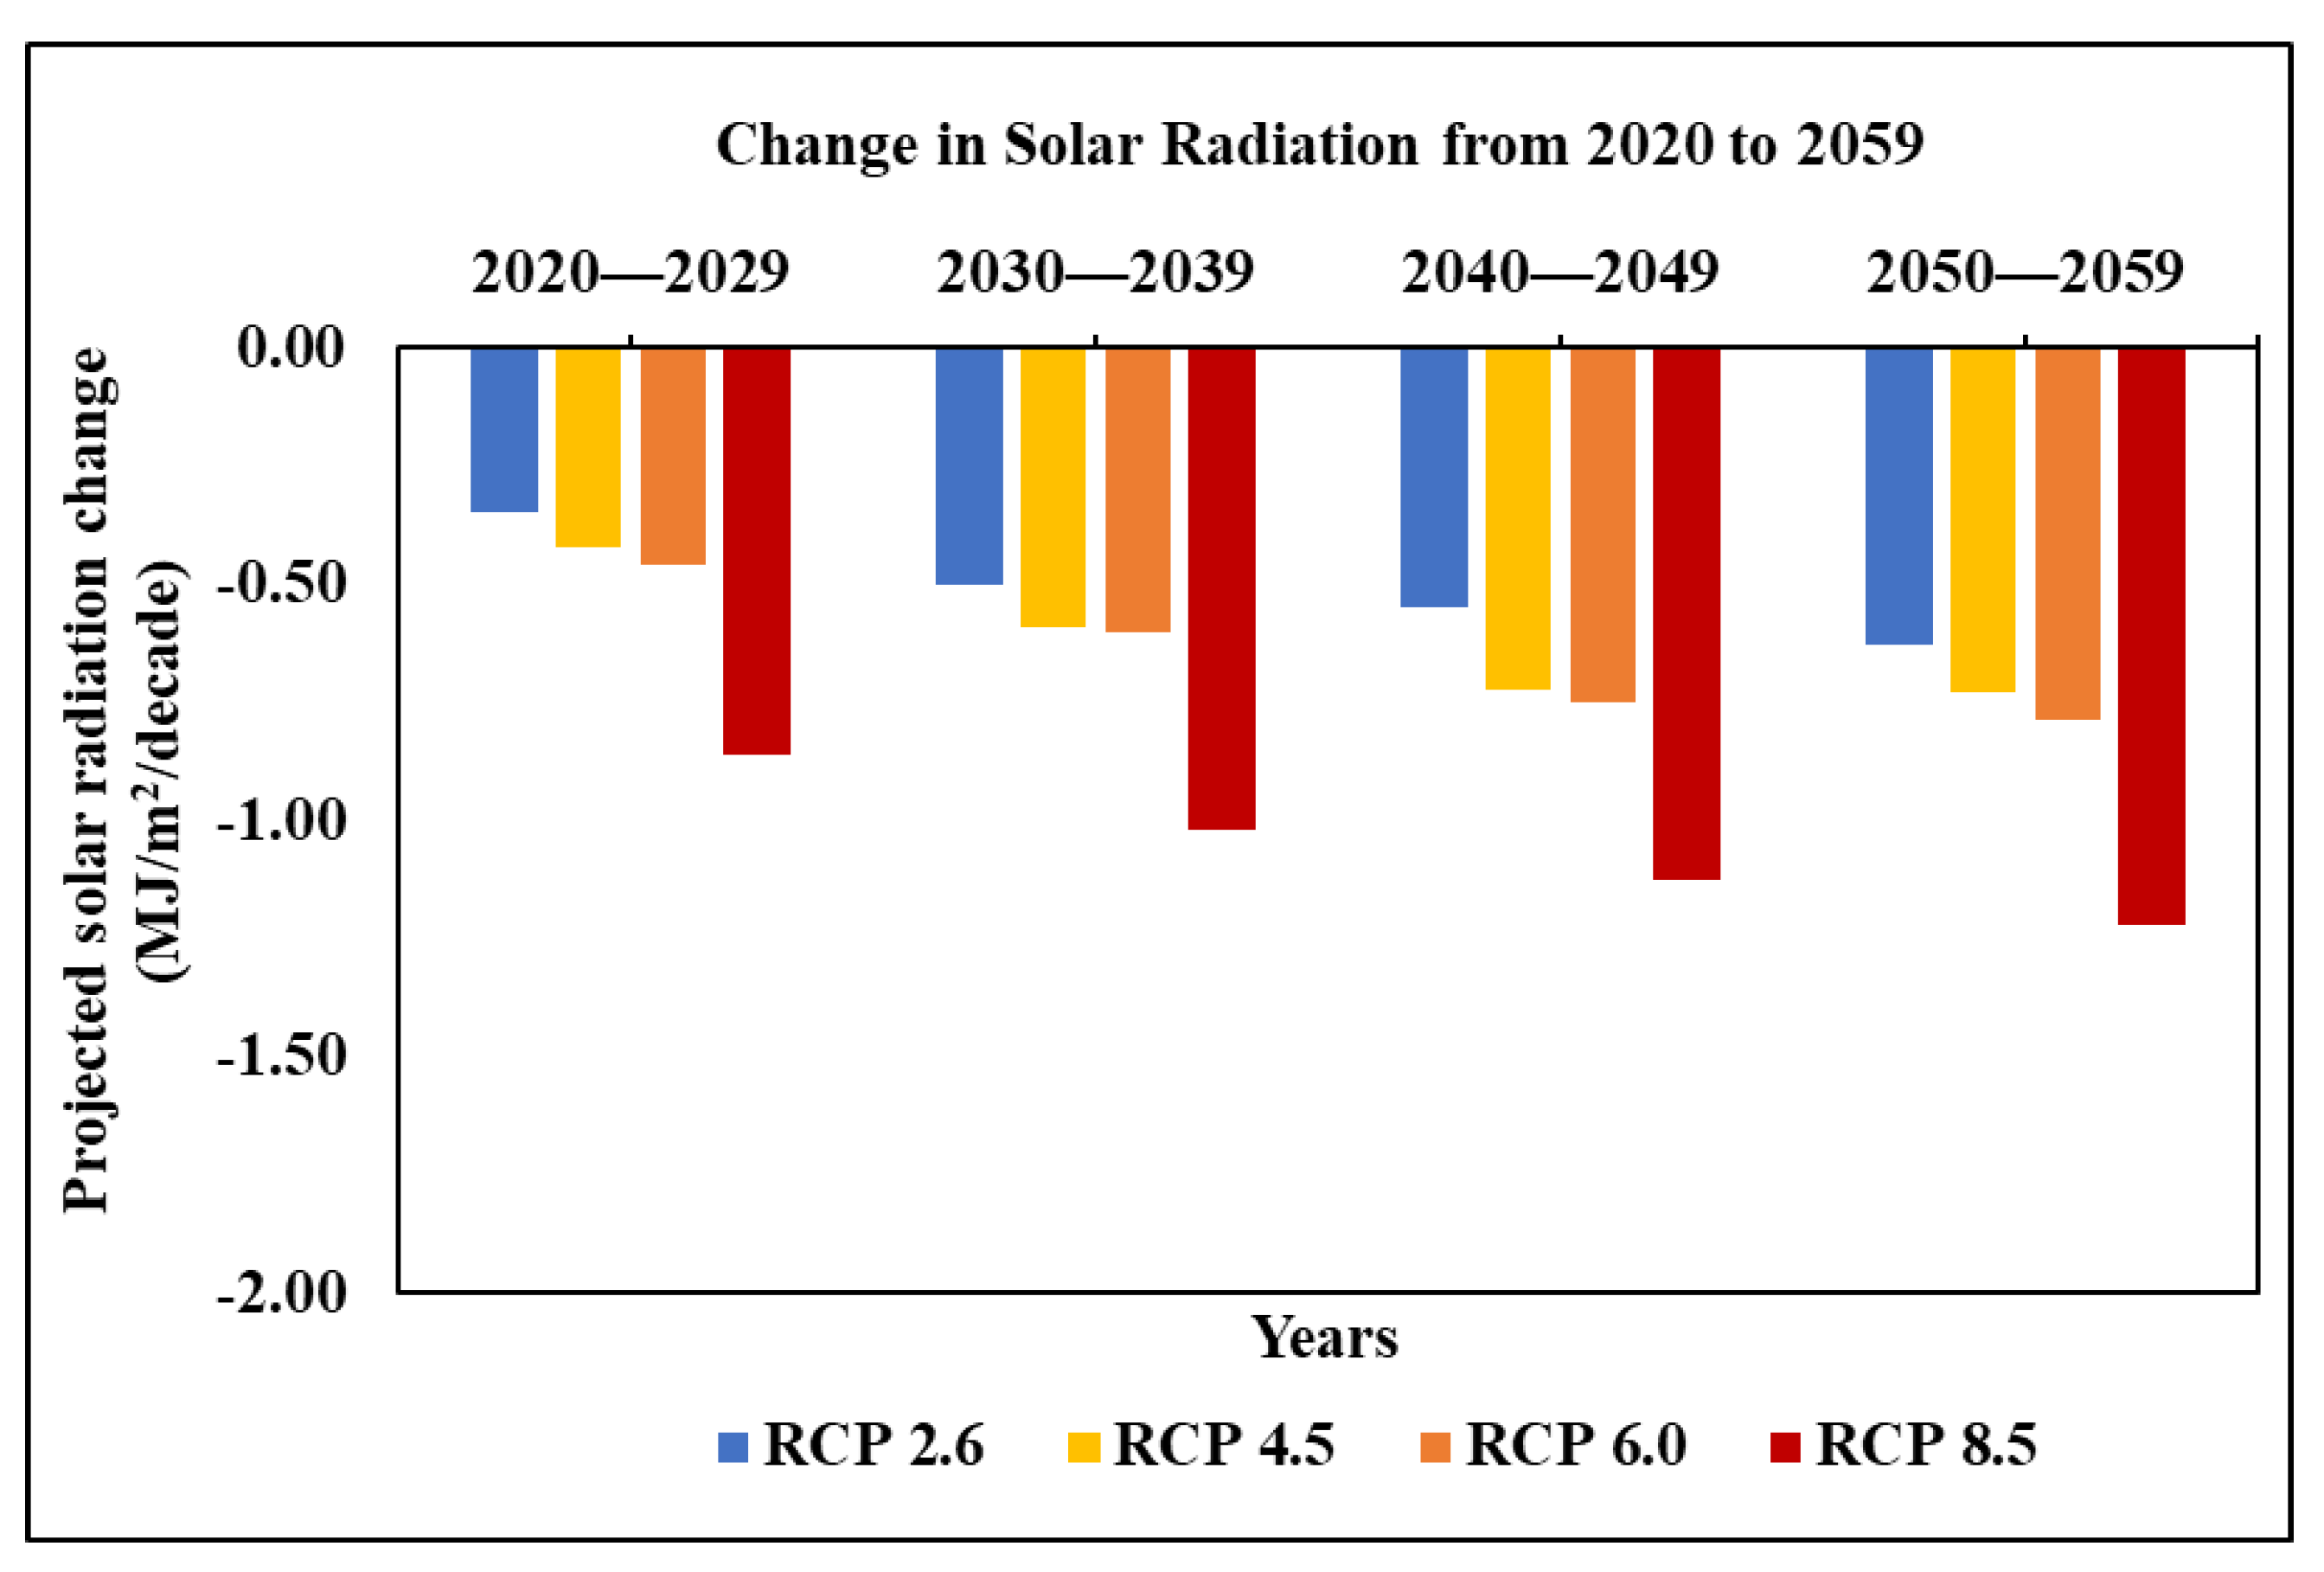
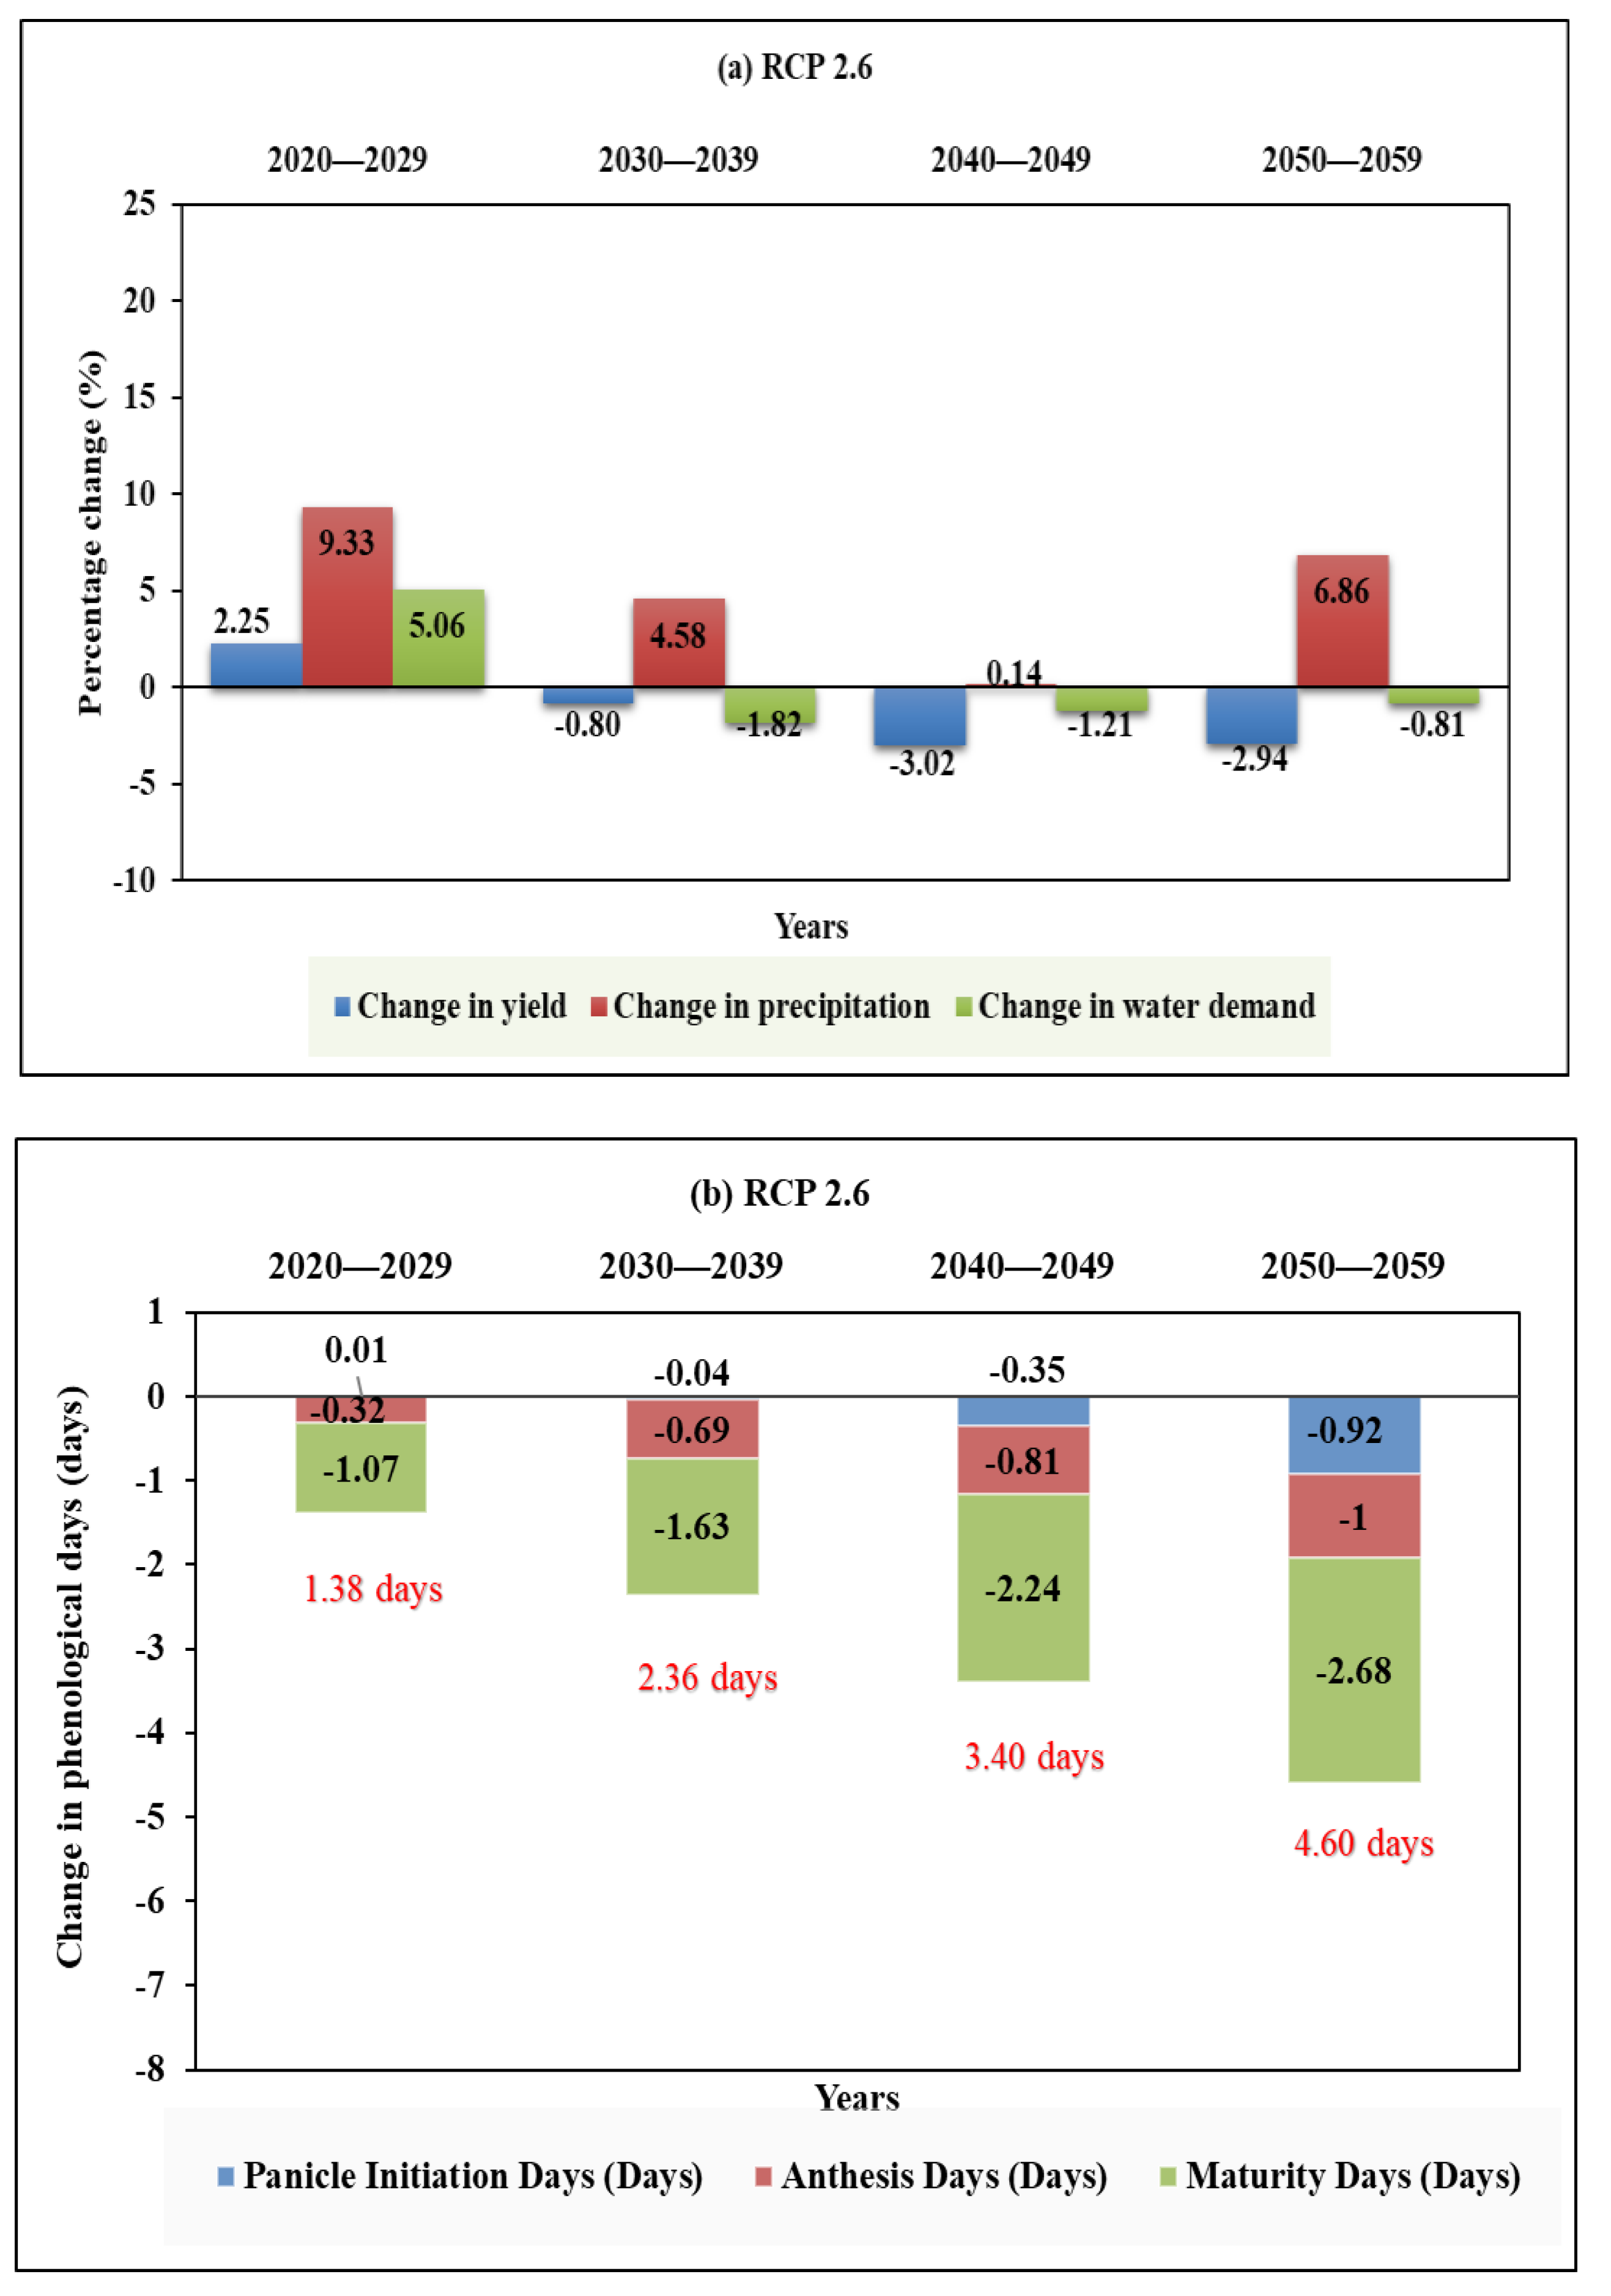
3.1. Current and Projected Future Climate Change Impact on the Rice Yield, Phenology and Water Demand
3.1.1. RCP 2.6
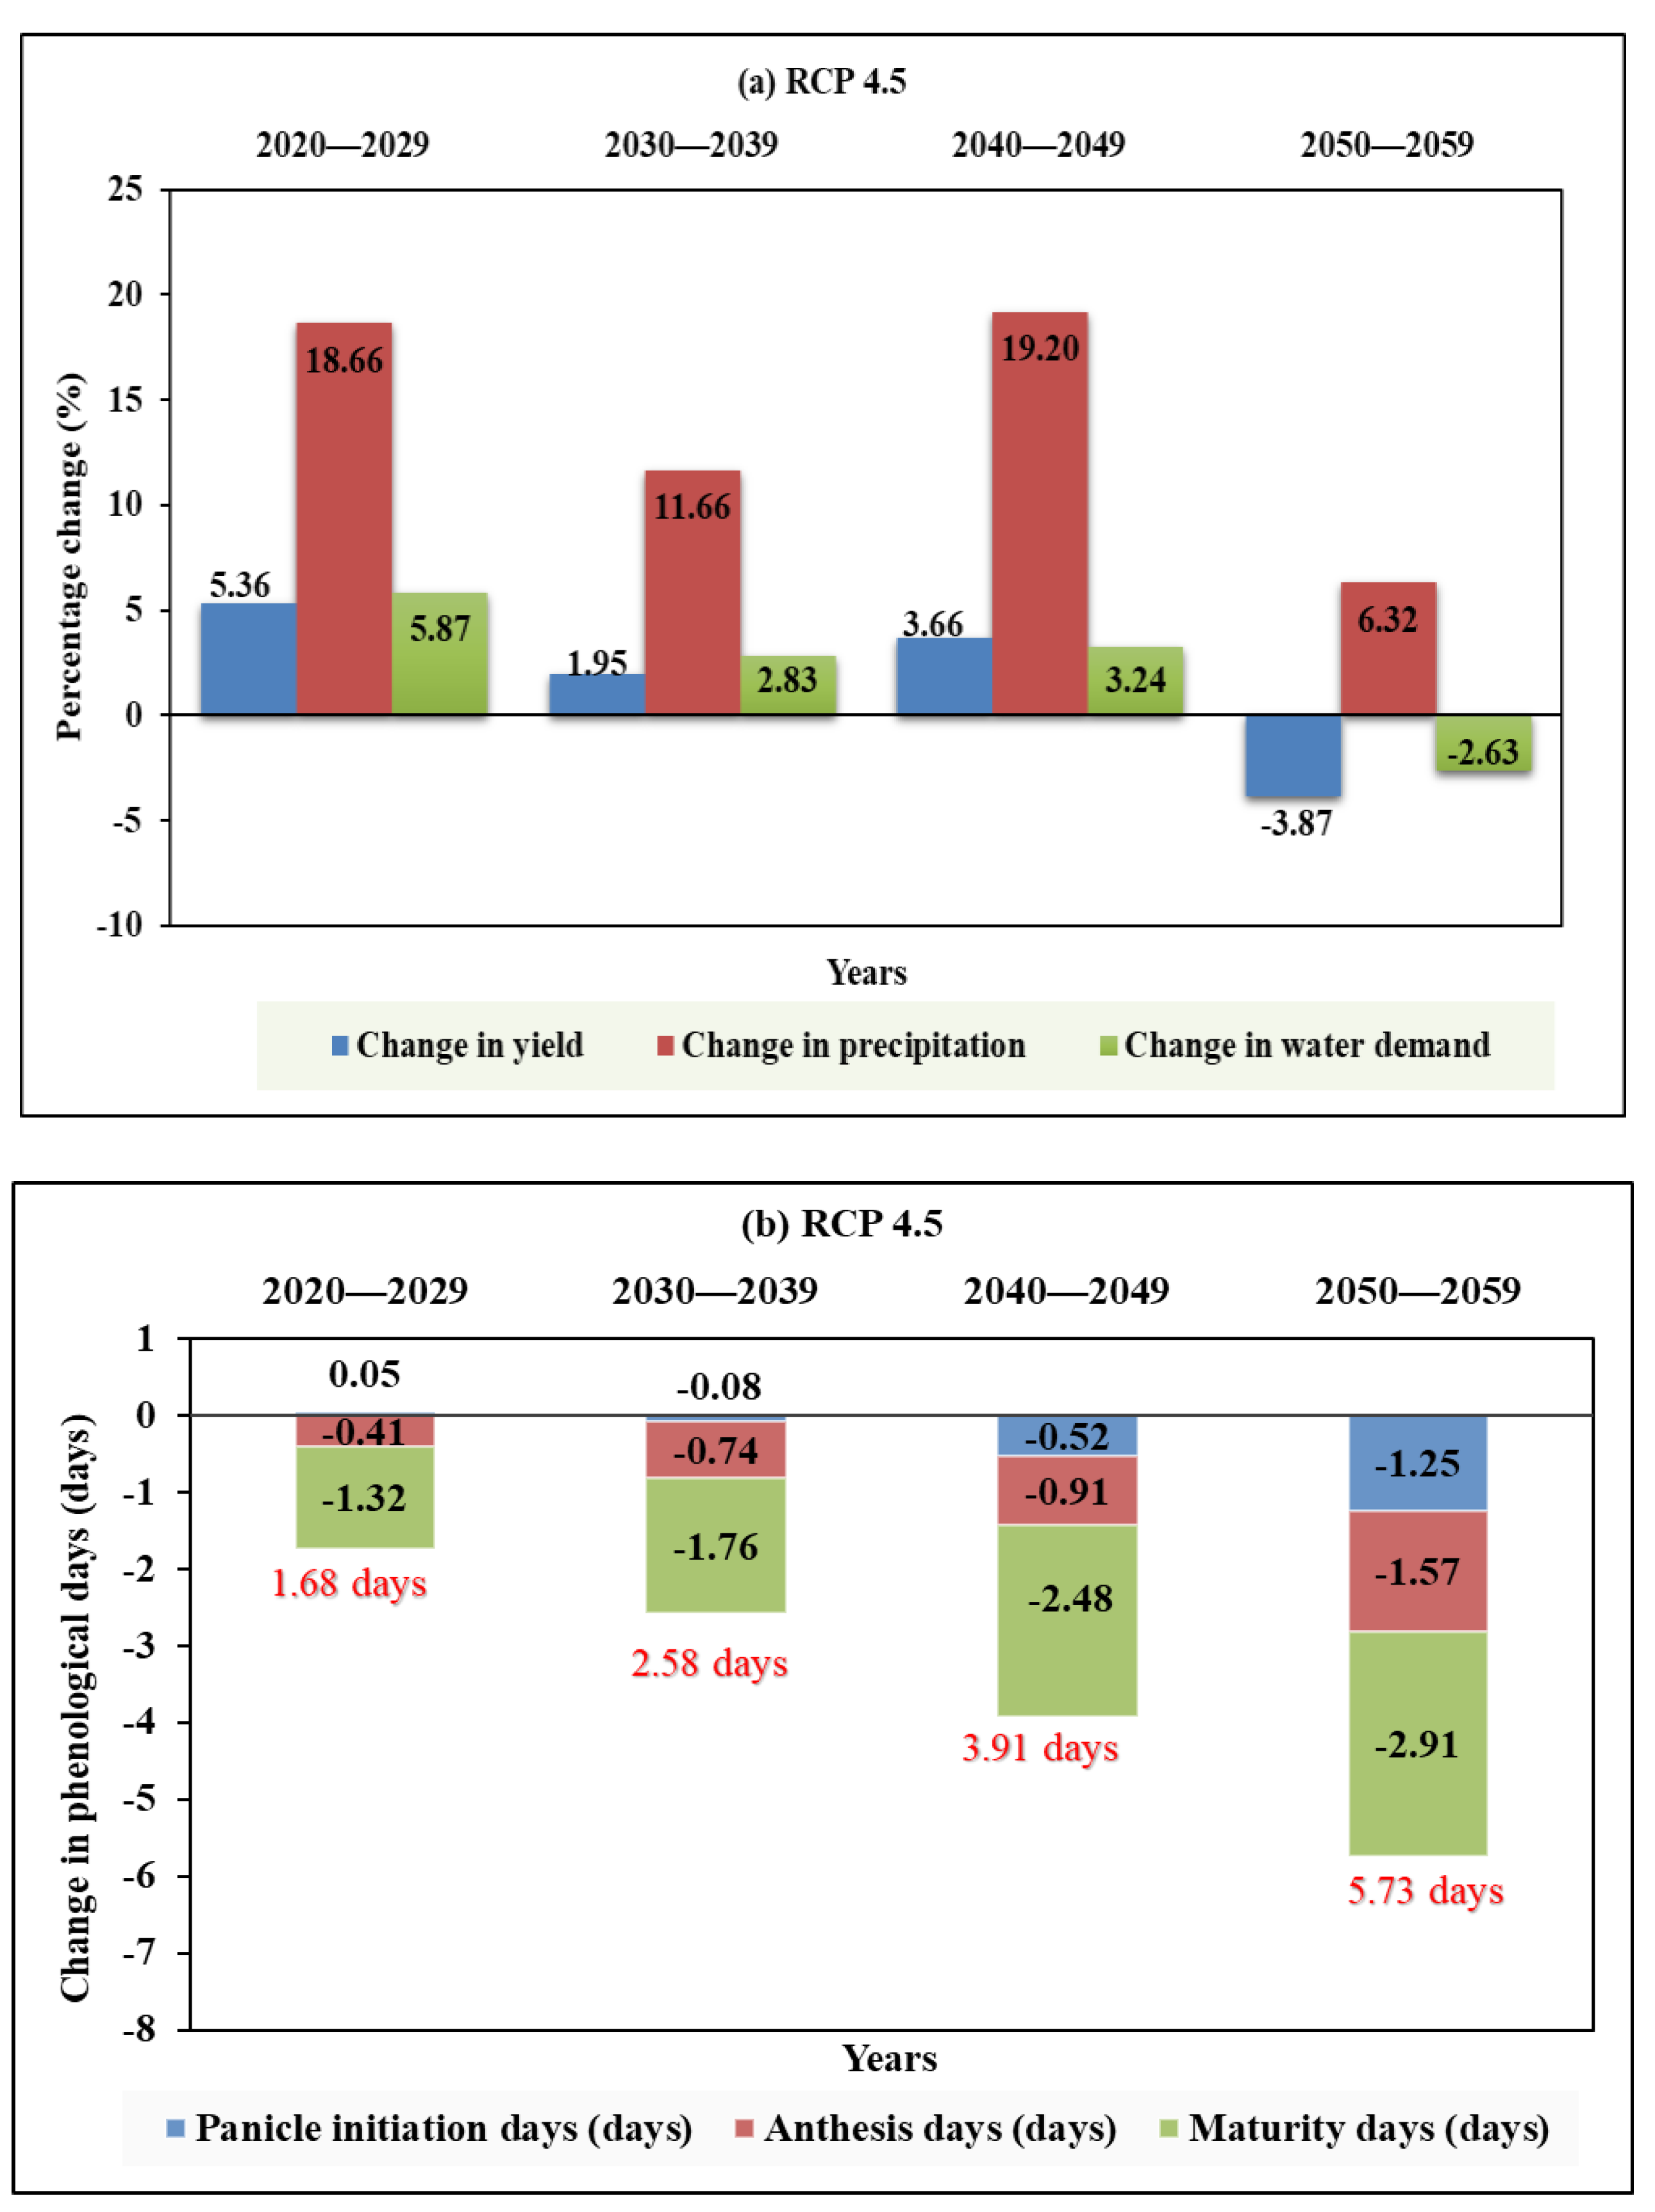
3.1.2. RCP 4.5
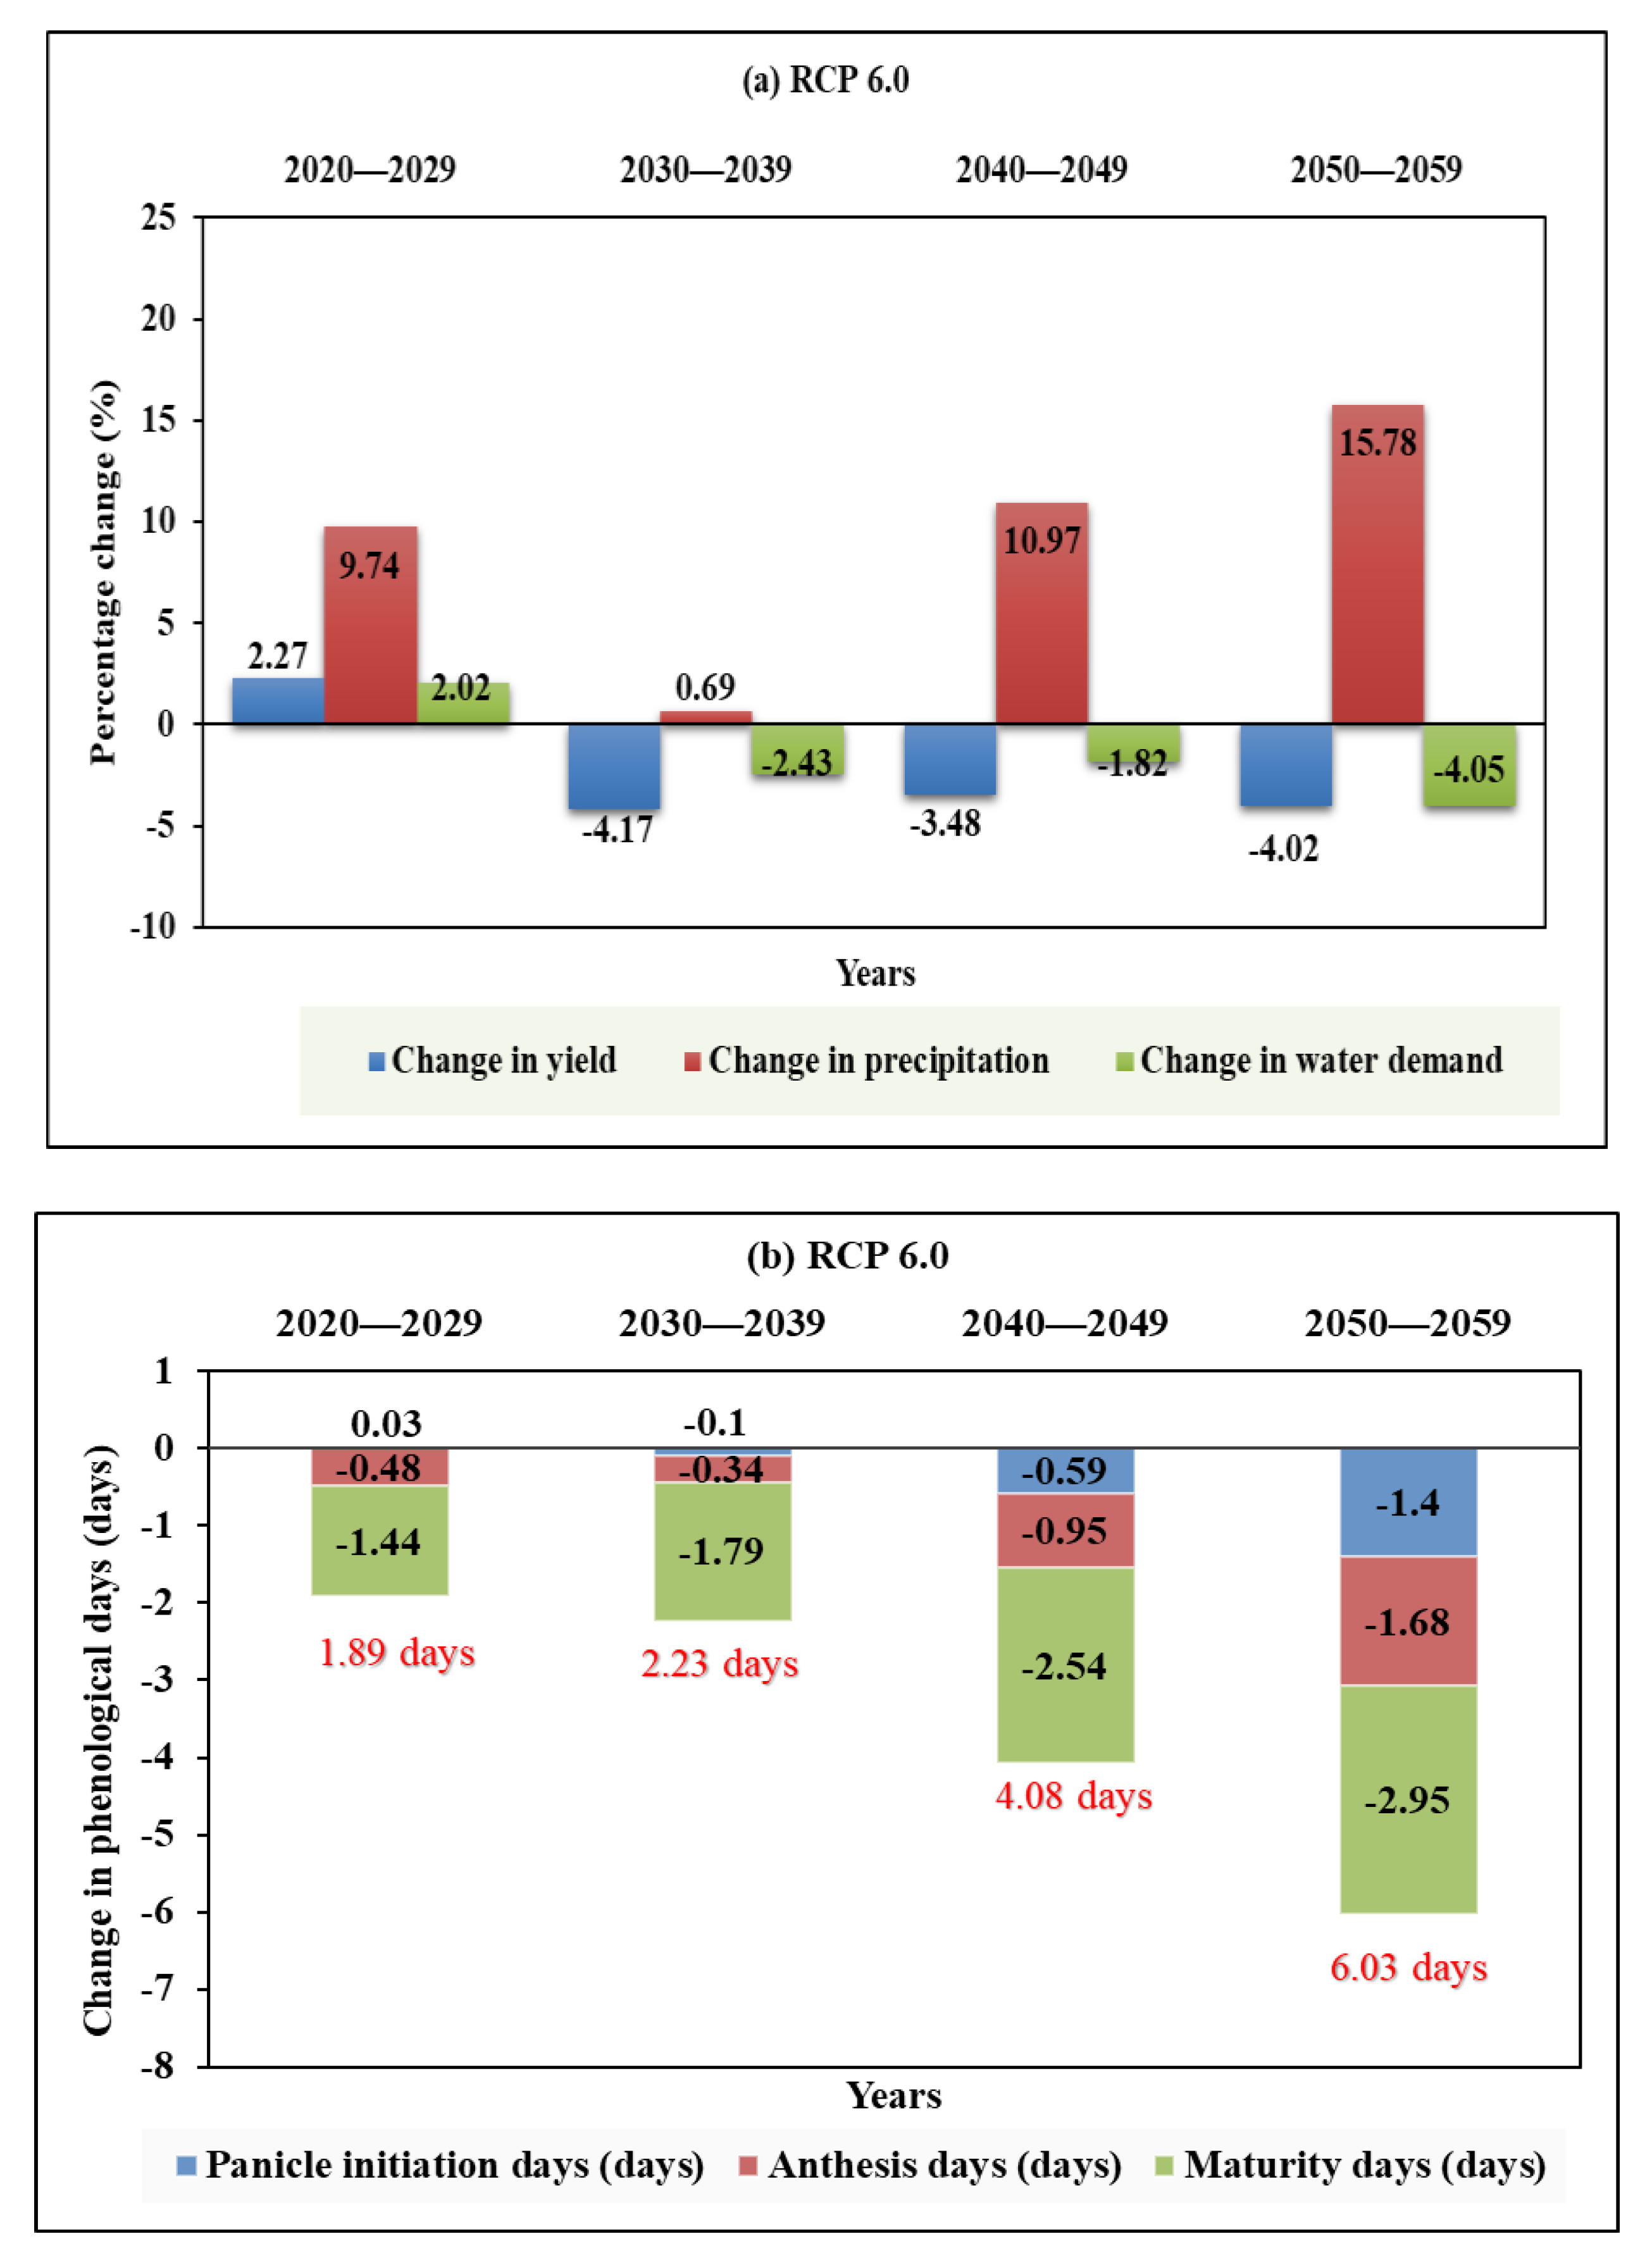
3.1.3. RCP 6.0
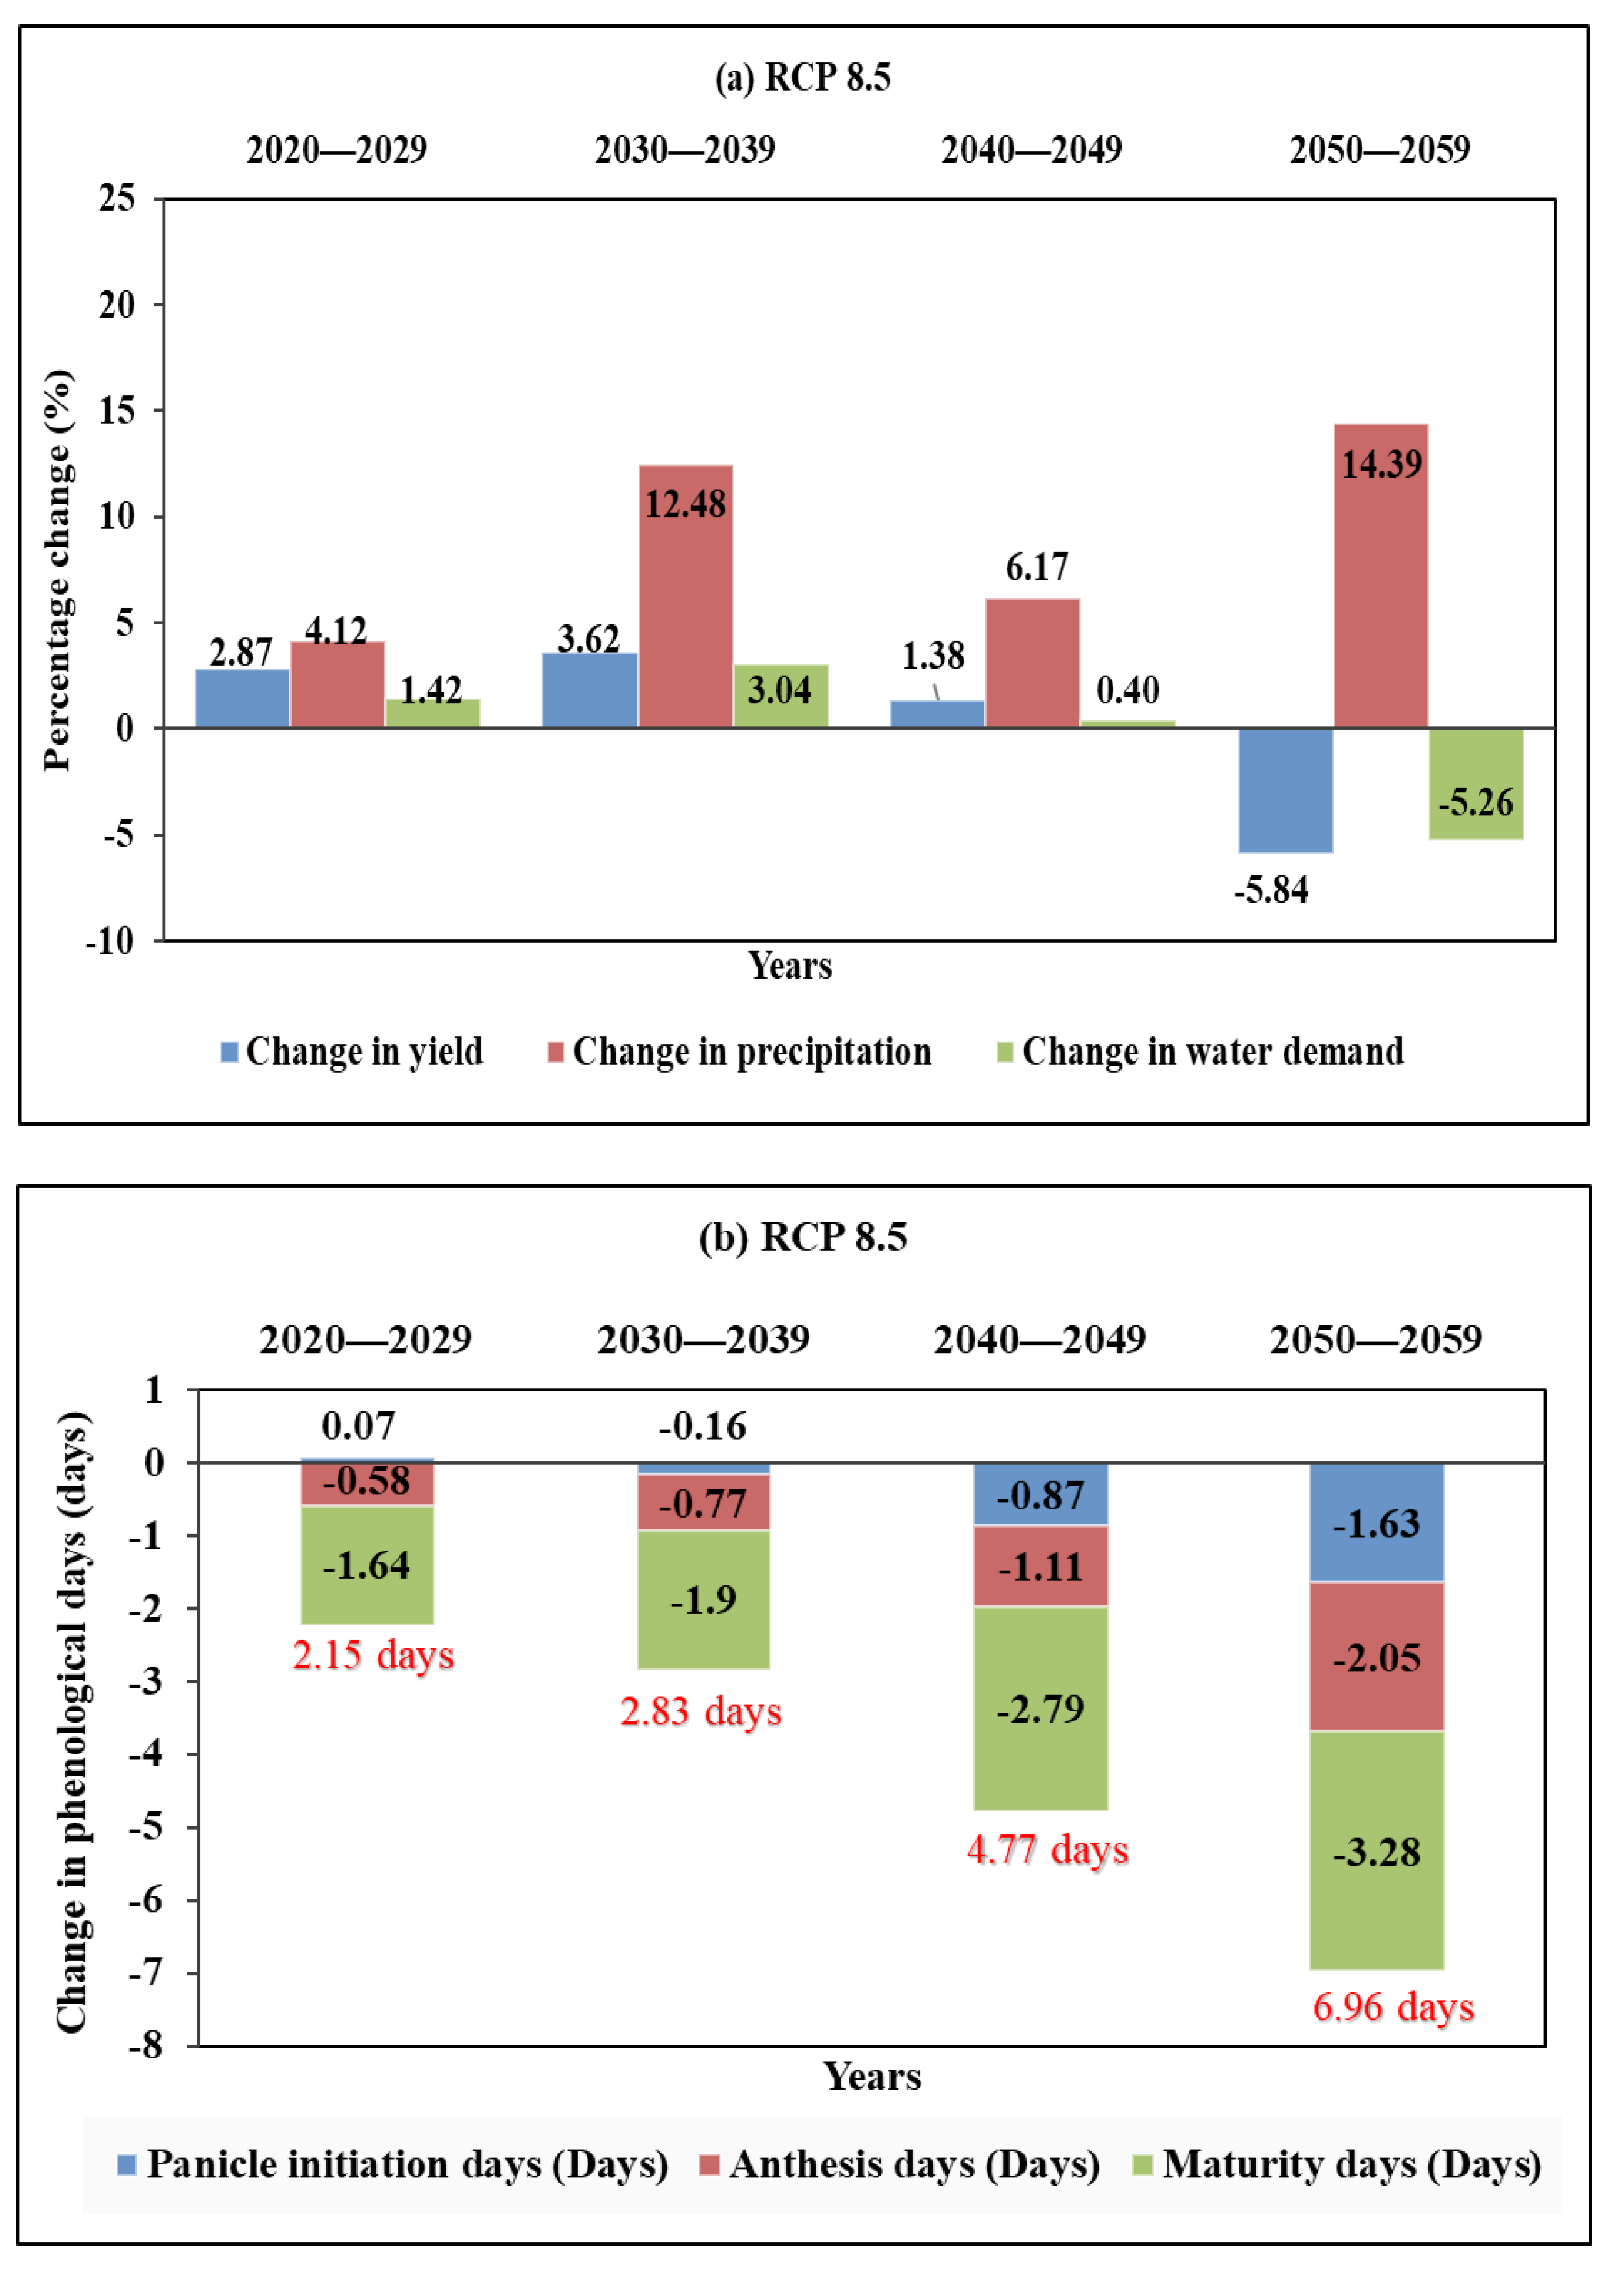
3.1.4. RCP 8.5
3.2. Irrigation Water Requirement of the Total Water Input (Precipitation + Irrigation Water) for Different Management Practices under (a) the Current Climate Scenario, (b) RCP 2.6, (c) RCP 4.5, (d) RCP 6.0 and (e) RCP 8.5.
3.2.1. Current Climatic Scenario
3.2.2. RCP 2.6
3.2.3. RCP 4.5
3.2.4. RCP 6.0
3.2.5. RCP 8.5
4. Discussions
5. Conclusions
Author Contributions
Funding
Conflicts of Interest
References
- Van Der Mensbrugghe, D.; Rodarte, I.O.; Burns, A.; Baffes, J. How to Feed the World in 2050: Macroeconomic Environment, Commodity Markets—A Longer Term Outlook; SSRN Electronic Journal, 2009; pp. 1–35. [Google Scholar]
- Hodges, R.J.; Buzby, J.C.; Bennett, B. Postharvest losses and waste in developed and less developed countries: Opportunities to improve resource use. J. Agric. Sci. 2011, 149, 37–45. [Google Scholar] [CrossRef]
- GFFA (Global Forum for Food and Agriculture). The growing demand for food, raw materials and energy: Opportunities for agriculture, challenges for food security, GFFA Communiqué. In Proceedings of the 7th Berlin Agriculture Ministers’ Summit, Berlin, Germany, 15–17 January 2015. [Google Scholar]
- Kang, Y.; Khan, S.; Ma, X. Climate change impacts on crop yield, crop water productivity and food security—A review. Prog. Nat. Sci. 2009, 19, 1665–1674. [Google Scholar] [CrossRef]
- International Food Policy Research Institute (IFPRI). Climate Change: Impact on Agriculture and Costs of Adaptation; International Food Policy Research Institute (IFPRI): Washington, DC, USA, 2009. [Google Scholar]
- Rao, V.U.M.; Rao, A.V.M.S.; Rao, G.G.S.N.; Satyanarayana, T.; Manikandan, N.; Venkateshwarlu, B. Impact of Climate Change on Crop Water Requirements and Adaptation Strategies. In Challenges and Opportunities in Agrometeorology; Springer: Berlin, Heidellberg, Germany, 2011; pp. 311–319. [Google Scholar]
- Intergovernmental Panel on Climate Change Working Group II (IPCC). Climate Change 2014: Impacts, Adaptation, and Vulnerability. Part B: Regional Aspects, Polar Regions; University of Cambridge Press: Cambridge, UK, 2014; pp. 1567–1612. [Google Scholar]
- Dixon, J.A.; Gibbon, D.P.; Gulliver, A.; Hall, M. Farming Systems and Poverty: Improving Farmers’ Livelihoods in a Changing World; Food and Agriculture Organization: Rome, Italy, 2001. [Google Scholar]
- The Rice Farming System in South Asia—GCP Priority Setting. Available online: https://sites.google.com/site/gcpprioritysetting/the-rice-farming-system-in-south-asia (accessed on 9 October 2020).
- Maclean, J.L.; Dawe, D.C.; Hardy, B.; Hettel, G.P. Rice Almanac Source Book for One of the Most Important Economic Activity on Earth; CABI Publishing: Wallingford, UK; FAO: Rome, Italy; International Rice Research Institute (IRRI): Manila, Philippines, 2003. [Google Scholar]
- Pandey, B.; Seto, K.C. Urbanization and agricultural land loss in India: Comparing satellite estimates with census data. J. Environ. Manag. 2015, 148, 53–66. [Google Scholar] [CrossRef]
- Kumari, V. Population Growth and Changes in Land Use by Agriculture in India. In Advances in Agriculture and Biodiversity; Kailbri International Educational Trust: Ghaziabad, India, 2019; pp. 102–108. [Google Scholar]
- Food and Agriculture Organization of the United Nations. Dynamic Development, Shifting Demographics, Changing Diets; Food and Agriculture Organization of the United Nations: Rome, Italy, 2018. [Google Scholar]
- Naikwade, P. Impact of Climate Change on Agricultural Production in India: Effect on Rice Productivity. Biosci. Discov. 2017, 8, 897–914. [Google Scholar]
- Mall, R.K.; Singh, R.; Gupta, A.; Srinivasan, G.; Rathore, L.S. Impact of Climate Change on Indian Agriculture: A Review. Clim. Chang. 2006, 78, 445–478. [Google Scholar] [CrossRef]
- Haris, A.V.A.; Biswas, S.; Chhabra, V.; Elanchezhian, R.; Bhatt, B.P. Impact of Climate Change on Wheat and Winter Maize over a Sub-Humid Climatic Environment. Curr. Sci. 2013, 104, 206–214. [Google Scholar]
- Abeysingha, N.S.; Singh, M.; Islam, A.; Sehgal, V.K. Climate change impacts on irrigated rice and wheat production in Gomti River basin of India: A case study. SpringerPlus 2016, 5, 1250. [Google Scholar] [CrossRef]
- Ruchita, S.; Rohit, S. Effect of Global Warming on Indian Agriculture. J. Climatol. Weather Forecast. 2017, 5. [Google Scholar] [CrossRef]
- Srinivasarao, C.; Gopinath, K.; Prasad, J.; Prasannakumar, A.K.; Singh, A. Climate Resilient Villages for Sustainable Food Security in Tropical India: Concept, Process, Technologies, Institutions, and Impacts. Adv. Agron. 2016, 140, 101–214. [Google Scholar] [CrossRef]
- Auffhammer, M.; Ramanathan, V.; Vincent, J.R. Climate change, the monsoon, and rice yield in India. Clim. Chang. 2011, 111, 411–424. [Google Scholar] [CrossRef]
- Haris, A.A.; Chhabra, V.; Bhatt, B.P.; Sikka, A.K. Yield and Duration of Potato Crop in Bihar under Projected Climate Scenarios. J. Agrometeorol. 2015, 17, 67–73. [Google Scholar]
- Haris, A.A.; Biswas, S.; Chhabra, V. Climate Change Impacts on Productivity of Rice (Oryza sativa) in Bihar. Indian J. Agron. 2010, 55, 295–298. [Google Scholar]
- Shirsath, P.B.; Aggarwal, P.; Thornton, P.; Dunnett, A. Prioritizing climate-smart agricultural land use options at a regional scale. Agric. Syst. 2017, 151, 174–183. [Google Scholar] [CrossRef]
- Aggarwal, P.; Banerjee, B.; Daryaei, M.; Bhatia, A.; Bala, A.; Rani, S.; Chander, S.; Pathak, H.; Kalra, N. InfoCrop: A dynamic simulation model for the assessment of crop yields, losses due to pests, and environmental impact of agro-ecosystems in tropical environments. II. Performance of the model. Agric. Syst. 2006, 89, 47–67. [Google Scholar] [CrossRef]
- Lal, M.; Singh, K.; Rathore, L.; Srinivasan, G.; Saseendran, S. Vulnerability of rice and wheat yields in NW India to future changes in climate. Agric. For. Meteorol. 1998, 89, 101–114. [Google Scholar] [CrossRef]
- Saseendran, S.A.; Singh, K.K.; Rathore, L.S.; Singh, S.V.; Sinha, S.K. Effects of Climate Change on Rice Production in the Tropical Humid Climate of Kerala, India. Clim. Chang. 2000, 44, 495–514. [Google Scholar] [CrossRef]
- Naresh Kumar, S.; Aggarwal, P.K.; Rani, S.; Jain, S.; Saxena, R.; Chauhan, N. Impact of Climate Change on Crop Productivity in Western Ghats, Coastal and Northeastern Regions of India. Curr. Sci. 2011, 101, 332–341. [Google Scholar]
- Kumar, S.N.; Aggarwal, P.; Rani, D.S.; Saxena, R.; Chauhan, N.; Jain, S. Vulnerability of wheat production to climate change in India. Clim. Res. 2014, 59, 173–187. [Google Scholar] [CrossRef]
- Jha, R.K.; Kalita, P.K.; Jat, R.K. Development of production management strategies for a long-duration rice variety: Rajendra Mahsuri—Using crop growth model, DSSAT, for the state of Bihar, India. Paddy Water Environ. 2020, 18, 531–545. [Google Scholar] [CrossRef]
- Rosenzweig, C.; Ruane, A.C.; Antle, J.; Elliott, J.; Ashfaq, M.; Chatta, A.A.; Ewert, F.; Folberth, C.; Hathie, I.; Havlik, P.; et al. Coordinating AgMIP data and models across global and regional scales for 1.5 °C and 2.0 °C assessments. Philos. Trans. R. Soc. A Math. Phys. Eng. Sci. 2018, 376, 20160455. [Google Scholar] [CrossRef]
- Porter, C.H.; Villalobos, C.; Holzworth, D.; Nelson, R.; White, J.W.; Athanasiadis, I.; Janssen, S.; Ripoche, D.; Cufi, J.; Raes, D.; et al. Harmonization and translation of crop modeling data to ensure interoperability. Environ. Model. Softw. 2014, 62, 495–508. [Google Scholar] [CrossRef]
- Villoria, N.; Elliott, J.; Müller, C.; Shin, J.; Zhao, L.; Song, C. Rapid aggregation of global gridded crop model outputs to facilitate cross-disciplinary analysis of climate change impacts in agriculture. Environ. Model. Softw. 2016, 75, 193–201. [Google Scholar] [CrossRef]
- Xin, X.; Zhang, L.; Zhang, J.; Wu, T.; Fang, Y. Climate Change Projections over East Asia with BCC_CSM1.1 Climate Model under RCP Scenarios. J. Meteorol. Soc. Jpn. 2013, 91, 413–429. [Google Scholar] [CrossRef]
- Wu, T.; Li, W.; Ji, J.; Xin, X.; Li, L.; Wang, Z.; Zhang, Y.; Li, J.; Zhang, F.; Wei, M.; et al. Global carbon budgets simulated by the Beijing Climate Center Climate System Model for the last century. J. Geophys. Res. Atmos. 2013, 118, 4326–4347. [Google Scholar] [CrossRef]
- Gordon, H.B.; Farrell, S.O.; Collier, M.; Dix, M.; Rotstayn, L.; Kowalczyk, E.; Hirst, A.C.; Watterson, I. The CSIRO Mk3.5 Climate Model; Tech. Rep. No. 21; Centre for Australian Weather and Climate Research (CAWCR): Australia, 2010.
- Jeffrey, S.; Rotstayn, L.; Collier, M.; Dravitzki, S.; Hamalainen, C.; Moeseneder, C.; Wong, K.; Skytus, J. Australia’s CMIP5 submission using the CSIRO-Mk3.6 model. J. South. Hemisph. Earth Syst. Sci. 2013, 63, 1–14. [Google Scholar] [CrossRef]
- Madec, G.; Delecluse, P.; Imbard, M.; Levy, C. OPA 8.1 Ocean General Circulation Model Reference Manual. Note Pole Modélisation 1998, 11, 91. [Google Scholar]
- Hourdin, F.; Foujols, M.-A.; Codron, F.; Guemas, V.; Dufresne, J.-L.; Bony, S.; Denvil, S.; Guez, L.; Lott, F.; Ghattas, J.; et al. Impact of the LMDZ atmospheric grid configuration on the climate and sensitivity of the IPSL-CM5A coupled model. Clim. Dyn. 2013, 40, 2167–2192. [Google Scholar] [CrossRef]
- Watanabe, M.; Suzuki, T.; O’Ishi, R.; Komuro, Y.; Watanabe, S.; Emori, S.; Takemura, T.; Chikira, M.; Ogura, T.; Sekiguchi, M.; et al. Improved Climate Simulation by MIROC5: Mean States, Variability, and Climate Sensitivity. J. Clim. 2010, 23, 6312–6335. [Google Scholar] [CrossRef]
- Zanchetta, S.; Zanchi, A.; Villa, I.; Poli, S.; Muttoni, G. The Shanderman eclogites: A Late Carboniferous high-pressure event in the NW Talesh Mountains (NW Iran). Geol. Soc. London, Spéc. Publ. 2009, 312, 57–78. [Google Scholar] [CrossRef]
- Climate Change 2014: Synthesis Report; Pachauri, R.K., Mayer, L., Intergovernmental Panel on Climate Change, Eds.; Intergovernmental Panel on Climate Change: Geneva, Switzerland, 2015. [Google Scholar]
- Van Vuuren, D.P.; Edmonds, J.; Kainuma, M.; Riahi, K.; Thomson, A.; Hibbard, K.; Hurtt, G.C.; Kram, T.; Krey, V.; Lamarque, J.-F.; et al. The representative concentration pathways: An overview. Clim. Chang. 2011, 109, 5–31. [Google Scholar] [CrossRef]
- Hijioka, Y.; Matsuoka, Y.; Nishimoto, H.; Masui, T.; Kainuma, M. Global GHG Emission Scenarios under GHG Concentration Stabilization Targets. J. Glob. Environ. Eng. 2008, 13, 97–108. [Google Scholar]
- Wise, M.; Calvin, K.; Thomson, A.; Clarke, L.; Bond-Lamberty, B.; Sands, R.; Smith, S.J.; Janetos, A.; Edmonds, J. Implications of Limiting CO2 Concentrations for Land Use and Energy. Science 2009, 324, 1183–1186. [Google Scholar] [CrossRef] [PubMed]
- Riahi, K.; Grübler, A.; Nakicenovic, N. Scenarios of long-term socio-economic and environmental development under climate stabilization. Technol. Forecast. Soc. Chang. 2007, 74, 887–935. [Google Scholar] [CrossRef]
- Van Vuuren, D.P.; Kriegler, E.; O’Neill, B.C.; Ebi, K.L.; Riahi, K.; Carter, T.R.; Edmonds, J.; Hallegatte, S.; Kram, T.; Mathur, R.; et al. A new scenario framework for Climate Change Research: Scenario matrix architecture. Clim. Chang. 2014, 122, 373–386. [Google Scholar] [CrossRef]
- Ramirez-Villegas, J.; Challinor, A.J.; Thornton, P.K.; Jarvis, A. Implications of regional improvement in global climate models for agricultural impact research. Environ. Res. Lett. 2013, 8, 024018. [Google Scholar] [CrossRef]
- Hawkins, E.; Osborne, T.M.; Ho, C.K.; Challinor, A.J. Calibration and bias correction of climate projections for crop modelling: An idealised case study over Europe. Agric. For. Meteorol. 2013, 170, 19–31. [Google Scholar] [CrossRef]
- Jones, J.; Hoogenboom, G.; Porter, C.; Boote, K.; Batchelor, W.; Hunt, L.; Wilkens, P.; Singh, U.; Gijsman, A.; Ritchie, J. The DSSAT cropping system model. Eur. J. Agron. 2003, 18, 235–265. [Google Scholar] [CrossRef]
- Heeren, D.M.; Werner, H.D.; Trooien, T.P. Evaluation of Irrigation Strategies with the DSSAT Cropping System Model; American Society of Agricultural and Biological Engineers (ASABE): St. Joseph, MI, USA, 2007. [Google Scholar]
- Parfitt, J.; Barthel, M.; Macnaughton, S. Food waste within food supply chains: Quantification and potential for change to 2050. Philos. Trans. R. Soc. B Biol. Sci. 2010, 365, 3065–3081. [Google Scholar] [CrossRef]
- Sonka, S.T. The ADM Institute for the Prevention of Postharvest Loss. Resour. Eng. Technol. Sustain. World 2012, 19, 18–19. [Google Scholar]
- Orlandi, F.; Rojo, J.; Picornell, A.; Oteros, J.; Pérez-Badia, R.; Fornaciari, M. Impact of Climate Change on Olive Crop Production in Italy. Atmosphere 2020, 11, 595. [Google Scholar] [CrossRef]
- Valdes-Abellan, J.; Pardo, M.; Tenza-Abril, A.J. Observed precipitation trend changes in the western Mediterranean region. Int. J. Clim. 2017, 37, 1285–1296. [Google Scholar] [CrossRef]
- Xia, L.; Robock, A.; Cole, J.N.S.; Curry, C.L.; Ji, D.; Jones, A.; Kravitz, B.; Moore, J.C.; Muri, H.; Niemeier, U.; et al. Solar radiation management impacts on agriculture in China: A case study in the Geoengineering Model Intercomparison Project (GeoMIP). J. Geophys. Res. Atmos. 2014, 119, 8695–8711. [Google Scholar] [CrossRef]
- Oteros, J.; García-Mozo, H.; Vázquez, L.; Mestre, A.; Dominguezvilches, E.; Galan, C. Modelling olive phenological response to weather and topography. Agric. Ecosyst. Environ. 2013, 179, 62–68. [Google Scholar] [CrossRef]
- Bindi, M.; Fibbi, L.; Gozzini, B.; Orlandini, S.; Miglietta, F. Modelling the impact of future climate scenarios on yield and yield variability of grapevine. Clim. Res. 1996, 7, 213–224. [Google Scholar] [CrossRef]
- Rezende, F.C.; Frizzone, J.A.; De Oliveira, R.F.; Pereira, A.S. CO2 and irrigation in relation to yield and water use of the bell pepper crop. Sci. Agricola 2003, 60, 7–12. [Google Scholar] [CrossRef]
- Kimball, B.; Idso, S.B. Increasing atmospheric CO2: Effects on crop yield, water use and climate. Agric. Water Manag. 1983, 7, 55–72. [Google Scholar] [CrossRef]
- Kruijt, B.; Witte, J.-P.M.; Jacobs, C.M.J.; Kroon, T. Effects of rising atmospheric CO2 on evapotranspiration and soil moisture: A practical approach for the Netherlands. J. Hydrol. 2008, 349, 257–267. [Google Scholar] [CrossRef]
- Lobell, D.B.; Gourdji, S.M. The Influence of Climate Change on Global Crop Productivity. Plant Physiol. 2012, 160, 1686–1697. [Google Scholar] [CrossRef]
- Gerhart, L.M.; Ward, J.K. Plant responses to low [CO2] of the past. New Phytol. 2010, 188, 674–695. [Google Scholar] [CrossRef]
- Zheng, Y.; Li, F.; Hao, L.; Shedayi, A.A.; Guo, L.; Ma, C.; Huang, B.; Xu, M. The optimal CO2 concentrations for the growth of three perennial grass species. BMC Plant Biol. 2018, 18, 1–12. [Google Scholar] [CrossRef]
- Conley, M.; Kimball, B.A.; Brooks, T.J.; Pinter, P.; Hunsaker, D.J.; Wall, G.W.; Adam, N.; Lamorte, R.; Matthias, A.; Thompson, T.L.; et al. CO2 enrichment increases water-use efficiency in sorghum. New Phytol. 2001, 151, 407–412. [Google Scholar] [CrossRef]
- Hatfield, J.L.; Prueger, J.H. Temperature extremes: Effect on plant growth and development. Weather. Clim. Extremes 2015, 10, 4–10. [Google Scholar] [CrossRef]
- Galán, C.; García-Mozo, H.; Cariñanos, P.; Alcázar, P.; Domínguez-Vilches, E. The role of temperature in the onset of the Olea europaea L. pollen season in southwestern Spain. Int. J. Biometeorol. 2001, 45, 8–12. [Google Scholar] [CrossRef]
- Tanasijevic, L.; Todorovic, M.; Pereira, L.S.; Pizzigalli, C.; Lionello, P. Impacts of climate change on olive crop evapotranspiration and irrigation requirements in the Mediterranean region. Agric. Water Manag. 2014, 144, 54–68. [Google Scholar] [CrossRef]
- Cho, J.; Oki, T. Application of temperature, water stress, CO2 in rice growth models. Rice 2012, 5, 10. [Google Scholar] [CrossRef]
- Ray, D.K.; Gerber, J.S.; Macdonald, G.K.; West, P.C. Climate variation explains a third of global crop yield variability. Nat. Commun. 2015, 6, 5989. [Google Scholar] [CrossRef]


| Model | Research Center | Resolution | |
|---|---|---|---|
| Atmosphere | Ocean | ||
| bcc_csm1.1 | Beijing Climate Center (BCC), China Meteorological Administration (CMA), China | 2.8° × 2.8° | 0.8° × 1.0° |
| csiro_mk3_6.0 | Commonwealth Scientific and Industrial Research Organisation (CSIRO) and the Queensland Climate Change Centre of Excellence (QCCCE), Australia | 1.85° × 1.875° | 1.0° × 1.875° |
| ipsl_cm5a_mr | Institut Pierre-Simon Laplace, France | 1.27° × 2.5° | --- |
| miroc_miroc5 | Atmosphere and Ocean Research Institute (The University of Tokyo), National Institute for Environmental Studies, and Japan Agency for Marine-Earth Science and Technology, Japan | 1.4° × 1.4° | 0.8° × 1.4° |
| Climate Scenarios | Yield (kg ha−1) | Precipitation (mm) | Irrigation (mm) | Water Demand (mm) | CO2 Concentration (ppm) | |
|---|---|---|---|---|---|---|
| Baseline (1980–2004) | 5467 | 729 | 290 | 494 | 359 | |
| Current climate scenario (2006–2015) | 5580 | 742 | 288 | 512 | 390 | |
| RCP 2.6 | 2020–2029 | 5590 | 797 | 271 | 519 | 421 |
| 2030–2039 | 5423 | 763 | 274 | 485 | 436 | |
| 2040–2049 | 5302 | 730 | 270 | 488 | 441 | |
| 2050–2059 | 5306 | 779 | 281 | 490 | 443 | |
| RCP 4.5 | 2020–2029 | 5760 | 865 | 254 | 523 | 464 |
| 2030–2039 | 5574 | 814 | 275 | 508 | 447 | |
| 2040–2049 | 5667 | 869 | 252 | 510 | 473 | |
| 2050–2059 | 5255 | 775 | 272 | 481 | 497 | |
| RCP 6.0 | 2020–2029 | 5591 | 800 | 274 | 504 | 456 |
| 2030–2039 | 5239 | 734 | 278 | 482 | 438 | |
| 2040–2049 | 5277 | 809 | 273 | 485 | 462 | |
| 2050–2059 | 5247 | 844 | 257 | 474 | 492 | |
| RCP 8.5 | 2020–2029 | 5624 | 759 | 285 | 501 | 435 |
| 2030–2039 | 5665 | 820 | 266 | 509 | 466 | |
| 2040–2049 | 5542 | 774 | 277 | 496 | 511 | |
| 2050–2059 | 5148 | 834 | 265 | 468 | 567 | |
| Irrigation Requirement (%) | |||||
|---|---|---|---|---|---|
| Climate Scenarios | Management Practice 1 | Management Practice 2 | Management Practice 3 | Management Practice 4 | Management Practice 5 |
| Current Climate Scenario | 28 | 45 | 32 | 36 | 19 |
| RCP 2.6 | 27 | 44 | 31 | 38 | 24 |
| RCP 4.5 | 26 | 43 | 28 | 35 | 22 |
| RCP 6.0 | 23 | 39 | 26 | 30 | 17 |
| RCP 8.5 | 24 | 41 | 25 | 33 | 21 |
Publisher’s Note: MDPI stays neutral with regard to jurisdictional claims in published maps and institutional affiliations. |
© 2020 by the authors. Licensee MDPI, Basel, Switzerland. This article is an open access article distributed under the terms and conditions of the Creative Commons Attribution (CC BY) license (http://creativecommons.org/licenses/by/4.0/).
Share and Cite
Jha, R.K.; Kalita, P.K.; Cooke, R.A.; Kumar, P.; Davidson, P.C.; Jat, R. Predicting the Water Requirement for Rice Production as Affected by Projected Climate Change in Bihar, India. Water 2020, 12, 3312. https://doi.org/10.3390/w12123312
Jha RK, Kalita PK, Cooke RA, Kumar P, Davidson PC, Jat R. Predicting the Water Requirement for Rice Production as Affected by Projected Climate Change in Bihar, India. Water. 2020; 12(12):3312. https://doi.org/10.3390/w12123312
Chicago/Turabian StyleJha, Ranjeet K., Prasanta K. Kalita, Richard A. Cooke, Praveen Kumar, Paul C. Davidson, and Rajkumar Jat. 2020. "Predicting the Water Requirement for Rice Production as Affected by Projected Climate Change in Bihar, India" Water 12, no. 12: 3312. https://doi.org/10.3390/w12123312
APA StyleJha, R. K., Kalita, P. K., Cooke, R. A., Kumar, P., Davidson, P. C., & Jat, R. (2020). Predicting the Water Requirement for Rice Production as Affected by Projected Climate Change in Bihar, India. Water, 12(12), 3312. https://doi.org/10.3390/w12123312