1. Introduction
The frequent recurrence of intense rainfall events that trigger catastrophic flash floods is a climatic signature of Italy, and is one of the causes of the high vulnerability of the Italian territory, where a high population density is associated with a complex topography, extended coastlines and high climate variability. According to the Istituto Superiore per la Protezione e la Ricerca Ambientale (ISPRA), 4.1% of the Italian territory is characterized by a high probability of inundation scenario (return period of 20–50 years), 8.4% by a medium-probability scenario (return period of 100–200 years) and 10.9% by a low-probability scenario [
1]. By merging these data with the population density, it is possible to estimate that more than 2 million inhabitants (3.5% of the entire Italian population) are currently living in a location with a high probability of such an event, while 6.2 and 9.3 million inhabitants live in medium- and low-probability event locations, respectively [
1]. An accurate estimation of extreme rainfall (in terms of magnitude, duration and frequency) is urgently needed for such a complex and vulnerable territory for planning, design and management purposes. The need to build a uniform dataset of rainfall extremes for Italy is evident, due to its position in the middle of the Mediterranean Sea, in order to integrate meteorological and climate data from the past, and to better discriminate the hazard of rainfall deriving from Synoptic Systems, Convective Systems or Mediterranean Hurricanes (“Medicanes”) [
2,
3,
4,
5].
Rainfall frequency and large-scale trend analyses require a complete, updated and quality-controlled dataset of extreme rainfall depths, which are usually available in the form of annual maxima records. Unfortunately, this type of information still requires a uniformity re-assessment for the Italian territory: such information is fragmented in Italy (each Italian Region collects a subset of this information) and processed/stored in different formats [
2]. The most recent effort made to complete a uniform Italian database of rainfall extremes is the Italian–Rainfall Extreme Dataset (I-RED) [
2], which is an upgrade of the first database, created as part of the Characterisation of Ungauged Basins by Integrated uSe of hydrological Techniques (CUBIST) project [
6]. The latter was mainly based on the digitalization of the Hydrological Yearbooks of the National Hydrological and Mareographic Service (SIMN) [
7] and on some additions resulting from the Valutazione delle Piene (VAPI) project [
8]. Among other databases, it is worth mentioning the one available for extreme daily rainfall [
5] and the one created by the Italian National Research Council (CNR) Research Institute of the Geo-Hydrological Protection (IRPI), which made reference to approximately 800 rain gauges in north-eastern Italy (Trentino-Alto Adige, Veneto and Friuli Venezia Giulia) [
9]. As far as daily observational precipitation datasets are concerned, the ARchivio Climatologico per l’Italia centro-Settentrionale (ARCIS) database [
10] is also interesting, as it was created using 1762 stations in north and central Italy, and interpolating them to produce a high-resolution (5 × 5 km) daily gridded dataset from 1961 to 2015. Other datasets that cover the Italian domain are reanalysis datasets, such as ERA5-Land (1981–present, 0.1° spatial resolution) [
11], NOAA 20th-century reanalysis V3 (1836–2015, 1° spatial resolution) [
12] and MERIDA (1990-present, 7 km spatial resolution) [
13]. The advantages of working with a rain-gauges-based dataset, like I-RED, emerge both as regards the greater spatial resolution and in consideration that its annual maxima reflect the actual highest rainfall in moving windows with length for 1 to 24 h. This is not the case for the reanalysis datasets.
The original I-RED database has been already used in a few investigations (see, e.g., [
14]), but its coverage is limited to 2010, which does not allow, e.g., to answer technical questions about recent and very severe weather events in Italy (e.g., the 2018 “Vaia Storm” [
15]). We have therefore decided to update the available sources of data and to proceed with an advanced data quality control, in terms of consistency, redundancy, gap-filling of records and systematic geographical checks, to ensure that the corrected position and elevation of the stations could be of help in investigations on the spatial distribution of extreme statistics. The elevation of the Italian territory is quite variable, and it is therefore very important to deal with correct data about the geographic positions of the rain gauges in view of, for example, a geostatistical analysis, where the elevation provides additional information as a secondary variable [
16,
17].
Such an effort has led to the production of a newly compiled Improved I-RED (I2-RED) database, which includes the annual maximum rainfall depths for 1, 3, 6, 12 and 24 consecutive hours from 5265 weather stations across Italy, recorded between 1916 and 2019. Details about the quality-control procedures applied to correct inconsistencies and errors are presented in the following sections, as well as details about the automatic and non-automatic quality checks applied by the agencies involved in the data collection before the data can be released.
Findable, Accessible, Interoperable and Re-usable (“FAIR”) data principles [
18,
19] are addressed in I
2-RED. The database shows a high level of uniformity: all the rainfall measurements are expressed in mm, while the positions of all the rain gauges are converted into a single, uniform reference system. Metadata are included in the database in pdf file format. The final version of the I
2-RED database is available on Zenodo, albeit with restricted access, due to the data policies of the regional hydrological agencies. Information about the data policies is reported at the end of this manuscript. A Digital Object Identifier (
https://doi.org/10.5281/zenodo.4269509) and relevant keywords have also been assigned. Data are stored in both mat and in csv format (to make it accessible to all open-source programs). No specific code is required to access or work with the data. The volume of the final database is less than 10 MB, thus making the database easily transferable and storable.
This paper is structured as follows:
Section 2 deals with the details of the data collection; the data updating and gap filling are described in
Section 3, while the applied quality control procedures, e.g., to recover station elevations, are described in
Section 4. A description of the quality-controlled database is given in
Section 5, together with climatological information. An extreme value analysis and an additional error detection procedure are reported in
Section 6. The discussion and conclusions are reported in
Section 7, while the data policy is summarized in
Section 8.
2. Data Collection
The historical data (i.e., data acquired before the dismantlement of SIMN) included in I-RED are freely available in the SIMN Hydrological Yearbooks [
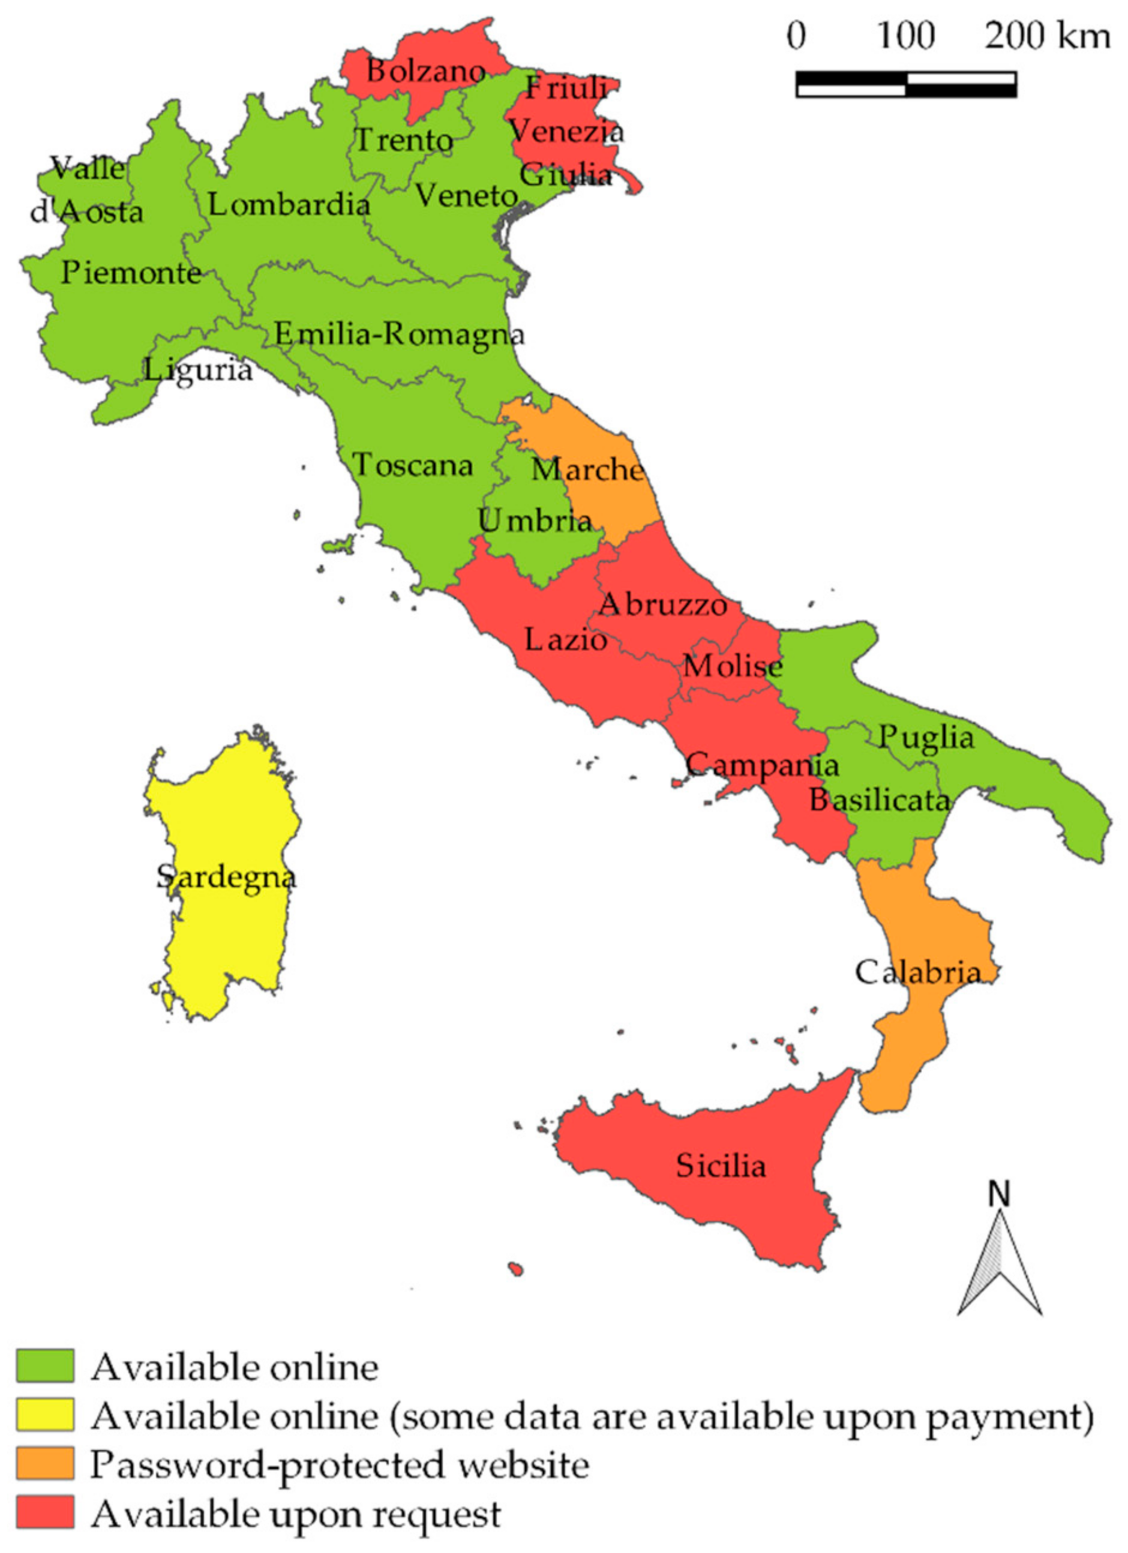
7]. The dismantlement of SIMN, which was planned with Legislation Decree 112/1998, resulted in the data collection and management tasks being transferred to a regional level, that is, to 19 Regions and 2 Autonomous Provinces. Once the regional services had been set-up, the local authorities adopted different data distribution policies, even though, according to the Italian law, an Open Data policy should be applied to public data for research and no-profit purposes. The most important laws regarding Open Data in Italy are Legislative Decree 82/2005, Legislative Decree 36/2006, Law 221/2012, Legislative Decree 179/2012 and Law 114/2014 [
2]. As of 2020, some agencies have not published the data (raw or validated) on their website, and only make them available upon request, in order to track data usage and prevent them from being used for commercial purpose. Access to the data is granted after either sending a request or filling a request form that users can find on the agency’s website. Those who have received authorization are then granted access to a database, the delivery of digitized tables or, on occasion, the delivery of pdf files. Information about the validation criteria applied by the regional agencies and measurement accuracy are, unfortunately, not provided together with the data. In early 1900, most of the instruments were mechanical ones. Starting from about 1980, all old mechanical stations were replaced with mechanical and digital ones. This led to data with different accuracies within the same dataset.
A list of the hydrological agencies that conduct the data collection and management after the dismantlement of SIMN are reported in
Appendix A. The Provinces of Trento and Bolzano are located in the same Region, but are handled separately, because they have different data providers. In order to include them in the list, we generically refer to Italian “regions”.
Figure 1 summarizes the data policies of the original data, as reported in
Appendix A. Information about the data policies and how raw data can be accessed is also included. In the new database, I
2-RED, each Italian “region” has a specific progressive number that ranges from 1 to 21, and this number is reported in the rainfall station ID assigned to I
2-RED. The last three digits of each rainfall station ID refer to a progressive number within each “region”, while the first number (1 to 21) identifies the “region” and refers to the progressive numbers reported in
Appendix A.
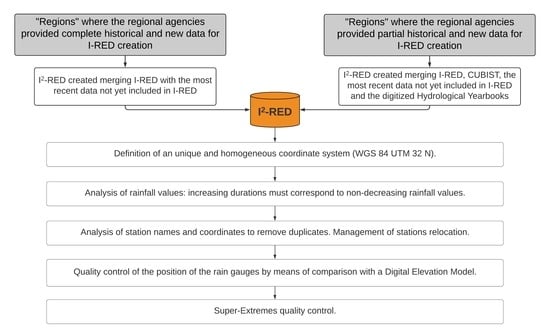
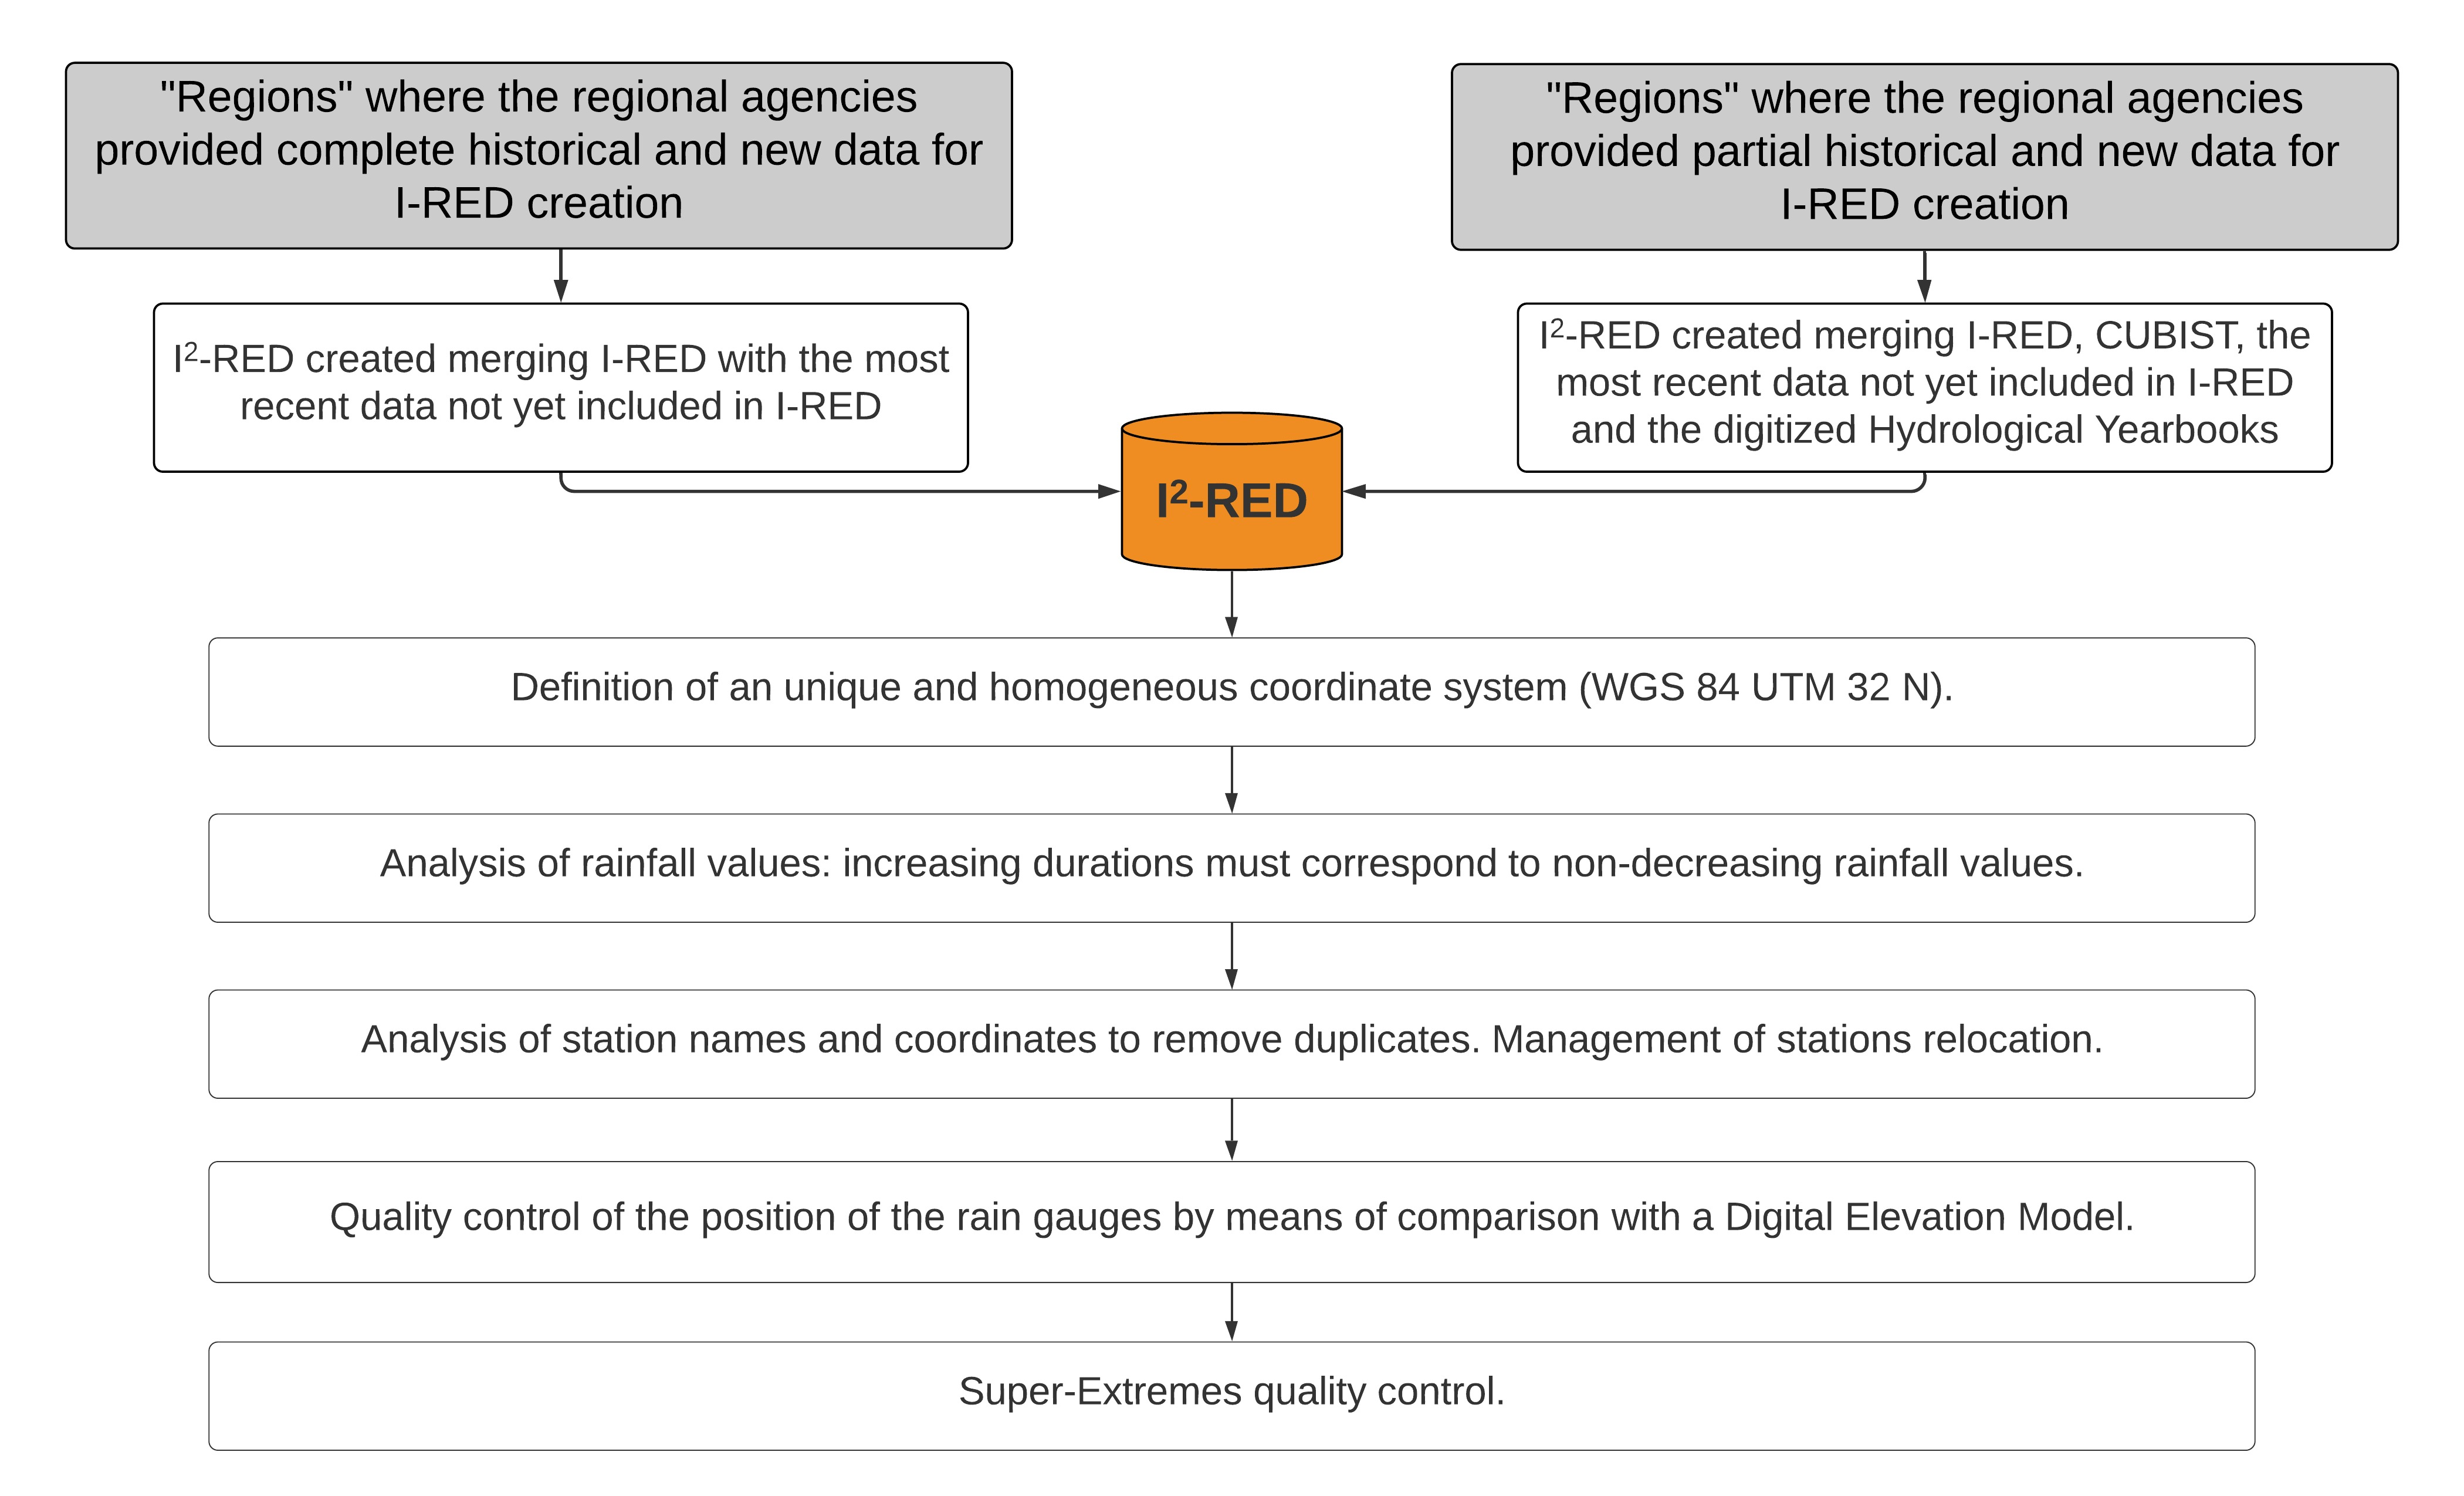
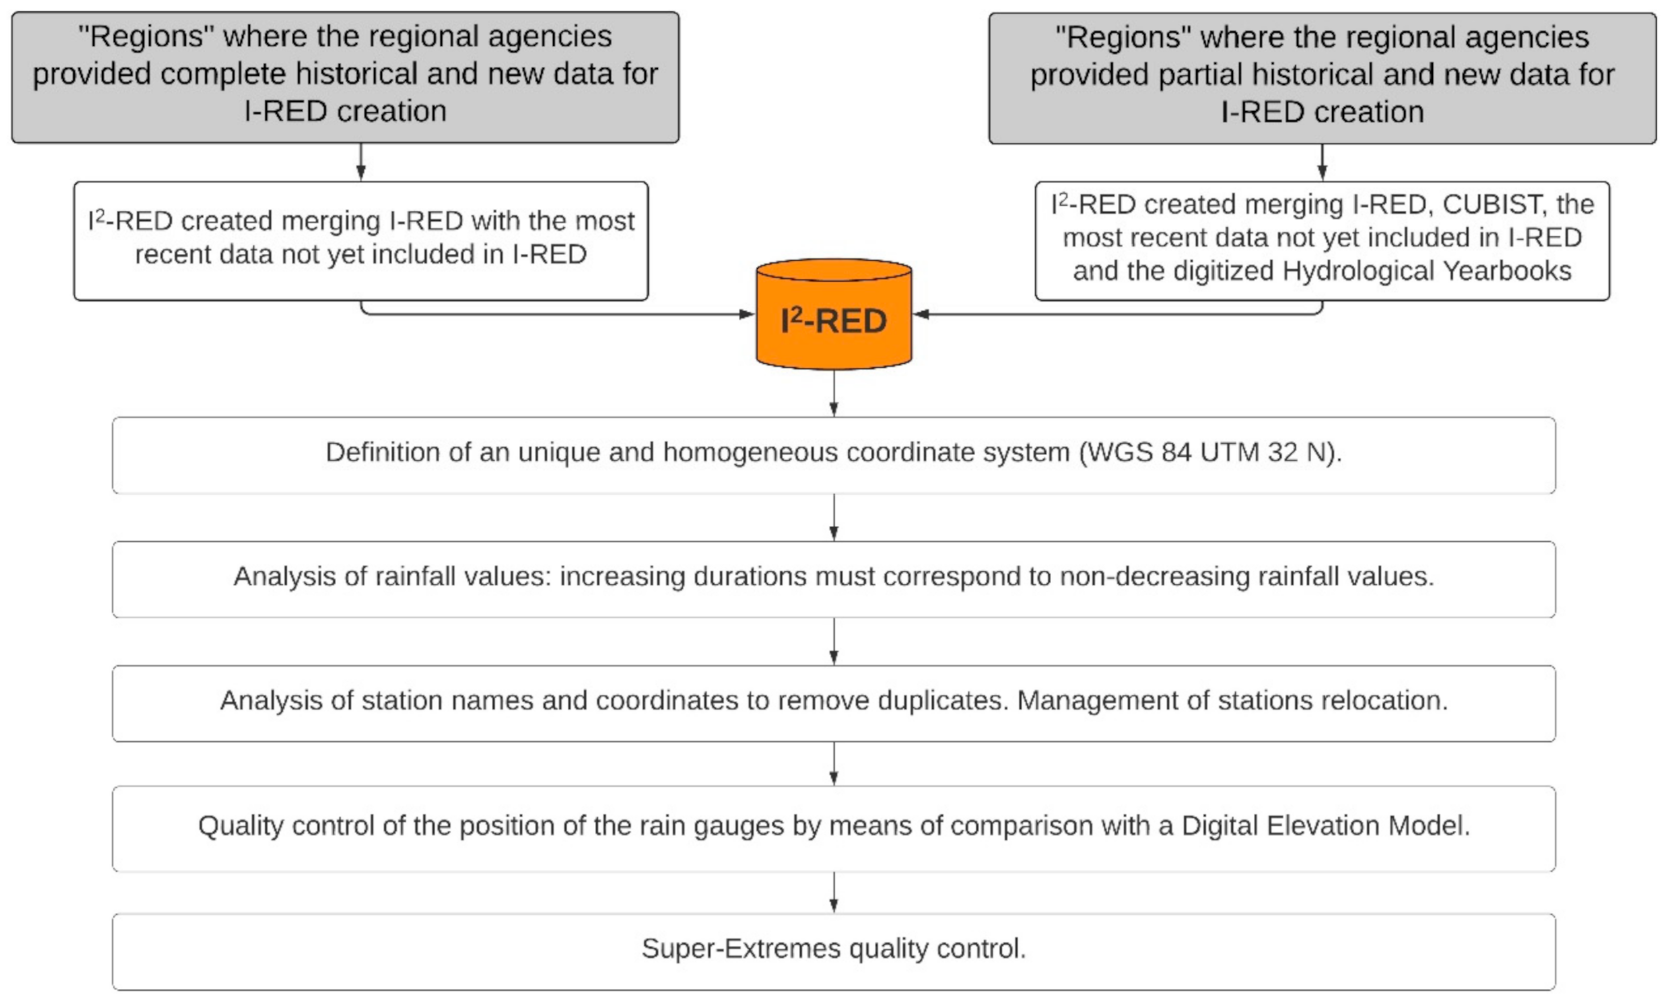
Because of the complexity of the data-merging operations, most of the work requested to build the new I2-RED database was performed in manual mode, by visually inspecting the data. Data merging was of fundamental importance, particularly as some “regions” did not have an editable, easily accessible and complete version of the database (most of them store the data in pdf files, on a yearly basis). Only some “regions” have carried out activities in order to merge historical and new data in an easily accessible format. Different geographic coordinates systems are used by the regional agencies. In some cases, historical and new data are even geo-referenced within the same “region” using different systems. In the I2-RED database, all the station coordinates were made available in the Universal Transverse Mercator coordinate system (that is, WGS 84 UTM 32 N, EPSG 32632) to guarantee uniformity at the national level.
Like the I-RED database, which was created following four different procedures, depending on the data availability [
2], the creation of I
2-RED required the application of different methods that would be able to allow a rigorous quality check to be made, as described in detail in
Section 3. Other quality checks are also described in
Section 4 and
Section 6. The entire workflow is summarized in
Figure 2.
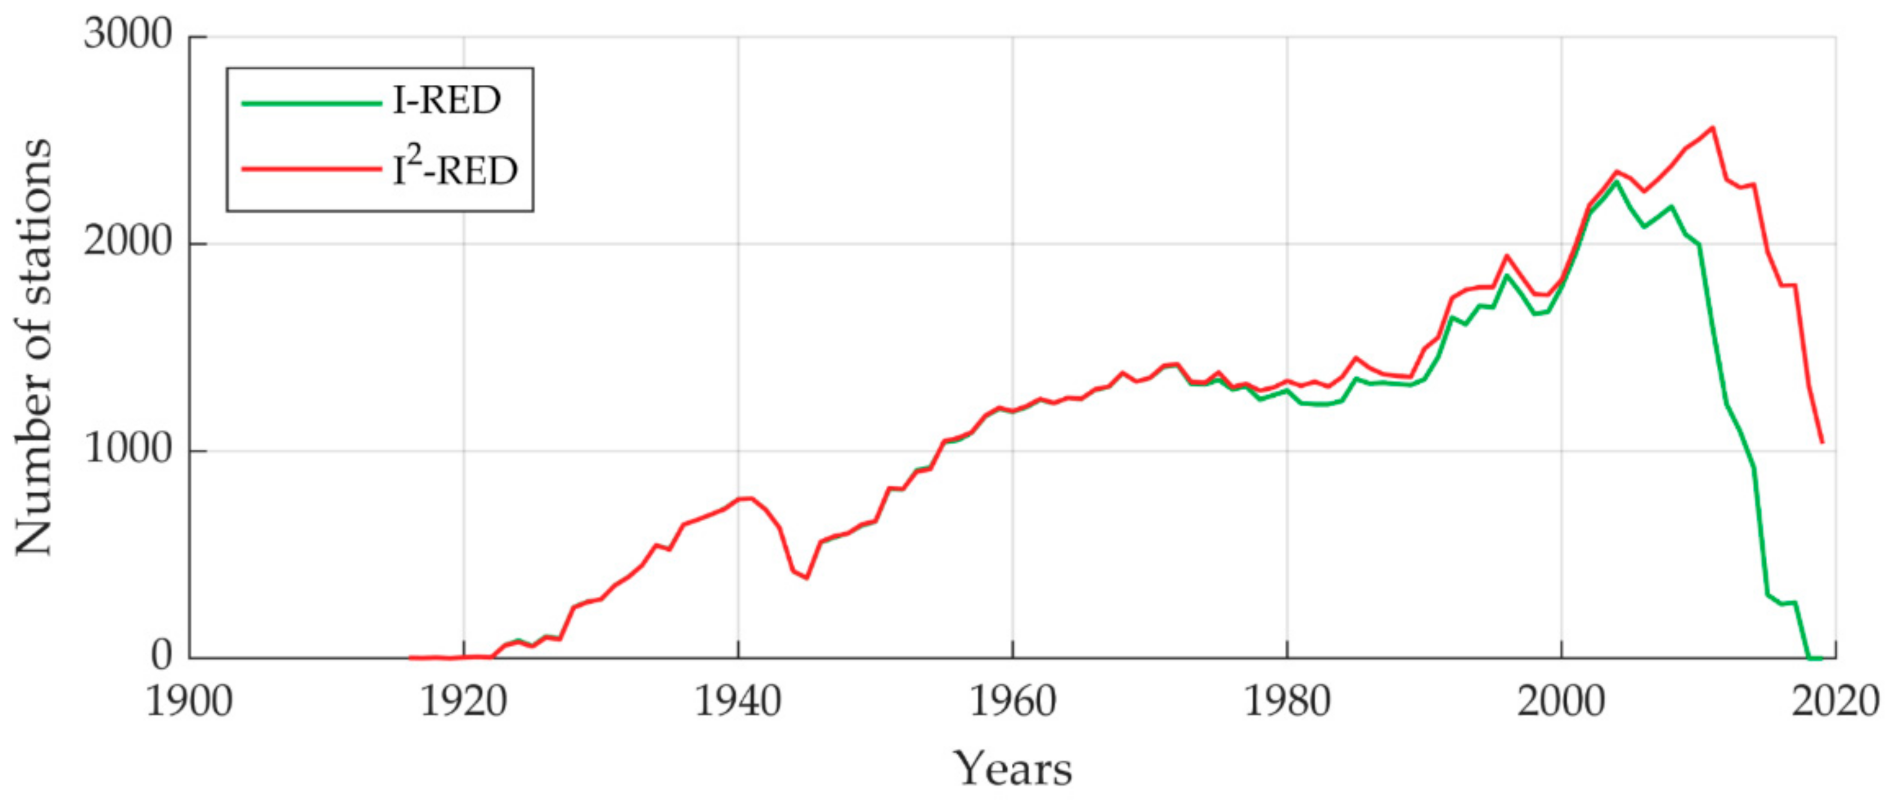
The newly compiled I
2-RED database consists of 5265 stations, and the data covers the 1916–2019 period (the number of available stations can be seen in
Figure 3). The lack of a considerable number of measurements between 1940 and 1950 is due to the Second World War, while the apparent reduction in the number of rain gauges between 1996 and 2000 was mainly induced by the effect of the dismissing of SIMN: in those years, some “regions” decided not to upgrade or repair the old rainfall stations, and most of the old mechanical tipping-bucket rain gauges were progressively substituted by automatic ones. Finally, the decreasing number of stations that emerges in recent years is due to the fact that, for the most recent years, data were not yet available in some “regions” (e.g., the most recent data available for the Trento province date back to 2009, the most recent data for Piemonte date back to 2017).
3. Data Update and First Quality Control
As reported in
Section 2, the data updating was accompanied by a robust and ad-hoc quality check that has taken into account how I-RED was originally created. In particular, in “regions” where the data provider had already digitized their part of the SIMN database, the CUBIST database was not used. In this case, the data updating performed in I
2-RED involved updating I-RED with the most recent data. In the other cases (i.e., in “regions” where the agencies only had partial coverage of historical data), we extracted the remaining historical data from the CUBIST database, and the data updating performed in I
2-RED was carried out manually in three steps, to maximize the available data and avoid duplicates. First, the I
2-RED database was updated to include the data for the most recent years that was not included in I-RED. Secondly, any data that were missing were extracted from CUBIST and then included. Thirdly, because of the low number of digitized data for some years, a manual data input from the Hydrological Yearbooks proved to be necessary to fill the gaps in both the CUBIST database and in the digitized versions of the historical data received from the local authorities. In order to do so, the Hydrological Yearbooks (available as a scanned copy in pdf format) were digitized using optical character recognition (OCR) software and compared with the already available data to detect values that had not been included.
Thanks to the previously mentioned gap-filling procedures in I
2-RED, it was possible to reduce the percentage of missing transcriptions. However, some inconsistencies in the series still persisted, e.g., cases in which a rainfall measurement was not available for a specific duration but was available for others. This could be due to transcription mistakes in the Hydrological Yearbooks.
Table 1 shows the percentage of these missing transcription within both databases, and also highlights the greater completeness reached with I
2-RED.
A first algorithm-based analysis was performed to verify that rainfall values corresponding to increasing durations were consistent (i.e., the annual maxima related to a 1-h interval had to be lower or at least equal to the 3-h one). Several errors emerged within the database, thus highlighting the necessity of checking the value of the raw data in order to substitute it with the correct one or with a “Not a Number”.
For a complete description of the first raw data quality improvement achieved in I2-RED, it is important to highlight that almost every hydrological agency also has rainfall stations in nearby “regions”, as a result of the joint management of interregional basins. The values reported in the I2-RED database were therefore checked by comparing the time series of each rain gauge with all the other ones: this check allowed us to identify some stations located along the regional boundaries that had been included twice (sometimes with the same station name, sometimes not) with similar positions and the same equal rainfall values. As some “regions” shared their data with other agencies before applying a validation procedure, the visual data check was of fundamental importance to avoid data duplication. Stations with the same name, similar coordinates and with a time overlap were merged if the rainfall measurements were the same, otherwise they were considered as different stations in the presence of geographic or record length discrepancies. A few cases of station-overlapping were also found in the case of stations with almost the same latitude/longitude (i.e., at a distance of less than 200 m).
A brief mention should also be made of the thorny problem of station relocation. Unfortunately, some “regions” did not track the relocation of some stations by changing the name, the position, or the instrument code in their databases. When it was possible to recognize that new and historical data had been collected by different weather stations (e.g., thanks to some years of missing data or to the information collected by regional authorities, reports), the data were handled separately, and two different stations were reported in I2-RED. When it was not possible to obtain such information, the time series were merged and only one rain gauge was considered.
4. Quality Control on the Station Elevation
As mentioned in the Introduction, one of the main innovations of the I
2-RED database, with respect to I-RED, is the extensive application of quality control, both through manual and automated methods. We used the European Digital Elevation Model (EU—DEM), version 1.1 [
20], a Digital Surface Model (DSM) with European coverage, a 25 m resolution and a vertical accuracy equal to ±7 m to check the reliability of each station elevation.
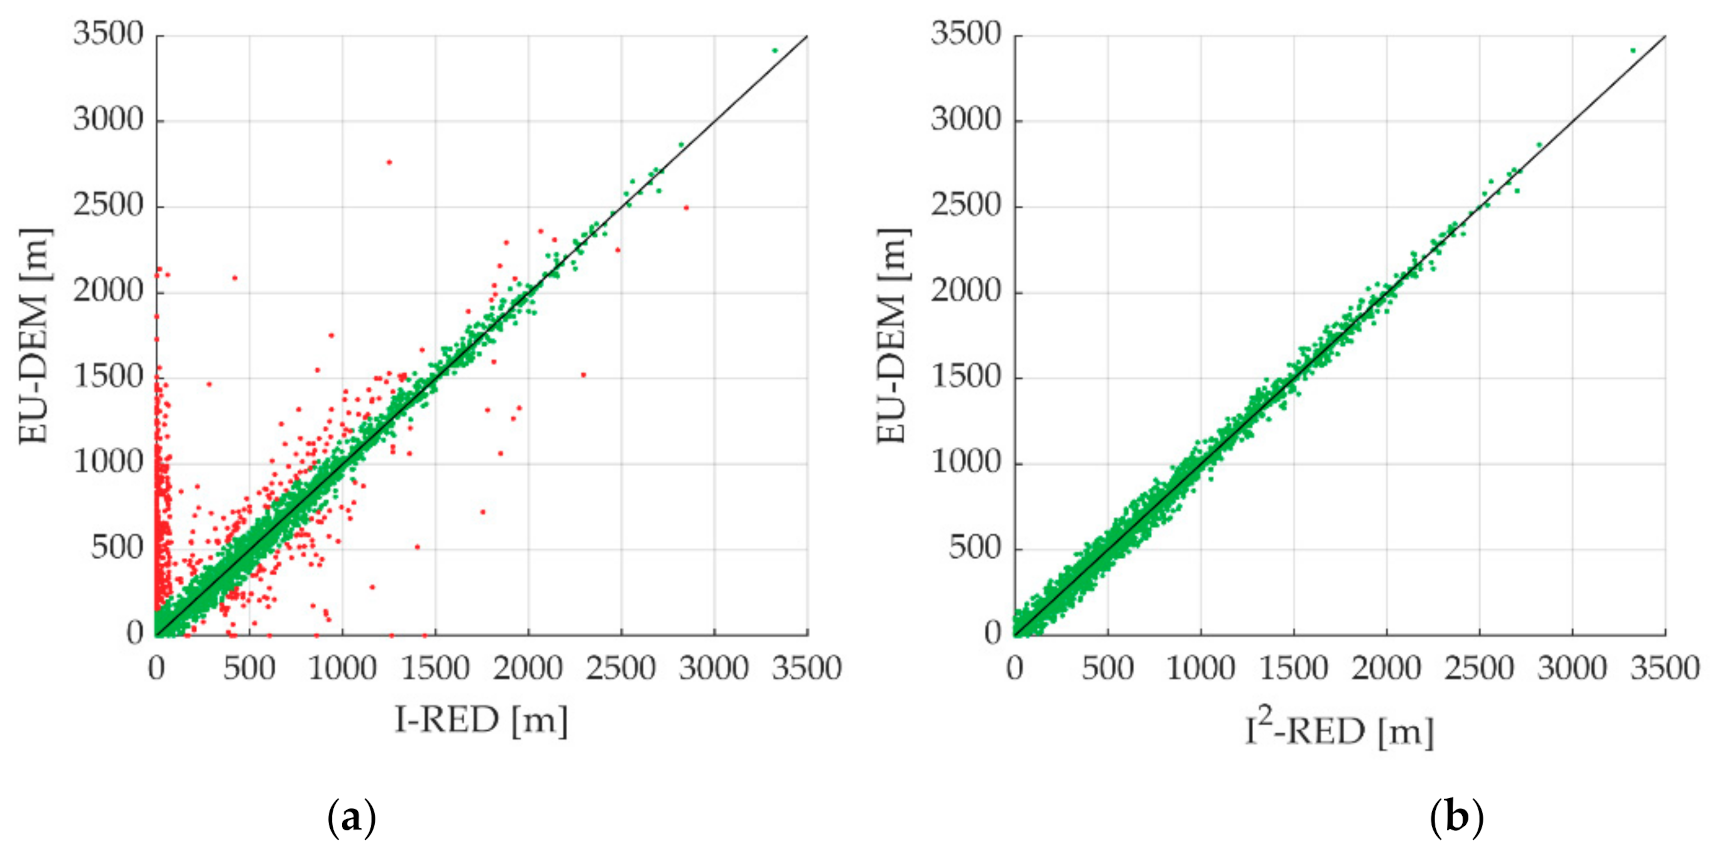
The planimetric position of each rain gauge was used to extract the corresponding elevation values from EU-DEM. After a comparison between the elevations obtained from EU-DEM and those reported in I-RED, several errors emerged in the original database. The relative difference between these two measurements was evaluated, and a threshold value equal to 150 m was used to identify rain gauges that needed to be checked and corrected before using the data for further analyses. As reported in
Figure 4a, 790 stations out of a total of 5265 were affected by significant elevation errors, which varied from 150 to more than 2000 m.
During this geographic analysis, it emerged that there were three types of elevation errors: (i) only an incorrect elevation, (ii) an incorrect position but correct elevation, (iii) both an incorrect position and an incorrect elevation. In order to understand the reasons for this variety of errors, it is important to note that the accuracy of the coordinates is not uniform in either the I-RED database or in the I2-RED one. The coordinates of the rain gauges installed in recent years are characterized by metric or sub-metric precision, while the old ones have kilometric precision (i.e., in the Hydrological Yearbooks, they are expressed in degrees and in minutes, and no information is reported about seconds). Such a low positional accuracy explains why considerable errors could arise in the position and, more importantly, in the elevation, especially in mountainous areas.
A manual correction was applied to each of the points highlighted with a red dot in
Figure 4a. In particular, information about the correct position was collected from other sources available online (e.g., reports, scientific publications). In some cases, the agencies involved in the data collection were contacted directly to discuss the issue. In the case of the Autonomous Province of Bolzano-Alto Adige, it was possible to partially substitute the positions derived from the Hydrological Yearbooks with more accurate ones, thanks to detailed information received from the competent regional agency. When possible (i.e., for the most recent stations), Google Earth was used to visually check whether a rain gauge was present in the position reported in the database, taking advantage of the Street View mode. In a few cases, when it was not possible to obtain further information about the position (e.g., for stations that were active in the early 1900s), a rain gauge was not relocated, and the elevation extracted for EU-DEM was confirmed. The results of the elevation quality control are shown in
Figure 4b, which shows that all the rain gauges previously affected by an elevation error greater than 150 m have now been corrected in the I
2-RED database.
The distribution of the rain gauges over the different elevations in Italy is reported in
Table 2. As can be seen, 34% of the rain gauges are located in sites with a lower elevation than 200 m a.s.l., while 62% of the rain gauges are located in sites with a lower elevation than 500 m a.s.l. Only 5% of the rain gauges are located in areas with a high elevation (i.e., >1500 m a.s.l).
5. Time and Space Uniformity of the I2-RED Database
After the operations described in the previous Sections, a new and reliable data source was compiled for the extreme rainfall in Italy. The main features of the data collection and of the update are presented in this section.
I-RED [
2] was made up of 105,940 different records for every duration. The new I
2-RED database presents 122,217 records. By dividing the number of records by the number of stations (5265), it is possible to obtain the average length of the time series: 22.5 years for I-RED and 23.2 years for I
2-RED.
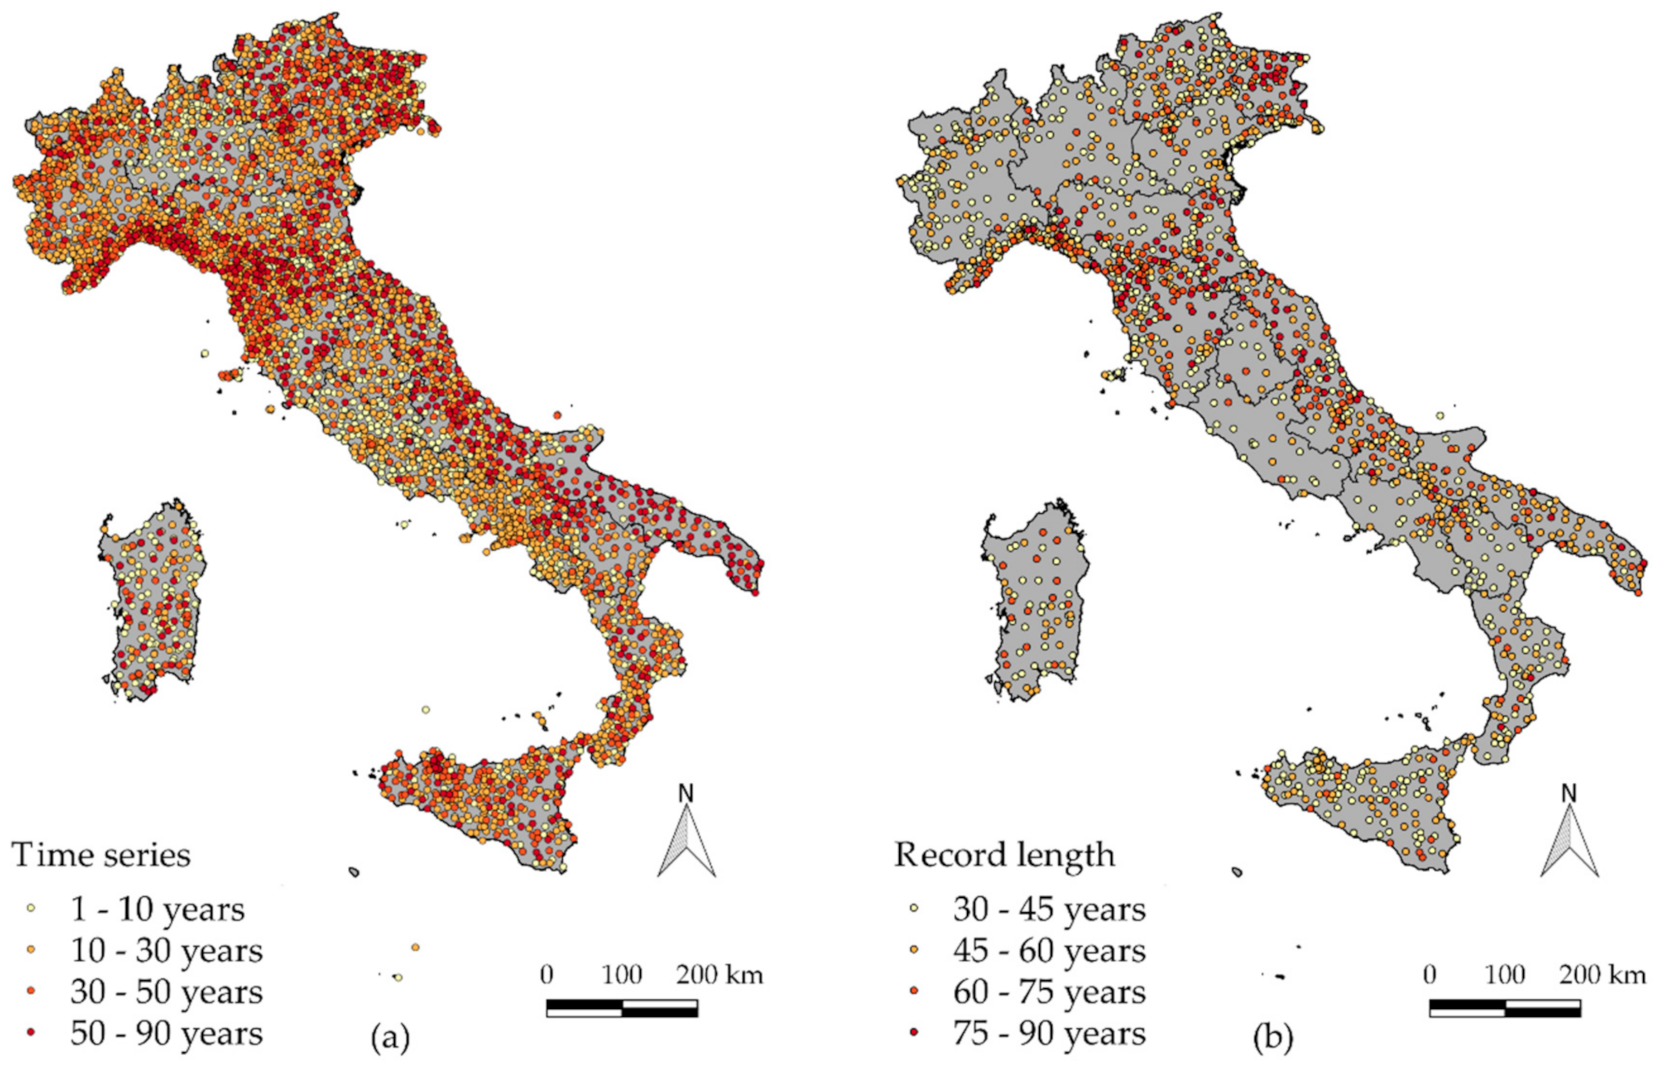
Some features of the rainfall stations are mapped in
Figure 5.
Figure 5a, in particular, maps the length of the time series of each rain gauge included in I
2-RED. Out of a total of 5265 rain gauges:
3782 rain gauges have a time series equal to or longer than 10 years;
2283 rain gauges have a time series equal to or longer than 20 years;
1436 rain gauges have a time series equal to or longer than 30 years;
693 rain gauges have a time series equal to or longer than 50 years;
52 rain gauges have a time series equal to or longer than 80 years.
The evolution in the management of the rain gauge network is one of the main factors that has led to a short and fragmented dataset in Italy. It is important to highlight that, although the database consists of 5265 rain gauges, only 1436 of these are characterized by a time series of at least 30 years, which is the standard length for climatological analyses [
21,
22] (
Figure 5b). Although the most recent stations were installed to locally increase the network density, they unfortunately still provide little suitable information for these types of analysis. The inhomogeneity of the record length is also influenced by the different degrees of accuracy adopted by each regional agency. In fact, some agencies recorded small relocations of the station position, which do not break the series, while others did not (as already pointed out in
Section 3). In order to become aware of the spatial and temporal evolution of the Italian rain gauge network, it may be useful to watch a stop-motion video that shows a map of the active rainfall stations for each year of the whole observation period (
Supplementary Material, Figure S1).
The geographical uniformity and density of the stations throughout Italy are also worth considering. Observing the map in
Figure 5b, it is possible to observe that Umbria, Lazio, Sardegna, Campania and Lombardia are characterized by the lowest densities (for named “regions” see
Figure 1). In particular, the coastal area of Campania shows a very low number of rain gauges, even though it is known to be an area that is affected by a high number of extreme events. A general picture of the network density in the different “regions” in Italy is reported in
Table 3.
However, more detailed information about the station density is still needed, due to the particular form of the Italian peninsula, and to an apparent proliferation of stations in highly urbanized areas. A clear variation in station density can, in fact, affect the spatial analyses of extreme rainfall quantiles, or evaluations related to the areal persistence of trends, as pointed out by [
14].
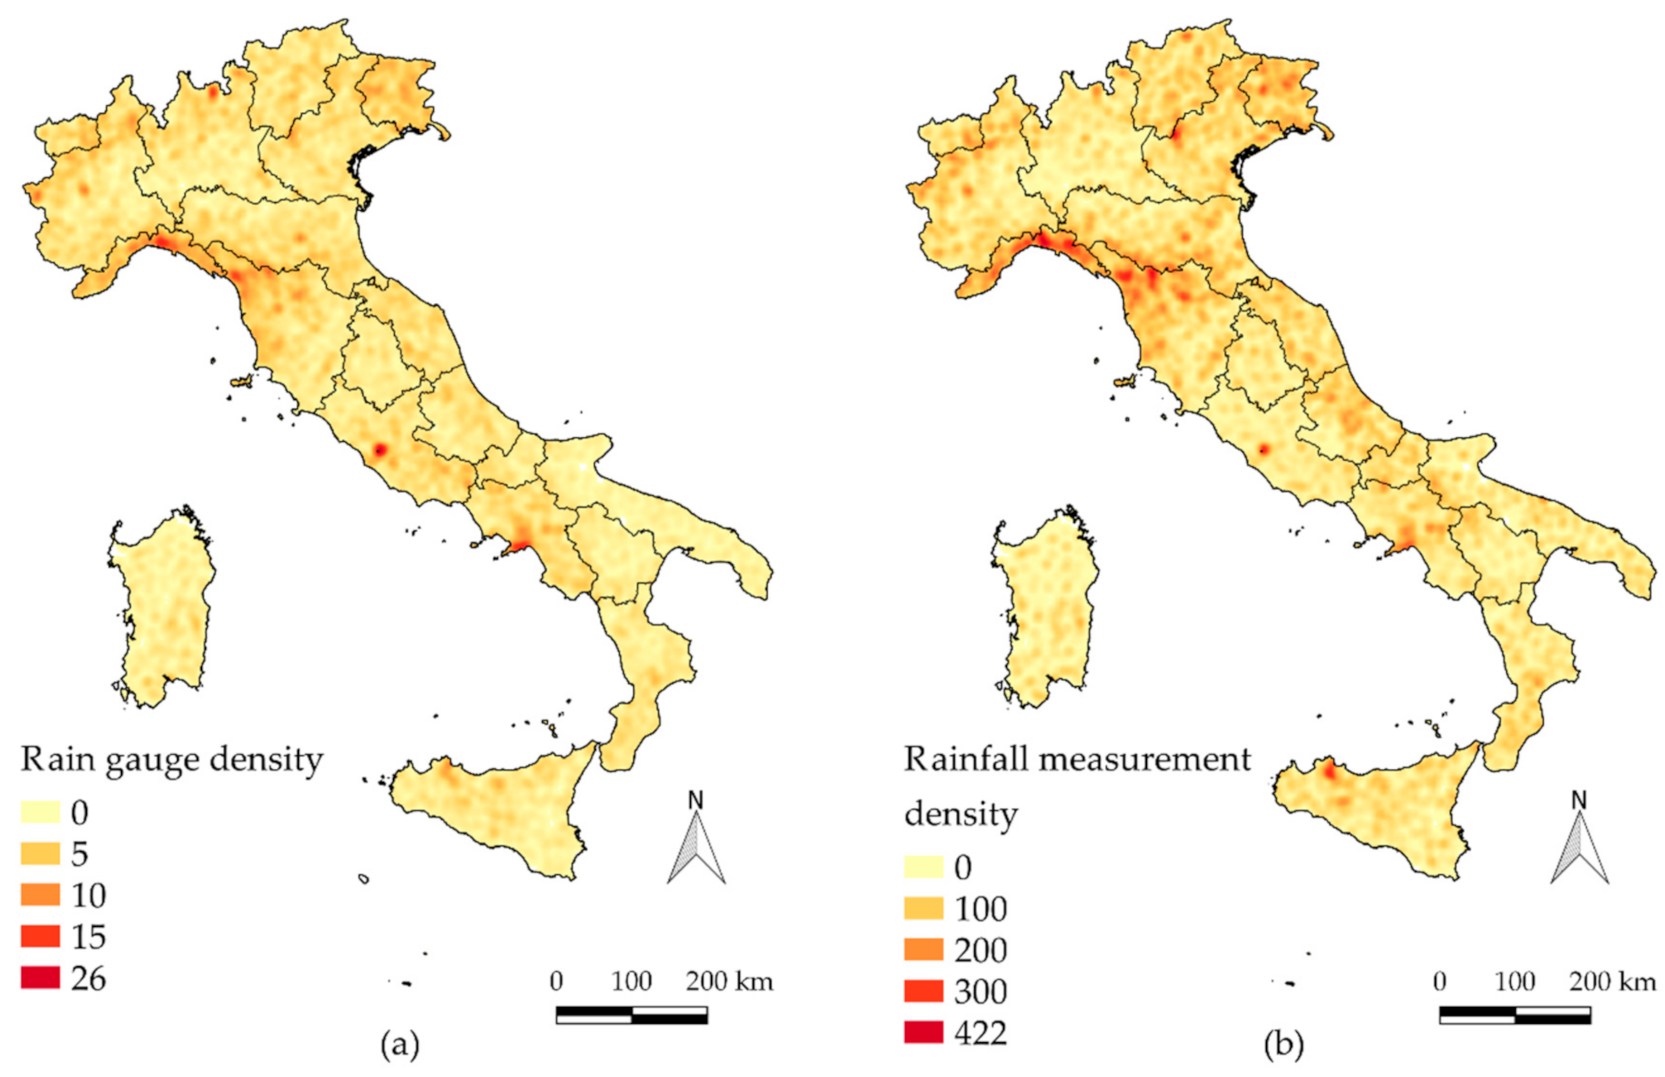
Figure 6 shows two density maps built with the I
2-RED database, using a spatial grid of 2 × 2 km. The number of rain gauges available within a 10 km radius, centered in the cell, was computed for each pixel of the grid (
Figure 6a). Dense spots may be observed in correspondence to the cities of Rome, Turin, Bologna, etc. The sum of all the observations pertaining to the stations contained in the circle was systematically computed to take into account the density of observations (
Figure 6b), thereby allowing any evident non-uniformity in the data density to emerge. High-density values can be observed for Northern Italy, especially over Liguria, southern areas of Piemonte, Toscana and Friuli Venezia Giulia.
In order to explore the potential of the database to map the climatology of extreme rainfall at the national scale, a first preliminary analysis was conducted over the entire domain. We started with the representation of the parameters of the depth–duration–frequency curves (DDF). The mean depth–duration curve is often expressed in the form of a power–law relationship [
24]
where
hd is the average of the annual maximum precipitation depth for the duration
d, and
a and
n are site parameters estimated by means of linear regression between
d and the available values of
hd. If a rainfall quantile
hd is required for a given return period
T, the above expression can be multiplied with a growth factor
K(T), according to the index-value approach [
25].
Rain gauges with at least 10 years of data were used to estimate both
a and
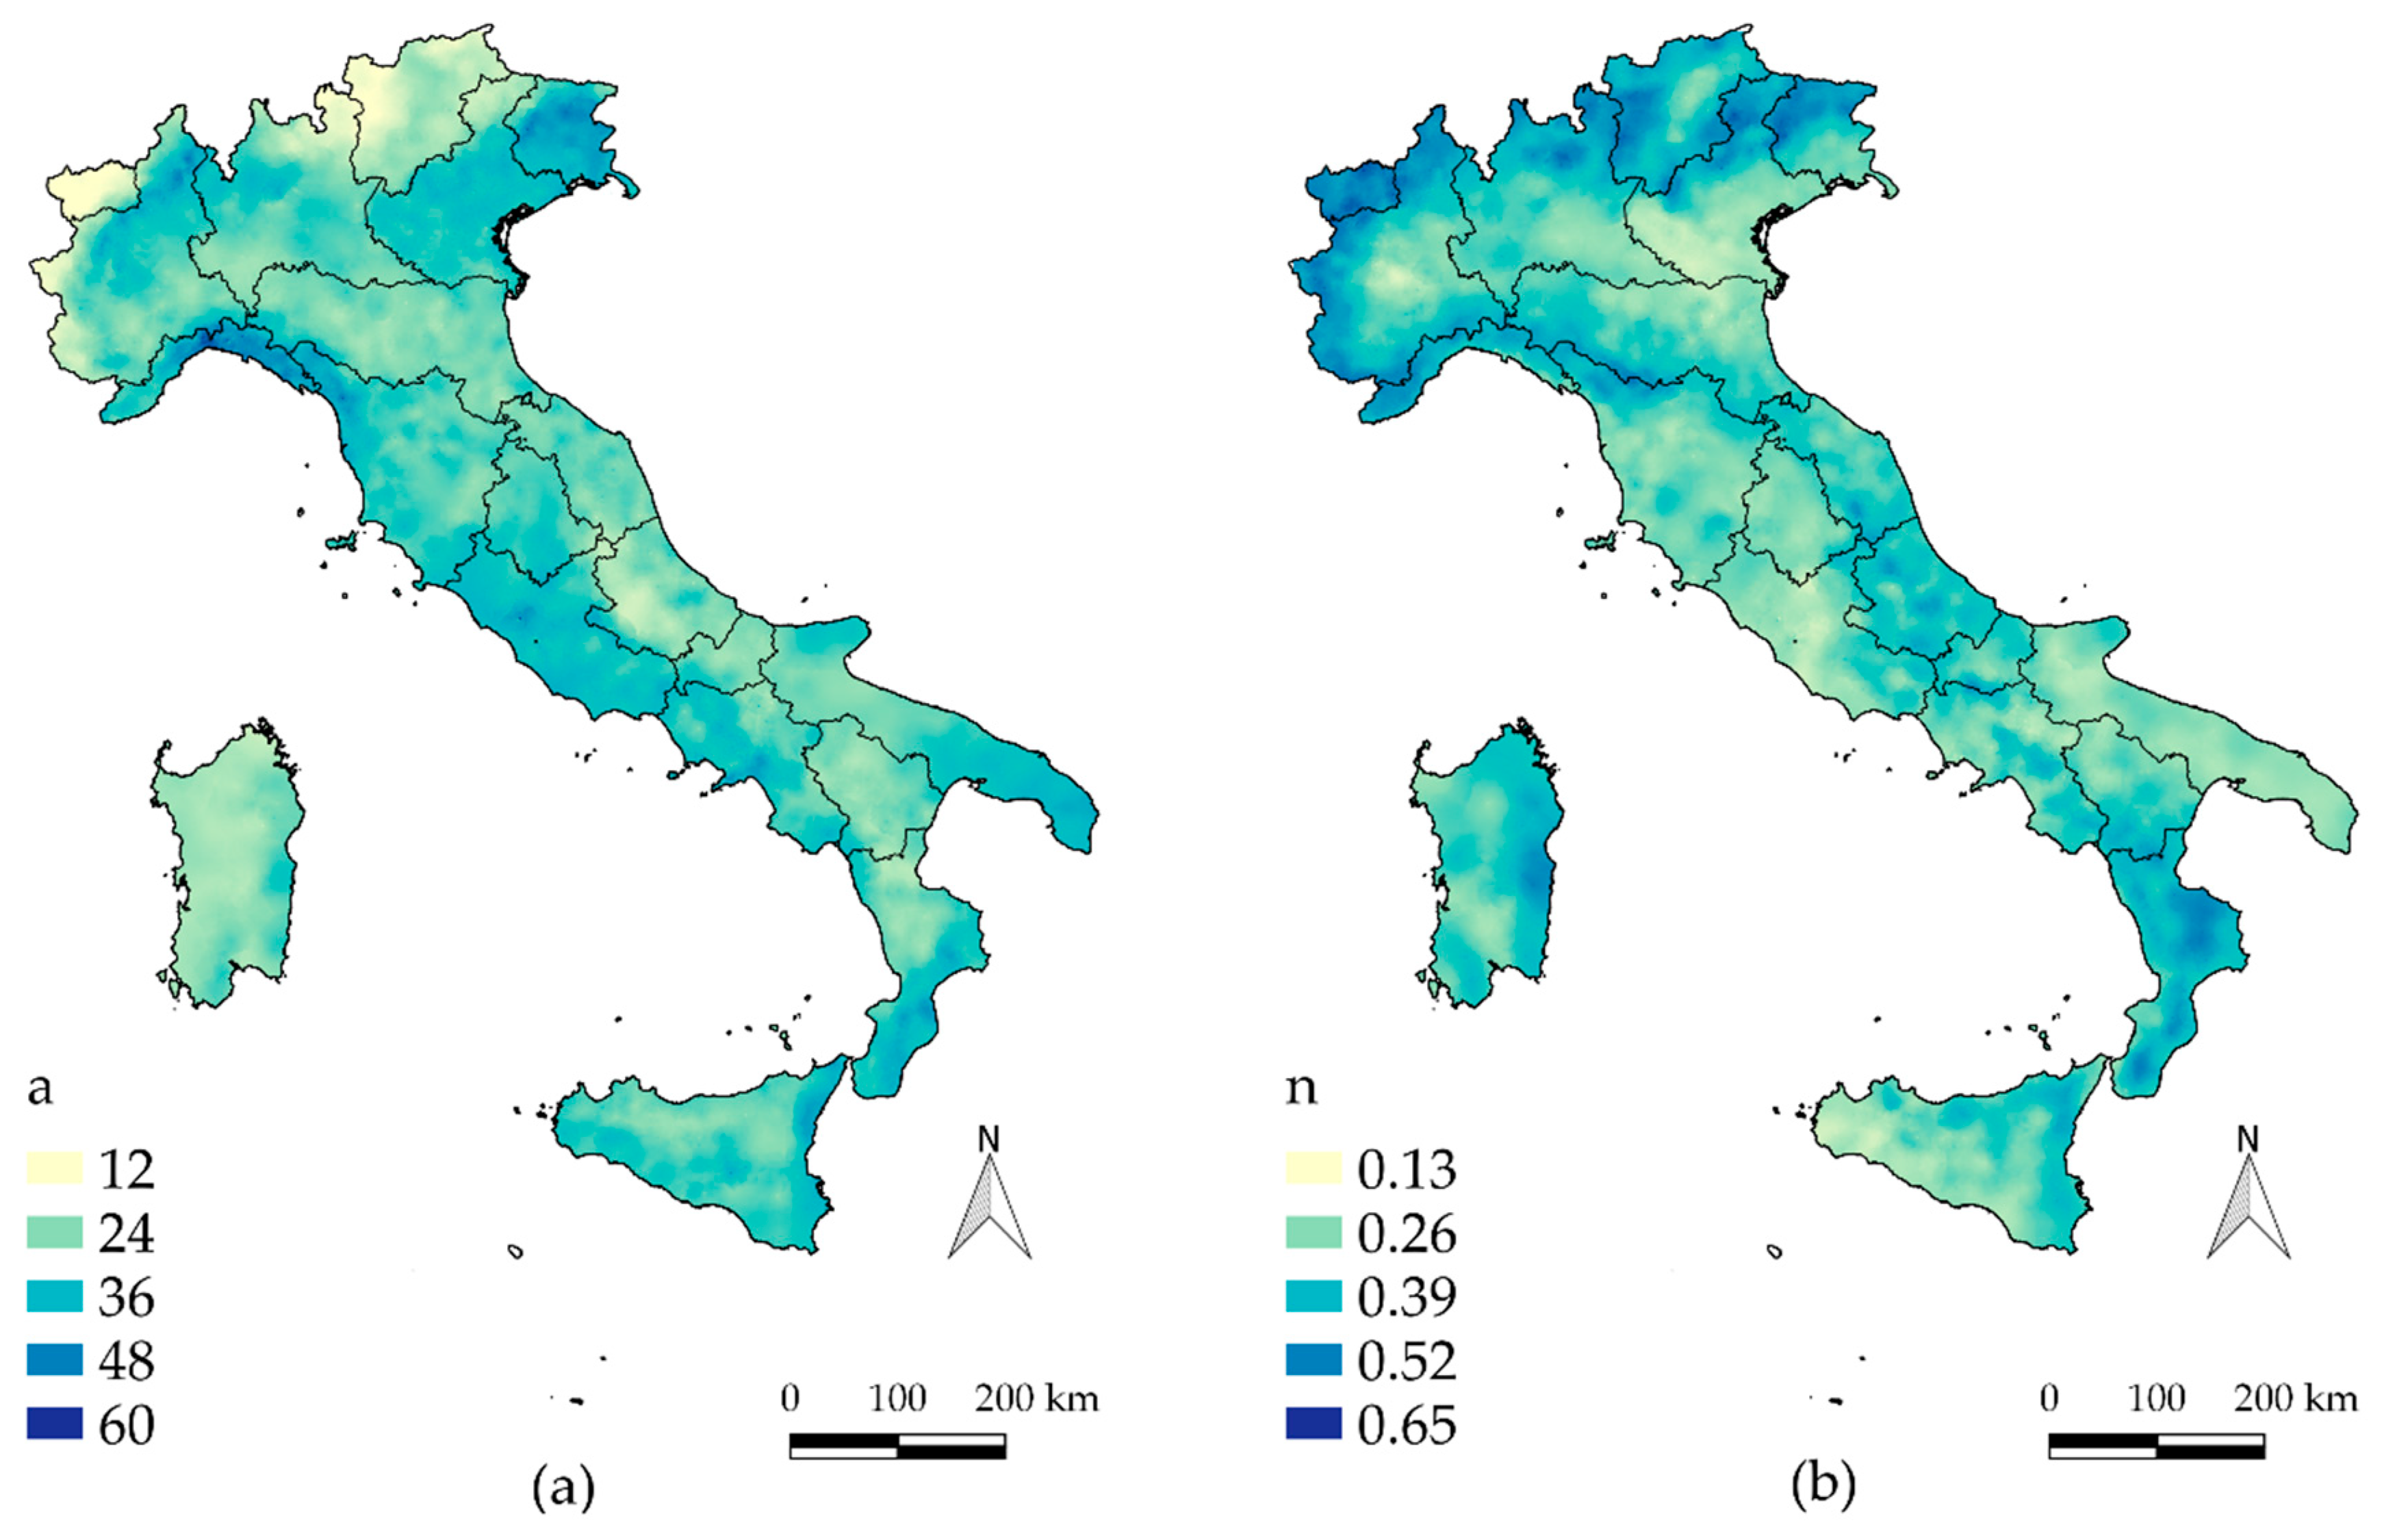
n for all the gauge sites. Kriged maps were then produced by applying an ordinary kriging with a spherical variogram and variable windows (a maximum value of 30 km was set to find at least five rain gauges). In order to avoid the smoothing effect of kriging, induced by the fact that a station grid may not have coincided with the interpolation grid, pixels that contained one or more rain gauges were forced to have the DDF parameters equal to the maximum ones obtained within the pixel. The mapped values for
a and
n are shown in
Figure 7a,b.
The parameter
a is approximately the average maximum rainfall recorded for a 1-h interval, and it shows higher values in Liguria, Friuli Venezia Giulia and in the northern part of Piemonte (
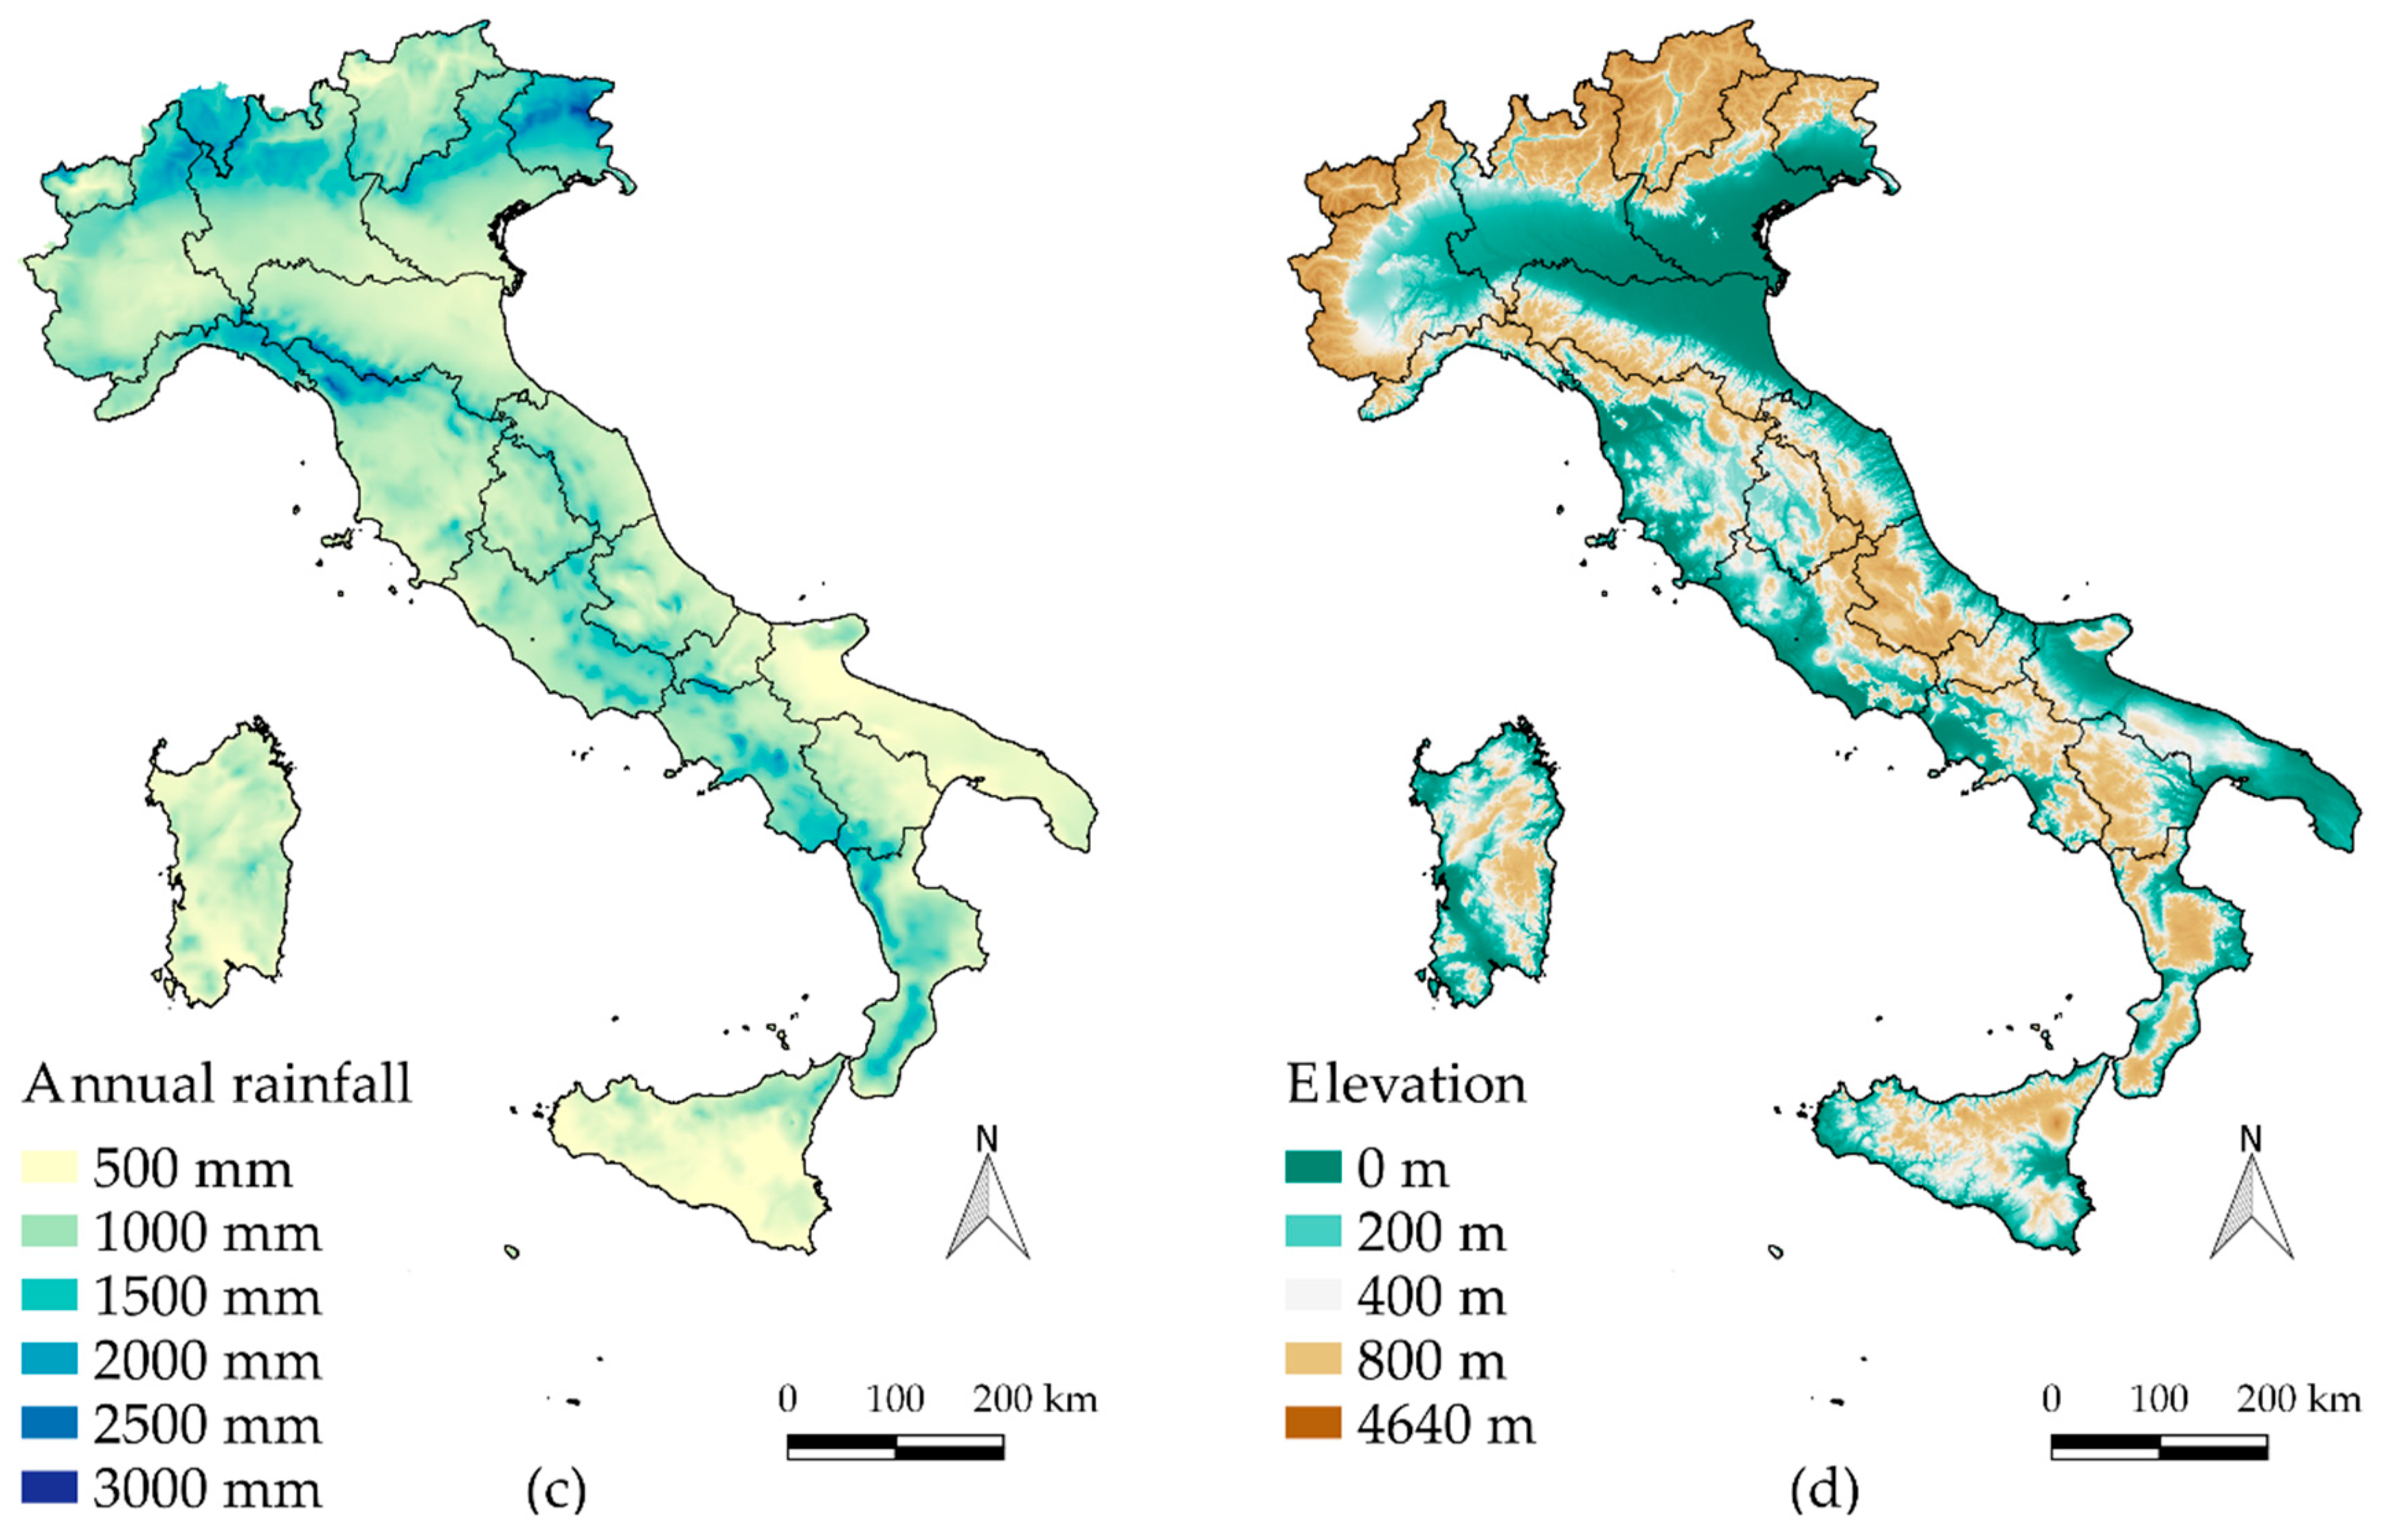
Figure 7a). This parameter shows some similarities with the spatial distribution of the mean annual rainfall (
Figure 7c) that is used here for climatic comparisons. This last map was compiled by [
26] at a 30-arc-second resolution using rainfall measurements related to the 1961–1990 period. The parameter
n (
Figure 7b) shows higher values for high-altitude areas, such as in the alpine region. To show to which extent the spatial distribution of these parameters can agree with known phenomena, we reported a Digital Elevation Model of Italy in
Figure 7d. Local factors, such as the steepness of the terrain, slope orientation, aerosol content and stability of the atmosphere, can influence the orographic enhancement of precipitation, especially for long aggregation intervals [
27]. This can be recognized in the map of the exponent
n (
Figure 7b) as the higher
n, the higher the increase in h
24 with respect to the corresponding value h
1 (parameter
a). On the other hand, short aggregation intervals (e.g., 1 h) show a different behavior, which leads to decreasing rainfall amounts as the altitude increases, especially over Northern Italy, as already shown [
28,
29].
Similar results, in terms of DDF parameters, were obtained in regional-scale studies over Piemonte [
30], the Trento province [
31] and Sicilia [
32], thus confirming the importance of working with a complete and updated dataset in order to avoid problems along the regional boundaries. The maps presented here can help show the influence of the terrain morphology on the spatial variability of the averages of the rainfall extremes and point out the importance of having reliable information for the plano-altimetric position of stations.
6. Super-Extreme Quality Control and Descriptive Statistics
The highest values measured in each station, which were defined as “Super-Extremes” [
33], have a particular importance in relation to the occurrence of the highest rainstorms in the Mediterranean area, and are worth emphasizing. We analyzed these “station maxima”, computed for all the stations and all the durations, to possibly identify further errors in the data, which had not been detected in the data digitization and in the record upgrade process. By examining these values, it was indeed possible to detect unrealistically high annual extremes, after dividing them by the local mean annual precipitation depth (shown in
Figure 7c).
This ratio, called “Normalized” Maximum Value (
NMV), has helped to detect very high rainfall amounts relative to the climatology of the site. The
NMV index was built as
where
Xn is the station maximum value, while the mean annual precipitation (
MAP) comes from an existing digital map [
26]. This index was introduced to highlight truly “extreme” events, that is, to distinguish them from other events, albeit very intense, which occurred in locations characterized by high annual rainfall amounts. Using various thresholds for
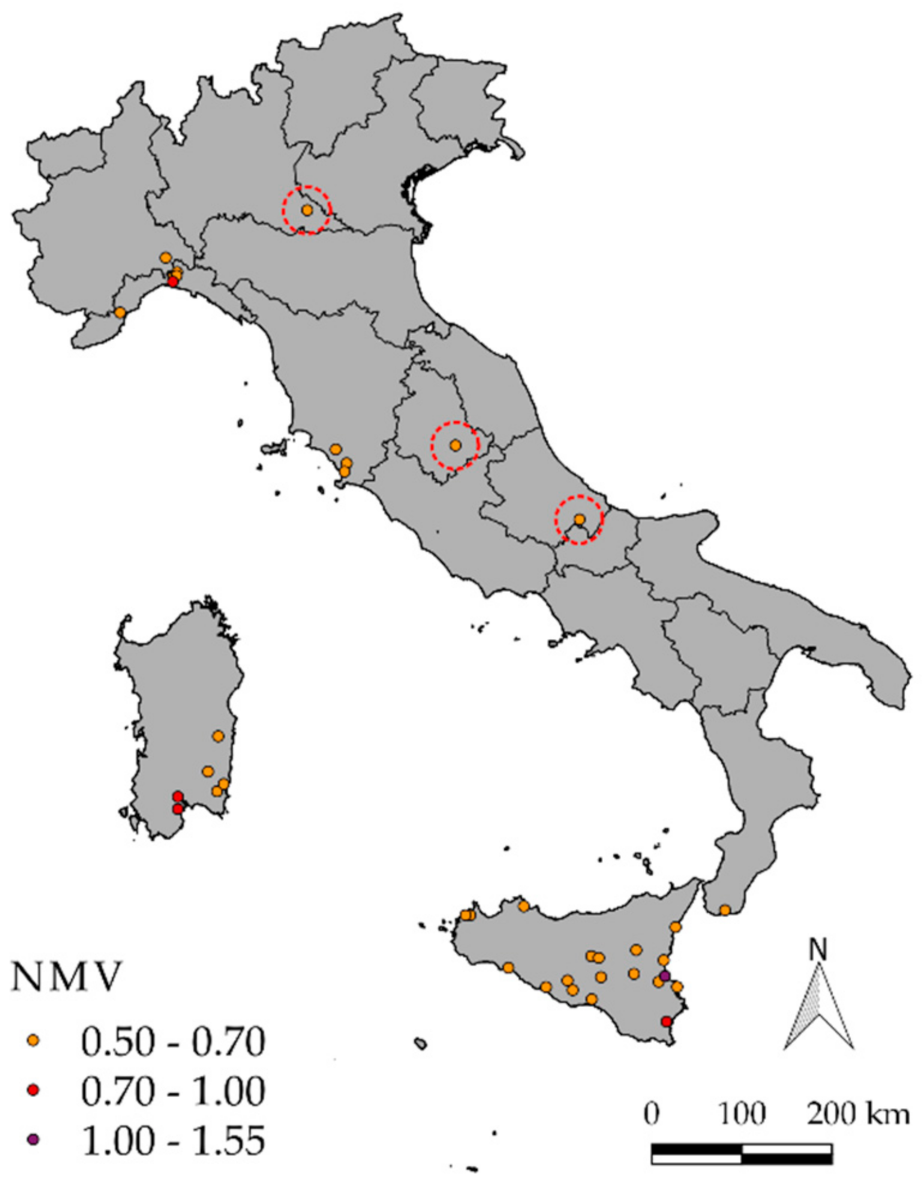
NMV and considering the related frequency of occurrence, our aim was to provide an empirical, yet objective, representation of the spatial distribution of the highest relative extreme rainfall events in Italy, and to obtain clues about any local anomalies. In this regard,
Figure 8 shows, as an example, the positions where
NMV exceeds 0.5 for the 24-h aggregation interval. In comparison to [
5], and to some other well-known hydrometeorological disasters that had happened in Italy, the presence of some clusters was predictable, e.g., in Sicilia, in Sardegna and in the Calabria Regions.
However, some anomalies emerged for some very isolated values (circled dots in
Figure 8). These values were checked by verifying the hourly or daily rainfall measurements acquired by the same and by nearby stations (when available) and by looking for evidence of a relevant heavy rainfall event in the news, in scientific articles and/or in disaster reports. After all these controls, all of these exceptional values proved to be the results of errors, and in all cases were attributable to a misplaced decimal separator in the original printed figures; the corresponding data were therefore adjusted in the dataset.
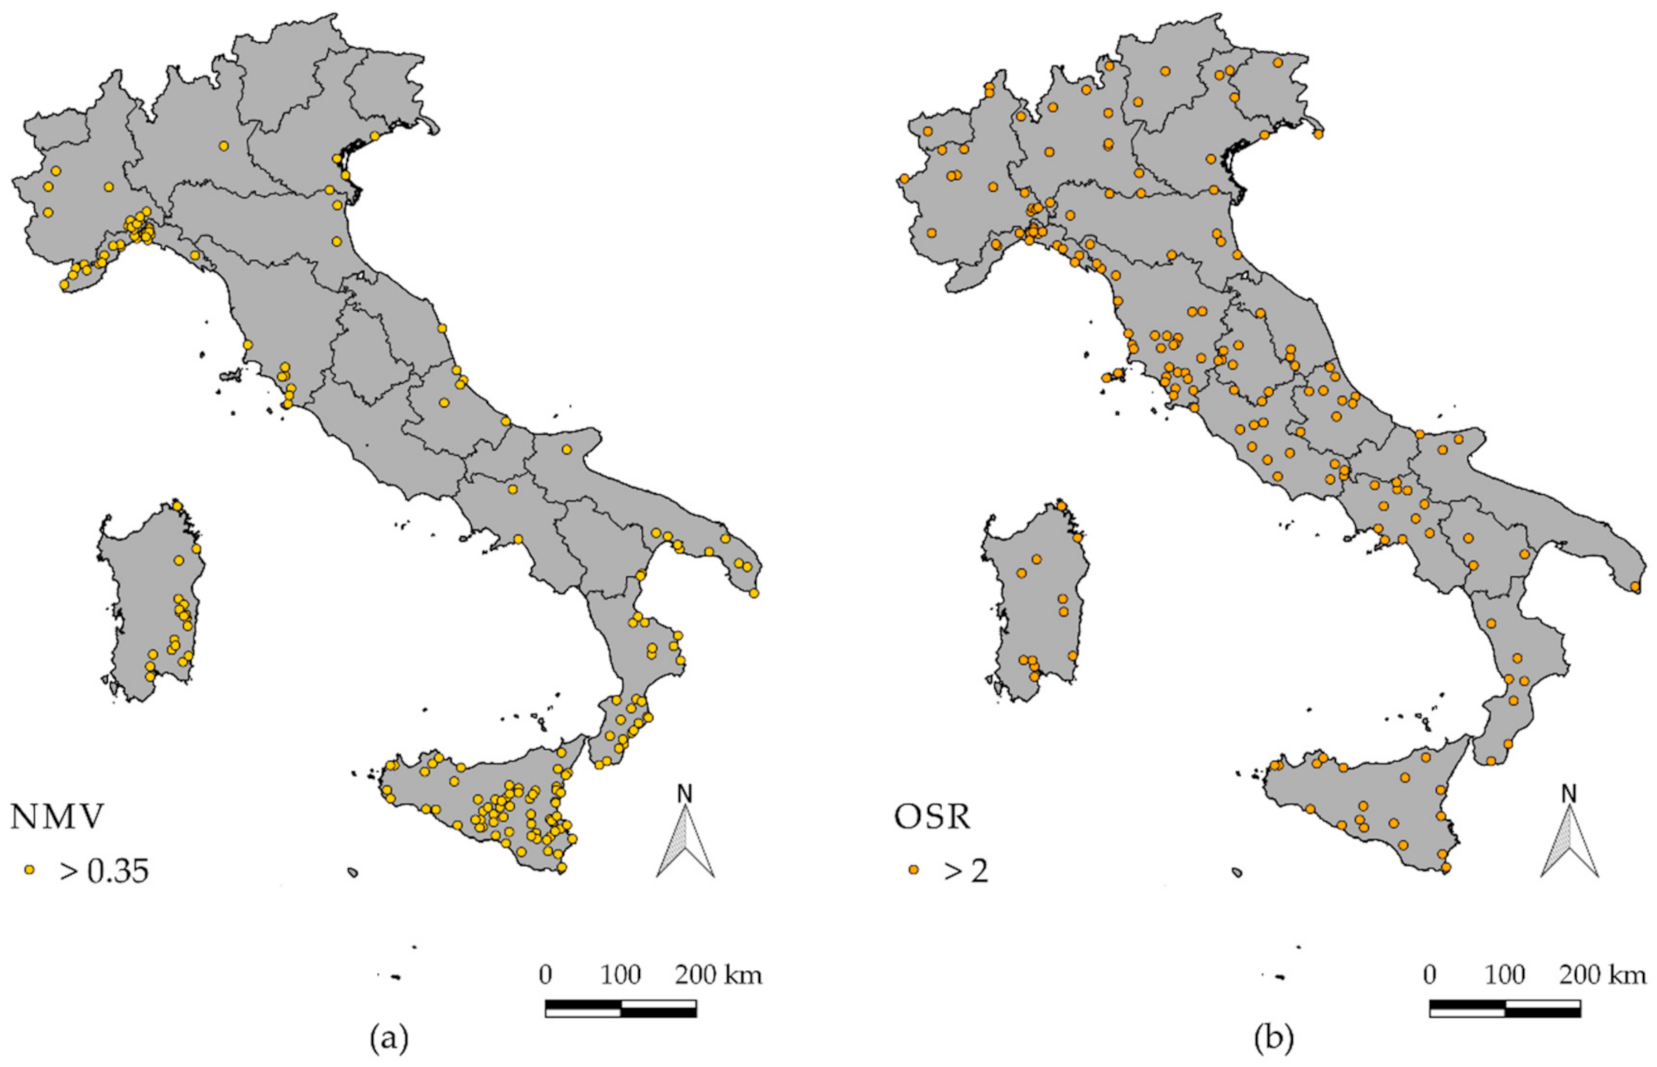
Figure 9a shows the highest
NMV values of the corrected dataset for the 24-h aggregation interval, after lowering the threshold to 0.35. The map shows that most of the values are concentrated in areas with low mean annual precipitation (see
Figure 7c as a reference). This may imply that the flooding impact in those areas may be higher, as infrastructures and the populations are not accustomed to frequent and intensive rainfall events in a dry climate.
A different empirical index was applied to station maxima considering the highest
kth sample values. In a record of size
n, the
nth order statistic is the maximum value of the record (
Xn), while the
n−1th order statistic is the second-highest value (
Xn−1) and so on [
34]. By extracting the
nth and the
n-1th order statistics of the annual maxima for each rain gauge, we were able to compute a non-dimensional index, named the “Order Statistic Ratio”, as
In [
35], one can find some results on the distribution of the ratio of two smallest order statistics from an exponential variate. Even though no available results were found in the literature about finite-sample distribution of the ratio of two highest-order statistics from extreme-value distributions, we assume that can be of interest to observe its spatial variability. This empirical ratio can be considered as an “outlier index” and has the advantage of being independent of preliminary assumptions about the probability distribution of the various samples.
The spatial distribution of the higher
OSR values, computed for the 24-h maxima, can be observed in
Figure 9b, where only rain gauges characterized by a greater
OSR than 2 are reported. Counter-intuitively to the outcomes of previous analyses, the spatial distribution of these points is rather uniform, thus showing that high
OSR values occur (and may occur in the future) in almost every site: even the areas with the lowest data density show these events. However, the Liguria Region is an exception, as it presents a significant concentration of high OSR values.
An attempt was made to find
NMV and
OSR threshold values that would allow a few but significant extreme events to be identified. In this regard, applying greater
NMV thresholds than 0.35 and
OSR ones greater than 2 allowed us to identify almost the same number of “Super-Extremes” (176 in the first case, 172 in the second one). These maps show that, with almost the same number of points, different selection criteria produce significantly different spatial distributions of these “severity” indexes. In both cases, the applied normalizations make the relevance of the selected events somewhat “relative”, while absolute criteria (i.e., a threshold value of 250 mm/day) are applied in other cases [
5].
7. Conclusions
Despite the high rain gauge network density throughout the Italian territory, an updated and quality-controlled dataset of annual maxima rainfall events over the entire Italian territory was not available before this work. The availability of only short and fragmented series of rainfall measurements, combined with the reduced spatial domains covered by each regional agency, had led to a somewhat limited representativeness of the results used to represent the climatology of extreme events in Italy, as shown, e.g., by [
14]. Regional frequency analyses and geostatistical analyses applied to regional-level datasets are also known to lead to artefacts along the regional boundaries (i.e., the borders), when measurements in the nearby “regions” are not included [
36,
37].
In the present study, we propose a new, updated and quality-controlled dataset of the annual maxima rainfall events and a representation of descriptive statistics that may be used to highlight the areas that are more vulnerable to extreme rainfall. More than 2000 different errors (in terms of incorrect planimetric/altimetric positions of the rain gauge or rainfall values) were detected in the original data and subsequently adjusted to improve the accuracy of a previous version of the database (I-RED), and this in turn led the release of I2-RED.
The study shows simple but effective methods for the detection of errors in both the rainfall records and in the station positions. These methods are mainly based on the use of a digital elevation model to identify any position/elevation errors, and on the analysis of the severity of the most relevant extreme rainfall events.
Finally, analyses of the 24-h maxima of the stations were performed to preliminarily exploit the potential of the proposed database and to fine-tune the selection of the possible data errors. The maps of these Super-Extremes indices suggested that a high spatial persistence of particularly extreme rainfall events is concentrated in the coastal areas of the Italian territory, possibly due to the effects induced by a steep and complex orography near the sea [
38]. Further studies, based on the new database presented here, can suggest methods that can be used to objectively identify a coherent selection of Super-Extreme events, with the aim of contributing to the knowledge on the spatial distribution of this particular hazard.


