Constraining the Water Cycle Model of an Important Karstic Catchment in Southeast Tibetan Plateau Using Isotopic Tracers (2H, 18O, 3H, 222Rn)

 ,
,
Abstract
:1. Introduction
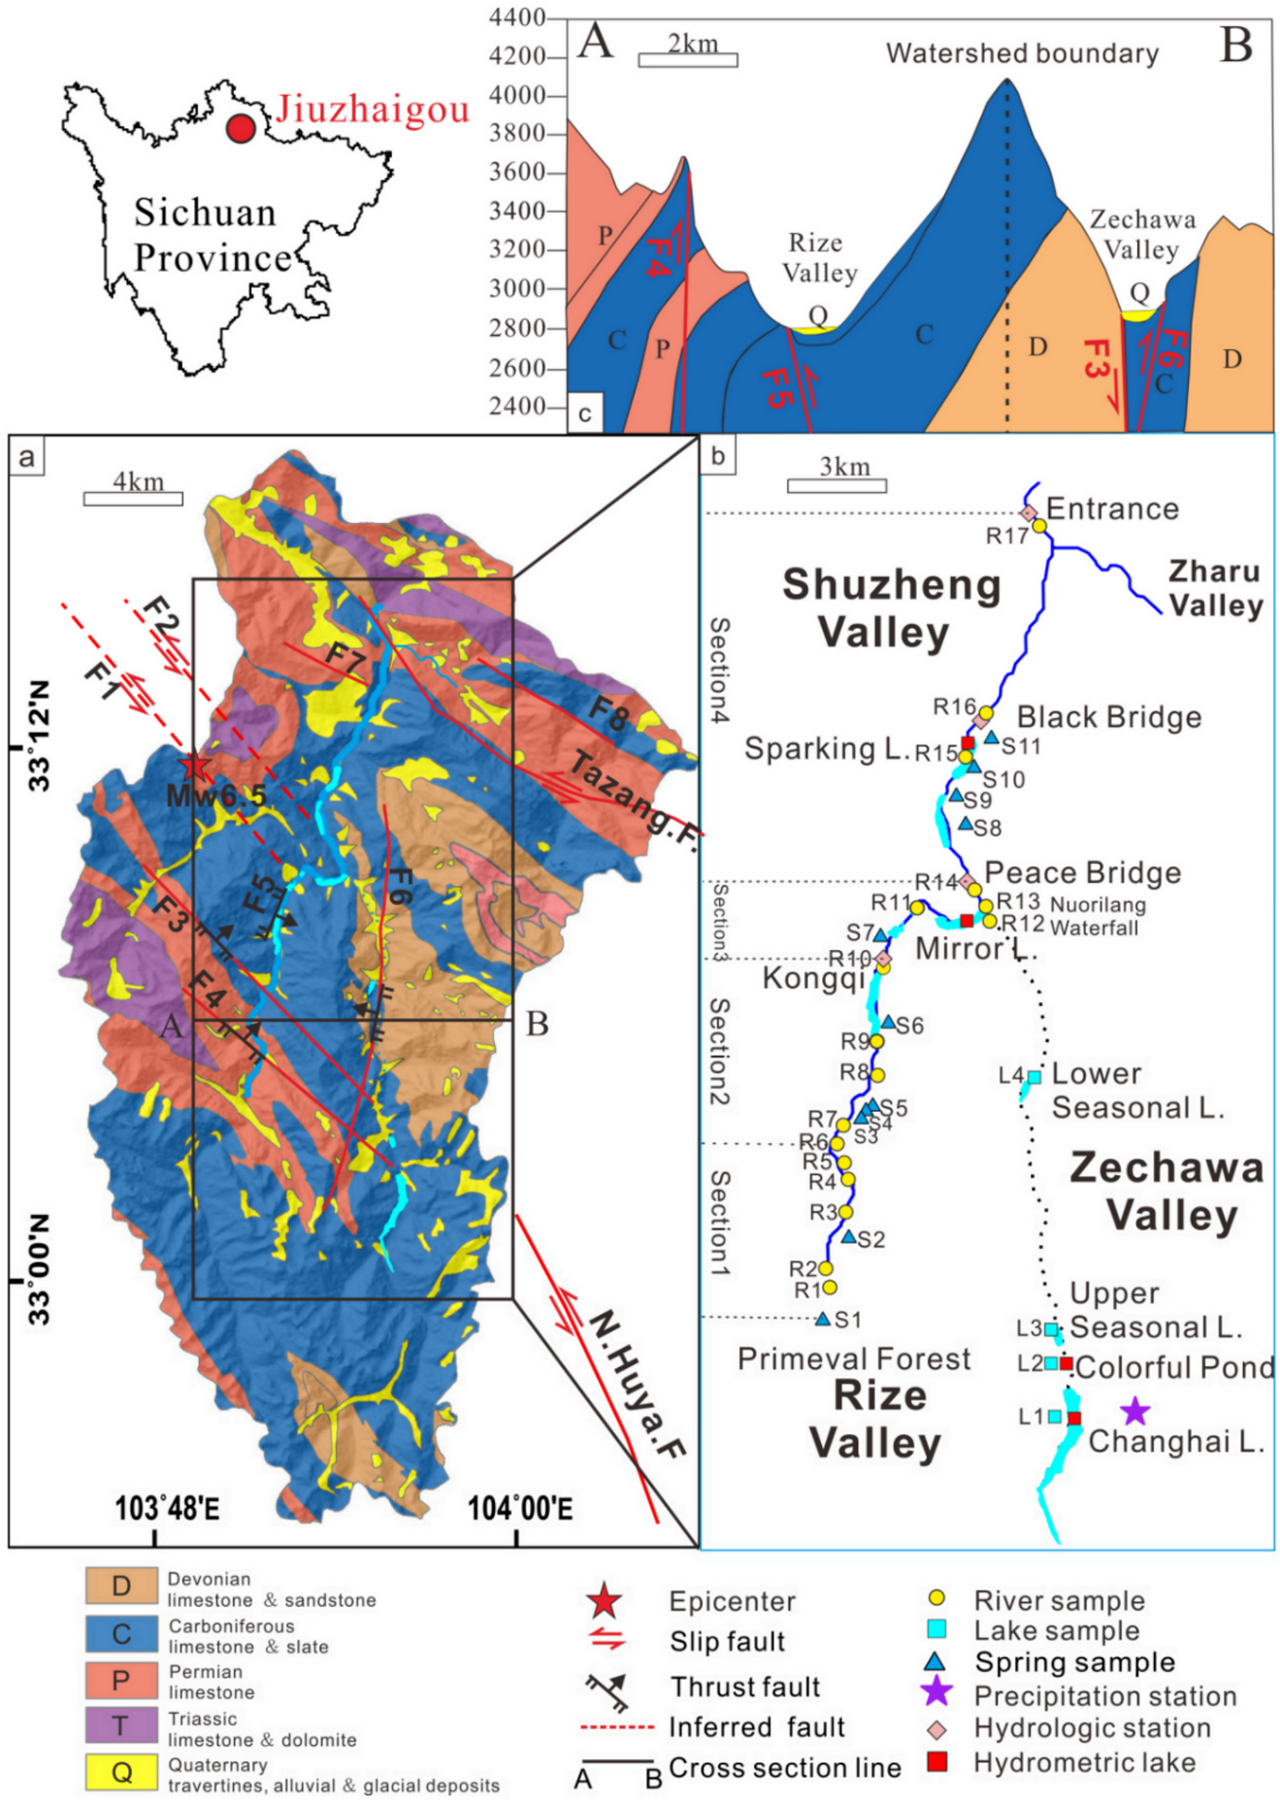
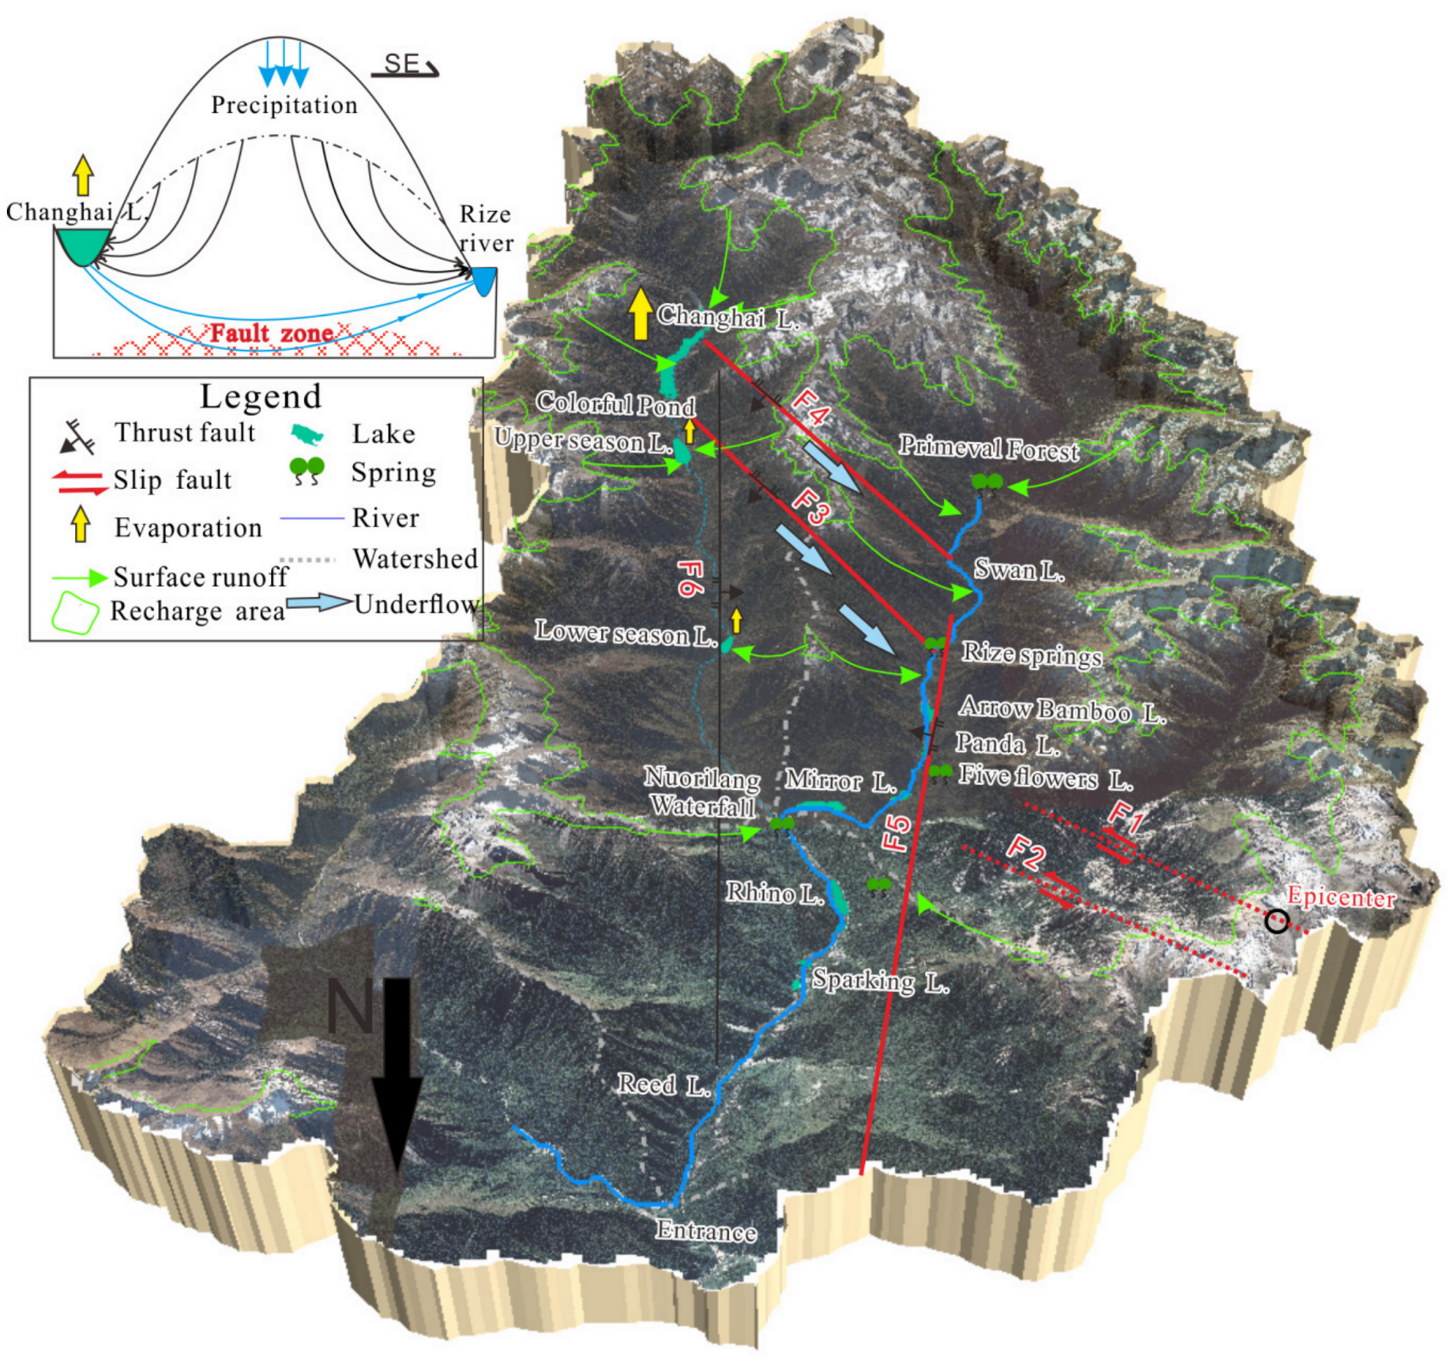
2. Study Area
3. Materials and Methods
3.1. Water Sampling and Analysis Method
3.2. End-Member Mixing Model
3.3. 222Rn Mass-Balance Model
4. Results
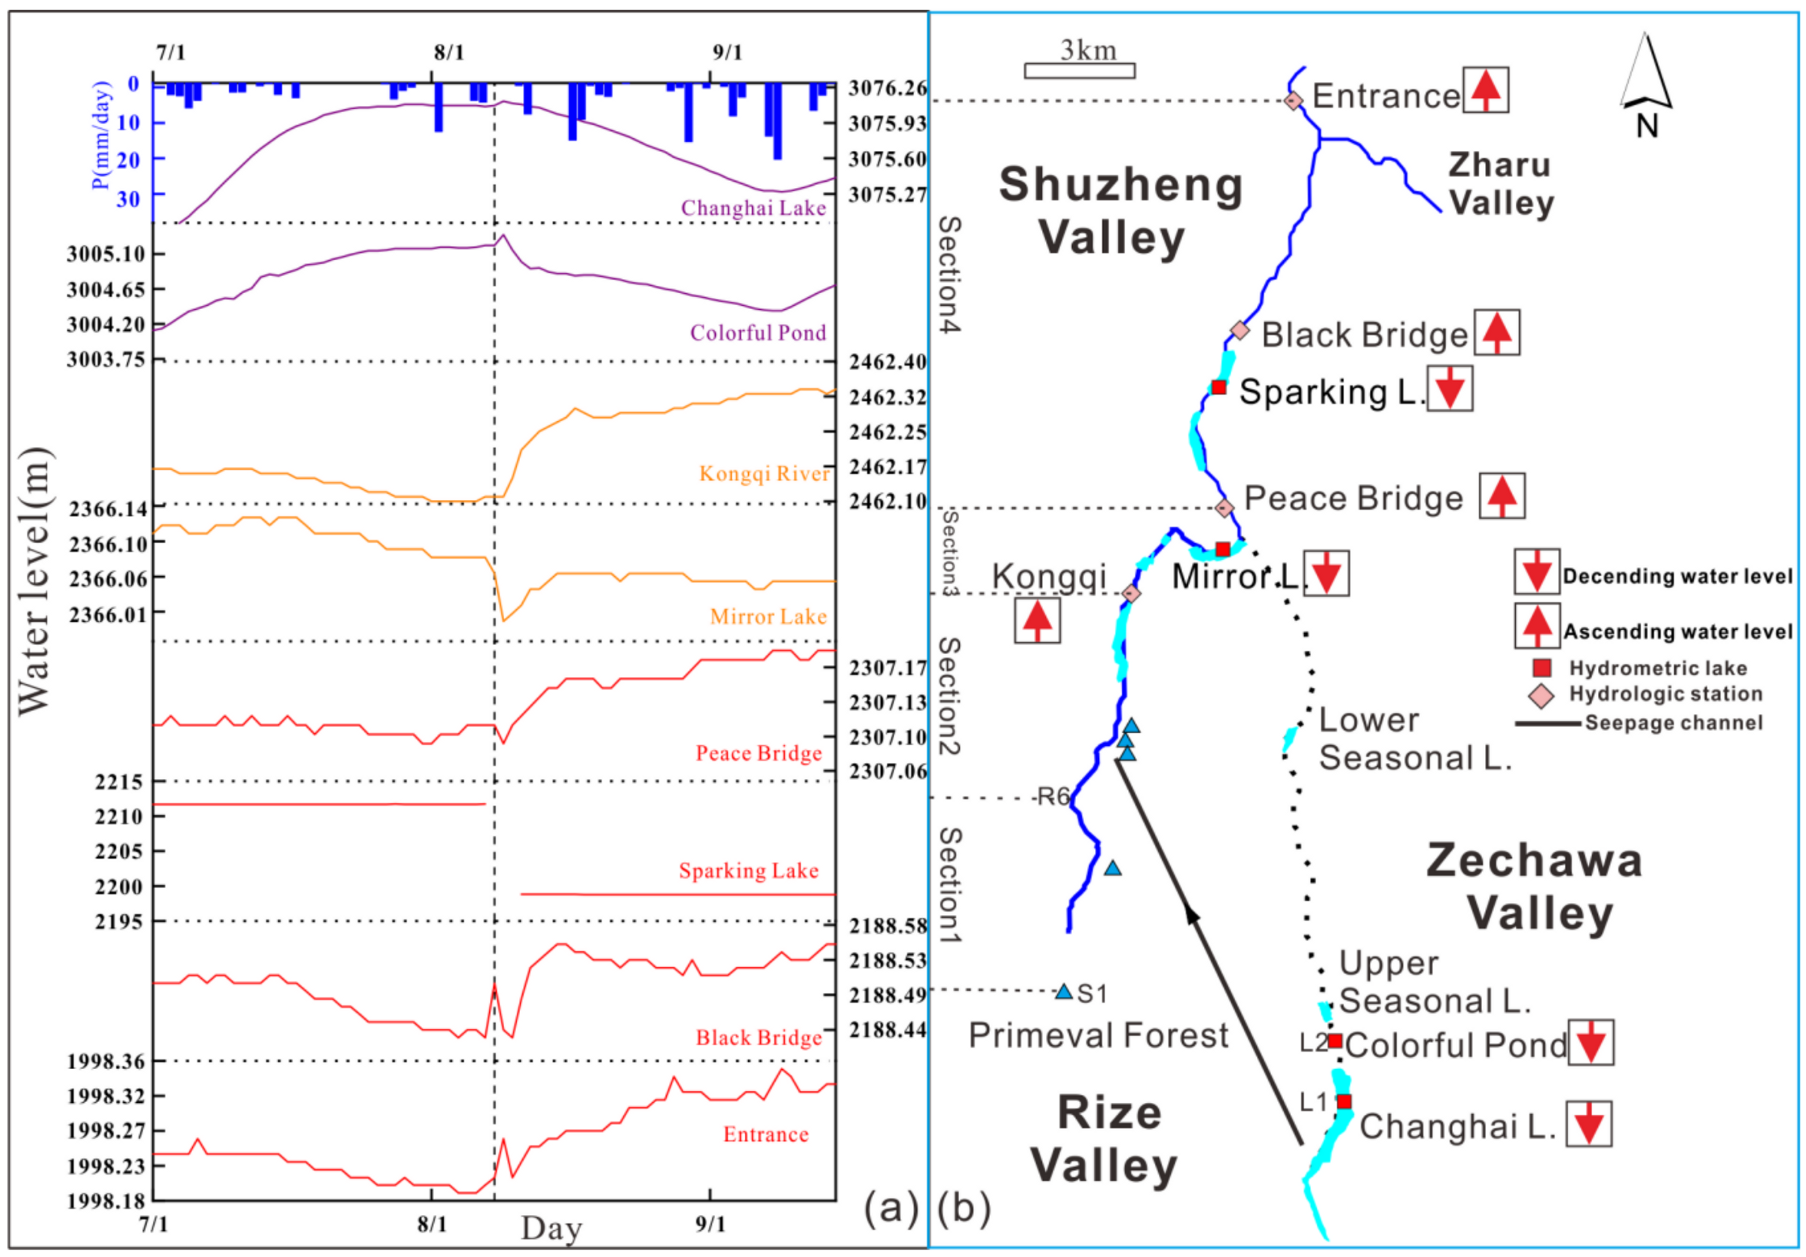
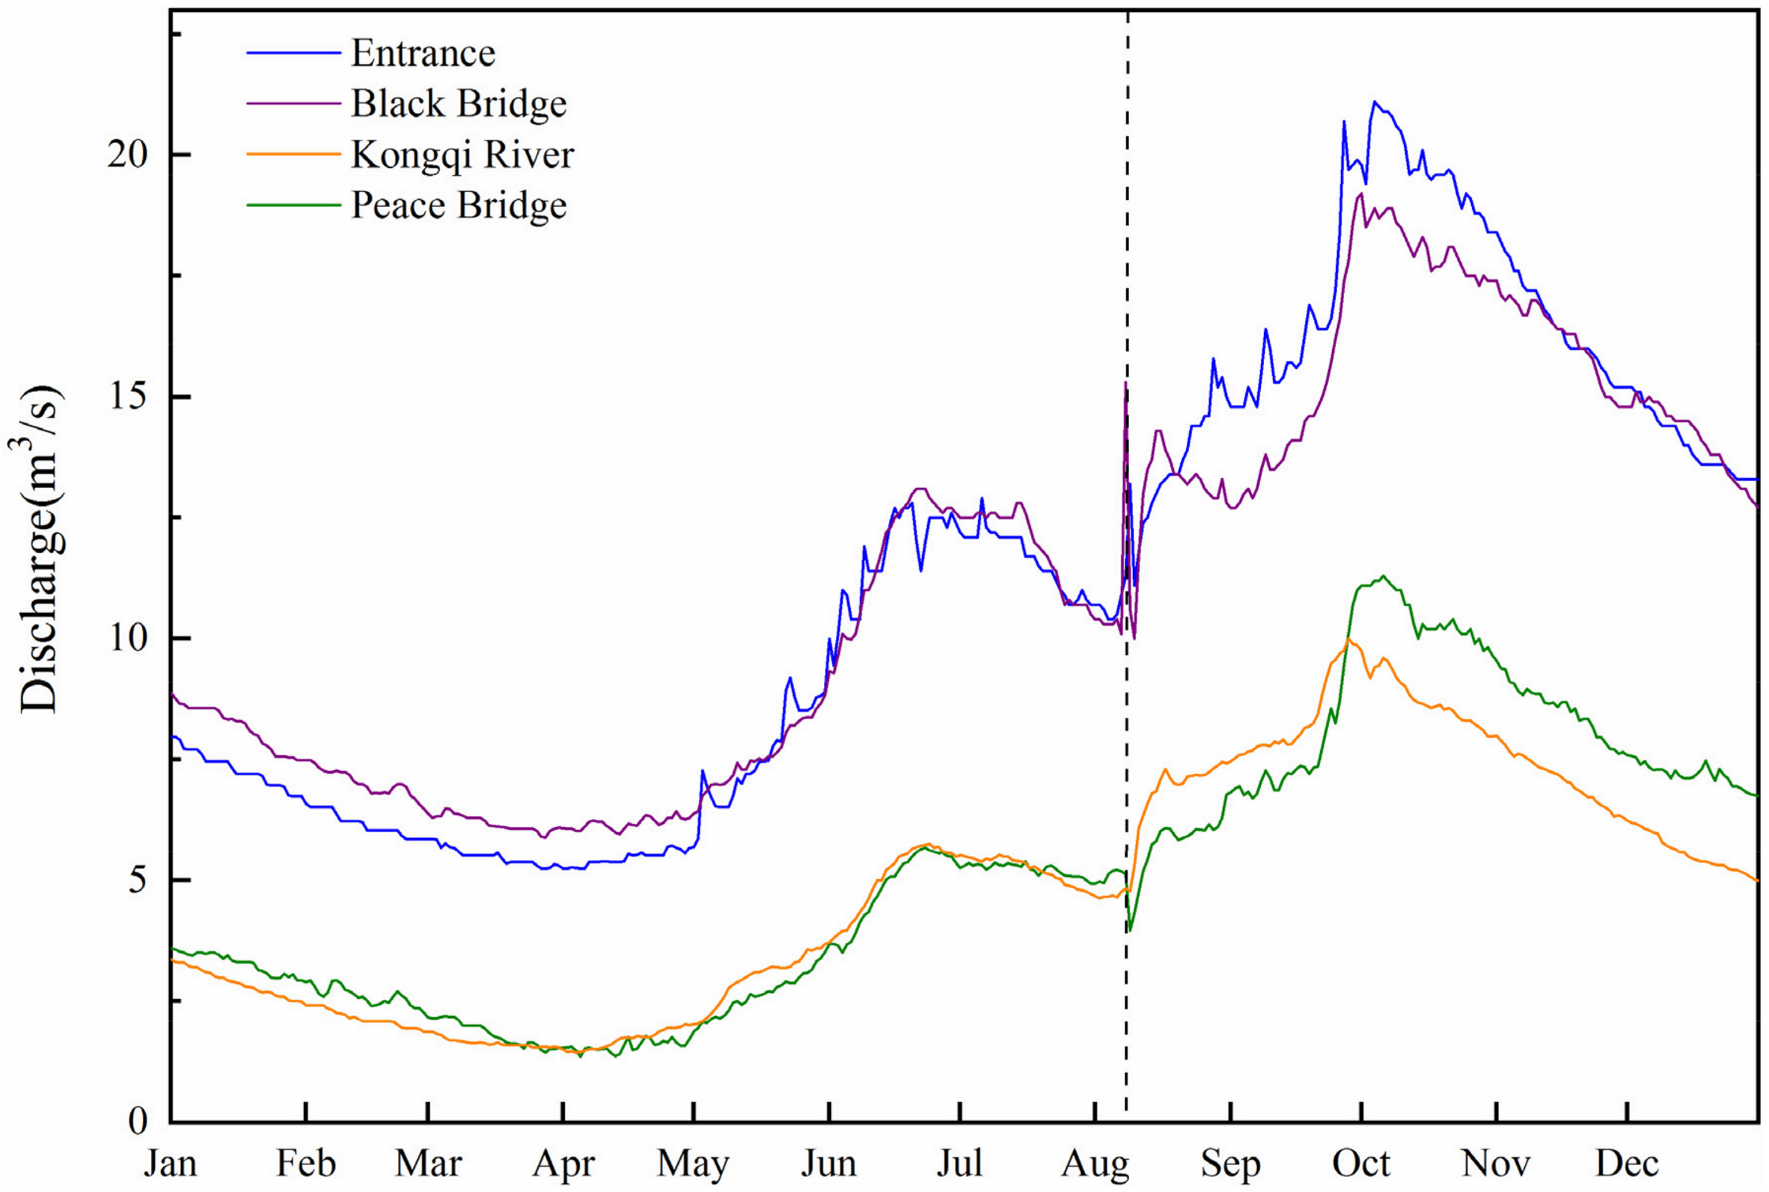
4.1. Regional Surface Water Level and Streamflow Change
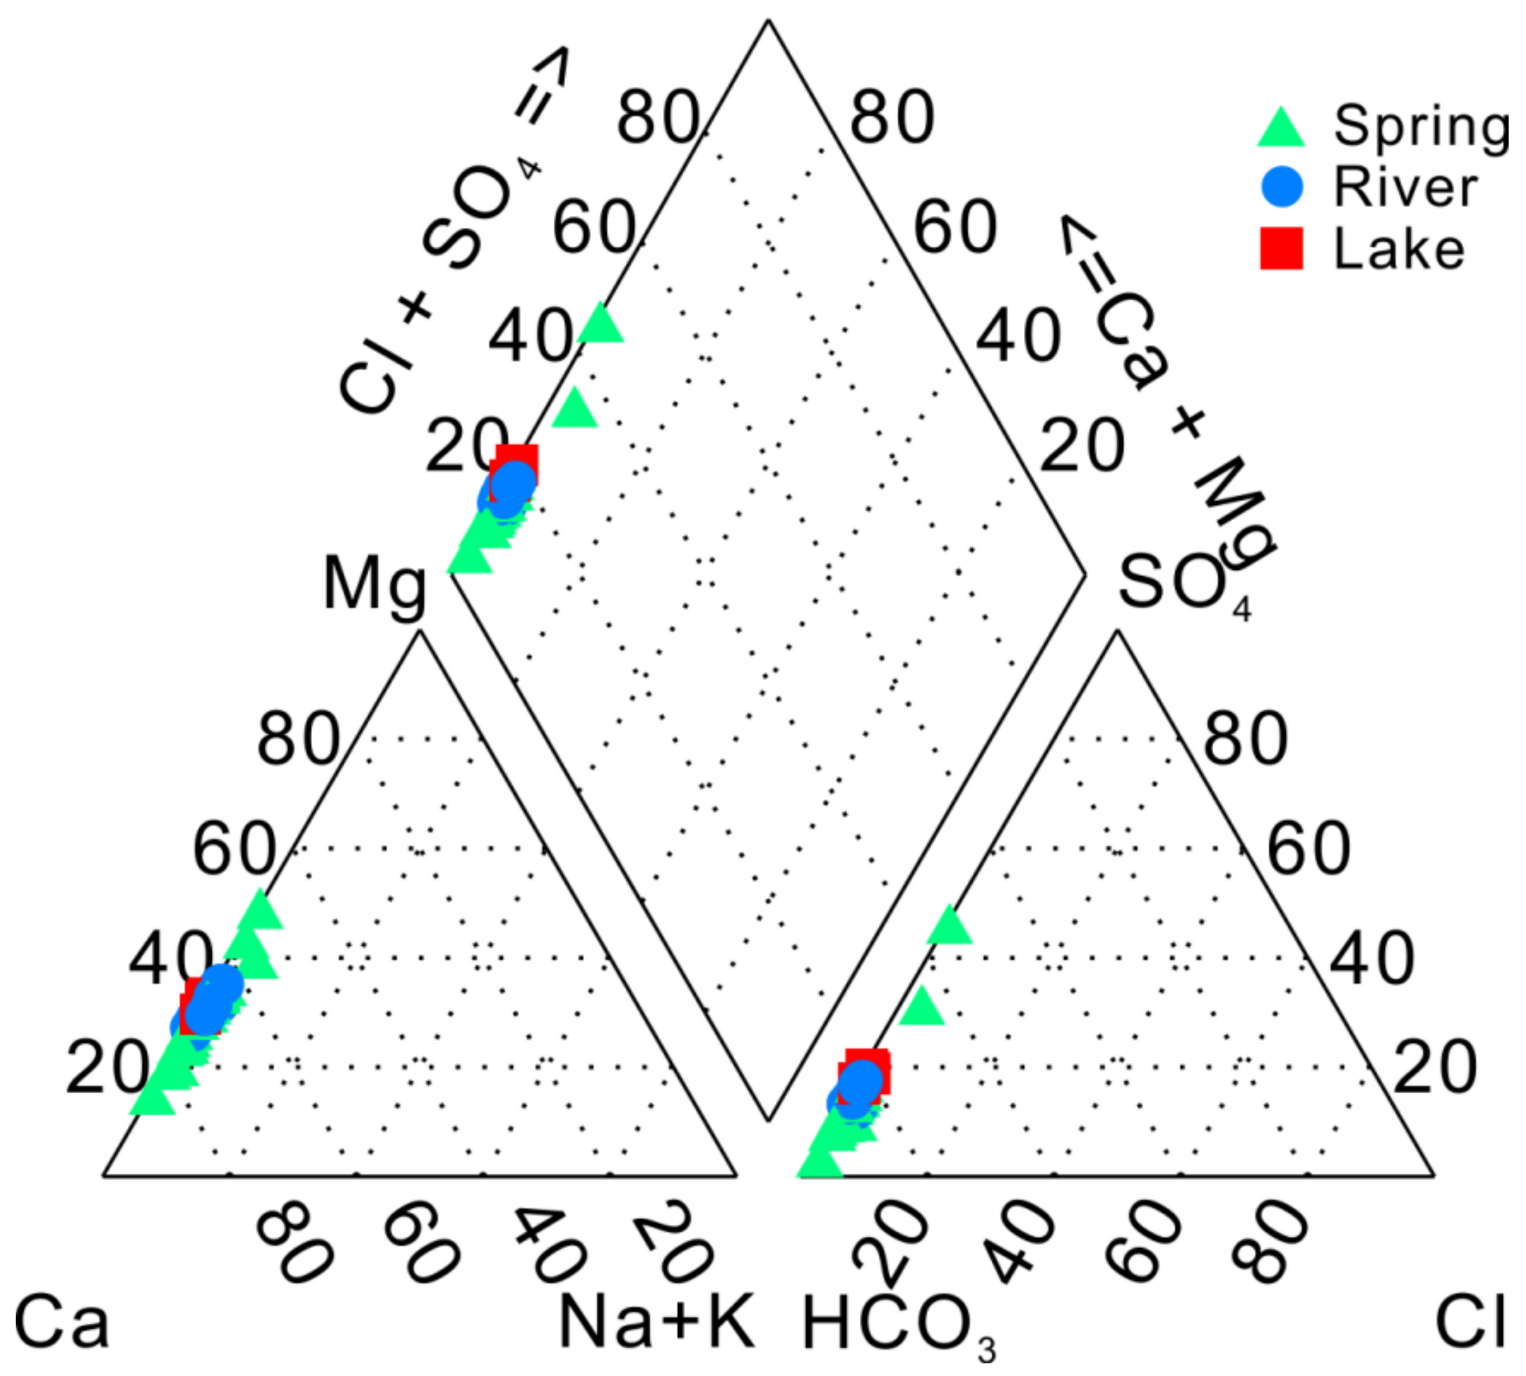
4.2. Hydrochemical Characteristics
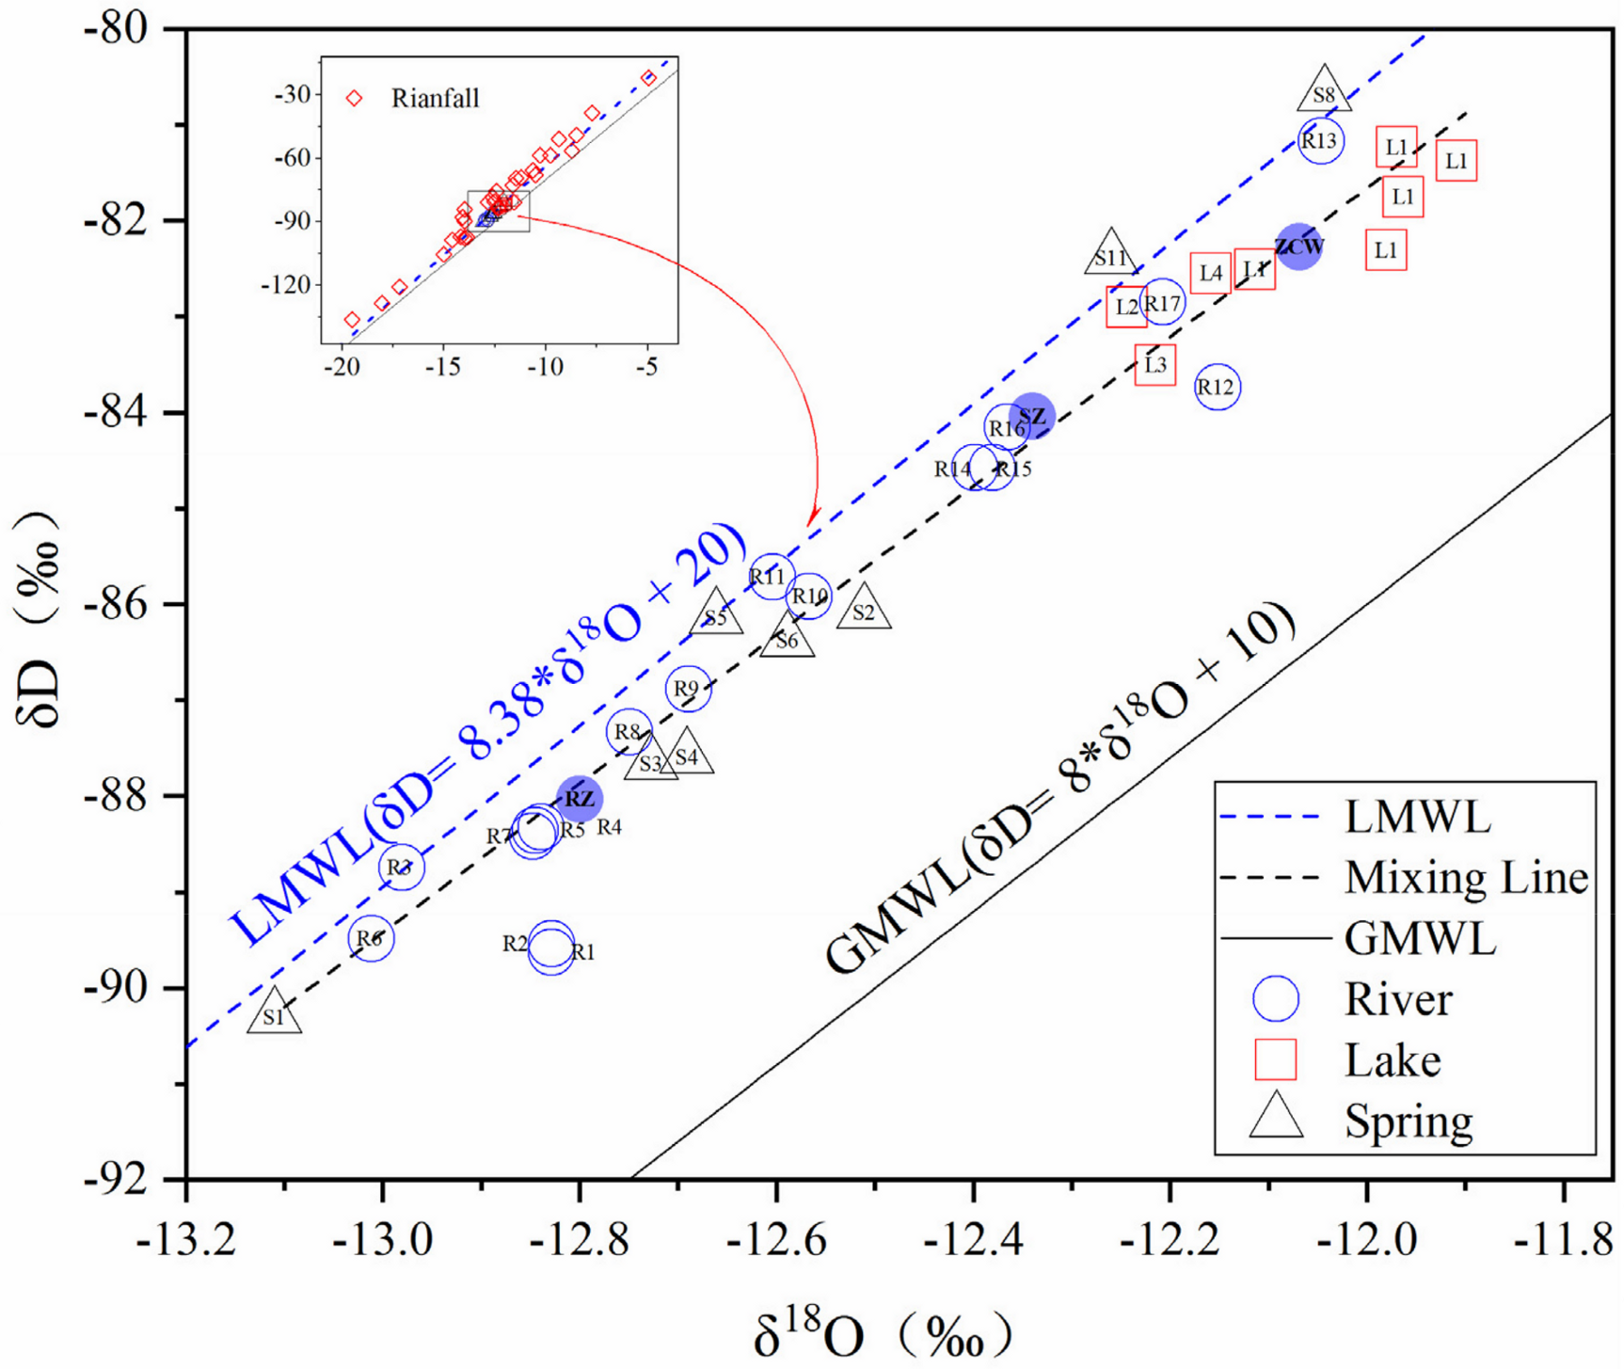
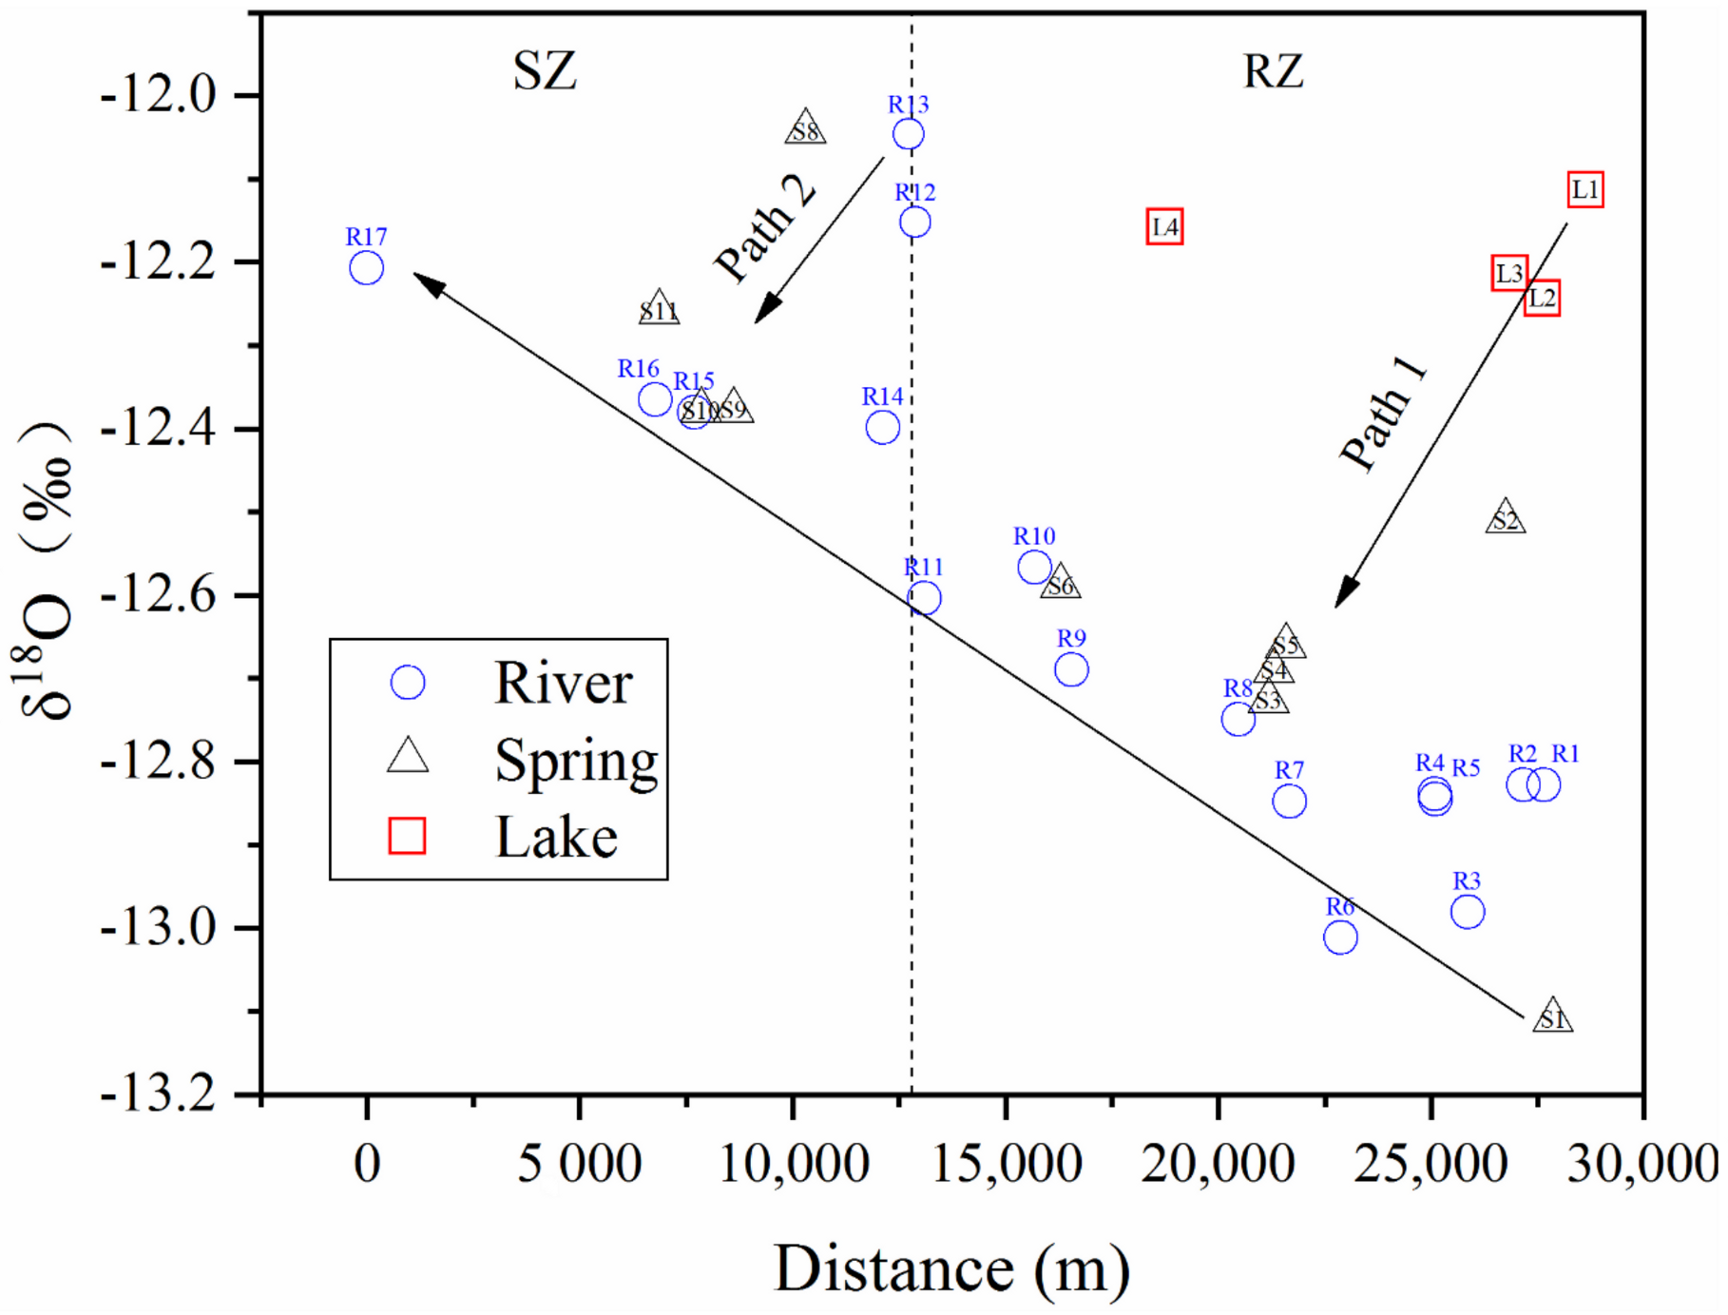
4.3. Stable Isotopic Compositions of Hydrogen (δ2H) and Oxygen (δ18O)
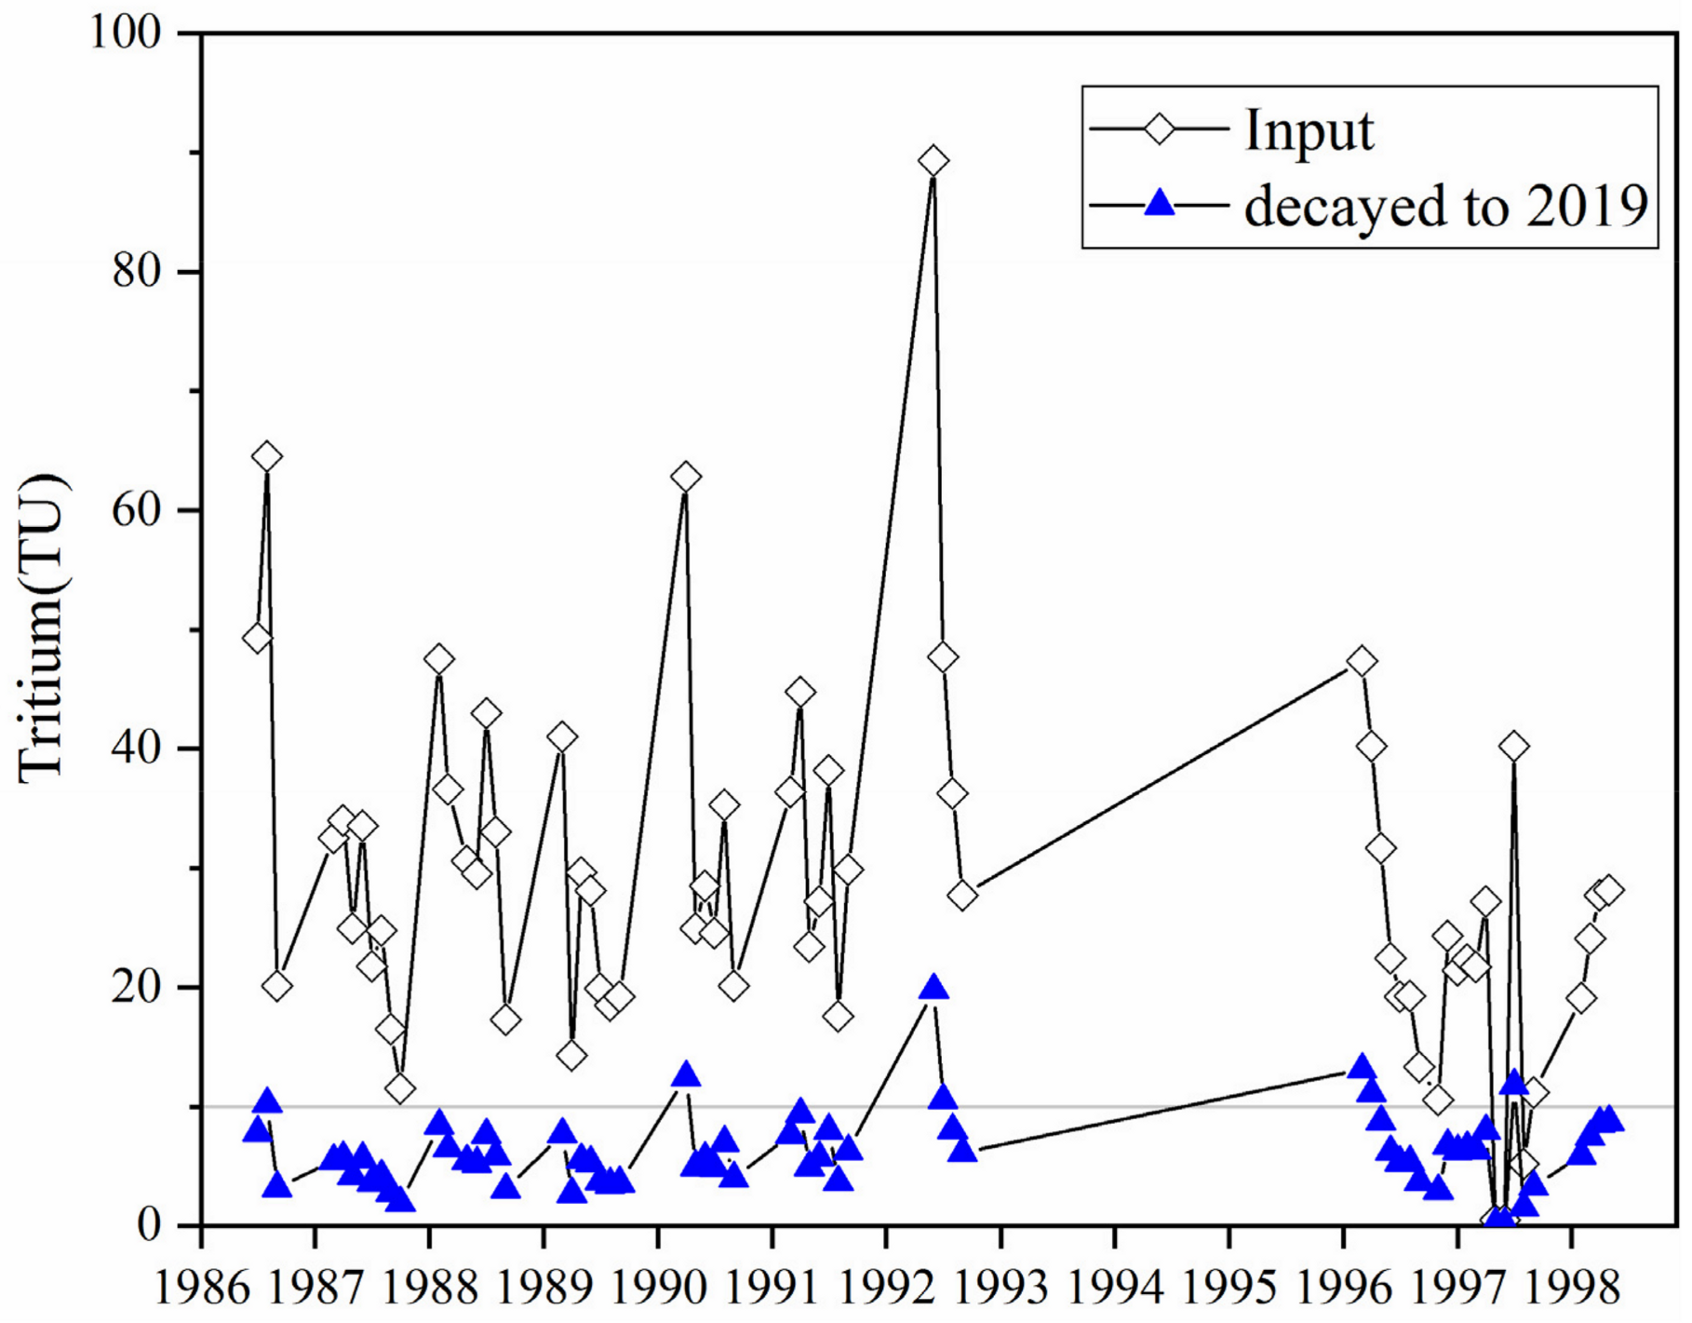
4.4. Tritium (3H) of River, Lakes and Springs
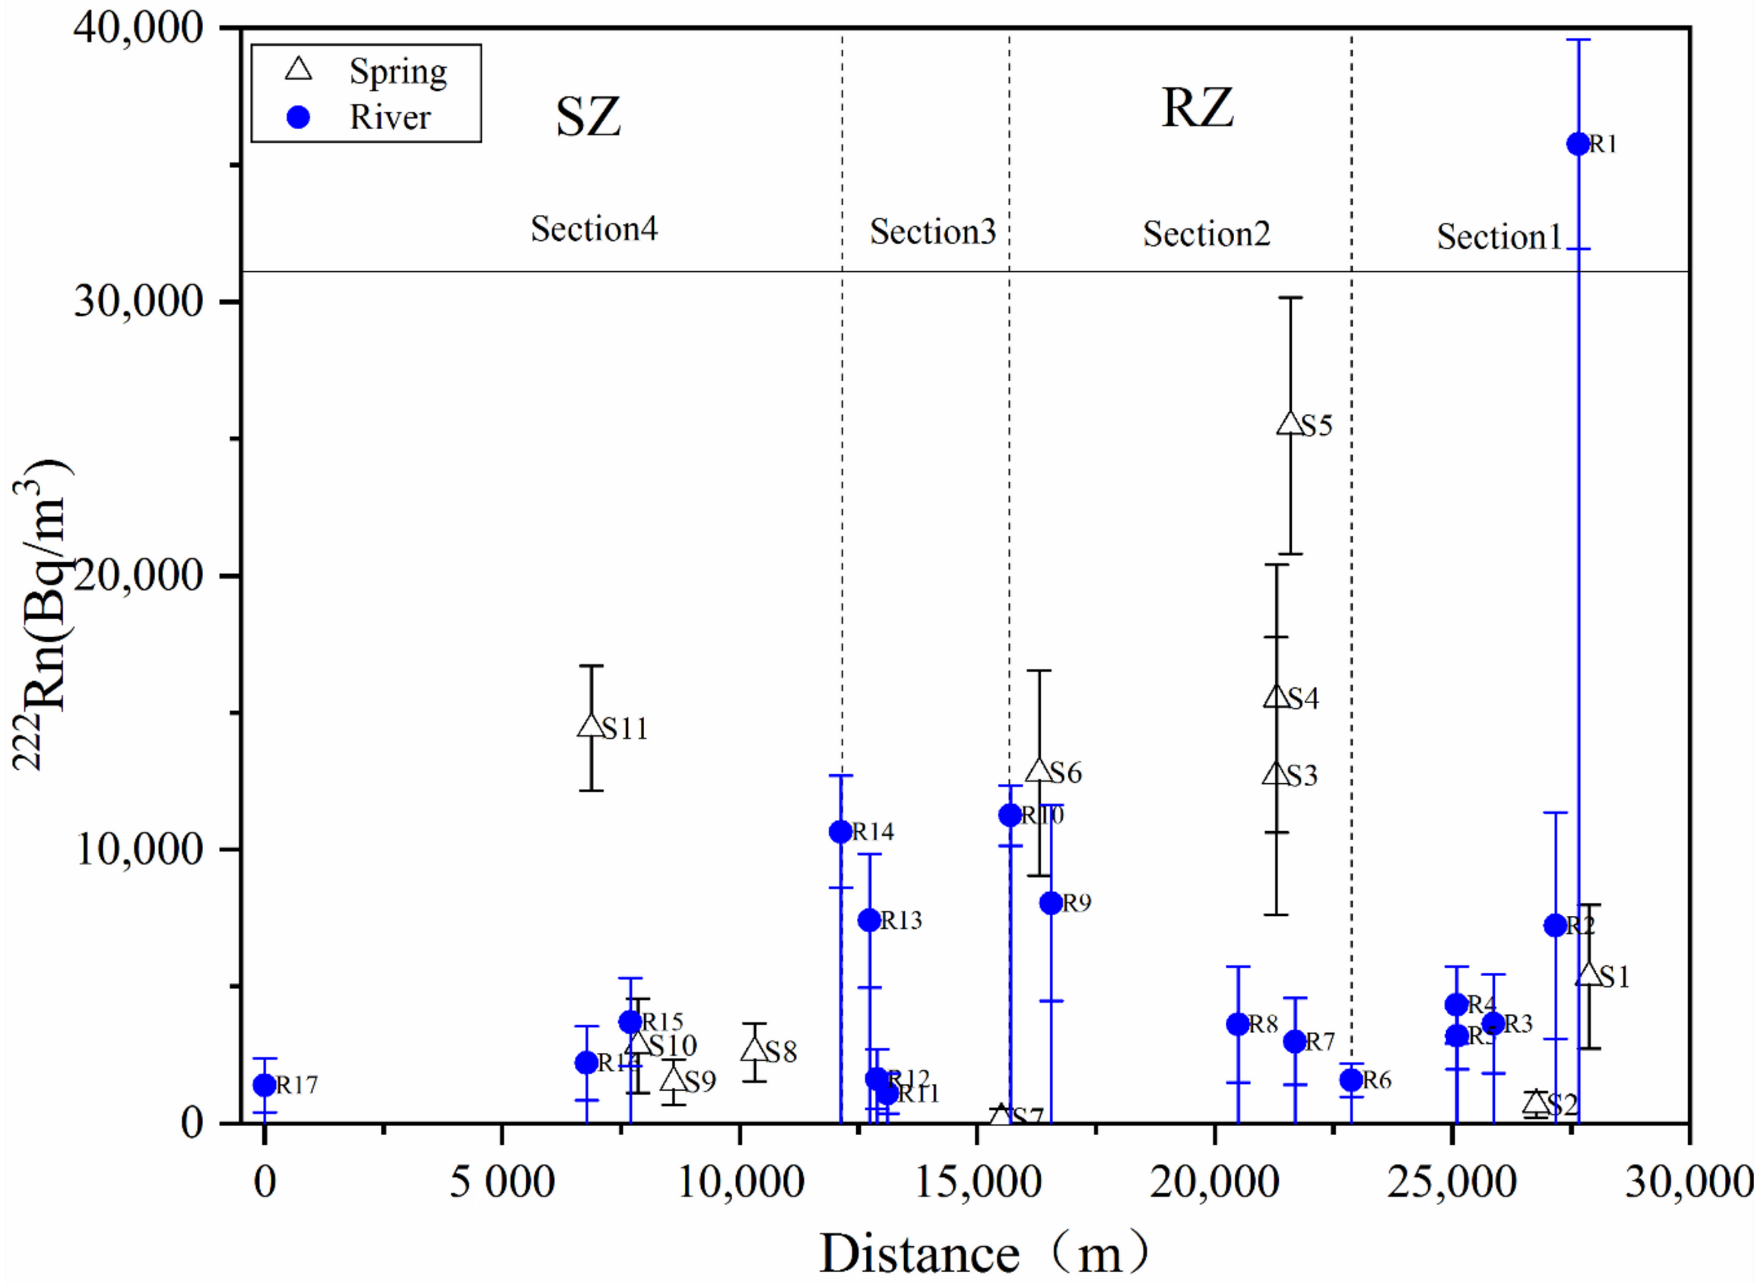
4.5. 222Rn Concentrations in River and Spring
5. Discussion
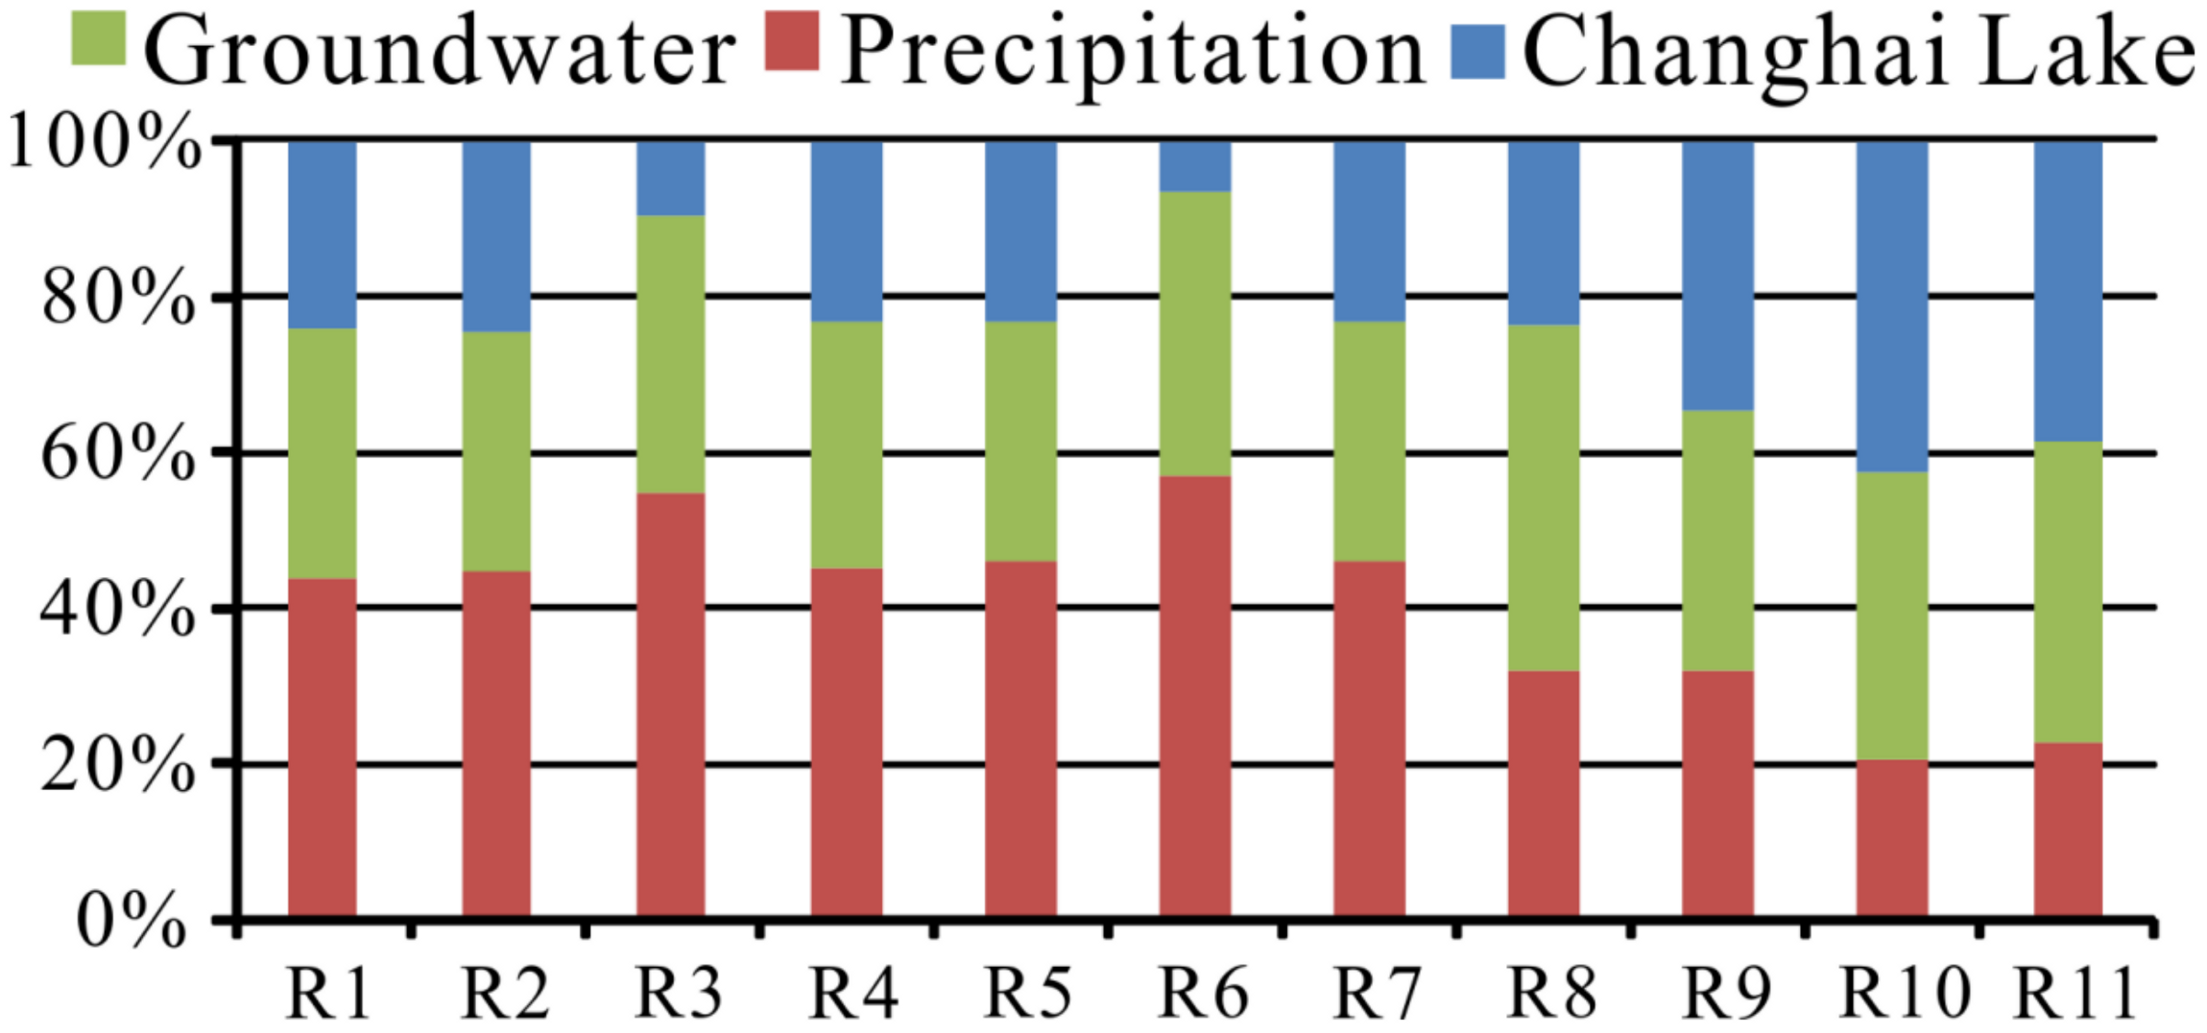
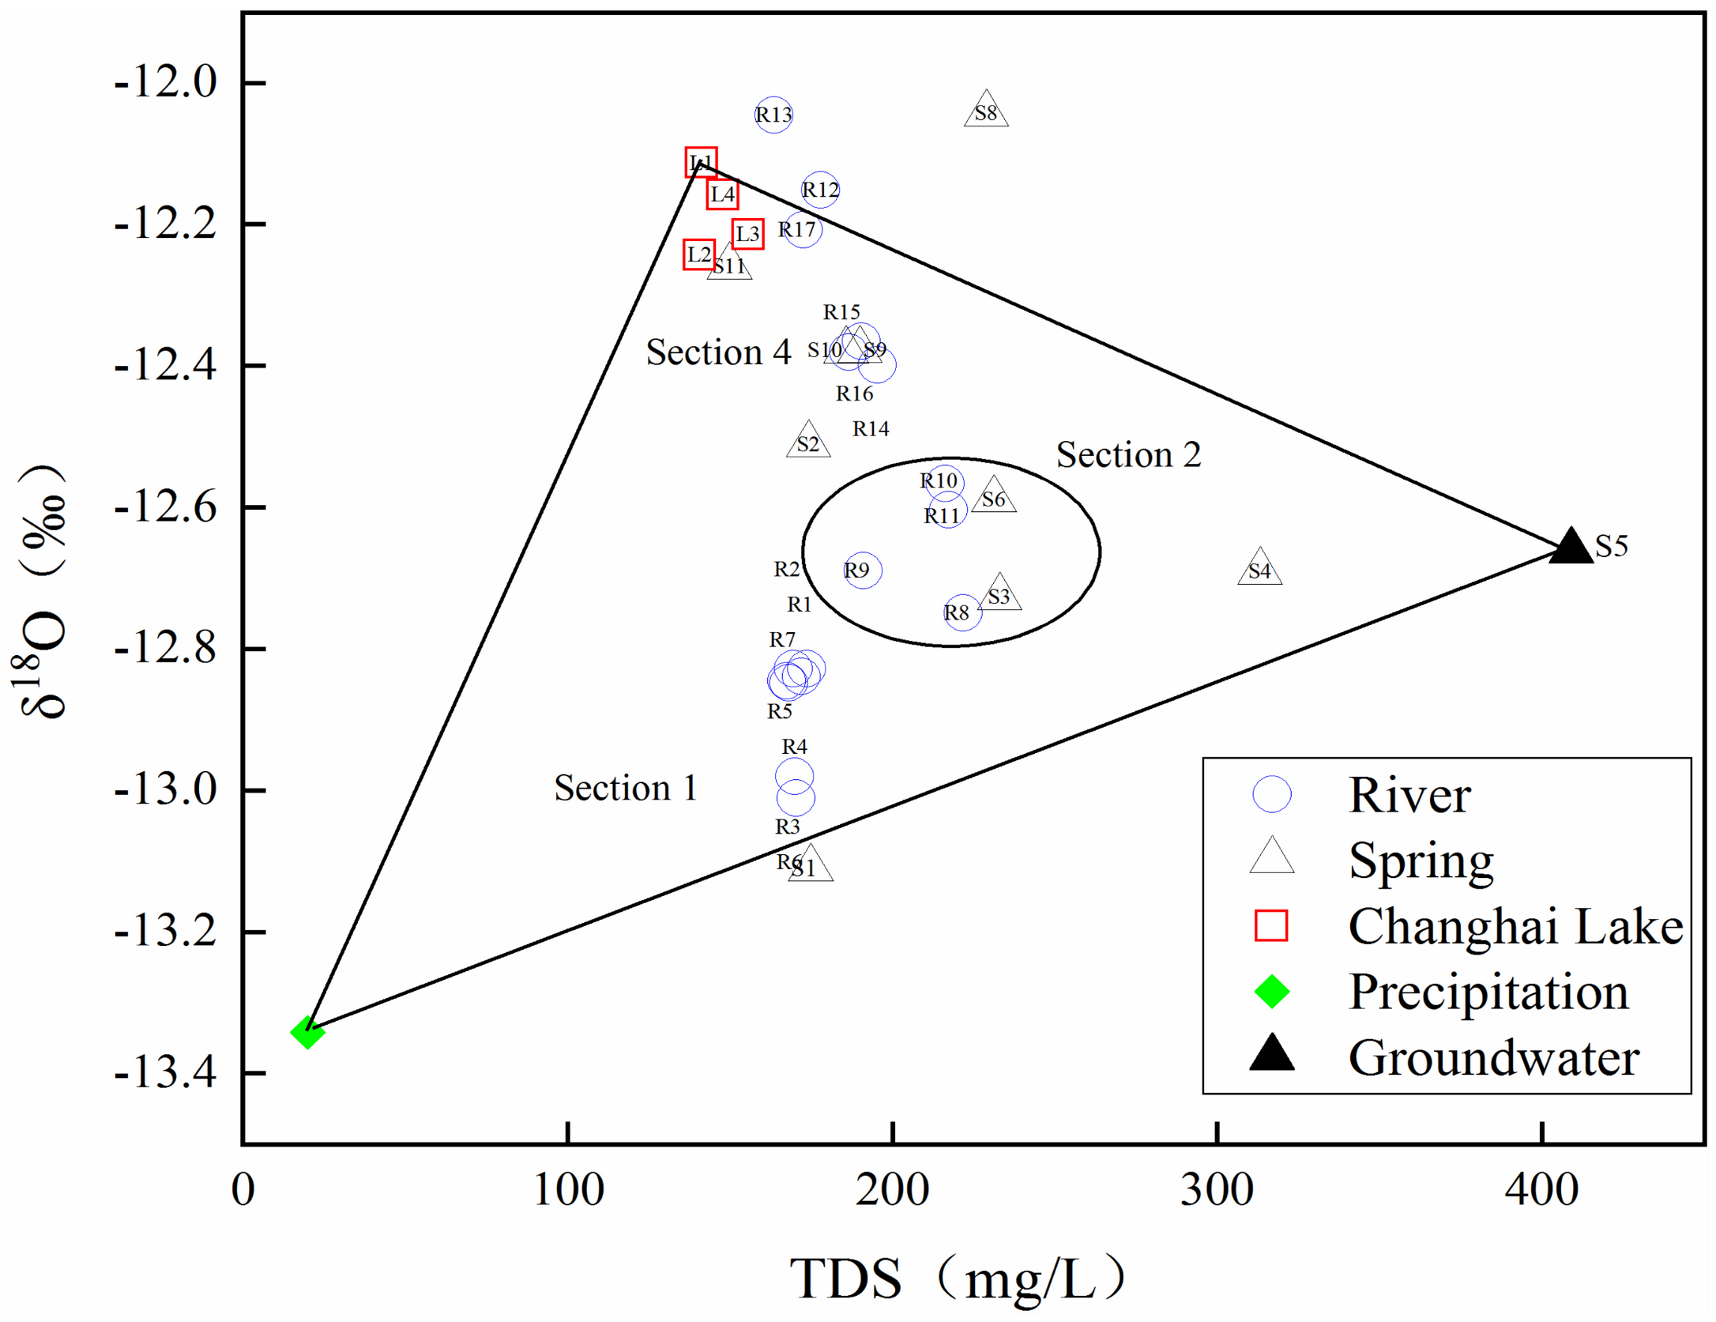
5.1. Source Identification and Quantification of River Water
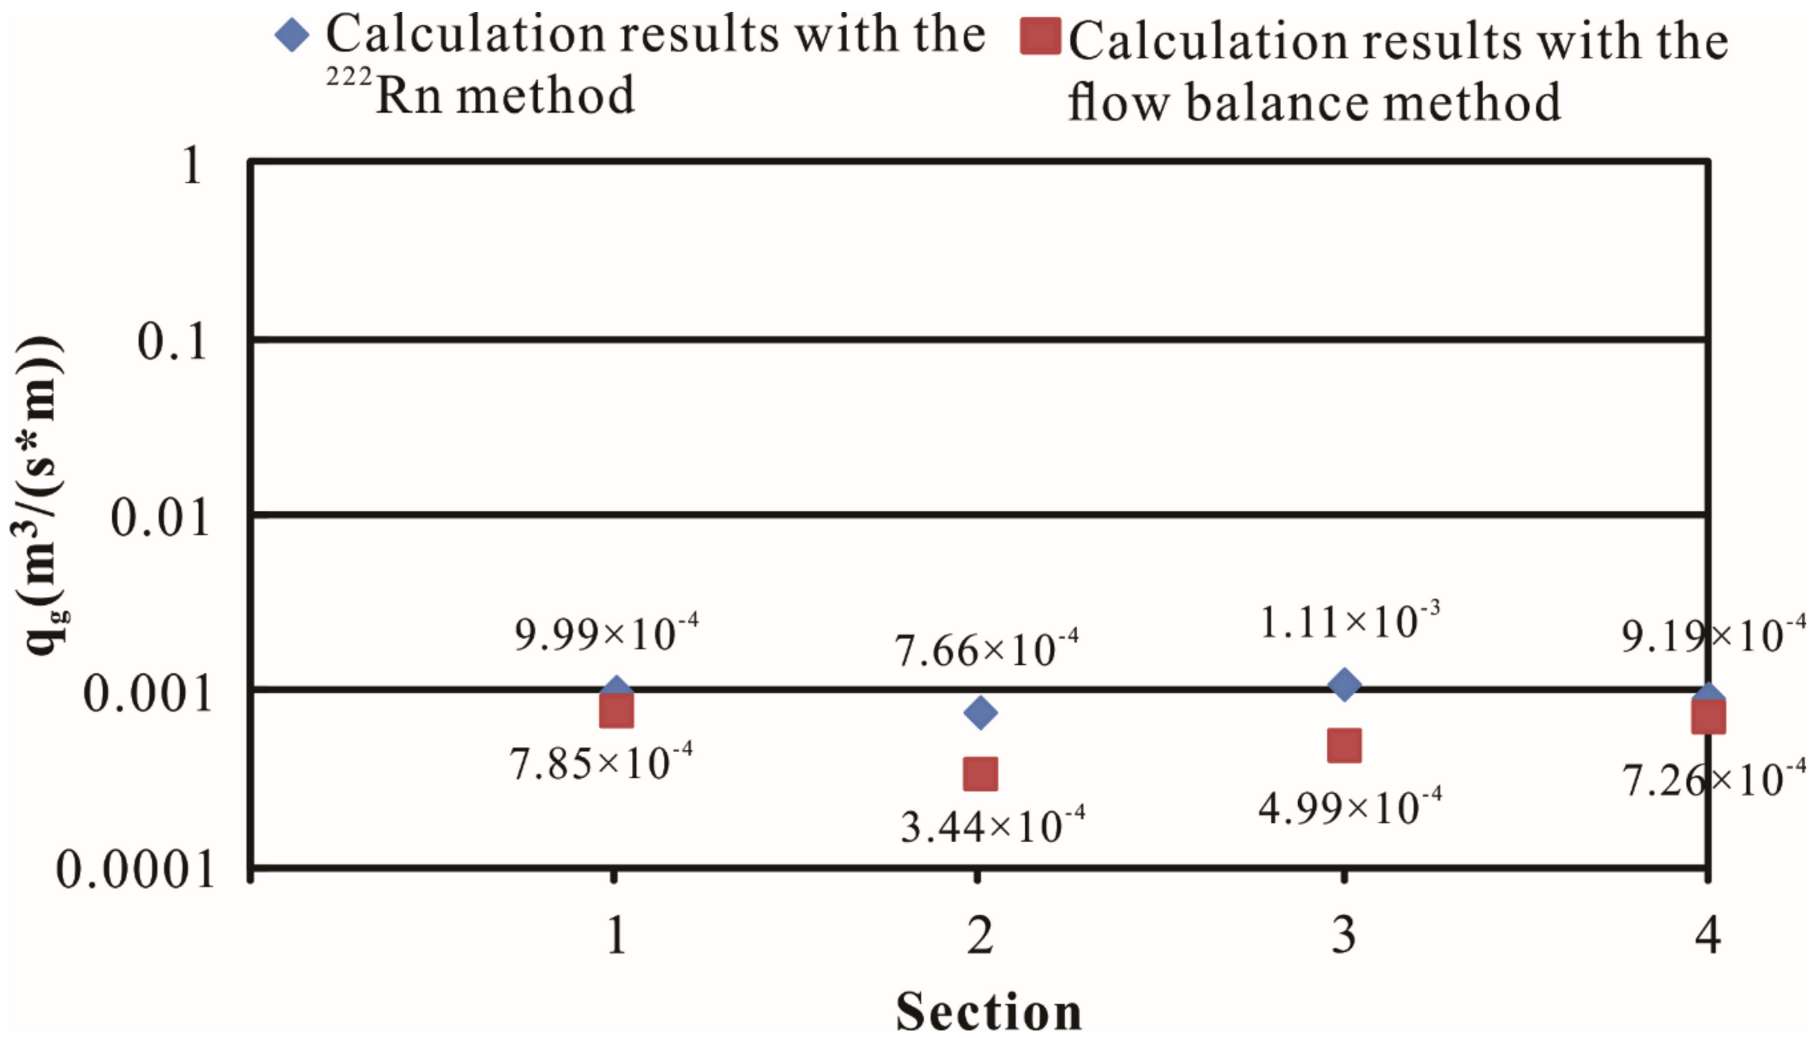
5.2. Estimation of Groundwater/River Water Interactions
5.3. Regional Groundwater Circulation Model
6. Conclusions
Supplementary Materials
Author Contributions
Funding
Acknowledgments
Conflicts of Interest
References
- Banks, E.; Simmons, C.T.; Love, A.J.; Shand, P. Assessing spatial and temporal connectivity between surface water and groundwater in a regional catchment: Implications for regional scale water quantity and quality. J. Hydrol. 2011, 404, 30–49. [Google Scholar] [CrossRef]
- Sophocleous, M. Interactions between groundwater and surface water: The state of the science. Hydrogeol. J. 2002, 10, 52–67. [Google Scholar] [CrossRef]
- Wang, W.; Dai, Z.; Zhao, Y.; Li, J.; Duan, L.; Wang, Z.; Zhu, L. A quantitative analysis of hydraulic interaction processes in stream-aquifer systems. Sci. Rep. 2016, 6, 19876. [Google Scholar] [CrossRef] [PubMed] [Green Version]
- Woessner, W.W. Stream and fluvial plain ground water interactions: Rescaling hydrogeologic thought. Ground Water 2000, 38, 423–429. [Google Scholar] [CrossRef]
- Zhu, L.; Gong, H.; Dai, Z.; Xu, T.; Su, X. An integrated assessment of the impact of precipitation and groundwater on vegetation growth in arid and semiarid areas. Environ. Earth Sci. 2015, 74, 5009–5021. [Google Scholar] [CrossRef] [Green Version]
- Khadka, M.B.; Martin, J.B.; Kurz, M.J. Synoptic estimates of diffuse groundwater seepage to a spring-fed karst river at high spatial resolution using an automated radon measurement technique. J. Hydrol. 2017, 544, 86–96. [Google Scholar] [CrossRef] [Green Version]
- Chapman, T.G. A comparison of algorithms for stream flow recession and baseflow separation. Hydrol. Process. 1999, 13, 701–714. [Google Scholar] [CrossRef]
- Cook, P.G.; Favreau, G.; Dighton, J.C.; Tickell, S. Determining natural groundwater influx to a tropical river using radon, chlorofluorocarbons and ionic environmental tracers. J. Hydrol. 2003, 277, 74–88. [Google Scholar] [CrossRef]
- Hatch, C.E.; Fisher, A.T.; Revenaugh, J.; Constantz, J.; Ruehl, C. Quantifying surface water–groundwater interactions using time series analysis of streambed thermal records: Method development. Water Resour. Res. 2006, 42. [Google Scholar] [CrossRef] [Green Version]
- Kalbus, E.; Reinstorf, F.; Schirmer, M. Measuring methods for groundwater—Surface water interactions: A review. Hydrol. Earth Syst. Sci. 2006, 10, 873–887. [Google Scholar] [CrossRef] [Green Version]
- Stellato, L.; Petrella, E.; Terrasi, F.; Belloni, P.; Belli, M.; Sansone, U.; Celico, F. Some limitations in using 222Rn to assess river—Groundwater interactions: The case of Castel di Sangro alluvial plain (central Italy). Hydrogeol. J. 2008, 16, 701–712. [Google Scholar] [CrossRef]
- Su, X.; Xu, W.; Yang, F.; Zhu, P. Using new mass balance methods to estimate gross surface water and groundwater exchange with naturally occurring tracer 222Rn in data poor regions: A case study in northwest China. Hydrol. Process. 2015, 29, 979–990. [Google Scholar] [CrossRef]
- Vespasiano, G.; Apollaro, C.; De Rosa, R.; Muto, F.; Larosa, S.; Fiebig, J.; Mulch, A.; Marini, L. The Small Spring Method (SSM) for the definition of stable isotope–elevation relationships in Northern Calabria (Southern Italy). Appl. Geochem. 2015, 63, 333–346. [Google Scholar] [CrossRef]
- Vespasiano, G.; Cannata, C.; Cianflone, G.; Dominici, R.; Apollaro, C.; Rosa, R. Analysis of groundwater Pollution in the Sant’eufemia Plain (Calabria—South Italy). Italian J. Eng. Geol. Environ. 2016, 16. [Google Scholar] [CrossRef]
- Apollaro, C.; Vespasiano, G.; De Rosa, R.; Marini, L. Use of mean residence time and flowrate of thermal waters to evaluate the volume of reservoir water contributing to the natural discharge and the related geothermal reservoir volume. Application to Northern Thailand hot springs. Geothermics 2015, 58, 62–74. [Google Scholar] [CrossRef]
- Apollaro, C.; Vespasiano, G.; Muto, F.; De Rosa, R.; Barca, D.; Marini, L. Use of mean residence time of water, flowrate, and equilibrium temperature indicated by water geothermometers to rank geothermal resources. Application to the thermal water circuits of Northern Calabria. J. Volcanol. Geotherm. Res. 2016, 328, 147–158. [Google Scholar] [CrossRef]
- Pang, Z.; Huang, T.; Chen, Y. Diminished groundwater recharge and circulation relative to degrading riparian vegetation in the middle Tarim River, Xinjiang Uygur, Western China. Hydrol. Process. 2010, 24, 147–159. [Google Scholar] [CrossRef]
- Gordon, R.P.; Lautz, L.K.; Briggs, M.A.; Mckenzie, J.M. Automated calculation of vertical pore-water flux from field temperature time series using the VFLUX method and computer program. J. Hydrol. 2012, 420, 142–158. [Google Scholar] [CrossRef]
- Xu, W.; Su, X.; Dai, Z.; Yang, F.; Zhu, P.; Huang, Y. Multi-tracer investigation of river and groundwater interactions: A case study in Nalenggele River basin, northwest China. Hydrogeol. J. 2017, 25, 2015–2029. [Google Scholar] [CrossRef]
- Pang, Z.; Kong, Y.; Li, J.; Tian, J. An isotopic geoindicator in the hydrological cycle. Procedia Earth Planet. Sci. 2017, 17, 534–537. [Google Scholar] [CrossRef]
- Clauer, N.; Techer, I.; Chaudhuri, S. Geochemical tracing of potential hydraulic connections between groundwater and run-off water in Northeastern Kansas, USA. Hydrology 2017, 4, 56. [Google Scholar] [CrossRef] [Green Version]
- Hendry, M.J.; Schwartz, F.W. An alternative view on the origin of chemical and isotopic patterns in groundwater from the Milk River Aquifer, Canada. Water Resour. Res. 1988, 24, 1747–1763. [Google Scholar] [CrossRef]
- Petitta, M.; Caschetto, M.; Galassi, D.M.P.; Aravena, R. Dual-flow in karst aquifers toward a steady discharge spring (Presciano, Central Italy): Influences on a subsurface groundwater dependent ecosystem and on changes related to post-earthquake hydrodynamics. Environ. Earth Sci. 2015, 73, 2609–2625. [Google Scholar] [CrossRef]
- Qin, D.; Tao, S. Isotope constraints on the hydraulic relationship of ground-waters between Quaternary and Tertiary aquifer in Xi’an area; Shaanxi province. Sci. China Ser. E Technol. Sci. 2001, 44, 72–79. [Google Scholar] [CrossRef]
- Hu, X.; Hu, K.; Tang, J.; You, Y.; Wu, C. Assessment of debris-flow potential dangers in the Jiuzhaigou Valley following the August 8, 2017, Jiuzhaigou earthquake, western China. Eng. Geol. 2019, 256, 57–66. [Google Scholar] [CrossRef]
- Wang, J.; Jin, W.; Cui, Y.-F.; Zhang, W.-F.; Wu, C.-H.; Alessandro, P. Earthquake-triggered landslides affecting a UNESCO Natural Site: The 2017 Jiuzhaigou earthquake in the World national park, China. J. Mt. Sci. 2019, 15, 1412–1428. [Google Scholar] [CrossRef]
- Cui, P.; Liu, S.; Tang, B.; Chen, X. Research and Prevention of Debris Flow in National Parks; Science Press: Beijing, China, 2005. [Google Scholar]
- Gan, J.J.; Liu, M.S.; Huang, R.Q.; Fan, C.R.; Li, Q.Y.; Wang, C.Y. A study of hydrological cycle in the Jiuzhaigou core scenic area. Hydrogeol. Eng. Geol. 2010, 37, e39. [Google Scholar]
- Yin, G.; Fan, X.; Guo, J.Q. Isotope Tracer on Water Cycly System in Jiuzaigou, Sichuan. Acta Geogr. Sin. 2000, 67, 487–494. [Google Scholar] [CrossRef]
- Deng, G. Study of Tourism Geosciences Landscape Formation and Protection of Jiuzhaigou World Natural Heritage Site. Ph.D. Thesis, Chengdu University of Technology, Chengdu, China, 2011. [Google Scholar]
- Fang, L.; Wu, J.; Su, J.; Wang, M.; Jiang, C.; Fan, L.; Wang, W.; Wang, C.; Tan, X. Relocation of mainshock and aftershock sequence of the Ms7.0 Sichuan Jiuzhaigou earthquake. Chin. Sci. Bull. 2018, 63, 649–662. [Google Scholar] [CrossRef] [Green Version]
- Sun, J.B.; Yue, H.; Shen, Z.K.; Fang, L.H.; Zhan, Y.; Sun, X.Y. The 2017 Jiuzhaigou Earthquake: A Complicated Event Occurred in a Young Fault System. Geophys. Res. Lett. 2018, 45, 2230–2240. [Google Scholar] [CrossRef]
- Xie, Z.; Zheng, Y.; Yao, H.; Fang, L.; Zhang, Y.; Liu, C.; Wang, M.; Shan, B.; Zhang, H.; Ren, J. Preliminary analysis on the source properties and seismogenic structure of the 2017 Ms7.0 Jiuzhaigou earthquake. Sci. China Earth Sci. 2018, 61, 339–352. [Google Scholar] [CrossRef]
- Zhao, D.; Qu, C.; Shan, X.; Gong, W.; Zhang, Y.; Zhang, G. InSAR and GPS derived coseismic deformation and fault model of the 2017 Ms7.0 Jiuzhaigou earthquake in the Northeast Bayanhar block. Tectonophysics 2018, 726, 86–99. [Google Scholar] [CrossRef]
- Fan, X.; Scaringi, G.; Xu, Q.; Zhan, W.; Dai, L.; Li, Y.; Pei, X.; Yang, Q.; Huang, R. Coseismic landslides triggered by the 8th August 2017 Ms7.0 Jiuzhaigou earthquake (Sichuan, China): Factors controlling their spatial distribution and implications for the seismogenic blind fault identification. Landslides 2018, 15, 967–983. [Google Scholar] [CrossRef]
- Li, Y.; Huang, C.; Yi, S.; Wu, C. Study on seismic fault and source rupture tectonic dynamic mechanism of Jiuzhaigou Ms7.0 earthquake. J. Eng. Geol. 2017, 25, 1141–1150. [Google Scholar]
- Lugli, S.; Tang, Y.; Reghizzi, M.; Qiao, X.; Schreiber, B.C.; Deng, G. Seasonal Pattern In the High-Elevation Fluvial Travertine From the Jiuzhaigou National Nature Reserve, Sichuan, Southwestern China. J. Sediment. Res. 2017, 87, 253–271. [Google Scholar] [CrossRef]
- Clark, I.; Fritz, P. The environmental isotopes. In Environmental Isotopes in Hydrogeology; CRC Press: Boca Raton, FL, USA, 1997; pp. 2–34. [Google Scholar]
- Fritz, P.; Cherry, J.; Sklash, M.; Weyer, K. Storm runoff analysis using environmental isotopes and major ions. In Interpretation of Environmental Isotope and Hydrochemical Data in Groundwater Hydrology; International Atomic Energy Agency (IAEA): Vienna, Austria, 1976. [Google Scholar]
- Mook, W.; Groeneveld, D.; Brouwn, A.; Van Ganswijk, A. Analysis of a run-off hydrograph by means of natural 18O. In Isotope Techniques in Groundwater Hydrology; Proceedings of a Symposium; UNESCO: Paris, France, 1974; Volume I. [Google Scholar]
- Sklash, M.G.; Farvolden, R.N. The role of groundwater in storm runoff. J. Hydrol. 1979, 43, 45–65. [Google Scholar] [CrossRef]
- Zhou, J.; Wu, J.; Liu, S.; Zeng, G.; Qin, J.; Wang, X.; Zhao, Q. Hydrograph separation in the headwaters of the shule river basin: Combining water chemistry and stable isotopes. Adv. Meteorol. 2015, 2015, 830306. [Google Scholar] [CrossRef]
- Gibson, J.J.; Edwards, T.W.D.; Birks, S.J.; Amour, N.S.; Buhay, W.M.; Mceachern, P.; Wolfe, B.B.; Peters, D.L. Progress in isotope tracer hydrology in Canada. Hydrol. Process. 2005, 19, 303–327. [Google Scholar] [CrossRef]
- Kong, Y.; Pang, Z. Evaluating the sensitivity of glacier rivers to climate change based on hydrograph separation of discharge. J. Hydrol. 2012, 434, 121–129. [Google Scholar] [CrossRef]
- Laudon, H.; Slaymaker, O. Hydrograph separation using stable isotopes, silica and electrical conductivity: An alpine example. J. Hydrol. 1997, 201, 82–101. [Google Scholar] [CrossRef]
- Kong, Y.; Pang, Z. Isotope hydrograph separation in alpine catchments: A review. J. Glaciol. Geocryol. 2010, 3, 86–91. [Google Scholar]
- Genereux, D. Quantifying uncertainty in tracer-based hydrograph separations. Water Resour. Res. 1998, 34, 915–919. [Google Scholar] [CrossRef]
- Klaus, J.; McDonnell, J.J. Hydrograph separation using stable isotopes: Review and evaluation. J. Hydrol. 2013, 505, 47–64. [Google Scholar] [CrossRef]
- Dimova, N.T.; Burnett, W.C. Evaluation of groundwater discharge into small lakes based on the temporal distribution of radon-222. Limnol. Oceanogr. 2011, 56, 486–494. [Google Scholar] [CrossRef]
- Danckwerts, P.V. Significance of liquid-film coefficients in gas absorption. Ind. Eng. Chem. 1951, 43, 1460–1467. [Google Scholar] [CrossRef]
- Zhao, D.; Wang, G.; Liao, F.; Yang, N.; Jiang, W.; Guo, L.; Liu, C.; Shi, Z. Groundwater-surface water interactions derived by hydrochemical and isotopic (222Rn, deuterium, oxygen-18) tracers in the Nomhon area, Qaidam Basin, NW China. J. Hydrol. 2018, 565, 650–661. [Google Scholar] [CrossRef]
- Craig, H. Isotopic variations in meteoric waters. Science 1961, 133, 1702–1703. [Google Scholar] [CrossRef]
- Kong, Y.; Wang, K.; Li, J.; Pang, Z. Stable isotopes of precipitation in China: A consideration of moisture sources. Water 2019, 11, 1239. [Google Scholar] [CrossRef] [Green Version]
- Michel, R.L. Tritium in the hydrologic cycle. In Isotopes in the Water Cycle: Past, Present and Future of a Developing Science; Aggarwal, P.K., Gat, J.R., Froehlich, K.F.O., Eds.; Springer: Dordrecht, The Netherlands, 2005; pp. 53–66. [Google Scholar] [CrossRef]
- Solomon, D.; Cook, P. Environmental Tracers in Subsurface Hydrology; Cook, P.G., Herczeg, A.L., Eds.; Kluwer Academic Publishers: Boston, MA, USA, 2000; pp. 397–424. [Google Scholar] [CrossRef]
- Pang, Z.; Kong, Y.; Froehlich, K.; Huang, T.; Yuan, L.; Li, Z.; Wang, F. Processes affecting isotopes in precipitation of an arid region. Tellus B 2011, 63, 352–359. [Google Scholar] [CrossRef] [Green Version]
- Babiker, M.; Gudmundsson, A. The effects of dykes and faults on groundwater flow in an arid land: The Red Sea Hills, Sudan. J. Hydrol. 2004, 297, 256–273. [Google Scholar] [CrossRef]
- Hinton, M.J.; Schiff, S.L.; English, M.C. Examining the contributions of glacial till water to storm runoff using two- and three-component hydrograph separations. Water Resour. Res. 1994, 30, 983–993. [Google Scholar] [CrossRef]
- Wels, C.; Cornett, R.J.; Lazerte, B.D. Hydrograph separation: A comparison of geochemical and isotopic tracers. J. Hydrol. 1991, 122, 253–274. [Google Scholar] [CrossRef]
- Gat, J.R. Stable isotopes of fresh and saline lakes. In Physics and Chemistry of Lakes; Lerman, A., Imboden, D.M., Gat, J.R., Eds.; Springer: Berlin/Heidelberg, Germany, 1995; pp. 139–165. [Google Scholar] [CrossRef]


| Type | Sample ID | Valley | Distance a | Altitude | T | pH | Na | K | Mg | Ca | F | Cl | HCO3 | SO4 | TDS | δ18O | δ2H | 222Rn | 222Rn Error |
|---|---|---|---|---|---|---|---|---|---|---|---|---|---|---|---|---|---|---|---|
| (km) | (m) | °C | mg/L | mg/L | mg/L | mg/L | mg/L | mg/L | mg/L | mg/L | mg/L | ‰ | ‰ | (Bq/m3) | (Bq/m3) | ||||
| River | R1 | RZ | 27.65 | 2980 | 6.9 | 8.0 | 0.0 | 0.3 | 10.5 | 46.6 | 0.3 | 1.7 | 21.6 | 179.9 | 171.0 | −12.8 | −89.6 | 35,765 | 3813 |
| R2 | RZ | 27.17 | 2942 | 7.2 | 8.4 | 0.0 | 0.3 | 10.5 | 44.5 | 0.4 | 1.7 | 23.6 | 172.2 | 167.0 | −12.8 | −89.5 | 7234 | 4125 | |
| R3 | RZ | 25.86 | 2954 | 6.8 | 8.3 | 0.0 | 0.3 | 10.9 | 44.3 | 0.4 | 1.7 | 23.7 | 172.2 | 167.3 | −13.0 | −88.7 | 3650 | 1800 | |
| R4 | RZ | 25.09 | 2900 | 15.2 | 8.4 | 0.0 | 0.3 | 11.0 | 44.6 | 0.4 | 1.8 | 23.6 | 174.8 | 169.0 | −12.8 | −88.3 | 4334 | 1402 | |
| R5 | RZ | 25.10 | 2900 | 15.2 | 8.3 | 0.0 | 0.3 | 8.8 | 46.1 | 0.4 | 1.8 | 23.4 | 167.8 | 164.7 | −12.9 | −88.4 | 3214 | 1235 | |
| R6 | RZ | 22.87 | 2760 | 8.2 | 10.2 | 0.0 | 0.3 | 10.9 | 43.9 | 0.4 | 1.6 | 23.5 | 174.0 | 167.6 | −13.0 | −89.5 | 1587 | 610 | |
| R7 | RZ | 21.68 | 2601 | 7.1 | 8.3 | 0.0 | 0.3 | 10.8 | 43.9 | 0.4 | 1.7 | 23.4 | 170.1 | 165.5 | −12.9 | −88.4 | 3002 | 1578 | |
| R8 | RZ | 20.48 | 2645 | 7.6 | 8.3 | 0.3 | 0.4 | 13.1 | 59.8 | 0.5 | 2.3 | 25.6 | 233.1 | 218.6 | −12.8 | −87.3 | 3627 | 2115 | |
| R9 | RZ | 16.56 | 2476 | 12.5 | 8.3 | 0.3 | 0.4 | 12.7 | 50.2 | 0.4 | 1.1 | 24.2 | 200.4 | 189.6 | −12.7 | −86.9 | 8053 | 3576 | |
| R10 | RZ | 15.69 | 2477 | 11.5 | 8.2 | 0.6 | 0.5 | 14.2 | 55.7 | 0.6 | 2.4 | 25.8 | 226.1 | 212.8 | −12.6 | −85.9 | 11,256 | 1100 | |
| R11 | RZ | 13.10 | 2306 | 10.1 | 8.2 | 0.7 | 2.2 | 15.2 | 53.1 | 0.6 | 3.7 | 25.7 | 226.0 | 214.1 | −12.6 | −85.7 | 1101 | 735 | |
| R12 | RZ | 12.88 | 2272 | 9.8 | 8.4 | 0.4 | 0.4 | 13.5 | 44.3 | 0.5 | 1.9 | 24.6 | 178.2 | 174.8 | −12.2 | −83.7 | 1637 | 1093 | |
| R13 | RZ | 12.73 | 2322 | 9 | 8.3 | 0.3 | 0.4 | 12.8 | 38.7 | 0.4 | 1.8 | 23.3 | 165.8 | 160.6 | −12.1 | −81.2 | 7412 | 2441 | |
| R14 | SZ | 12.13 | 2314 | 9.3 | 8.1 | 0.5 | 0.5 | 14.5 | 48.4 | 0.4 | 1.0 | 24.7 | 207.9 | 194.0 | −12.3 | −84.6 | 10,657 | 2046 | |
| R15 | SZ | 7.70 | 2207 | 11.2 | 8.3 | 0.6 | 0.5 | 14.7 | 44.8 | 0.5 | 1.1 | 25.4 | 195.1 | 185.1 | −12.4 | −84.6 | 3716 | 1601 | |
| R16 | SZ | 6.78 | 2188 | 14.3 | 8.5 | 0.6 | 0.5 | 14.8 | 44.6 | 0.4 | 0.9 | 29.5 | 195.2 | 188.9 | −12.4 | −84.2 | 2214 | 1350 | |
| R17 | SZ | 0.00 | 2004 | 11.8 | 8.5 | 0.7 | 0.5 | 12.1 | 42.9 | 0.4 | 1.0 | 28.5 | 170.1 | 171.1 | −12.2 | −82.9 | 1400 | 991 | |
| Spring | S1 | RZ | 27.87 | 2960 | 6.8 | 7.9 | 0.0 | 0.3 | 10.4 | 46.7 | 0.3 | 1.7 | 21.9 | 182.5 | 172.5 | −13.1 | −90.3 | 5365 | 2626 |
| S2 | RZ | 26.76 | 3012 | 8.7 | 8.5 | 0.0 | 0.4 | 20.1 | 34.3 | 0.6 | 0.4 | 68.3 | 100.2 | 174.2 | −12.5 | −86.1 | 693 | 460 | |
| S3 | RZ | 21.28 | 2700 | 8.2 | 7.7 | 0.3 | 0.5 | 13.3 | 63.9 | 0.6 | 2.3 | 25.1 | 246.9 | 229.5 | −12.7 | −87.7 | 12,702 | 5068 | |
| S4 | RZ | 21.30 | 2690 | 8.8 | 7.4 | 0.9 | 0.6 | 17.0 | 86.1 | 0.8 | 3.1 | 30.4 | 340.4 | 309.0 | −12.7 | −87.6 | 15,516 | 4893 | |
| S5 | RZ | 21.59 | 2675 | 10.6 | 7.1 | 0.0 | 1.1 | 12.6 | 118.1 | 0.9 | 2.5 | 35.0 | 477.6 | 409.1 | −12.7 | −86.1 | 25,481 | 4681 | |
| S6 | RZ | 16.30 | 2547 | 11.2 | 7.9 | 0.8 | 0.5 | 15.5 | 58.7 | 0.6 | 2.4 | 26.7 | 245.2 | 227.8 | −12.6 | −86.4 | 12,804 | 3744 | |
| S7 | RZ | 15.50 | 2460 | 8.6 | 8.3 | 5.0 | 2.7 | 33.7 | 78.4 | 0.5 | 8.5 | 103.9 | 274.6 | 370.0 | −10.1 | −67.9 | 178 | 358 | |
| S8 | SZ | 10.30 | 2304 | 9.5 | 8.3 | 0.7 | 0.5 | 23.9 | 50.4 | 0.6 | 1.1 | 25.7 | 251.5 | 228.5 | −12.0 | −80.7 | 2610 | 1063 | |
| S9 | SZ | 8.61 | 2263 | 10.4 | 8.3 | 0.6 | 0.5 | 14.7 | 46.0 | 0.5 | 1.0 | 25.1 | 200.2 | 188.5 | −12.4 | −84.5 | 1520 | 825 | |
| S10 | SZ | 7.85 | 2195 | 10.9 | 8.3 | 0.6 | 1.2 | 14.6 | 44.0 | 0.4 | 1.7 | 27.9 | 187.4 | 184.2 | −12.4 | −84.4 | 2855 | 1717 | |
| S11 | SZ | 6.87 | 2210 | 10 | 8.5 | 0.2 | 0.2 | 10.6 | 36.8 | 0.3 | 0.6 | 24.6 | 150.1 | 148.5 | −12.3 | −82.4 | 14,430 | 2277 | |
| Lake | L1 | ZCW | 28.64 | 2984 | 9.6 | 8.6 | 0.0 | 0.3 | 9.8 | 34.9 | 0.3 | 1.5 | 24.8 | 134.7 | 139.0 | −12.1 | −82.5 | 9143 | 624 |
| L2 | ZCW | 26.61 | 2911 | 8.1 | 8.3 | 0.0 | 0.3 | 10.1 | 34.6 | 0.3 | 0.7 | 25.7 | 135.1 | 139.3 | −12.2 | −82.9 | - | - | |
| L3 | ZCW | 26.85 | 2933 | 6.2 | 8.3 | 0.2 | 0.4 | 11.8 | 37.9 | 0.5 | 0.8 | 25.7 | 154.0 | 154.2 | −12.2 | −83.5 | - | - | |
| L4 | ZCW | 18.76 | 2604 | 10.5 | 8.6 | 0.1 | 0.4 | 9.6 | 37.7 | 0.4 | 0.8 | 23.6 | 147.0 | 146.1 | −12.2 | −82.9 | 18,539 | 2748 |
| Type | No | Sample ID | Date (yy/mm/dd) | Amount (mm) | δ18O‰ | δD‰ |
|---|---|---|---|---|---|---|
| Rain | 1 | CH-01 | 2019/10/23 | 17.5 | −14.0 | −89.8 |
| Rain | 2 | CH-02 | 2019/10/30 | 40 | −19.5 | −136.3 |
| Rain | 3 | CH-03 | 2019/11/7 | 23.1 | −17.2 | −120.8 |
| Rain | 4 | CH-04 | 2019/11/14 | 1.8 | −11.2 | −69.2 |
| Rain | 5 | CH-05 | 2019/11/20 | 2.2 | −12.8 | −80.8 |
| Rain | 6 | CH-06 | 2019/11/28 | 2 | −9.8 | −58.5 |
| Rain | 7 | CH-07 | 2019/12/19 | 12.5 | −12.6 | −78.4 |
| Snow | 8 | CH-08 | 2019/12/26 | 1.6 | −10.3 | −58.5 |
| Snow | 9 | CH-09 | 2020/1/9 | 1.8 | −14.0 | −97.7 |
| Snow | 10 | CH-10 | 2020/1/17 | 2.6 | −13.9 | −97.3 |
| Snow | 11 | CH-11 | 2020/1/23 | 4.3 | −14.2 | −97.1 |
| Snow | 12 | CH-12 | 2020/1/31 | 2.5 | −14.6 | −98.5 |
| Snow | 13 | CH-13 | 2020/2/6 | 5.5 | −14.1 | −87.9 |
| Snow | 14 | CH-14 | 2020/2/13 | 2.5 | −12.4 | −75.6 |
| Snow | 15 | CH-15 | 2020/2/20 | 2.1 | −14.0 | −84.3 |
| Snow | 16 | CH-16 | 2020/2/26 | 0.7 | −8.5 | −49.0 |
| Snow | 17 | CH-17 | 2020/3/5 | 11.2 | −12.5 | −80.5 |
| Snow | 18 | CH-18 | 2020/3/12 | 15 | −11.6 | −72.6 |
| Rain | 19 | CH-19 | 2020/3/19 | 17.3 | −10.7 | −65.7 |
| Rain | 20 | CH-20 | 2020/3/26 | 13.2 | −11.5 | −69.4 |
| Rain | 21 | CH-21 | 2020/4/2 | 19.5 | −9.4 | −50.8 |
| Rain | 22 | CH-22 | 2020/4/9 | 46 | −18.0 | −128.7 |
| Rain | 23 | CH-23 | 2020/4/16 | 10.2 | −7.7 | −38.7 |
| Rain | 24 | CH-24 | 2020/4/23 | 29.4 | −15.0 | −105.3 |
| Rain | 25 | CH-25 | 2020/5/7 | 6.6 | −4.9 | −21.9 |
| Rain | 26 | CH-26 | 2020/5/14 | 27.4 | −10.5 | −67.8 |
| Rain | 27 | CH-27 | 2020/5/21 | 24.2 | −12.4 | −83.4 |
| Rain | 28 | CH-28 | 2020/5/28 | 31.2 | −12.3 | −83.4 |
| Rain | 29 | CH-29 | 2020/6/4 | 21.6 | −12.3 | −83.4 |
| Rain | 30 | CH-30 | 2020/6/11 | 21.1 | −8.7 | −56.6 |
| Rain | 31 | CH-31 | 2020/6/18 | 38.6 | −11.6 | −80.6 |
| Sections | Rnu (Bq/L) | Rnd (Bq/L) | Rngw (Bq/L) | Qu (m3/s) | Qd (m3/s) | V (m/s) | L (m) | H (m) | qr m3/(s*m) | qg m3/(s*m) |
|---|---|---|---|---|---|---|---|---|---|---|
| 1 | 35.76 | 3.21 | 5.37 | 2.00 | 4.00 | 0.30 | 2549 | 1.50 | 1.55 × 10⁴ | 9.99 × 10⁴ |
| 2 | 1.59 | 11.26 | 16.63 | 5.85 | 8.32 | 1.07 | 7181 | 1.50 | - | 7.66 × 10⁴ |
| 3 | 11.26 | 10.66 | 6.49 | 8.32 | 10.1 | 0.95 | 3565 | 1.25 | 8.39 × 10⁴ | 11.1 × 10⁴ |
| 4 | 10.66 | 1.40 | 5.35 | 10.1 | 18.9 | 1.11 | 12,127 | 1.30 | 1.02 × 10⁴ | 9.19 × 10⁴ |
Publisher’s Note: MDPI stays neutral with regard to jurisdictional claims in published maps and institutional affiliations. |
© 2020 by the authors. Licensee MDPI, Basel, Switzerland. This article is an open access article distributed under the terms and conditions of the Creative Commons Attribution (CC BY) license (http://creativecommons.org/licenses/by/4.0/).
Share and Cite
Liao, D.; Pang, Z.; Xiao, W.; Hao, Y.; Du, J.; Yang, X.; Sun, G. Constraining the Water Cycle Model of an Important Karstic Catchment in Southeast Tibetan Plateau Using Isotopic Tracers (2H, 18O, 3H, 222Rn). Water 2020, 12, 3306. https://doi.org/10.3390/w12123306
Liao D, Pang Z, Xiao W, Hao Y, Du J, Yang X, Sun G. Constraining the Water Cycle Model of an Important Karstic Catchment in Southeast Tibetan Plateau Using Isotopic Tracers (2H, 18O, 3H, 222Rn). Water. 2020; 12(12):3306. https://doi.org/10.3390/w12123306
Chicago/Turabian StyleLiao, Dawei, Zhonghe Pang, Weiyang Xiao, Yinlei Hao, Jie Du, Xiaobo Yang, and Geng Sun. 2020. "Constraining the Water Cycle Model of an Important Karstic Catchment in Southeast Tibetan Plateau Using Isotopic Tracers (2H, 18O, 3H, 222Rn)" Water 12, no. 12: 3306. https://doi.org/10.3390/w12123306