Article

Modification of a Nile Red Staining Method for Microplastics Analysis: A Nile Red Plate Method

1
Department of Land, Water and Environment Research, Korea Institute of Civil Engineering and Building Technology (KICT), Goyang 10223, Korea
2
Civil and Environmental Engineering, University of Science and Technology, Daejeon 34113, Korea
*
Author to whom correspondence should be addressed.
Water 2020, 12(11), 3251; https://doi.org/10.3390/w12113251
Submission received: 5 October 2020 / Revised: 17 November 2020 / Accepted: 17 November 2020 / Published: 19 November 2020

Abstract

:
Recently, environmental pollution from microplastics (MPs) has become a significant reason for increasing the number of studies to develop analysis methods. The Nile red staining method (NR-S), which is staining polymer particles with Nile red (NR) dye, has been widely used for the analysis of MPs in environmental samples. However, this method has several limitations, as it is difficult to stain MPs covered with organic matter residues. In this study, we modified the NR-S method into an NR plate method (NR-P), where the plate is coated with NR instead of staining MPs directly. The optimum concentration of NR solution was obtained (1000 mg/L), and the effectiveness of the NR-P method for the analysis of MPs was assessed using different types (polypropylene, polyethylene, polyethylene terephthalate, and polystyrene), sizes (100–1000 µm), and shapes (sphere, fiber, film, and flake) of plastic materials. The NR-P method demonstrated improved resolution in the overall types, shapes, and sizes of MPs and was better than the control (without NR plate method) and NR-S method. In particular, the NR-P method can effectively observe MPs covered with organic matter, which was a major limitation of the NR-S method. Finally, MPs in sewage field samples were analyzed by the NR-P method with an accuracy of 78% confirmed by FT-IR. We demonstrated that this method is a convenient and efficient alternative for identifying MPs, even for field samples.

1. Introduction

Microplastics (MPs), defined as plastics with a size below 5 mm, originate from plastic beads in cosmetic and personal care products, synthetic fiber laundering, tire abrasion, and the mechanical and photo-oxidative fragmentation processes of larger plastic items [1,2,3,4,5]. Recently, MPs have received great attention as emerging contaminants owing to their global distribution and association with potential ecotoxicological risk [6,7,8,9,10]. As their distribution in various environmental matrices, including marine and aquatic environments, has exponentially increased, convenient and accurate analytical methods are required to monitor and understand the behavior of MPs [11,12,13,14,15,16].
MPs in environmental matrices are visually identified using microscopes after proper pretreatments, which allow for the determination of their number, sizes, and shapes [17,18]. However, these techniques have limitations of slow speed and low reliability due to errors caused by analyst proficiency [19,20]. To overcome these limitations, fluorescence staining methods using a Nile red (NR) dye were recently proposed [21]. NR dye (9-diethylamino-5H-benzo(α)phenozazine-5-one), which is a lipophilic fluorescent solution, has been known to stain MPs, owing to their hydrophobic property caused by the multiple C–H bonds in their polymer chains, and the stained MPs are then identified using a fluorescence microscope [21,22,23,24,25,26]. However, NR staining methods (NR-S) coupled with a fluorescence microscope still have severe limitations, such as co-staining of residual natural lipids or organic materials along with the MPs, leading to the inability to distinguish MPs from other materials [21,27]. Shim et al. [21] and Erni-Cassola et al. [22] reported that some organic residues, such as wood lignin and chitin, were readily co-stained with NR solution, leading to confusion between MPs and organic particles. To improve this issue, this study seeks to modify the NR-S method to effectively distinguish MPs from other residues. Additionally, we attempted to use a UV light instead of using a fluorescence microscope as a cost-effective approach. Hereafter, the modified method of NR-S is called the NR plate (NR-P) method. This NR-P method uses an NR solution to color the transparent plate, which is an MP holder, instead of staining MPs directly, and MPs are located on the colored plate and analyzed. This study is the first to propose such a quantitative analysis method. Herein, we assessed the performance of the NR-P method in MP observation using diverse polymer types, sizes, and shapes of MPs. The morphology of MPs observed were captured photographically, quantified using i-Solution image processing, and used to calculate the area of MPs recorded. The calculated MP areas detected with the NR-P method were compared with those of the controls to acquire its accuracy in MP detection. Furthermore, this new method was applied to MPs which were intentionally covered with organic materials to prove its effectiveness in the clear observation of MPs in the presence of organic matter. Finally, the NR-P method was performed for the quantitative identification of MPs which exist in sewage and sludge samples for its applicability to field samples.

2. Materials and Methods

2.1. Reagents and MP Sample Preparation

NR powder (C20H18N2O2, ≥95.0%) was obtained from Aladdin Chemicals (Shanghai, China). Chloroform (CHCl3, 99.5%) and sulfuric acid (H2SO4, 95.0%) were purchased from Samchun Chemical Co., Ltd. (Seoul, Korea). Hydrogen peroxide (H2O2, 35%) and iron (Ⅱ) sulfate heptahydrate (FeSO4∙7H2O, guaranteed reagent) were purchased from Junsei Chemical Co., Ltd. (Tokyo, Japan), and polystyrene (PS) Petri dishes (Ø60 mm) were obtained from Hyundai Micro Ltd. (Seoul, Korea).
Polyethylene (PE), polypropylene (PP), polyethylene terephthalate (PET), and PS of 100–1000 µm (purity 100%) were purchased as MP samples from MJ powder in Korea and were used to assess the performance of the NR-P method in analyzing the various types and sizes of MPs. To identify different forms of MPs using the NR-P method, commercial products, such as bottle caps (PP), disposable bags (PE), Styrofoam (PS), and garments (polyester, PEs), which were cut into pieces smaller than 1 mm in various forms, were used. Prior to the analysis, all MPs were washed with distilled water (DI) and dried for 24 h at 24–25 °C. To explore whether the NR-P method can identify MPs in the presence of organic materials, sludge sampled from a wastewater treatment plant was intentionally mixed with PP (<1 mm, purity 100%) for 24 h and then separated with tweezers and dried for 24 h at 24–25 °C.
For the application of the NR-P method to the field samples, sewage influent water and sludge were sampled from Ilsan Wastewater Treatment Plant (Goyang-si, Korea) in February 2020. Stainless buckets attached to ropes were used for sewage sampling to minimize plastic contamination and were lowered into sewage influent for sample collection. Sludge cake was collected using a shovel after a dehydration process. Both samples were stored at 4 °C prior to analysis. One liter of sewage influent and 1 g of sludge, which was dissolved with 100 mL of DI water, were sieved using both 1 mm and 0.3 mm sieves to effectively remove large and small wastes.
For the pretreatment to digest organic matters in the field samples, 100 mL of 35% H2O2 was added to the field samples and sieved and mixed for three days at 24–25 °C [28]. After going through the wet H2O2 oxidation process, an additional 20 mL of 0.05 M Fe (II) sulfate and H2O2 solutions were introduced to remove the remaining waste [29,30]. The pretreated sewage influent and sludge samples were filtered using a track-etched polycarbonate (PCTE) filter (pore size of 20 µm and a diameter 47 mm) (GVS, Sanford, ME, USA) and then dried in a desiccator prior to analysis to minimize air contamination. Then, filtered sewage influent and sludge samples were analyzed using the NR-P method along with a microscope. Fifty luminescent particles each were randomly selected using tweezers from sewage influent and sludge. Then, a total of a hundred luminescent particles were analyzed using FT-IR to assess the accuracy of the NR-P method in MP analysis.

2.2. NR-P Method Procedure

NR powder was added to chloroform, which is known to show a higher MP recovery rate than other solvents (e.g., acetone and n-hexane), and mixed until complete dissolution was observed [27]. While the NR-S method was applied as described by Fischer et al. [31], the NR-P method involved dropping 1 mL of NR solution (10, 100, and 1000 mg/L) on the middle of the Petri dish to color the plate and was then dried in a desiccator for 24 h. At this point, it is important to evenly distribute the NR on the plate. Subsequently, the targeted MPs (not dyed) were transferred with tweezers to the middle of the NR-colored plate and analyzed. In the case of the field samples, a transparent PCTE filter, including field MPs, was placed on the NR-colored plate.

2.3. MPs Analyses

To illuminate MPs samples, a UV wavelength of 365 nm, which was reported as an optimal wavelength for MP luminescence, was applied using UV light [30,32,33]. Subsequently, the MPs were observed using a stereoscopic microscope (Discovery V8, Carl Zeiss, Oberkochen, Germany) and recorded using an IMT cam 6.3 camera (IMT i-solution Inc., Canada) in dark conditions to maximize the luminescence of MPs [34].
In the case of the field sample analysis, due to their impurities, they were additionally analyzed using an FT-IR spectroscope (Spotlight 400, Perkin Elmer, Waltham, MA, USA) to confirm whether the light-emitting particles in the field sample were plastics. The resolution was 8 cm−1 and collected spectra had an average of 16 scans. Detected spectra were searched and matched with PerkinElmer software library (PerkinElmer Spectrum version 10.5.1).

2.4. Image and Statistical Analyses

The size of the luminescent particles recorded by an IMT cam 6.3 camera was quantified using i-Solution software (IMT i-Solution Inc., Canada). Images were sized to 5 × 7.5 cm, and backgrounds were erased using Photoshop to highlight the luminous sections (Adobe Photoshop 7.0.1). Prior to analyzing the image, all image sections designated as luminescent were highlighted by applying the contrasting method (threshold: 155) with i-Solution (IMT i-Solution 26.1 × 64). After this process, the area of MPs quantified by i-Solution was compared by calculating the degree of accuracy achieved by dividing the quantified areas of each treatment (controls, NR-S, and NR-P methods) by that of light only with Equation (1).
Accuracy   ( % )   =   M P s   a r e a   d e t e c t i o n   w i t h   each   treatment M P s   a r e a   d e t e c t i o n   w i t h   l i g h t   o n l y
In this study, light only indicates MP observation using light without the NR-stained plate and the controls mean MP observation with UV but no NR-stained plate. A t-test was conducted for a two-sample comparison to determine if there was a statistical difference between the samples, where a p-value of 0.05 determined significance.

3. Results

3.1. Optimization of NR-P Method

To maximize the capability of the NR-P method in MP analysis, various concentrations of NR solution (0, 10, 100, and 1000 ppm) were applied to the plates and assessed. The plates colored with NR solution showed an increasing red color intensity as the concentration of NR solution rose, as expected (Figure 1a). While the MPs were observed as slightly blurry in the MP boundary at 10 and 100 ppm, the highest concentration (1000 ppm) showed the clearest MPs (Figure 1b). Therefore, all subsequent experiments used 1000 ppm when the NR-P method was applied.

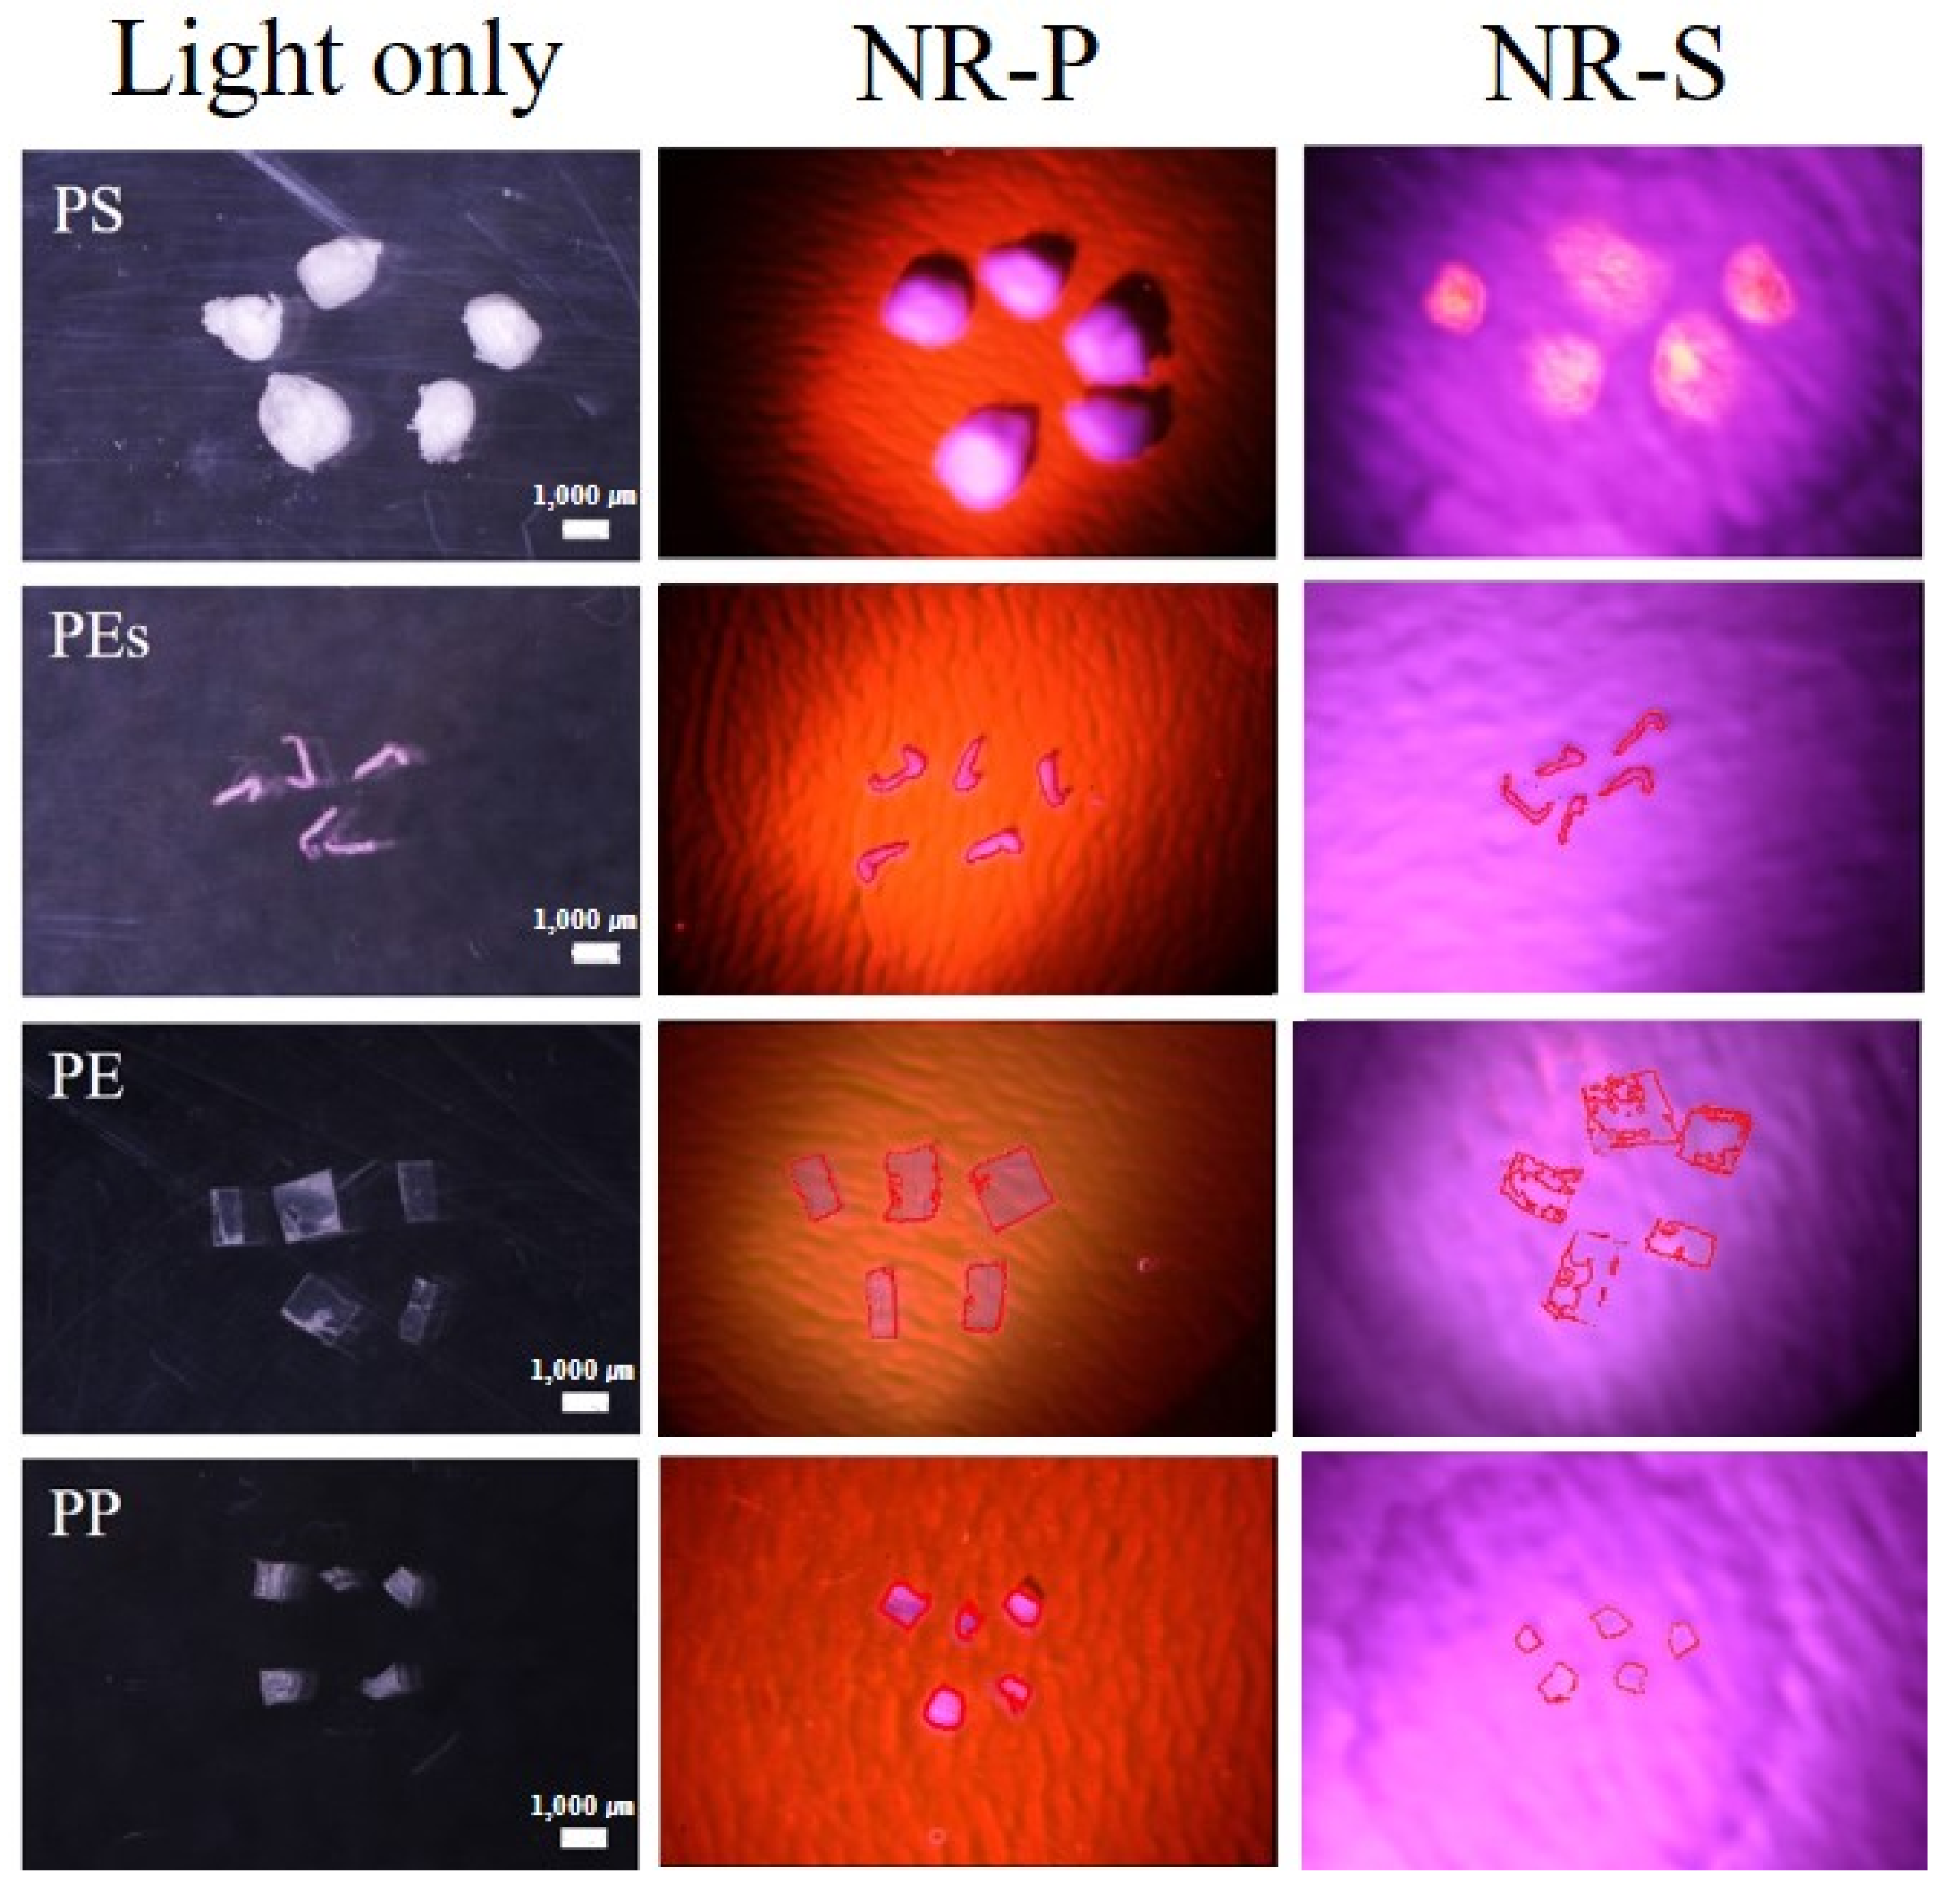
3.2. Validation of the NR-P Method in MP Analysis Using Diverse MPs

The performance of the NR-P method for the MP observation was assessed using different types of polymers (PP, PE, PET, and PS (100% purity)) with an average size of 300–500 µm (Figure 2). The NR-P method showed a clearer resolution of all types of MPs assessed than the control, for which the plate was not colored. Thus, no impact of MP type on their luminescence was observed with the NR-P method.
Secondly, PP MPs with different sizes in the range of 100 to 400, 400 to 700, 700 to 1000, and ≥1000 μm were identified using the NR-P method (Figure 3). The MP areas detected using the NR-P method and the controls were quantified using i-Solution software and compared with those of light only (standard) to acquire the accuracy of the NR-P method in MP detection (Figure 3 and Table 1). No statistical difference in the MP detection with the NR-P method was observed in the range of 400 to 1000 µm MPs compared to the controls (Table 1). However, smaller MPs (100–400 µm) with the NR-P method showed much improved MP area quantification than the controls (p = 0.049) with 53 ± 15% and 84 ± 21% accuracy, respectively (Table 1). Thus, as MP particle size decreases, the NR-P method is beneficial for MP analysis.
The commercial plastic products (PP, PE, PS, and PEs) with different forms were analyzed using the NR-P and NR-S methods (Figure 4 and Table 2, respectively). Visually, the NR-P method showed a clear observation of the diverse forms of MPs, whereas the NR-S method showed a dim-glow observation of MPs assessed. The MP analysis using only light was provided as a standard to compare the effectiveness of each method (Figure 4). In the NR-S method, PS Styrofoam was shown blurrily, leading to large area integration, compared with light only. This study integrated five MPs of each different form and the statistical power was provided (p-value) for each observation (Table 2). The detected areas of PEs (fiber), PE (film), and PP (flake) with the NR-P method were above 90% of the integrated areas compared with light only, thus confirming good accuracy of the NR-P method. However, the NR-S method showed 89 ± 6.4%, 37 ± 14.9%, and 58 ± 4.5% accuracy for fiber, film, and flake MPs, respectively (Table 2). In particular, PS (Styrofoam) was melted in the NR-S method applied, probably owing to its strong chloroform solvent property and which led to the blurry PS (Styrofoam) observation. It appears that PEs (fiber), PE (film), and PP (flakes) were not dyed completely by the NR solution in the NR-S method (Figure 4). This is hypothesized because these commercial plastic items contain other additives (e.g., stain-resistant compounds, flame retardants, and fabric softeners), making staining difficult.

3.3. Effect of Organic Materials on MP Analysis with NR-P Method

As reported in the previous studies, the major limitation of the NR-S method is co-staining organic matter along with MPs, which requires exhaustive pretreatment [21,28,30,35]. Therefore, to improve this issue, the NR-P method is applied to the MP analysis in the presence of organic matter. As shown in Figure 5, light only confirmed the presence of organic matter on the surface of MPs. The NR-P method clearly showed the MPs even in the presence of organic matter, whereas the controls (i.e., without colored plate) revealed undistinguishable MPs with organic matter. Therefore, the NR-P method is expected to compensate for the disadvantages associated with the NR-S method, such as co-staining of other residues, with MPs being hard to distinguish.

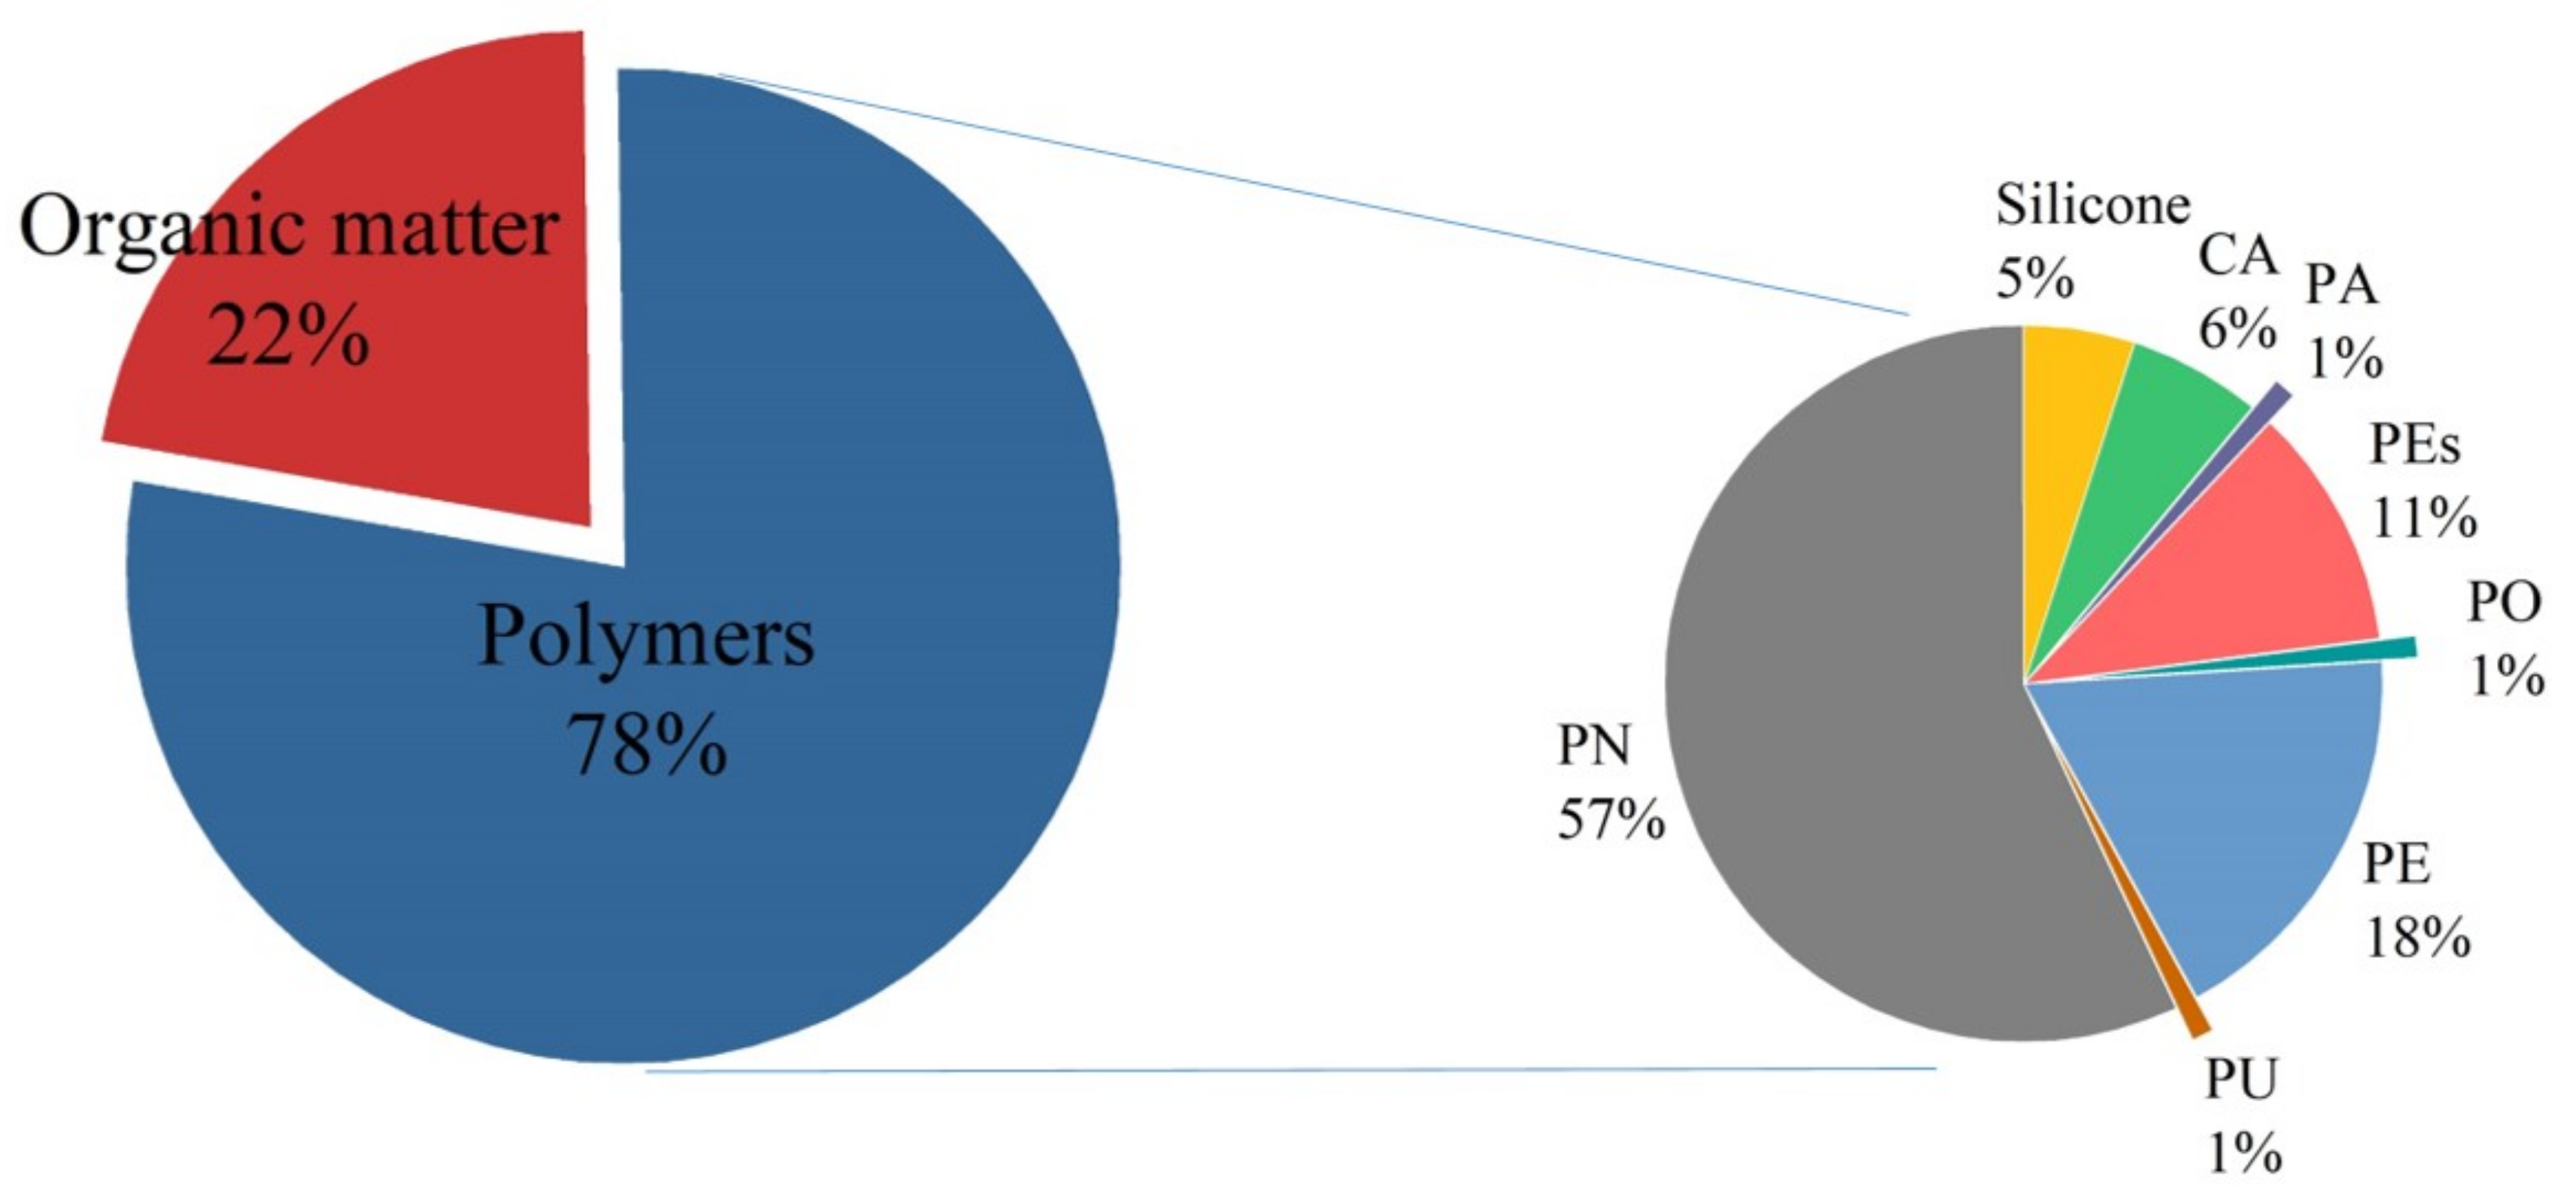
3.4. Application of NR-P Method in Field Sample Analysis

The sewage water and sludge samples were observed with the NR-P method and supplementally analyzed with an FT-IR instrument to confirm whether the luminescent materials were MPs in the field samples. The numbers of luminescent materials in the sludge samples were recorded in the control and the NR-P method as six and eleven MPs in the sewage influent water, respectively (Figure 6). Thus, the NR-P method can capture more luminescent items than the controls. Figure 6 showed that the NR-P method can effectively identify the fiber type of MPs regardless of their various shapes. The results of the FT-IR analysis revealed that 78% of the luminescent materials, which we assumed to be MPs in the field samples by the NR-P analysis, were identified as polymers (i.e., plastic items) (Figure 7). The remaining 22% of items were composed of solidified oil components and organic matter. In the field samples of MPs, polynorbonene (PN) was predominantly detected, followed by PE, PEs, PP, cellulose acetate (CA), and silicone, which accounted for 57%, 18%, 11%, 6%, and 5%, respectively, of the illuminant materials (Figure 7). PN is commonly used in automotive parts, such as bumpers and door sealing, at car repair shops, or in the manufacturing industry [36,37]. Large amounts of PN likely detected in the Ilsan sewage treatment plant may originate from the numerous car repair and sale shops near the plant. Other than PN, the proportions of PE, PEs, and PP were similar to the other sewage treatment plant study [38]. Less than 1% of polyamide (PA), polyolefin (PO), and polyurethane (PU) were detected in the field sample (Figure 7).

4. Discussion

This study modified the NR-S method to the NR-P method to improve the effectiveness of MP analysis and overcome the drawbacks of the NR-S method, such as co-staining some organic residues along with MPs. We assessed the performance of the NR-P method in detecting and quantifying MPs using various commercial MPs and field samples.
Overall, the NR-P method demonstrated good efficiency in the diverse MP analysis, including both commercially available MPs and the field samples at 1000 ppm of NR solution applied, which was found to be an optimal condition. To be more concrete, the NR-P method showed clearer resolution for various types of polymers (PP, PE, PET, and PS) than the controls. For the size effect of the MP analysis, while no statistical difference in MP size integration in the range of 400 ~ 1000 µm was observed between the NR-P method and the controls, all showing more than 90% accuracy, MPs smaller than 400 µm are more effectively observed using the NR-P method than the control, with 84 ± 21% and 53 ± 15% accuracy, respectively. Additionally, the diverse shapes of MPs were obviously observed using the NR-P method, whereas PS Styrofoam MPs were melted when the NR-S method was applied due to the strong chloroform solvent property. Film and fiber types of MPs were more clearly observed in the NR-P method compared with the NR-S method. Additionally, the presence of organic matter residues did not interfere with the observation of MPs when the NR-P method was applied. Lastly, when the wastewater samples were analyzed using general microscopes, it was difficult to distinguish between MPs and other organic materials, especially for the small and non-colored MPs [19]. However, this study verified that MPs in the field samples were clearly observed using the NR-P method and this result was correlated with FT-IR analysis, showing 78% of luminescent materials as MPs.
Erni-Cassola et al. [22] acknowledged the weakness of NR-S method when it was applied to less hydrophobic MPs, such as polycarbonate (PC), polyurethane (PUR), PET, and polyvinyl chloride (PVC). Given that the principle of the NR-S method is to dye the MPs directly, it is expected that the polymer type may be an important factor to determine the dyeing tendency of MPs by NR solution. However, based on the results presented here, this NR-P method removes the issue of the different dyeing degree of MPs, regardless of MP type. Likewise, the effectiveness of the NR-S method in the MP analysis was significantly affected by the solvent types which were used for the NR solution preparation. Tamminga et al. [27] reported that the accuracy of MP analysis was affected by the NR solvent type since the degree of MP staining was varied depending on the NR solvent. In addition, Shim et al. [21] insisted that the selection of a suitable solvent was important work for not only staining MPs but also the filter used. In other words, some specific filter papers which were used for the MP extraction from environmental matrices can be degraded by a strong solvent. For example, it is reported that black PC filter paper was highly degraded by ethyl acetate, acetonitrile, dichloromethane, and toluene and was discolored by methanol, ethanol, and cyclohexane [21]. Thus, the selection of the NR solvent type was a critical issue for MP analysis in the NR-S method but, however, not for the NR-P method. In addition, for the NR-S method, the fluorescence excitation and emission wavelengths were fairly significant factors to determine the resolution of MP analysis and they were affected by the polymer type [24]. For example, it was reported that the detection of strongly hydrophobic MPs were was benefited by short excitation/emission wavelength (450–500/≤450–500) and more neutral MPs were ideally visualized at a longer excitation wavelength (red, 515–560/≥590 nm) [39]. However, since this NR-P method does not require a fluorescence microscope, these different fluorescence conditions depending on MP type were not an issue in the NR-P method application. These critical advantages of the NR-P method are proven to be enough for convenient and efficient application to MP analysis.
However, we expected that the obscured MPs may not be clearly observed with the NR-P method, considering that this method requires that the NR solution coated on the plate should be passed through MPs to luminate them. Additionally, given that Erni-Cassola et al. [22] showed that 20–1 mm MPs were effectively observed with the NR-S method, along with fluorescence microscopy, further research is required for the observation of MPs smaller than 100 µm with the NR-P method.

Author Contributions

H.K. contributed to the conception of the study; S.P., H.K., and B.L. performed the literature analyses and wrote the manuscript; S.K. and J.A. helped perform the analysis with constructive discussions. All authors have read and agreed to the published version of the manuscript.

Funding

This work was funded by Korea Institute of Civil Engineering and Builing Technology (KICT) (projects#20200394-001) and a National Research Council of Science & Technology (NST) grant by the Korean government (No. CAP-18-07-KICT).

Conflicts of Interest

The authors declare no conflict of interest.

References

  1. Boucher, J.; Friot, D. Primary Microplastics in the Oceans: A Global Evaluation of Sources; International Union for Conservation of Nature (IUCN): Gland, Switzerland, 2017; 43p. [Google Scholar]
  2. Horton, A.A.; Walton, A.; Spurgeon, D.J.; Lahive, E.; Svendsen, C. Microplastics in freshwater and terrestrial environments: Evaluating the current understanding to identify the knowledge gaps and future research priorities. Sci. Total Environ. 2017, 586, 127–141. [Google Scholar] [CrossRef] [PubMed] [Green Version]
  3. Ryan, P.G.; Moore, C.J.; Van Franeker, J.A.; Moloney, C.L. Monitoring the abundance of plastic debris in the marine environment. Phil. Trans. R Soc. B 2009, 364, 1999–2012. [Google Scholar] [CrossRef] [PubMed] [Green Version]
  4. Carr, S.A.; Liu, J.; Tesoro, A.G. Transport and fate of microplastic particles in wastewater treatment plants. Water Res. 2016, 91, 174–182. [Google Scholar] [CrossRef] [PubMed]
  5. Thompson, R.C. Plastic Debris in the Marine Environment: Consequences and Solutions. In Proceedings of the Symposium Marine Nature Conservation in Europe, Straslund, Germany, 8–12 May 2006; pp. 107–115. [Google Scholar]
  6. Browne, M.A.; Crump, P.; Niven, S.J.; Teuten, E.; Tonkin, A.; Galloway, T.; Thompson, R. Accumulation of Microplastic on Shorelines Woldwide: Sources and Sinks. Environ. Sci. Technol. 2011, 45, 9175–9179. [Google Scholar] [CrossRef] [PubMed]
  7. Browne, M.A.; Galloway, T.; Thompson, R. Microplastic-an emerging contaminant of potential concern?: Learned Discourses. Integr. Environ. Assess. Manag. 2007, 3, 559–561. [Google Scholar] [CrossRef]
  8. Cozar, A.; Echevarria, F.; Gonzalez-Gordillo, J.I.; Irigoien, X.; Ubeda, B.; Hernandez-Leon, S.; Palma, A.T.; Navarro, S.; Garcia-de-Lomas, J.; Ruiz, A.; et al. Plastic debris in the open ocean. Proc. Natl. Acad. Sci. USA 2014, 111, 10239–10244. [Google Scholar] [CrossRef] [Green Version]
  9. Ivar do Sul, J.A.; Costa, M.F. The present and future of microplastic pollution in the marine environment. Environ. Pollut. 2014, 185, 352–364. [Google Scholar] [CrossRef]
  10. Mato, Y.; Isobe, T.; Takada, H.; Kanehiro, H.; Ohtake, C.; Kaminuma, T. Plastic Resin Pellets as a Transport Medium for Toxic Chemicals in the Marine Environment. Environ. Sci. Technol. 2001, 35, 318–324. [Google Scholar] [CrossRef]
  11. Cai, H.; Du, F.; Li, L.; Li, B.; Li, J.; Shi, H. A practical approach based on FT-IR spectroscopy for identification of semi-synthetic and natural celluloses in microplastic investigation. Sci. Total Environ. 2019, 669, 692–701. [Google Scholar] [CrossRef]
  12. Käppler, A.; Fischer, M.; Scholz-Böttcher, B.M.; Oberbeckmann, S.; Labrenz, M.; Fischer, D.; Eichhorn, K.-J.; Voit, B. Comparison of μ-ATR-FTIR spectroscopy and py-GCMS as identification tools for microplastic particles and fibers isolated from river sediments. Anal. Bioanal. Chem. 2018, 410, 5313–5327. [Google Scholar] [CrossRef]
  13. Mani, T.; Hauk, A.; Walter, U.; Burkhardt-Holm, P. Microplastics profile along the Rhine River. Sci. Rep. 2016, 5, 17988. [Google Scholar] [CrossRef]
  14. Munno, K.; De Frond, H.; O’Donnell, B.; Rochman, C.M. Increasing the Accessibility for Characterizing Microplastics: Introducing New Application-Based and Spectral Libraries of Plastic Particles (SLoPP and SLoPP-E). Anal. Chem. 2020, 92, 2443–2451. [Google Scholar] [CrossRef] [PubMed]
  15. Primpke, S.; Lorenz, C.; Rascher-Friesenhausen, R.; Gerdts, G. An automated approach for microplastics analysis using focal plane array (FPA) FTIR microscopy and image analysis. Anal. Methods 2017, 9, 1499–1511. [Google Scholar] [CrossRef] [Green Version]
  16. Wang, Z.-M.; Wagner, J.; Ghosal, S.; Bedi, G.; Wall, S. SEM/EDS and optical microscopy analyses of microplastics in ocean trawl and fish guts. Sci. Total Environ. 2017, 603–604, 616–626. [Google Scholar] [CrossRef] [PubMed]
  17. Mathalon, A.; Hill, P. Microplastic fibers in the intertidal ecosystem surrounding Halifax Harbor, Nova Scotia. Mar. Pollut. Bull. 2014, 81, 69–79. [Google Scholar] [CrossRef]
  18. Nel, H.A.; Froneman, P.W. A quantitative analysis of microplastic pollution along the south-eastern coastline of South Africa. Mar. Pollut. Bull. 2015, 101, 274–279. [Google Scholar] [CrossRef]
  19. Song, Y.K.; Hong, S.H.; Jang, M.; Han, G.M.; Rani, M.; Lee, J.; Shim, W.J. A comparison of microscopic and spectroscopic identification methods for analysis of microplastics in environmental samples. Mar. Pollut. Bull. 2015, 93, 202–209. [Google Scholar] [CrossRef]
  20. Napper, I.E.; Thompson, R.C. Release of synthetic microplastic plastic fibres from domestic washing machines: Effects of fabric type and washing conditions. Mar. Pollut. Bull. 2016, 112, 39–45. [Google Scholar] [CrossRef] [Green Version]
  21. Shim, W.J.; Song, Y.K.; Hong, S.H.; Jang, M. Identification and quantification of microplastics using Nile Red staining. Mar. Pollut. Bull. 2016, 113, 469–476. [Google Scholar] [CrossRef]
  22. Erni-Cassola, G.; Gibson, M.I.; Thompson, R.C.; Christie-Oleza, J.A. Lost, but Found with Nile Red: A Novel Method for Detecting and Quantifying Small Microplastics (1 mm to 20 μm) in Environmental Samples. Environ. Sci. Technol. 2017, 51, 13641–13648. [Google Scholar] [CrossRef] [Green Version]
  23. Klein, M.; Fischer, E.K. Microplastic abundance in atmospheric deposition within the Metropolitan area of Hamburg, Germany. Sci. Total Environ. 2019, 685, 96–103. [Google Scholar] [CrossRef] [PubMed]
  24. Maes, T.; Jessop, R.; Wellner, N.; Haupt, K.; Mayes, A.G. A rapid-screening approach to detect and quantify microplastics based on fluorescent tagging with Nile Red. Sci. Rep. 2017, 7, 44501. [Google Scholar] [CrossRef] [PubMed] [Green Version]
  25. Scircle, A.; Cizdziel, J.V.; Missling, K.; Li, L.; Vianello, A. Single-Pot Method for the Collection and Preparation of Natural Water for Microplastic Analyses: Microplastics in the Mississippi River System during and after Historic Flooding. Environ. Toxicol. Chem. 2020, 39, 986–995. [Google Scholar] [CrossRef]
  26. Stanton, T.; Johnson, M.; Nathanail, P.; Gomes, R.L.; Needham, T.; Burson, A. Exploring the Efficacy of Nile Red in Microplastic Quantification: A Containing Approach. Environ. Sci. Technol. Lett. 2019, 6, 606–611. [Google Scholar] [CrossRef]
  27. Tamminga, M.; Hengstmann, E.; Fischer, E.K. Nile Red Staining as a Subsidiary Method for Microplastic Quantification: A Comparison of Three Solvents and Factors Influencing Application Reliability. J. Earth Sci. Environ. Stud. 2017, 2472–6397. [Google Scholar] [CrossRef] [Green Version]
  28. Tagg, A.S.; Sapp, M.; Harrison, J.P.; Ojeda, J.J. Identification and Quantification of Microplastics in Wastewater Using Focal Plane Array-Based Reflectance Micro-FT-IR. Imaging Anal. Chem. 2015, 87, 6032–6040. [Google Scholar] [CrossRef] [Green Version]
  29. Avio, C.G.; Gorbi, S.; Regoli, F. Experimental development of a new protocol for extraction and characterization of microplastics in fish tissues: First observations in commercial species from Adriatic Sea. Mar. Environ. Res. 2015, 111, 18–26. [Google Scholar] [CrossRef]
  30. Masura, J.; Baker, J.; Foster, G.; Arthur, C. Laboratory Methods for the Analysis of Microplastics in the Marine Environment; NOAA Technical Memorandum; National Oceanic and Atmospheric Administration, U.S. Department of Commerce: Washington, DC, USA, 2015.
  31. Fischer, E.K.; Paglialonga, L.; Czech, E.; Tamminga, M. Microplastic pollution in lakes and lake shoreline sediments—A case study on Lake Bolsena and Lake Chiusi (central Italy). Environ. Pollut. 2016, 213, 648–657. [Google Scholar] [CrossRef]
  32. Hengstmann, E.; Tamminga, M.; vom Bruch, C.; Fischer, E.K. Microplastic in beach sediments of the Isle of Rügen (Baltic Sea)—Implementing a novel glass elutriation column. Mar. Pollut. Bull. 2018, 126, 263–274. [Google Scholar] [CrossRef]
  33. Prata, J.C.; Reis, V.; Matos, J.T.V.; da Costa, J.P.; Duarte, A.C.; Rocha-Santos, T. A new approach for routine quantification of microplastics using Nile Red and automated software (MP-VAT). Sci. Total Environ. 2019, 690, 1277–1283. [Google Scholar] [CrossRef]
  34. Prata, J.C.; Alves, J.R.; da Costa, J.P.; Duarte, A.C.; Rocha-Santos, T. Major factors influencing the quantification of Nile Red stained microplastics and improved automatic quantification (MP-VAT 2.0). Sci. Total Environ. 2020, 719, 137498. [Google Scholar] [CrossRef] [PubMed]
  35. Chubarenko, I.P.; Esiukova, E.E.; Bagaev, A.V.; Bagaeva, M.A.; Grave, A.N. Three-dimensional distribution of anthropogenic microparticles in the body of sandy beaches. Sci. Total Environ. 2018, 628–629, 1340–1351. [Google Scholar] [CrossRef] [PubMed]
  36. Grove, N.R.; Kohl, P.A.; Allen, S.A.B.; Jayaraman, S.; Shick, R. Functionalized polynorbornene dielectric polymers: Adhesion and mechanical properties. J. Polym. Sci. B Polym. Phys. 1999, 37, 3003–3010. [Google Scholar] [CrossRef]
  37. Haselwander, T.F.A.; Heitz, W.; Krügel, S.A.; Wendorff, J.H. Polynorbornene: Synthesis, properties and simulations. Macromol. Chem. Phys. 1996, 197, 3435–3453. [Google Scholar] [CrossRef]
  38. Magni, S.; Binelli, A.; Pittura, L.; Avio, C.G.; Della Torre, C.; Parenti, C.C.; Gorbi, S.; Regoli, F. The fate of microplastics in an Italian Wastewater Treatment Plant. Sci. Total Environ. 2019, 652, 602–610. [Google Scholar] [CrossRef] [PubMed]
  39. Rumin, J.; Bonnefond, H.; Saint-Jean, B.; Rouxel, C.; Sciandra, A.; Bernard, O.; Cadoret, J.-P.; Bougaran, G. The use of fluorescent Nile red and BODIPY for lipid measurement in microalgae. Biotechnol. Biofuels 2015, 8, 42. [Google Scholar] [CrossRef] [Green Version]
Figure 1. (a) Nile red plate analysis with respect to solution concentration and (b) identification of polypropylene (PP) particle under a microscope (×30).
Water 12 03251 g001
Figure 2. Identification of plastic types sized in the range of 300 to 500 µm (PP, polyethylene (PE), polyethylene terephthalate (PET), and polystyrene (PS)).
Water 12 03251 g002
Figure 3. Identification of microplastics based on size. (a) Above 1000 µm, (b) 700~1000 µm, (c) 400~700 µm, and (d) 100–400 µm).
Water 12 03251 g003
Figure 4. Identification of shape of microplastics on the Nile red plate (NR-P) and Nile red staining (NR-S) (PS: sphere, Polyester (PEs): fiber, PE: film, and PP: flake) and recovery rate.
Water 12 03251 g004
Figure 5. Identification of effect of organic matter contamination by control and NR-P methods.
Water 12 03251 g005
Figure 6. Identification of field samples: (a) sludge and (b) sewage influent under (left) control and (right) NR-P methods (×30).
Water 12 03251 g006
Figure 7. Results of FT-IR analysis of luminescent particles in the field samples using the NR-P method.
Water 12 03251 g007
Table 1. Comparison of detected area to original size for the control and Nile red plate (NR-P) methods.
Size (μm)Accuracy (%)p-Value
ControlNR-P
100086 (±8.5)96 (±3.1)0.20
700–100087 (±5.4)93 (±4.3)0.18
400–70076 (±12.8)93 (±3.5)0.11
100–40053 (±15)84 (±21)0.04
Table 2. Comparison of detected area to shape of microplastic for NR-S and NR-P methods.
ShapeRecovery Rates (%)p-Value
NR-SNR-P
Sphere-90 (±2.7)-
Fiber89 (±6.4)1000.0004
Film37 (±14.9)98 (±3.8)0.0146
Flake58 (±4.5)92 (±14.3)0.0005
Publisher’s Note: MDPI stays neutral with regard to jurisdictional claims in published maps and institutional affiliations.

