Article

A Livelihood Resilience Measurement Framework for Dam-Induced Displacement and Resettlement

1
School of Water Resources and Hydropower Engineering, North China Electric Power University, Beijing 102206, China
2
Centre for Social Responsibility in Mining, Sustainable Minerals Institute, University of Queensland, Brisbane 4072, Australia
*
Authors to whom correspondence should be addressed.
Water 2020, 12(11), 3191; https://doi.org/10.3390/w12113191
Submission received: 21 October 2020 / Revised: 11 November 2020 / Accepted: 12 November 2020 / Published: 14 November 2020
(This article belongs to the Section Water Resources Management, Policy and Governance)

Abstract

:
The concepts of resilience and livelihood resilience are growing in prominence with water resource development that aims to measure and build resilience to specific disturbances and shocks. However, practical frameworks to measure livelihood resilience are needed, not just a theoretical framework. In this paper, we introduce the livelihood resilience measurement (LRM) framework, which draws on Hooke’s law; use the state vector method to calculate livelihood resilience scores; and test the effectiveness of the method by correlation analysis. We illustrate the framework by using it to measure livelihood resilience in Henan Province, China, and assess the strategies that build livelihood resilience. The advantages and limitations of the framework are explored and discussed by drawing on empirical examples. Besides illustrating how to apply the LRM framework in a practical case, we discuss how to communicate with stakeholders to identify and strengthen the factors that build resilience. In this study, land ownership, housing and property value, and emergency cost are the most significant of these factors. Thus, the LRM framework has the potential to help reservoir-affected families protect their livelihood capital and to help governments improve social welfare. It can thus serve as a tool for monitoring and improving the effectiveness of policies and practices aimed at building livelihood resilience.

1. Introduction

The Sustainable Development Goal 6.5 proposed by the United Nations is to implement integrated water resources management at all levels by 2030, including cross-border cooperation as appropriate [1]. This shows that countries all over the world attach great importance to the development and utilization of water resources and promote the construction of large-scale water conservancy infrastructure, such as large dams, large hydropower stations, and extensive irrigation networks [2]. The construction of water conservancy facilities not only controls and manages water resources, but also affects national policies and plans. It is vital to the development of the nation, society, and people [3]. For example, the construction of the Logan Dam in Tajikistan can enhance the people’s sense of national identity and patriotism and is also conducive to social unity and stability [4]. In Turkey, water resources development is considered a strategic tool to achieve food and energy security, as well as a strategic tool to strengthen domestic peace and stability and foreign influence [5]. However, the development of water resources also brings about water politics issues, which will affect the results of interactions, conflicts, and cooperative relations between the actors involved [6]. Although water infrastructure projects can help regulate and utilize hydropower resources [7], they often involve displacing and resettling local people. For example, in China, most of the groups forced to resettlement due to the water conservancy projects live in economically underdeveloped areas with low productivity and weak livelihood capital. Moreover, their livelihood can be changed as a consequence of the restructuring of economic activities resulting from displacement [8]. Not only can they not reasonably share the benefits of water resources development, but they may fall into poverty [9]. We usually call the families who are forced to leave their original residence due to the construction of water conservancy projects and are resettled to the new resettlement sites for production and living as “reservoir-affected families” (RAFs) [10,11].
Existing studies focus more on the RAFs’ vulnerability, displacement-induced problems, and the development results after resettlement [12,13], rather than their performance and ability to deal with risks during relocation. We summarized the holes in existing research: First, the RAFs’ ability to be aware of and respond to risks is neglected. Many studies only consider vulnerability of livelihoods [14,15,16]. This vulnerability represents the possibility that livelihoods will be damaged in the future, without considering the possibility of early warning and adjustment [17]. Second, the meaning of resistance and adaptation are confused. Resistance focuses on the RAFs’ action to facing risks based on their situation, but adaptation is a long-term process. In this process, RAFs will receive attention and help from the outside world, which provides them more learning opportunities and resources [18,19,20]. Therefore, the results of adaptation do not fully represent the ability of RAFs to resist risks. Finally, the study of sustainable livelihoods focuses more on livelihood capital and livelihood strategies [21,22], without delving into livelihood behavior and livelihood ability to deal with risks in the short term. In summary, the existing research on the short-term responsiveness and resistance of RAFs when facing risks is insufficient. Therefore, this article pays attention to the performance and ability of RAFs to respond to and resist risks and maintain livelihoods during the relocation period, so as to fill the gaps in existing research.
Resilience research has become a focus of the international development agenda and an essential criterion for measuring the development potential of individuals or regions [23]. We argue that combining resilience thinking with livelihood issues can help us assess RAFs’ ability to cope with external pressures and threats, as well as to return to the steady state of livelihood [24,25,26,27]. Especially for RAFs in China, they are mainly affected by the forced relocation policy and need to be resettled to villages or towns original residence. Generally speaking, excluding the influence of natural disasters and other irresistible factors, the major challenge for Chinese RAFs is whether they can resist risks and resume as soon as possible to maintain their livelihoods when their livelihood activities are forcibly suspended and their livelihood strategies are forced to change.
The development of the research on resilience since 1970 can be divided into five stages [28]. In the 1970s, researchers studied resilience from the perspective of energy. The concept originated in the field of materials; in physics it represents the ability to store energy [29]; in engineering it is called flexural elasticity [30]. By extension, in ecology, it was considered to have the characteristics of persistence, absorption, and maintenance [31]. Resilience was related to the meaning of persistence and absorption. In the 1980s, the focus of resilience research shifted to recovery; that is, the specific behavior of the research object during the recovery process. Resilience at this stage included the characteristics of coping, learning, rebounding, and restoring balance [32]. Resilience meant bouncing back and returning to equilibrium. In the 1990s, researchers deeply analyzed the root causes of resilience, including resilience structure, active response, self-organization, and endogenous changes. Now resilience meant prevention, anticipation, and adaptation [19]. Prevention measures can reduce or minimize the scale or severity of the disaster impact [33,34]; anticipation represents early warning and active response; and adaptation, which had gradually become one of the core concepts, is the ability to cope with stressors [35,36]. In the 2000s, resilience researchers followed the logic of complex system evolution. That is, they believed that research methods should go beyond linear and causal relationships and focus on multilevel changes in complex systems [37]. Resilience was related to flexibility, rebound, and transformation. In the 2010s, we are encouraged to use innovative ideas to explore the development of resilience. Resilience gradually evolved into a neoliberal construct. That is, when the system is in an unstable state and exceeds the level of self-organization, it will develop in a new direction [28,38].
Thus, there are two main ways to understand resilience: some research describes it as an ability or capacity; other research regards it as an attribute. Capacity refers to the possible actions and effects of individuals or systems to solve disaster problems [28]. Resilience as an ability can be used to describe the whole process of an individual or system responding to, recovering from, and learning from a disturbance and even adapting to its new environment [39,40]. However, some sociologists have also emphasized the importance of unique processes such as adaptation and transformation [41], and these processes can be regarded as inconsistent with the notion of resilience as “bouncing back”. Therefore, Holling proposed that resilience, potential, and connectedness are the three attributes, which shape the adaptive cycle and the future state of a system [42]. On the other hand, Walker believed that resilience, adaptability, and transformability were the three attributes of social-ecological systems which would jointly determine the direction of future evolution of the system [43]. Resilience reflects performance in maintaining function, structure, characteristics and feedback. Adaptability is the capacity of actors in the system to manage resilience, and transformability means fundamental change [44]. We concluded that there are still some difficulties in measuring livelihood resilience [45]: The theoretical frameworks of livelihood resilience based on the researcher’s experience and knowledge are subjective and one-sided; it is difficult to determine the determinants and structural effects of livelihood resilience [46], and research has trouble identifying the dynamic results of livelihood resilience [47].
Still, researchers are continually enriching the concept of resilience [47,48,49] and have changed their assumptions about resilience from abstraction to an accurate reflection of how resilience can be realized in practice [9,23,28,50]. Based on the above research trends, this article pays attention to how microsocial systems respond to risks, especially the RAFs’ livelihood system, which is an open, dynamic, and complex system. In their livelihood systems, households have the ability to adjust behaviors and adopt strategies to cope with the external disturbance [51,52]. Therefore, we assume that resilience is one of the attributes of the RAFs’ livelihood system, but we also put clearer bounds on resilience. First, resilience is not the opposite of vulnerability. Vulnerability emphasizes the characteristics of susceptible and unsustainable, while resilience research takes into account the system’s response, which transforms passive acceptance of crisis into active response to change [17]. Second, the elements of resilience do not include adaptability and transformability; resilience takes precedence over adaptability and transformability in the stage of responding and resisting risks [49]. Finally, we take it that learning, organizing, and resourcefulness are inherent capabilities of the system and thus are only used as inputs to realize resilience, not as part of the resilience framework [28]. Resilience is very important in describing the performance of individuals or groups in coping with risks, and there is an urgent need for practical methods to measure it [40,46,53,54,55].
To sum up, on the basis of existing research, this article introduces a fresh look at definitions of livelihood resilience and its measurement. Specifically, this article uses “livelihood resilience” for the first time to analyze the performance of the RAFs’ livelihood system in responding, resisting, and absorbing risks during relocation and resettlement and proposes an operable and verifiable quantitative method to measure their livelihood resilience— the livelihood resilience measurement (LRM) framework, which draws on Hooke’s law, uses the state vector method to measure livelihood resilience scores, and uses examples to test and analyze the model. This research has two contributions to the current literature: (1) In terms of theoretical research, this study innovates the research perspective and evaluation method of livelihood resilience. It has used the principles of dealing with complex nonlinear problems in physics and applied them to the analysis and measurement of livelihood resilience. (2) In terms of practical application, we believe that by analyzing RAFs’ livelihood resilience, their response to risks can be estimated in advance, which is vital in identifying susceptible families before resettlement and in putting forward reasonable policies and practical suggestions to help them build livelihood resilience
Therefore, this article focuses on three questions: (1) What is the definition of RAFs’ livelihood resilience, and how does it function in the livelihood system? (2) How to quantitatively assess the RAFs’ livelihood resilience? (3) What are the key factors that have a significant impact on livelihoods resilience among the internal elements of the livelihood system. Four sections follow this introduction. Section 2 introduces the livelihood resilience measurement framework. Section 3 explains the data sources and methods. Section 4 presents the results. Section 5 discusses the advantages and limitations of the model, and the effects of livelihood capital, livelihood transfer and livelihood buffer on livelihood resilience. Section 6 concludes with implications for policy and practice.

2. The Livelihood Resilience Measurement (LRM) Framework

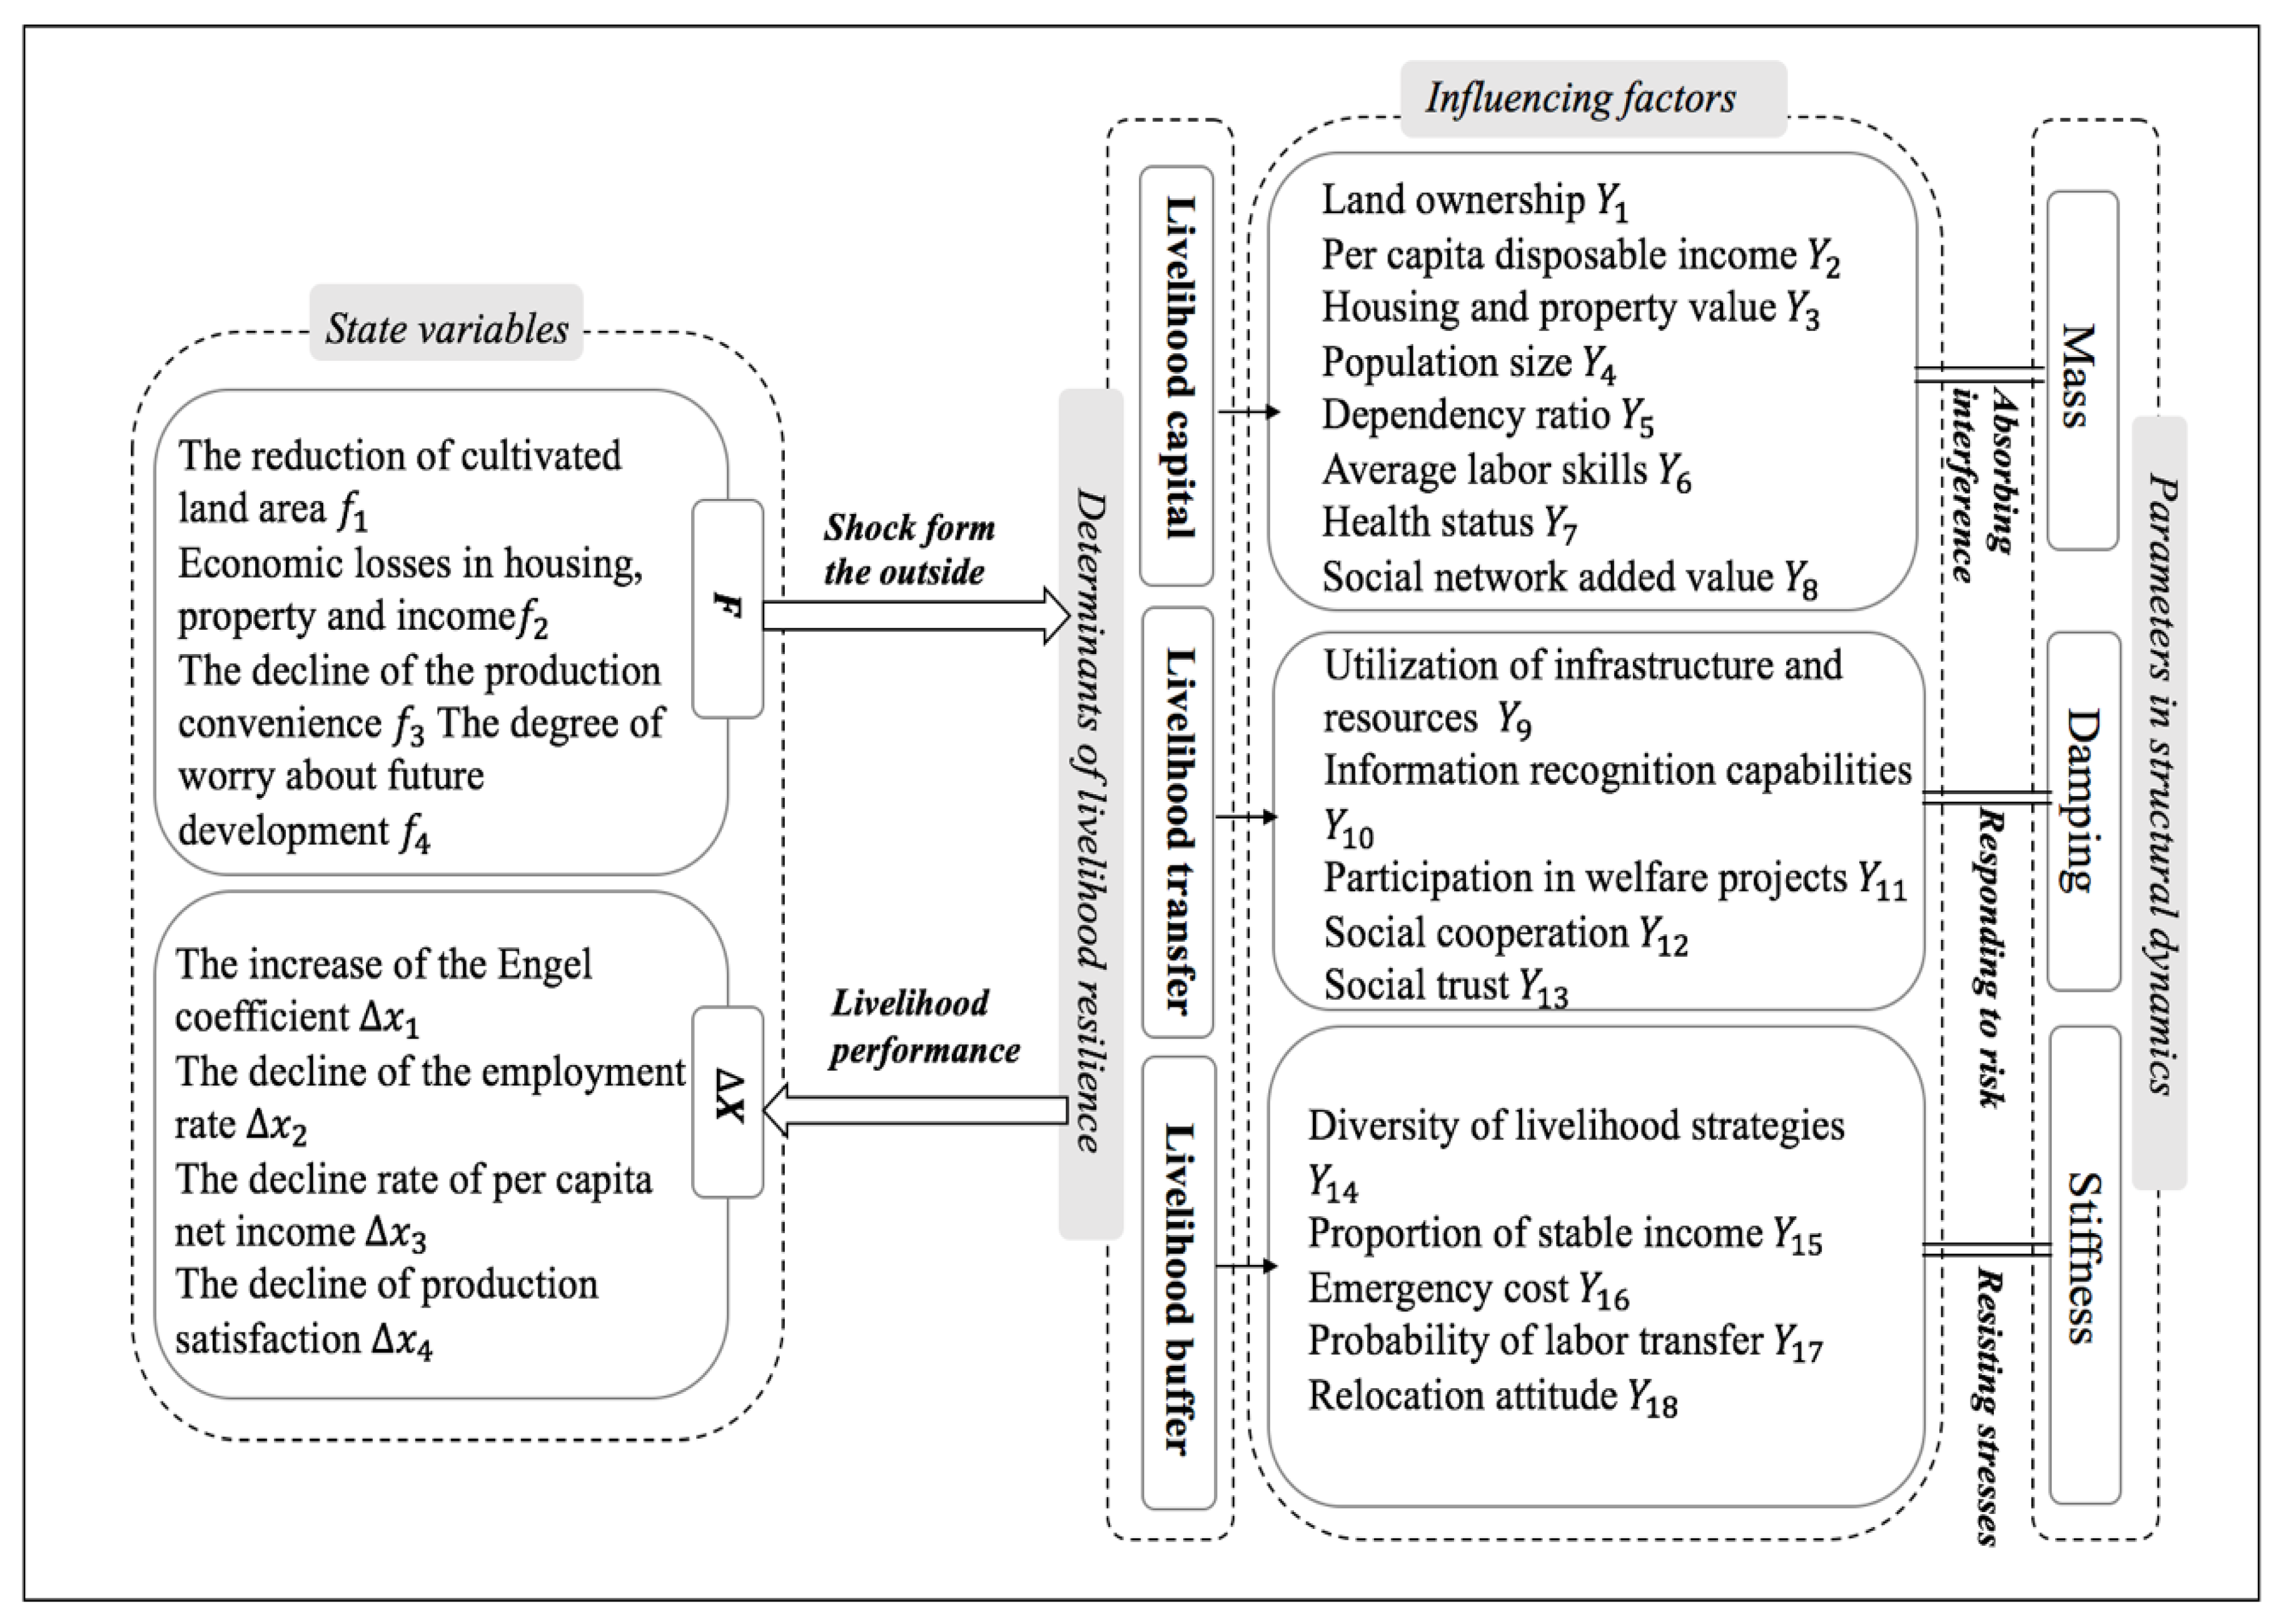
2.1. Theoretical Framework

As mentioned above, some scholars have realized the importance of the unique processes of adaptation and transformation, and these processes are regarded as inconsistent with the process of resistance and recovery [41,44]. Yarveisy et al. (2020) pointed out that adaptation is seen as an independent capability of the system, not as part of the absorption or recovery process [56], and the challenge in the actual situation is how to determine the period of each process. Unlike many current quantitative research efforts, this paper combines with the actual situation of RAFs in China and provides a fresh look at the research boundaries and definition of livelihood resilience.
We assume that the RAFs began to relocate at T 1 and completed their relocation at T 2 . Before the relocation, the RAFs’ livelihood was at the initial development stage ( T 0 ~ T 1 ). The involuntary relocation is a policy intervention in the form of an external shock ( F in Figure 1), so RAFs face problems such as reduction of land area, loss of production places, and the suspension or unemployment of workers [9,57]. Livelihood activities are therefore suspended or changed, and livelihood capital is lost. During the relocation, they need to rely on their own ability to weather risks, and their livelihood level is reduced ( Δ X in Figure 1). That is, RAFs are in the response and resistance stage, where the inherent resilience of their livelihood system takes priority effort ( Δ T in Figure 1). After the relocation, they rebuild their livelihood systems with external help and support, such as community activities, welfare policies, and financial assistance. This is the adaptation or transformation stage (after T 2 ). The whole process is sketched in Figure 1.
This article focuses on the RAFs’ performance in the response and resistance stage. At this stage, there are external forces acting on each RAFs’ livelihood system, the system is changed. For this we use the analogy of the Hooke’s law, which is a basic element of mechanical elasticity theory. Hooke’s law states that within the limits of elasticity, the deformation of an object is proportional to the external force that causes the deformation [58]:
F = k Δ x ,
where k is the elastic coefficient, which is determined only by the nature of the material [59]. The tensile (compression) properties of an object per Hooke’s law are similar to the characteristics of individual response and resistance to risks in social science issues. Thus, we consider livelihood resilience as one of the properties of the livelihood system: its resistance to alteration. This definition builds on early socio-ecological concepts of resilience, centered on the ability of the system to maintain core functions in the presence of threats [31,60]. Therefore, we define livelihood resilience as an attribute of the livelihood system that characterizes the capacity of RAFs in responding to, absorbing, and resisting risks and maintaining their livelihoods under the impact of forced resettlement. That is, livelihood resilience reflects the short-term actions of RAFs to resist risks, rather than long-term adaptation or transformation after their relocation.

2.2. Model Framework

The significance of Hooke’s law is that it has created an important research method that can linearly simplify the complex nonlinear phenomena in the real world [58]. Therefore, it seems logical to model livelihood resilience on Hooke’s law. That is, livelihood resilience is positively correlated with the size of the external shock and negatively correlated with the magnitude of the decline in livelihood.
However, the livelihood recovery mechanism after the shock are more complicated than simple physical phenomena, it is difficult to explain or measure the interaction relationship of the internal elements of the livelihood system with a single indicator. We establish the concept of the spatial state of the livelihood system and use the state vectors to describe the state and change of the independent variables in the livelihood system [61,62]. The state vector is a set of variables describing the dynamic behavior of the system and the state of the system at a specific moment. Let x 1 ( t ) , x 2 ( t ) , , x n ( t ) be a set of state variables of the system. Then the state vector has this set of state variables as components [63]:
x ( t ) = [ x 1 ( t ) ,     x 2 ( t ) ,     ,   x n ( t ) ] T ,
The LRM model is constructed as follows:
F = K · Δ X ,
[ f 1 f 2 f n ] = [ k 11 k 21 k 12 k 22 k 1 m k 2 m k n 1 k n 2 k n m ] · [ Δ x 1 Δ x 2 Δ x m ] ,
where F is the state vector of the impact on livelihood, Δ X is the state vector of the change of livelihood, and K is a matrix of size n × m. The matrix is a way to analyze the state of the system. The magnitude and direction of the change of the system state can be represented by the features of the matrix [46]. Thus, K is used to describe the status of the RAFs’ livelihood system in the response and resistance stage. By solving the matrix K , a series of variable relations can be converted into constants. Multiplying both sides of Equation (3) by K T , we get:
K T F = K T K · Δ X ,
Since Equations (3) and (5) have the same solution, the description of matrix K can be transformed into the measure of the square matrix K T K . The square matrix describes the state when the system is resisting, and the eigenvalue of the square matrix can reflect the speed of system movement or change. We use the maximum eigenvalue of the square matrix to characterize the measurement results of livelihood resilience (LR):
L R = λ max ( K T K ) ,

2.3. Indicator Selection

This article screens the indicators based on the following basic steps: First, we sort out relevant literature and list indicators related to the research question. Secondly, we screen and supplement the indicators based on the actual situation learned from the field survey. Then, we asked two Chinese experts (Kaiwen Yao and Dan Zhang) to score the indicators and remove the inconsistent indicators. Finally, we calculate the collinearity of the indicators to further screen out highly relevant indicators.

2.3.1. State Vector

According to the LRM framework, we need to construct two state vectors to describe the impact of the external stresses and the changes in the RAFs’ livelihoods. The state vectors describe the state of the system [58], so the selection of state variables must conform to the realization. Therefore, based on the facts of the reservoir affected resettlement in China, we conduct a comprehensive investigation and analysis of the various impacts and pressures on their families’ livelihoods, as well as the change of livelihood results shown by the families, to select specific indicators that can describe the state of RAFs’ livelihood system.
Although RAFs receive monetary compensation before relocation, their losses in terms of social adaptation and livelihood production cannot be quantified [58,64]. During the relocation period, RAFs’ livelihood capital is lost, livelihood strategies are forced to change, and livelihood capacity is limited. Forced relocation has a profound impact on RAFs’ primary livelihood, which is mainly reflected in the reduction of production places [65], the loss of financial and physical capital, the inconvenience of public services and welfare [66], and the decline of individual initiative to develop production [67]. Therefore, the state variables for the impact of the external stresses include reduction of cultivated land area; economic losses in housing, property, and income; decline in production convenience; and degree of worry about future development.
The changes in livelihood are the result of the interaction between external stresses and system resilience, mainly reflected in living standards and quality of life [68]. In light of the 12 indicators proposed by the Organization for Economic Co-operation and Development [69], we use food consumption level, employment rate, income, and expenditure as the measurement standards, based on the RAFs’ survey responses [57,58,70,71]. “Quality of life” is different from “living standard” and refers to the satisfaction of social needs [72]. The state variables for the change of livelihood (after versus before relocation) include increase of the Engel’s Coefficient, decline of the employment rate, decline rate of per capita net income, and decline of production satisfaction.

2.3.2. Influencing Factors

Hooke’s law states that the elasticity coefficient is determined only by the nature of material. In the same way, we focus on the internal structure and characteristics of family when we study the generation mechanism of livelihood resilience. In recent years, structural dynamics has been widely used as an essential tool for understanding complex social ecosystems [46]. Structural dynamics is a structural analysis method to study the dynamic response of the system and identifies structural effects through analysis of three parameters: mass, damping, and stiffness [73]. First, mass is a basic attribute of matter and exists in all physical systems [73]. The quality of the livelihood system is regarded as a collection of assets owned by the family and is the basis for supporting the evolution of the system [42,74,75]. Therefore, the various capitals stored in the livelihood system play a role in absorbing interference. The more capital stock, the greater the shocks the system can absorb. Second, damping is an inherent attribute of a material, which is derived from the internal resistance to movement between different layers of the material itself [73]. The damping of a livelihood system can be regarded as controlling the flexibility of the interaction between the components within the system and between the system and the external environment [42,76], which can promote the transformation and utilization of resources when the livelihood system responds to external risks. Third, stiffness makes a structure more rigid, which can reduce the effect of external forces [73]. The stiffness of a livelihood system can reduce the effect of external interference and help maintain the original state. The stiffness of the livelihood system is mainly determined by the structure of the system, which acts as a buffer. A more robust livelihood system can resist stress more effectively. In general, livelihood capital (corresponding to the mass matrix), livelihood transfer (corresponding to the damping matrix), and livelihood buffer (corresponding to the stiffness matrix) play the role of absorbing, responding to and resisting risks respectively, and they are the determinants of livelihood resilience.
In term of livelihood capital (corresponding to the mass matrix), we use livelihood capital to characterize the mass of the system, including natural capital, financial capital, physical capital, human capital, and social capital [77]. As in other studies, the indicators to quantify the system’s capital stock (land ownership, per capita disposable income, housing and property value, population size, dependency ratio, average labor skills, health status, and social network added value) are organized around these five categories [78,79,80,81].
In term of livelihood transfer (corresponding to the damping matrix), we focus on the RAFs’ ability to control their livelihood behaviors and use social welfare to support their livelihood when responding to risks. Specific quantitative indicators include utilization of infrastructure and resources, information recognition capabilities, participation in welfare projects, social cooperation, and social trust [47,82,83,84].
In term of livelihood buffer (corresponding to the stiffness matrix), we recognize the importance of system structure, because the livelihood system’s ability to resist risks is related to its structure [46,85]. Quantitative indicators include diversity of livelihood strategies, proportion of stable income, emergency cost, probability of labor transfer, and relocation attitude [86,87,88,89]. The LRM framework is shown in Figure 2, and Table 1 details the description of factors influencing livelihood resilience.

3. Material and Methods
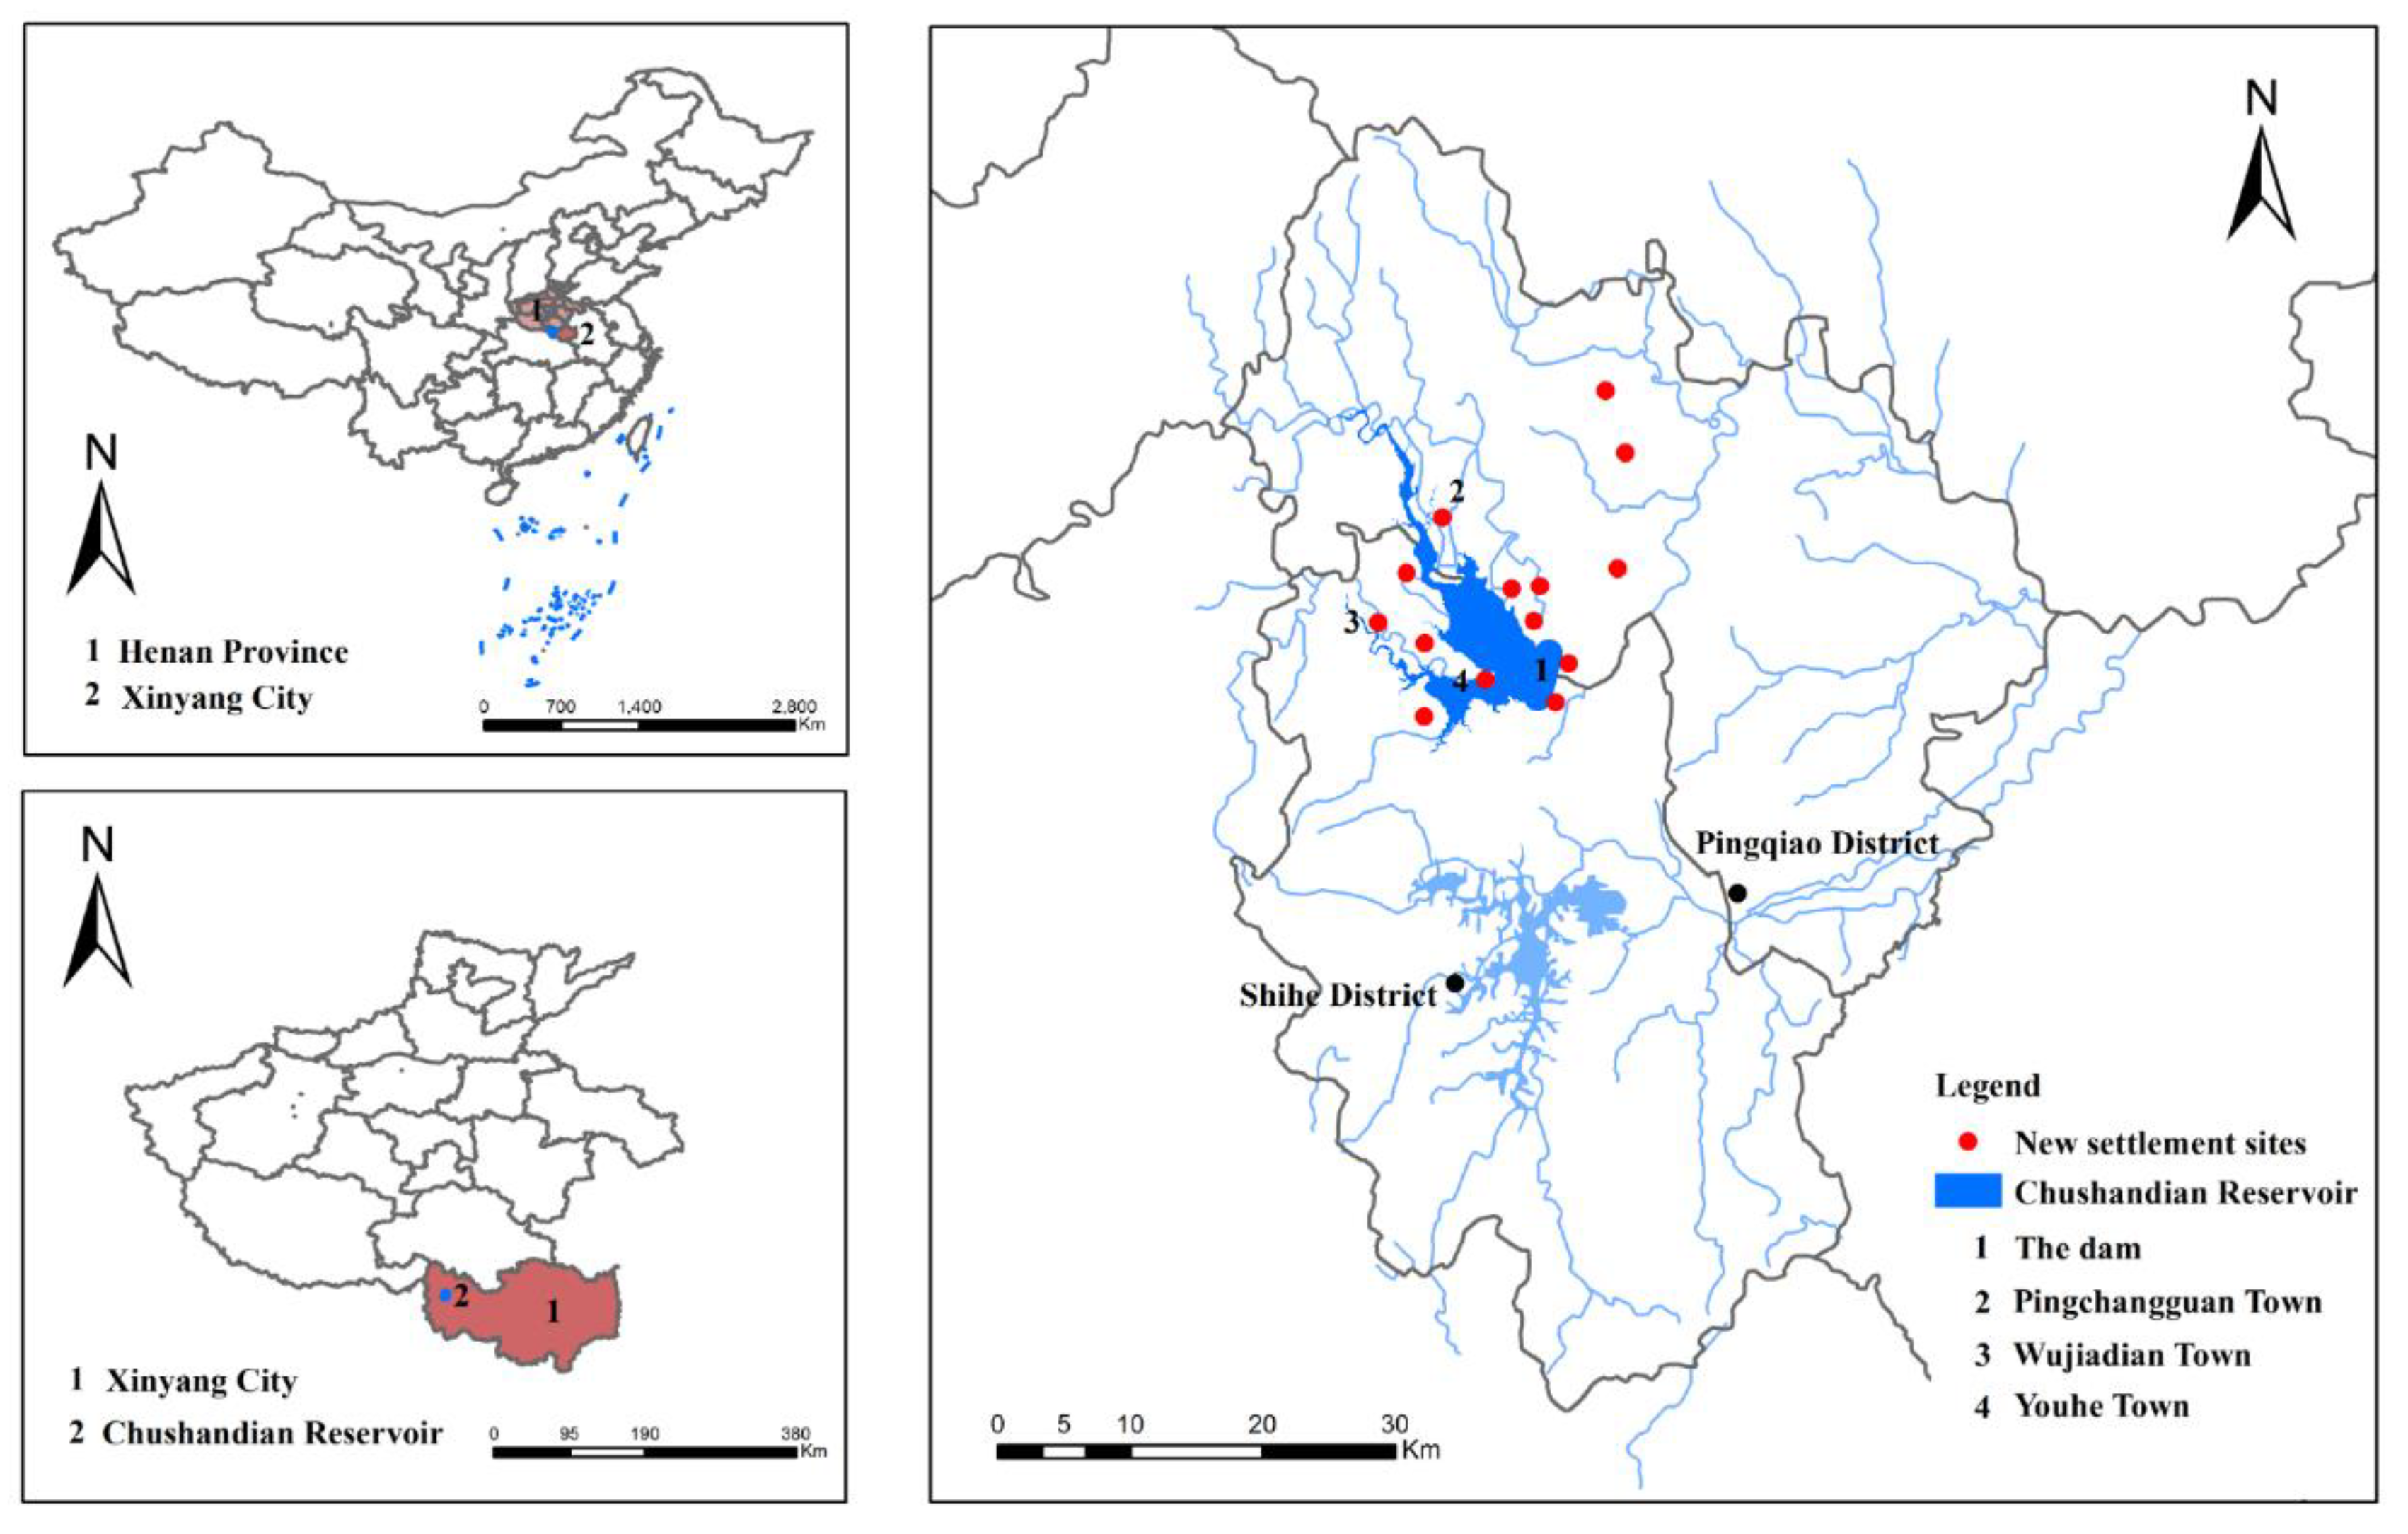
3.1. Study Area

This paper considers families relocated for the Chushandian Reservoir in Henan Province of China. In 2017 (the year before the relocation), the total population of Xinyang City was 8,805,300, and the urbanization rate is 46.05%. The annual GDP in 2017 was 222.655 billion yuan, and the structure of the primary, secondary and tertiary industries was 20.6: 38.8: 40.7. In 2017, the per capita disposable income of rural residents was 11,663 yuan, and the per capita consumption expenditure of rural residents was 8,972 yuan [90].
Chushandian Reservoir is a large-scale water conservancy project for flood control, water supply, irrigation, and power generation. The construction affected 39,170 people in 43 villages in 7 local townships. According to the guidance of the local government, people affected by the reservoir need to relocate from their original places to nearby villages or towns. Therefore, their social identity is still farmers, and their administrative area remains unchanged. In addition, the socio-economic conditions and natural environmental conditions of the resettlement sites have a smaller gap with the original residence. However, the project has had a significant impact on the livelihoods and lifestyle of these families (Figure 3).

3.2. Data Source

The data used in this study come from a special investigation by the research team. The team selected 14 villages as sample villages and conducted quantitative surveys of households selected by stratified random sampling, obtaining valid data on 307 RAFs before and after the relocation (from 2017 to 2019). The questionnaire mainly solicited basic information on the families, their production activities, income and consumption, and welfare. Before relocation, there were 1585 people in these 307 households. Respondents’ average working years was 7.4 years; the average household had 5.2 members; the average dependency ratio was 0.76; the average cultivated area was 7.6 hectares; and disposable income was 11,743 yuan per capita. In the local area, most of the elderly were farming at home and they mainly planted rice, and young people were more likely to work in economically developed cities. According to the survey data, these 307 households’ agricultural income accounted for 30.8% of the total income, their wage income accounted for 64.8% of the total income and 4.3% of other income. In general, these 307 households’ production efficiency is lower, and their incomes are not stable enough.
To analyze the livelihood resilience of different groups of RAFs, we classify households as follows. (1) In terms of income composition, the Chinese Ministry of Agriculture divides families into pure peasants (for whom agricultural production provides more than 80% of household income), the first type of part-time farmers (50–80% of household income), the second type of part-time farmers (20–50% of household income), and pure non-farming households (less than 20% of household income) [11]. (2) The location of resettlement is classified as near a village (rural) or in a town (urban). (3) Engel’s coefficient is the ratio of total food expenditure to total personal consumption expenditure [91]. According to the criteria proposed by the FAO (2001), households can be divided into poorer (Engel’s coefficient over 59%), poor (50–59%), rich (40–50%), richer (30–40%), and wealthy (under 30%).

3.3. Calculation Procedures

According to the LRM framework, the practical procedures for quantitatively assessing RAFs’ livelihood resilience are divided into the following four steps.
Step 1: non-dimensional indicators. Deviation normalization method is used for data processing, in order to eliminate the effect of the dimension and variance of each state variable and indicators and improve the comparability of different variables and indicators [46].
Step 2: constructing the state vectors. Based on the state variables selected above, we constructed the state vectors of 307 RAFs, including the state vector of the impact on livelihood ( F ) and the state vector of the change of livelihood ( Δ X ) of each family.
Step 3: measuring results of RAFs’ livelihood resilience. According to Equations (3) and (6), the maximum eigenvalue of the K T K matrix can be calculated by Matlab software, so we can obtain the livelihood resilience scores of 307 RAFs.
Step 4: estimating the contribution of influencing factors to livelihood resilience. Taking livelihood resilience scores as dependent variable and using the 18 indicators in Table 1 as independent variables, we carry out multiple linear regression analysis to further explore the influencing factors that have significant contribution to the livelihood resilience. The standardized coefficients and significance are regarded as the basis for judging the contribution of indicators.
L R = α 1 Y 1 + α 2 Y 2   + +   α n Y n ,
where, α n is the standardized coefficient.

4. Results

4.1. Descriptive Statistics

The survey data and the classification criteria mentioned above give us the following basic information on the 307 surveyed RAFs. Forty-two (14%) of the families are pure peasants, 31 (10%) the first type of part-time farmers, 110 (36%) the second type of part-time farmers, and 124 (40%) pure non-farming households; 199 households (65%) resettled in a town and 108 (35%) in a village, and there were 15 poorer households (5%), 86 poor (28%), 150 rich (49%), 56 richer ones (18%), and no wealthy ones. Thus, pure non-farming households, rich households, and households who chose to be resettled in a town are prominent in the total sample, indicating strong local urbanization.

4.2. The Livelihood Resilience scores

We used MATLAB software to program and calculate (based on the equation of the LRM framework) livelihood resilience scores for the 307 RAFs, representing their relative livelihood resilience within the group. Per our assumptions, families with high scores have greater livelihood resilience. The highest score in the sample was 1.8252, and the lowest was 0.0662. The difference between the mean and the median is small, indicating that the concentration of the data is acceptable. The skewness is 0.4993, so the peak of the data distribution shifts in the direction of lower livelihood resilience. The kurtosis is 0.3783, indicating that there are fewer extreme data. The probability density curve is narrowly distributed, and the probability of scores between 0.6 and 0.7 is high, indicating that the livelihood resilience of the 307 RAFs is uneven, but the degree of differentiation is not serious (Figure 4).
Grouping the families according to livelihood strategies, resettlement locations, and living standards as described above, we find that the groups vary greatly in livelihood resilience scores and show some heterogeneity (Figure 5).
The variation in livelihood resilience scores of pure peasants is wider than that of the other three livelihood types (Figure 5a). Comparing the average scores of the four types, the groups with higher proportions of agricultural income have higher scores, suggesting that livelihood strategy has an impact on livelihood resilience. Moreover, the effects of relocation on RAFs’ agricultural production will be timely compensated. Non-agricultural work is less stable, so it is difficult to maintain during relocation or resume quickly after.
There is little difference in scores between town and village settlers (Figure 5b). That is, the environment of the resettlement sites does not affect the strength of RAFs’ livelihood resilience.
Households with higher living standards have lower median livelihood resilience scores (Figure 5c). That shows that RAFs’ living standards do not completely determine their livelihood resilience. This is probably because families with higher living standards have more trouble maintaining them through the transition.

4.3. Correlation Analysis

It is important to assess how successful our model is in measuring livelihood resilience. As a check, we consider the correlation between our livelihood resilience score, the overall livelihood capital index [81], and the subjective self-evaluated resilience score (SERS) [72,92].
(1)
Correlation with the livelihood capital index
The sustainable livelihood framework is a tool to help people understand their livelihood problems. Many scholars regard sustainable livelihood capital as the basis for quantitative analysis of livelihood resilience or as a tool for constructing an indicator framework [26,81,93,94]. Here we use the household livelihood resilience approach, with the equal weight method [81,95], to calculate the overall livelihood capital index of 307 RAFs before relocation (Table 2). Correlation of this measure with our livelihood resistance score is significant (the coefficient is 0.450).
(2)
Correlation with subjective self-evaluated resilience
To understand the true resilience, it is also necessary to track changes in happiness over time and solicit people’s judgment on the resilience of the family’s livelihood [72]. In the subjective self-evaluated resilience score (SERS) method, respondents evaluate their families through a series of ability-related questions, and researchers can choose any combination of capabilities according to a specific background. We select six capabilities for our survey of RAFs (Table 3). To ensure the simplicity and transparency of the calculation, answers to the six questions are scaled to a range of 1 to 5 (five-valued), and an average weighted score is calculated. Then we compare our livelihood resilience score with the SERS and find a significant correlation (the coefficient is 0.581).
In summary, the livelihood resilience scores obtained in this paper are comparable to the results from two other methods, and the coefficients indicate that it is true and effective to use the LRM framework to measure livelihood resilience.

4.4. Multiple Linear Regression Analysis

Based on multiple regression analysis, we calculated the goodness-of-fit R2 is 0.780, and the overall goodness of fit and prediction accuracy are good. The F statistic is 73.785, which passes the significance test (1% statistical level). The expansion factor test shows no multicollinearity between independent variables (Table 4). Statistical tests show no effect on livelihood resilience of social network added value, per capita disposable income, dependency ratio, or health status of the family. The other 14 indicators are all significant at 1%. Land ownership, house and property value (livelihood capital), social cooperation, participation in welfare projects (livelihood transfer), emergency cost, and relocation attitude (livelihood buffer) are the indicators that have the most impact, collectively contributing to more than 60% of the RAFs’ livelihood resilience (Figure 6).

5. Discussion

This paper proposes a model of livelihood resilience based on Hooke’s law and illustrates the measurement process using survey data on 307 relocation-affected households from the Chushandian Reservoir in China. This section will further discuss the feasibility of the method and the effects of livelihood strategies on livelihood resilience.

5.1. Implications of Livelihood Strategies for Livelihood Resilience

5.1.1. Which Capital Stocks Are Playing a role in Absorbing Risks?

At the livelihood capital level, we find that natural and physical capital are more important in absorbing risks during the relocation period than other types of capital. The largest contributing factor, land ownership, has a significant positive impact on livelihood resilience. Land has not only economic value but also pension value for rural residents [96]. For the RAFs in rural areas, the availability of natural resources determines the accumulation of original livelihood capital [97]. Moreover, families with more land get more compensation for land acquisition, which can help them smoothly negotiate the transition period, in which their livelihood activities are suspended or forced to change, and help them reinvest in new methods of production as soon as possible.
These results are also consistent with the conclusion in Section 4.2, which further illustrates that agricultural resources are the basis for RAFs’ livelihood transformation in the context of urbanization and aging. House and property value also has an important impact on livelihood resilience. There are substitution effects and complementary effects between physical capital and other capital [97], so higher values of housing and property can provide more backup options for RAFs to maintain their livelihood over a short time. In summary, both physical capital and natural capital can serve as a buffer for RAFs.
Both family size and average labor skills have significant negative effects on livelihood resilience, but both effects are small. This shows that family size does not bring the ideal demographic dividend [98]; a family with a simple population structure can adjust its livelihood strategies more flexibly to deal with the change, and work experience, especially skills in agricultural production, has a restraining effect on the timely adjustment of production mode. Therefore, the local government needs to make every effort to protect the livelihood capital of RAFs from loss, and especially to provide adequate compensation for land and houses. At the same time, we should recognize the long-term economic, environmental, and social costs of reduced land resources, and suggest that the central and local governments need to take further actions and make plans to support RAFs in upgrading their livelihood strategies.
Surprisingly, we find that per capita disposable income and demographic characteristics have no significant impact on livelihood resilience, in contrast to previous studies [99,100]. Although families with greater incomes have more initiative in consumption and investment, this does not guarantee that RAFs can quickly resume their livelihood activities or maintain their livelihood unaffected. Moreover, China’s social security system has gradually improved, which has weakened the impact of family demographic characteristics (including dependency ratio and health status) on livelihoods.

5.1.2. Who Determines the Connectivity of the System and the Transformation of Livelihoods?

At the livelihood transfer level, we find that participation in welfare projects, social trust, information recognition capabilities, and utilization of infrastructure and resources have significant positive effects on livelihood resilience, indicating that effective organization, learning and decision-making can help RAFs respond to risks in time, and also help them make full use of external resources to ensure the development of livelihood activities. Specifically, families with high participation in welfare programs have more channels through which to get livelihood support, which also helps transform social and economic welfare into a boost for production. Social trust expresses the reciprocal way strong social networks and broad social relationships can improve RAFs’ livelihood resilience [101]. Information recognition capabilities are the RAFs’ understanding of and response to relocation policies, which are mainly reflected in their choices of compensation packages and resettlement locations. Families who can make correct decisions generally have adequate preparation and plans for future development [65], and utilization of infrastructure and resources is reflected in the use of local infrastructure, natural resources, and social services by RAFs, which is more conducive to the transformation of external resources into livelihood capital [46]. However, social cooperation has a significant negative effect on livelihood resilience. In China’s rural areas, although most village cadres hold more active power relations in the village collective, they also rely on the local social relations and social order before relocation, but their positions do not bring more policy dividends to families. Therefore, the government should strengthen the communication of policy to help RAFs make decisions to adapt to future development, and it should also improve local welfare by providing RAFs a basic guarantee of livelihood and more opportunities for RAFs to participate in welfare projects, to reduce their cost of restoring production and life.

5.1.3. What Is the Key Factor for Buffering?

At the livelihood buffer level, we find that the ability and attitude to flexibly adjust livelihood strategies are important in resisting risks. Emergency cost has a significant negative effect, which means that the more funds the RAF needs to restart livelihood activities, the more difficult it is to restore their livelihood. Relocation attitude, diversity of livelihood strategies, proportion of stable income, and probability of labor transfer also have significant positive effects on livelihood resilience. Relocation attitude refers to the psychological acceptability to RAFs of changing their production methods and lifestyle. The higher the expectation for future development and the less constraint from the customs of the original residence, the stronger the subjective initiative of family members to develop production. Diversified livelihoods are useful in timely adjusting livelihood strategies. The proportion of stable income is income that is not affected by relocation, so it improves the robustness of RAFs’ livelihood [98]; the higher the proportion, the higher the efficiency of recovery. The higher the probability of labor transfer, the less likely it is that workers will be unemployed after relocation, so such families can adjust their livelihood strategies as soon as possible. Therefore, the government should provide skills training courses and employment opportunities for workers, which can help RAFs improve their income and living standards by improving production efficiency. The government should also attach importance to financial incentives, career development, and personal recognition and appreciation [46].

5.2. Advantages of the LRM Framework

First, the LRM framework provides a fresh look at definitions of livelihood resilience and its measurement. After combing the literature, we can divide the concept of resilience into two categories: one is described as a capacity, referring to the dynamic process of subject or system recovery, self-improvement, adapting to the environment, or changing the environment [26,39,102,103]; the other is regarded as an attribute used to describe the performance of a system to absorb disturbance and reorganize while undergoing change, so as to still retain essentially the same function, structure, identity, and feedbacks [43]. Based on socio-ecological system theory, we infer that resilience is an attribute of the livelihood system and reflects the performance of affected families in responding to risk, absorbing interference, and restoring and maintaining livelihoods, during the stage of response and resistance. The idea of resilience emphasizes the active resistance and response of the system over vulnerability and adaptability [103,104]. The equation of the LRM framework inspired by Hooke’s law is logically consistent with the definition of livelihood resilience, and the solution of the equation can represent the response and resistance characteristics of the system itself.
Second, the LRM framework is an objective and practical method for the quantitative assessment of livelihood resilience, rather than a theoretical framework or indicator system. We use the state vector method to calculate livelihood resilience scores, which avoids the subjectivity of structural effect analysis. Taking the sample households of the Chushandian reservoir as an example, we can present the complete measurement procedures and calculation results. On the one hand, these scores can clarify that each family has a different performance in risk perception and livelihood change due to different livelihood resilience. On the other hand, the scores can be used as dependent variables in multiple regression analysis to identify the key factors that affect the resilience of RAFs. What’s more, we propose that livelihood capital, livelihood transfer, and livelihood buffer are the determinants of livelihood resilience and play a role in absorbing, responding to and resisting risks, respectively. The metrics proposed based on structural dynamics are explained and tested with the case study. Thus, this framework can be applied to the assessment of families’ livelihood resilience in a wider range of fields.
Third, the LRM framework can calculate the relative strength of families’ livelihood resilience within a group, and this result can be verified by correlation analysis with other subjective and objective resilience assessments. We calculated the livelihood resilience score of each family according to their situation before and after resettlement, and compared it with the overall livelihood capital index [81] and SERS [72], respectively, and the correlations were statistically significant. That shows that the method proposed in this paper is effective in the actual situation of the study area and that the calculation results are true and reliable.
Lastly, the LRM framework describes and evaluates the resilience of the livelihood system from the perspective of systems science. Many scholars call for the use of nonlinear methods to deal with complex social science problems from the systems perspective, to better understand the dynamic feedback, interaction, and evolution of the system [14,17,43,105]. This paper is inspired by physical methods to deal with complex systems science problems. Therefore, our livelihood resilience model is based on Hooke’s law and uses the state vector method to describe the state and change of variables in the system. To analyze the mechanism of livelihood resilience, we focus not on causal relationships but on the composition, institutions, and characteristics of the system based on the principle of structural dynamics.

6. Conclusions

This article proposes a method for assessing livelihood resilience. Taking 307 RAFs from the Chushandian Reservoir in China as an example, we defined and measured their livelihood resilience and identified factors that could improve it.
Our LRM framework is based on the idea of Hooke’s law and uses the state vector method to calculate livelihood resilience scores. Empirical analysis shows that RAFs with a higher proportion of agricultural income have higher average livelihood resilience. The correlation of our livelihood resilience scores with the overall livelihood capital index and with the subjective self-evaluated resilience score is 0.450 and 0.581, respectively, suggesting an accurate method. We find that land ownership, house and property value (parts of livelihood capital), social cooperation, participation in welfare projects (parts of livelihood transfer), emergency cost, and relocation attitude (parts of livelihood buffer) are the factors with the greatest impact on livelihood resilience. The framework could be applied to predict and classify the livelihood resilience of RAFs in wider range of fields. It could also help governments or organizations estimate RAFs’ livelihood resilience in advance and thus help them recover their livelihood as soon as possible.
The limitation of the research is that the factors proposed in this article as affecting livelihood resilience are limited. Based on structural dynamics, we used 18 influencing factors from the system’s livelihood capital, livelihood transfer, and livelihood buffer. However, due to the complexity of the livelihood system, there are many confounding factors in the system. Therefore, future research should focus on optimizing the indicators used in the multiple regression analysis to identify more suitable influencing factors and improve the accuracy of livelihood resilience assessment.

Author Contributions

Conceptualization, Y.G., R.Z., and K.Y.; data curation, Y.G., B.L., and F.W.; formal analysis, Y.G.; investigation, B.L. and F.W.; methodology, Y.G.; supervision, R.Z. and K.Y.; writing—original draft, Y.G.; writing—review and editing, R.Z. and K.Y. All authors have read and agreed to the published version of the manuscript.

Funding

There is no fund support for this study.

Acknowledgments

The authors thanks all the participants in the survey and seminar and thank Roy Sablosky for reading and editing the language of this article. We thank the anonymous reviewers for their comments, which helped us improve the article.

Conflicts of Interest

The authors declare no conflict of interest.

References

  1. Hussein, H.; Menga, F.; Greco, F. Monitoring transboundary water cooperation in sdg 6.5.2: How a critical hydropolitics approach can spot inequitable outcomes. Sustainability 2018, 10, 3640. [Google Scholar] [CrossRef] [Green Version]
  2. Hussein, H.; Conker, A.; Grandi, M. Small is beautiful but not trendy: Understanding the allure of big hydraulic works in the Euphrates-Tigris and Nile waterscapes. Mediterr. Politics 2020, 18, 1–24. [Google Scholar] [CrossRef]
  3. Menga, F.; Swyngedouw, E. Water. Technol. Nation State 2018, 2, 14–23. [Google Scholar]
  4. Menga, F. Building a nation through a dam: The case of Rogun in Tajikistan. Natl. Pap. 2015, 43, 479–494. [Google Scholar] [CrossRef]
  5. Conker, A.; Hussein, H. Hydraulic Mission at Home, Hydraulic Mission abroad? Examining Turkey’s Regional ‘Pax-Aquarum’ and Its Limits. Sustainability 2019, 11, 228. [Google Scholar] [CrossRef] [Green Version]
  6. Conker, A. An Enhanced notion of power for inter-state and transnational hydropolitics: An Analysis of Turkish-Syrian Water Relations and the Ilısu Dam Conflict between the Opponents and Proponents of the Dam. Am. J. Phys. Med. Rehabil. 2014, 94, 153–162. [Google Scholar]
  7. Annys, S.; Adgo, E.; Ghebreyohannes, T.; Van Passel, S.; Dessein, J.; Nyssen, J. Impacts of the hydropower-controlled Tana-Beles interbasin water transfer on downstream rural livelihoods (northwest Ethiopia). J. Hydrol. 2018, 569, 436–448. [Google Scholar] [CrossRef]
  8. Building Natural Disaster Response Capacity—Sound Workforce Strategies for Recovery and Reconstruction. Available online: http://ir.canterbury.ac.nz/bitstream/handle/10092/10481/12651073_apec-natural-disasters-workforce-project.pdf?sequence=1&isAllowed=y (accessed on 13 December 2018).
  9. Zhao, X.; Tian, Y.; Duan, Y.F. Research on the interventional poverty problem of reservoir migrants from the perspective of dual social change. Agricultural Economic Issues 2018, 20, 108–118. (In Chinese) [Google Scholar]
  10. Hasbullah, M.; Solle, M.S. Dam, project affected families, resettlement. Soc. Plast. Eng. 2013, 40, 1–10. [Google Scholar] [CrossRef]
  11. Gong, Y.; Yao, K.; Zhang, R.; Liu, B.; Wang, F. Rethinking livelihood resilience after development-induced displacement and resettlement: A case study of qianping reservoir. Int. J. Water Resour. Dev. 2020, 8, 1–24. [Google Scholar] [CrossRef]
  12. Li, B.; & Cao, S. Research on the problems and countermeasures of farmland transfer and livelihood restoration of reservoir immigrants—Based on the survey of 21 Danjiangkou reservoir resettlement villages in Hubei Province. Hubei Agric. Sci. 2017, 56, 3174–3178. (In Chinese) [Google Scholar]
  13. Zhang, C. Research on the restoration of living standards of reservoir rural migrants. Yangtze River 2017, 48, 97–100. (In Chinese) [Google Scholar]
  14. Folke, C.; Carpenter, S.; Elmqvist, T.; Gunderson, L.; Holling, C.S.; Walker, B. Resilience and sustainable development: Building adaptive capacity in a world of transformations. Ambio A J. Hum. Environ. 2002, 31, 437–440. [Google Scholar] [CrossRef] [PubMed]
  15. Carpenter, S.R.; Walker, B.L.E.; Anderies, J.M.; Abel, N. From metaphor to measurement: Resilience of what to what? Ecosystems 2001, 4, 765–781. [Google Scholar] [CrossRef]
  16. Bruneau, M.; Chang, S.E.; Eguchi, R.T.; Lee, G.C.; O’Rourke, T.D.; Reinhorn, A.M.; Shinozuka, M.; Tierney, K.; Wallace, W.A.; von Winterfeldt, D. A framework to quantitatively assess and enhance the seismic resilience of communities. Earthq. Spectra 2003, 19, 733–752. [Google Scholar] [CrossRef] [Green Version]
  17. Mavhura, E. Applying a systems-thinking approach to community resilience analysis using rural livelihoods: The case of Muzarabani district, Zimbabwe. Int. J. Disaster Risk Reduct. 2017, 25, 248–258. [Google Scholar] [CrossRef]
  18. Cooper, S.J.; Wheeler, T. Adaptive governance: Livelihood innovation for climate resilience in Uganda. Geoforum 2015, 65, 96–107. [Google Scholar] [CrossRef]
  19. Li, C.; Wang, L.; Kang, B.; Gao, M. Measurement of livelihood resilience of relocated farmers and analysis of influencing factors. J. Xi’an Jiaotong Univ. (Soc. Sci.) 2019, 39, 38–47. (In Chinese) [Google Scholar]
  20. Liu, J.; Wang, Y.; Dai, L. A Study on the influencing factors of the support participation degree of rural migrants in the Three Gorges Reservoir area based on the hierarchical regression model—Taking Fuling District of Chongqing as an example. Hubei Agric. Sci. 2019, 58, 188–192. (In Chinese) [Google Scholar]
  21. Li, W.; Shuai, C.; Shuai, Y.; Cheng, X.; Liu, Y.; Huang, F. How Livelihood Assets Contribute to Sustainable Development of Smallholder Farmers. J. Int. Dev. 2020, 32, 408–429. [Google Scholar] [CrossRef]
  22. Xu, D.; Ma, Z.; Deng, X.; Liu, Y.; Huang, K.; Zhou, W.; Yong, Z. Relationships between Land Management Scale and Livelihood Strategy Selection of Rural Households in China from the Perspective of Family Life Cycle. Land 2020, 9, 11. [Google Scholar] [CrossRef] [Green Version]
  23. Marchese, D.; Reynolds, E.; Bates, M.E.; Morgan, H.; Clark, S.S.; Linkov, I. Resilience and sustainability: Similarities and differences in environmental management applications. Sci. Total Environ. 2017, 613–614, 1275–1283. [Google Scholar] [CrossRef] [PubMed]
  24. Resilient Livelihoods-Disaster Risk Reduction for Food and Nutrition Security Framework Programme. Available online: http://www.fao.org/3/a-i3270e.pdf (accessed on 10 May 2019).
  25. Disaster Risk Reduction: Strengthening Livelihood Resilience. Available online: http://www.fao.org/docrep/018/i3325e/i3325e15.pdf (accessed on 28 January 2019).
  26. Thulstrup, A.W. Livelihood resilience and adaptive capacity: Tracing changes in household access to capital in Central Vietnam. World Dev. 2015, 74, 352–362. [Google Scholar] [CrossRef]
  27. Peng, S.P.; Shi, G.Q.; Zhang, R.L. Social stability risk assessment: Status, trends and prospects—A case of land acquisition and resettlement in the hydropower sector. Impact Assess. Proj. Apprais. Accepted, in press. [CrossRef]
  28. Manyena, S.B.; Machingura, F.; O’Keefe, P. Disaster resilience integrated framework for transformation (drift): A new approach to theorizing and operationalizing resilience. World Dev. 2019, 123, 104587. [Google Scholar] [CrossRef]
  29. Gordon, J. Structures; Penguin: London, UK, 1978; pp. 54–76. [Google Scholar]
  30. Pimm, S.L. The complexity and stability of ecosystems. Nature 1984, 307, 321–326. [Google Scholar] [CrossRef]
  31. Holling, C.S. Resilience and stability of ecological systems. Annu. Rev. Ecol. Syst. 1973, 4, 1–23. [Google Scholar] [CrossRef] [Green Version]
  32. Wildavsky, A. Searching for Safety; Transaction: Moncton, NB, Canada, 1989; pp. 74–91. [Google Scholar]
  33. Twigg, J. Good practice review disaster risk reduction. Disasters 2004, 44, 31–60. [Google Scholar]
  34. Nuttall, M. Anticipation, climate change, and movement in Greenland. Études/Inuit/Stud. 2010, 34, 21–37. [Google Scholar] [CrossRef] [Green Version]
  35. Managing the Risks of Extreme Events and Disasters to Advance Climate Change Adaptation (SREX). Available online: http://www.ipcc-wg2.gov/SREX/ (accessed on 9 March 2013).
  36. Whitney, C.K.; Bennett, N.J.; Ban, N.C.; Allison, E.H.; Armitage, D.; Blythe, J.L.; Yumagulova, L. Adaptive capacity: From assessment to action in coastal social-ecological systems. Ecol. Soc. 2017, 22, art22. [Google Scholar] [CrossRef] [Green Version]
  37. Jerneck, A.; Olsson, L. Adaptation and the poor: Development, resilience and transition. Clim. Policy 2008, 8, 170–182. [Google Scholar] [CrossRef]
  38. Jones, L.; Samman, E.; Vinck, P. Subjective measures of household resilience to climate variability and change: Insights from a nationally representative survey of Tanzania. Ecol. Soc. 2018, 23, 9. [Google Scholar] [CrossRef] [Green Version]
  39. Nyamwanza, A.M. Livelihood resilience and adaptive capacity: A critical conceptual review: Original research. Jàmbá J. Disaster Risk Stud. 2012, 4, 1–6. [Google Scholar] [CrossRef] [Green Version]
  40. Sina, D.; Chang-Richards, A.Y.; Wilkinson, S.; Potangaroa, R. A conceptual framework for measuring livelihood resilience: Relocation experience from Aceh, Indonesia. World Dev. 2019, 117, 253–265. [Google Scholar] [CrossRef]
  41. Miller, F.; Osbahr, H.; Boyd, E.; Thomalla, F.; Bharawani, S.; Ziervogel, G.; Hinkel, J. Resilience and vulnerability: Complementary or conflicting concepts? Ecol. Soc. 2010, 15, 1–25. [Google Scholar] [CrossRef]
  42. Holling, C.S. Understanding the Complexity of Economic, Ecological, and Social Systems. Ecosystems 2001, 4, 390–405. [Google Scholar] [CrossRef]
  43. Walker, B.H.; Holling, C.S.; Carpenter, S.S.R.; Kinzig, A. Resilience, adaptability and transformability in social–ecological systems. Ecol. Soc. 2014, 9. Available online: ftp://131.252.97.79/Transfer/WetlandsES/Articles/walker_04_socio-ecology_resilience.pdf (accessed on 16 March 2018). [CrossRef]
  44. Pelling, M. Adaptation to Climate Change: From Resilience to Transformation; Routledge: London, UK, 2011. [Google Scholar]
  45. Ingrisch, J.; Bahn, M. Towards a Comparable Quantification of Resilience. Trends Ecol. Evol. 2018, 33, 251–259. [Google Scholar] [CrossRef]
  46. Fang, Y.; Zhu, F.; Qiu, X.; Zhao, S. Effects of natural disasters on livelihood resilience of rural residents in Sichuan. Habitat Int. 2018, 76, 19–28. [Google Scholar] [CrossRef]
  47. Ifejika Speranza, C.; Wiesmann, U.; Rist, S. An indicator framework for assessing livelihood resilience in the context of social–ecological dynamics. Glob. Environ. Chang. 2014, 28, 109–119. [Google Scholar] [CrossRef]
  48. Adger, W.N. Social and ecological resilience: Are they related? Prog. Hum. Geogr. 2000, 24, 347–364. [Google Scholar] [CrossRef]
  49. Cutter, S.L. The landscape of disaster resilience indicators in the USA. Nat. Hazards 2016, 80, 741–758. [Google Scholar] [CrossRef]
  50. Manyena, S.B.; O’Brien, G.; O’Keefe, P.; Rose, J. Disaster resilience: A bounce back or bounce forward ability? Local Environ. 2011, 16, 417–424. [Google Scholar]
  51. Woods, D.D. Four concepts for resilience and the implications for the future of resilience engineering. Reliab. Eng. Syst. Saf. 2015, 141, 5–9. [Google Scholar] [CrossRef]
  52. Chen, J.; Yin, S.; Gebhardt, H.; Yang, X. Fanners’ livelihood adaptation to environmental change in an arid region: A case study of the minqin oasis, northwestern china. Ecol. Indic. 2018, 93, 411–423. [Google Scholar] [CrossRef]
  53. Walker, B.H.; Carpenter, S.; Anderies, J.; Abel, N.; Cumming, G.; Janssen, M.; Lebel, L.; Norberg, J.; Peterson, G.D.; Pritchard, R. Resilience Management in Social–Ecological Systems: A Working Hypothesis for a Participatory Approach. Conserv. Ecol. 2002, 6, 14. Available online: http://www.consecol.org/vol6/iss1/art14 (accessed on 12 May 2018). [CrossRef]
  54. Folke, C. Resilience: The emergence of a perspective for social–ecological systems analyses. Glob. Environ. Chang. 2006, 16, 253–267. [Google Scholar] [CrossRef]
  55. Barrett, C.B.; Constas, M.A. Toward a theory of resilience for international development applications. Proc. Natl. Acad. Ences USA 2014, 111, 14625–14630. [Google Scholar] [CrossRef] [Green Version]
  56. Yarveisy, R.; Gao, C.; Khan, F. A simple yet robust resilience assessment metrics. Reliab. Eng. Syst. Saf. 2020, 197, 106810. [Google Scholar] [CrossRef]
  57. Duan, Y.F.; Zhao, C.F. Reservoir resettlement urbanization resettlement model: Basic elements, institutional barriers and institutional arrangements. J. China Three Gorges Univ. (Humanit. Soc. Sci. Ed.) 2016, 38, 14–18. (In Chinese) [Google Scholar]
  58. Liu, H. Advanced Material Mechanics; Higher education press: Beijing, China, 1985; pp. 23–78. [Google Scholar]
  59. Zhu, X.; Su, C. Research on supply chain elasticity based on Hooke’s law. Logist. Technol. 2010, 11, 102–105. (In Chinese) [Google Scholar]
  60. Walker, B.H.; Ludwig, D.; Holling, C.S.; Peterman, R.M. Stability of semiarid savanna grazing systems. J. Ecol. 1981, 69, 473–498. [Google Scholar] [CrossRef]
  61. Stringham, T.K.; Krueger, W.C.; Shaver, P.L. State and transition modeling: An ecological process approach. J. Range Manag. 2003, 56, 106–113. [Google Scholar] [CrossRef]
  62. Yang, Q.; Meng, J.; Wang, X. Spatial evaluation and promotion strategy of ecotourism carrying capacity in the upper reaches of the Lijiang River based on multidimensional state space method. Acta Sci. Nat. Univ. Pekin. 2015, 51, 131–140. [Google Scholar] [CrossRef]
  63. Qi, Y. MATLAB realization of modern control theory. Electr. Autom. 2012, 34, 5–7. (In Chinese) [Google Scholar]
  64. Wu, S.; Shi, G. Institutional logic, practical dilemma and solutions to the benefits of reservoir resettlement sharing hydropower projects. J. Hohai Univ. (Philos. Soc. Sci.) 2018, 20, 45–51. (In Chinese) [Google Scholar]
  65. Peng, F.; Zhou, Y.; Li, Y. Study on Influencing Factors of livelihood risk of reservoir migrants. Stat. Decis. 2016, 6, 60–62. [Google Scholar] [CrossRef]
  66. Cemea, M.M. Involuntary Resettlement in Development Projects: Policy Guidelines in World Bank-Financed Projects; World Bank Publications: Washington, DC, USA, 1988. [Google Scholar]
  67. Collins, C. The Neighborhood as a Social Structure for Collective Action: The Role of Bonding Social Capital, Civic Engagement and Neighborhood Racial Homogeneity; Michigan State University: East Lansing, MI, USA, 2013. [Google Scholar]
  68. Karimi, S.; Taifur, W.D. Resettlement and development: A survey of two of Indonesia’s Koto Panjang resettlement villages. Int. J. Water Resour. Dev. 2013, 29, 35–49. [Google Scholar] [CrossRef]
  69. How’s Life? Measuring Well-Being, OECD Publishing. Available online: http://dx.doi.org/10.1787/9789264121164-en (accessed on 3 November 2019).
  70. Du, Y.S.; Li, F. Resettlement strategy for rural reservoir resettlement in the context of urbanization. Rural Econ. 2014, 06, 109–112. (In Chinese) [Google Scholar]
  71. Fan, Q.X.; Lu, Y.M.; Qiang, M.S.; Wang, H.H. Research on the resettlement methods of China’s hydropower development reservoirs from the perspective of sustainable development. J. Hydroelectr. Eng. 2015, 34, 237–244. (In Chinese) [Google Scholar]
  72. Lindsey, J.; d’Errico, M. Whose resilience matters? Like-for-like comparison of objective and subjective evaluations of resilience. World Dev. 2019, 124, 104632. [Google Scholar] [CrossRef]
  73. Zhou, J.X.; Yu, K.P. Structural Dynamics, 2nd ed.; Harbin Institute of Technology Press: Harbin, China, 2009; pp. 12–34. [Google Scholar]
  74. Berkes, F.; Colding, J.; Folke, C. Navigating Social-Ecological Systems: Building Resilience for Complexity and Change; Cambridge University Press: Cambridge, UK, 2003; Volume 9. [Google Scholar]
  75. Ifejika Speranza, C.; Kiteme, B.; Wiesmann, U. Droughts and famines: The underlying factors and the causal links among agro-pastoral households in semi-arid Makueni district, Kenya. Glob. Environ. Chang. 2008, 18, 220–233. [Google Scholar] [CrossRef]
  76. Adger, W.N. Vulnerability. Glob. Environ. Chang. 2006, 16, 268–281. [Google Scholar] [CrossRef]
  77. Defining Disaster Resilience: A DFID Approach Paper. London, UK, pp.1–20. Available online: https://www.gov.uk/government/publications/defining-disaster-resilience-a-dfid-approach-paper (accessed on 5 December 2018).
  78. Erenstein, O.; Hellin, J.; Chandna, P. Poverty mapping based on livelihood assets: Ameso-level application in the Indo-Gangetic Plains, India. Appl. Geogr. 2010, 30, 112–125. [Google Scholar] [CrossRef]
  79. Shi, G.; Wu, R.; Zhou, X. Implicit imbalance of rights and interests and its solution: The plight and outlet of reservoir migrant women. Soc. Sci. Yunnan 2018, 1, 149–156. (In Chinese) [Google Scholar]
  80. Yang, H.; Zhu, Z.; Wu, J. Practice of “soil based” agricultural resettlement in Xiaowan Hydropower Station. Yunnan Hydropower 2019, 35, 7–11. (In Chinese) [Google Scholar]
  81. Quandt, A. Measuring livelihood resilience: The Household Livelihood Resilience Approach (HLRA). World Dev. 2018, 107, 253–263. [Google Scholar] [CrossRef]
  82. Janssen, M.A.; Bodin, O.; Anderies, J.M.; Elmqvist, T.; Ernstson, H.; McAllister, R.R.J.; Olsson, P.; Ryan, P. A network perspective on the resilience of social– ecological systems. Ecol. Soc. 2006, 11, 1–15. [Google Scholar] [CrossRef] [Green Version]
  83. Li, X.; Kunnathur, A.S.; Ragu-Nathan, T.S.; Jitpaiboon, T. Development and Validation of Learning Capability Construct in IOS Supply Chain Network Context. In Proceedings of the Paper Presented at the Decision Sciences Institute 2008 Annual Meeting, Baltimore, Maryland, 20 October 2012; Available online: http://www.decisionsciences.org/Proceedings/DSI2008/docs/253-9820.pdf (accessed on 20 October 2012).
  84. Boillat, S.; Berkes, F. Perception and interpretation of climate change among Quechua farmers of Bolivia: Indigenous knowledge as a resource for adaptive capacity. Ecol. Soc. 2013, 18, 21. [Google Scholar] [CrossRef] [Green Version]
  85. Rist, S.; Chiddambaranathan, M.; Escobar, C.; Wiesmann, U. “It was Hard to Come to Mutual Understanding”—The Multidimensionality of Social Learning Processes Concerned with Sustainable Natural Resource Use in India, Africa and Latin America. Syst. Pract. Action Res. 2006, 19, 219–237. [Google Scholar] [CrossRef] [Green Version]
  86. Birkmann, J. Measuring vulnerability to promote disaster-resilient societies: Conceptual frameworks and definitions. Towards Disaster Resilient Soc. 2006, 1, 9–54. [Google Scholar]
  87. Paton, D. Disaster preparedness: A social-cognitive perspective. Disaster Prev. Manag. Int. J. 2003, 12, 210–216. [Google Scholar] [CrossRef]
  88. Twigg, J. Characteristics of a Disaster-Resilient Community: A Guidance Note; University College London, Benefield Hazard Centre: London, UK, 2009; Available online: http://discovery.ucl.ac.uk/1346086/1/1346086.pdf (accessed on 17 April 2020).
  89. Aldrich, D.P. Building Resilience: Social Capital in Post-Disaster Recovery; University of Chicago Press: Chicago IL, USA, 2012. [Google Scholar]
  90. Statistical Bulletin of National Economic and Social Development of Xinyang City in 2017. Xinyang, China. Available online: http://www.xytjj.gov.cn/www/tjzl/tjgb/2018/0330/25658.html (accessed on 23 April 2019).
  91. Wang, S. Feasibility study on measuring residents’ living standard with Engel coefficient. Stat. Res. 2002, 19, 19–22. [Google Scholar] [CrossRef]
  92. Lindsey, J.; Thomas, T. ‘subjective resilience’: Using perceptions to quantify household resilience to climate extremes and disasters. Reg. Environ. Chang. 2016, 17, 229–243. [Google Scholar] [CrossRef] [Green Version]
  93. Uy, N.; Takeuchi, Y.; Shaw, R. Local adaptation for livelihood resilience in Albay, Philippines. Environ. Hazards 2011, 10, 139–153. [Google Scholar] [CrossRef]
  94. Merritt, W.S.; Patch, B.; Reddy, V.R.; Syme, G.J. Modelling livelihoods and household resilience to droughts using Bayesian networks. Environ. Dev. Sustain. 2016, 18, 315–346. [Google Scholar] [CrossRef]
  95. Erenstein, O.; Hellin, J.; Chandna, P. Livelihoods, poverty and targeting in the Indo-Gangetic Plains: A spatial mapping approach. New Delhi, CIMMYT and the Rice-Wheat Consortium for the Indo-Gangetic Plains (RWC). 2007. Available online: http://citeseerx.ist.psu.edu/viewdoc/download?doi=10.1.1.924.6384&rep=rep1&type=pdf (accessed on 17 October 2019).
  96. Zhou, Y.; Li, X.; Liu, Y. Rural land system reforms in china: History, issues, measures and prospects. Land Use Policy 2019, 91, 104330. [Google Scholar] [CrossRef]
  97. Mellino, S.; Buonocore, E.; Ulgiati, S. The worth of land use: A Gis–emergy evaluation of natural and human-made capital. Sci. Total Environ. 2015, 506–507, 137–148. [Google Scholar] [CrossRef]
  98. Guan, R.; Wang, W.L.; Yu, J. The impact of endogenous motivation on household income under the framework of sustainable livelihood. J. Northwest Af. Univ. (Soc. Sci. Ed.) 2019, 19, 130–139. (In Chinese) [Google Scholar]
  99. Wang, P.; Yan, J.; Hua, X.; Yang, L. Determinants of livelihood choice and implications for targeted poverty reduction policies: A case study in the YNL river region, Tibetan Plateau. Ecol. Indic. 2019, 101, 1055–1063. [Google Scholar] [CrossRef]
  100. Liu, W.; Li, J.; Xu, J. Effects of disaster-related resettlement on the livelihood resilience of rural households in China. Int. J. Disaster Risk Reduct. 2020, 49, 101649. [Google Scholar] [CrossRef]
  101. Petzold, J.; Ratter, B.M.W. Climate change adaptation under a social capital approach—An analytical framework for small islands. Ocean Coast. Manag. 2015, 112, 36–43. [Google Scholar] [CrossRef]
  102. Adger, W.N. Social capital, collective action, and adaptation to climate change. Econ. Geogr. 2009, 79, 387–404. [Google Scholar] [CrossRef]
  103. Li, E.; Deng, Q.; Zhou, Y. Livelihood resilience and the generative mechanism of rural households out of poverty: An empirical analysis from Lankao County, Henan Province, China. J. Rural Stud. 2019. [Google Scholar] [CrossRef]
  104. Olsson, L.; Jerneck, A.; Thoren, H.; Persson, J.; O’Byrne, D. Why resilience is unappealing to social science: Theoretical and empirical investigations of the scientific use of resilience. Sci. Adv. 2015, 1, e1400217. [Google Scholar] [CrossRef] [Green Version]
  105. Toole, S.; Klocker, N.; Head, L. Re-thinking climate change adaptation and capacities at the household scale. Clim. Chang. 2016, 135, 203–209. [Google Scholar] [CrossRef] [Green Version]
Figure 1. Theoretical framework of the livelihood change process of reservoir-affected families (RAFs) (The study period is Δ T , during which livelihood changes by Δ X ). Source: designed by the authors.
Water 12 03191 g001
Figure 2. Livelihood resilience measurement framework. Source: designed by the authors.
Water 12 03191 g002
Figure 3. Location of the study area. Source: designed by the authors.
Water 12 03191 g003
Figure 4. Density of livelihood resilience scores for the livelihood resilience measurement (LRM) framework. Source: designed by the authors.
Water 12 03191 g004
Figure 5. Box plots of the 307 RAFs’ livelihood resilience scores by livelihood strategy, resettlement location, and living standards. (a) A box plot of livelihood resilience scores for 307 RAFs with different livelihood strategies; (b) A box plot of livelihood resilience scores for 307 RAFs with different resettlement locations; (c) A box plot of livelihood resilience scores for 307 RAFs with different living standards. Source: designed by the authors.
Water 12 03191 g005
Figure 6. Coefficient plot of factors influencing livelihood resilience. Source: designed by the authors. Note: Dots represent standardised beta coefficients; 95% confidence intervals are represented as whiskers.
Water 12 03191 g006
Table 1. Factors influencing livelihood resilience.
DeterminantsIndicatorDescriptionPolarity
Livelihood capitalLand ownership Y 1 Family’s cultivated land area +
Per capita disposable income Y 2 Family’s disposable income per person+
Housing and property value   Y 3 Value of fixed capital such as house and family property+
Population size   Y 4 Number of people in the family +
Dependency ratio   Y 5 Ratio of non-working-age members to working-age members+
Average labor skills   Y 6 Average working years of the workforce-
Health status   Y 7 Number of people with major illnesses or disabilities in the family+
Social network added value   Y 8 Increased revenue due to social networks being able to use equipment, materials, personnel relations, etc. -
Livelihood transferUtilization of infrastructure and resources   Y 9 Degree of utilization of the family’s production on the local infrastructure and resources (five-valued, with higher values meaning greater utilization)+
Information recognition capabilities   Y 10 Family members’ understanding and processing of resettlement information (five values, with higher values meaning greater ability to receive information)+
Participation in welfare projects   Y 11 Number of projects participated in by family members to improve social and economic welfare-
Social cooperation   Y 12 Number of family members serving in the village collective+
Social trust Y 13 Number of households in the local community that can provide loan or labor assistance+
Livelihood bufferDiversity of livelihood strategies   Y 14 Number of types of production activities in the family before relocation+
Proportion of stable income   Y 15 Proportion of income not affected by resettlement, including fixed wage income, minimum living security, and subsidies.+
Emergency cost Y 16 Emergency funds the family needed to borrow from banks-
Probability of labor transfer   Y 17 Proportion of labor that can change production modes after relocation+
Relocation attitude   Y 18 Family members’ expectations of changing the status quo in life (five-valued, with higher values representing higher expectations)+
Note: + refers to positive indicators, and - refers to negative indicators.
Table 2. Proxy variables of livelihood resilience in the household livelihood resilience approach [81].
Overall Composite
Asset Index
Component Asset IndexesIndividual Indicators
Overall livelihood capitalNatural capitalFarmland, farm crops, livestock, soil erosion
Physical capitalRoad conditions, irrigation facilities, services
Human capitalLabor availability, education, health
Social capitalFamily neighbors, group political influence
Financial capitalSalary remittances, belongings livestock, bank account
Table 3. Resilience-related capacity questions used in the subjective self-evaluated resilience score [72].
CapacityQuestion
Absorptive capacityYour household can bounce back from any challenge that life throws at it.
Financial capitalDuring times of hardship, your household can access the financial support you need.
Social capitalYour household can rely on the support of family and friends when you need help.
Political capitalYour household can rely on the support of politicians and government when you need help.
Anticipatory capacityYour household is fully prepared for the resettlement that may occur in your area.
Early warningYour household receives useful information warning you about future risks in advance.
Table 4. Statistical results of multiple linear regressions on RAFs’ livelihood resilience.
Independent VariableUnstandardized CoefficientStandardized CoefficienttSignificanceCollinear AnalysisContribution to Livelihood Resilience
BStandard ErrorBeta ToleranceVIF
Land ownership Y 1 0.0270.0020.41012.2820.0000.6791.47317.58%
Housing and property value   Y 3 0.0020.0000.2947.9140.0000.5481.82512.61%
Emergency cost Y 16 −0.0020.000−0.243−7.0160.0000.6291.589−4.15%
Social cooperation   Y 12 −0.0590.013−0.190−4.6720.0000.4572.190−3.84%
Participation in welfare projects   Y 11 0.0570.0120.1564.8080.0000.7131.402−8.16%
Relocation attitude   Y 18 0.0300.0080.1433.8910.0000.5591.7896.72%
Diversity of livelihood strategies   Y 14 0.0310.0090.1393.6160.0000.5141.9464.82%
Probability of labor transfer   Y 17 0.1050.0290.1233.6330.0000.6591.5175.20%
Information recognition capabilities   Y 10 0.0320.0100.1213.2100.0010.5311.8844.15%
Proportion of stable income   Y 15 0.2550.0720.1163.5470.0000.7071.414−10.43%
Social trust Y 13 0.0090.0030.1122.7200.0070.4432.2576.14%
Utilization of infrastructure and resources   Y 9 0.0250.0090.0972.8670.0040.6631.5095.95%
Population size   Y 4 −0.0140.005−0.097−2.6990.0070.5881.7024.97%
Average labor skills   Y 6 −0.0110.004−0.089−2.9060.0040.7971.2555.28%
Constant−0.0640.064 −0.9990.319
R20.780
F73.785
Publisher’s Note: MDPI stays neutral with regard to jurisdictional claims in published maps and institutional affiliations.

