Article

An Integrated GIS-Hydro Modeling Methodology for Surface Runoff Exploitation via Small-Scale Reservoirs

by
Kleomenis Kalogeropoulos
1,*,
Nikolaos Stathopoulos
2,
Athanasios Psarogiannis
1,
Evangelos Pissias
3,
Panagiota Louka
4,
George P. Petropoulos
1 and
Christos Chalkias
1
1
Department of Geography, Harokopio University of Athens, 17671 Athens, Greece
2
Laboratory of Technical Geology and Hydrogeology, Sector of Geological Sciences, School of Mining and Metallurgical Engineering, National Technical University of Athens, 15780 Athens, Greece
3
Department of Surveying Engineering, Technological Educational Institute of Athens, 12243 Athens, Greece
4
Department of Natural Resources Development and Agricultural Engineering, Agricultural University of Athens, 11855 Athens, Greece
*
Author to whom correspondence should be addressed.
Water 2020, 12(11), 3182; https://doi.org/10.3390/w12113182
Submission received: 21 October 2020 / Revised: 8 November 2020 / Accepted: 9 November 2020 / Published: 13 November 2020

Abstract

:
Efficient and sustainable exploitation of water resources requires the adoption of innovative and contemporary management techniques, a need that becomes even more demanding due to climate change and increasing pressures coming from anthropogenic activities. An important outcome of this reality is the qualitative and quantitative degradation of groundwater, which clearly indicates the need to exploit surface runoff. This study presents an integrated Geographic Information System (GIS)-based methodological framework for revealing and selecting suitable locations to build small-scale reservoirs and exploit surface runoff. In this framework, the SWAT model was used to quantify surface runoff, followed by the simulation of reservoir scenarios through reservoir simulation software. Andros Island (located in Cyclades Prefecture), Greece was selected as the study area. The obtained results indicated the most suitable location for creating a reservoir for maximizing exploitation of surface runoff, based on the specific water demands of the nearby areas and the existing meteorological, hydrological, and geological background potential. Thus, two selected dam locations are analyzed by using the proposed framework. The findings showed that the first dam site is inappropriate for creating a reservoir, as it cannot meet the demand for large water extraction volumes. In addition, the outcomes confirmed the efficiency of the proposed methodology in optimum selection of locations to construct small-scale water exploitation works. This research presents a contemporary methodological framework that highlights the capability of GIS, SWAT modeling, and reservoir simulation coupling in detecting optimal locations for constructing small reservoirs.

1. Introduction

The pressure on water resources availability has increased significantly, mainly due to population growth, migration to urban and coastal areas, climate change, and desertification, and is expected to become even higher [1,2,3]. Therefore, the emerging issues will be even more significant as a result of water shortages in most areas [4,5,6,7,8,9]. The primary challenge in urban and rural economic activities is the irregular and short duration of rainfall. Another challenge, which establishes the importance of water resources management (WRM) projects in insular clusters, is that of spatial discontinuity (distance between island land masses) [10,11]. Therefore, the adoption of satisfactory socio-economic approaches, concerning water deficiency, is the solution to those severe WRM problems [12]. Even more, spatial analysis of the specific background factors (geology, slopes, meteorological, etc.) of each insular study area is needed. In parallel, the degradation of ground water resources, related to the deprivation of their quality due to over-exploitation of aquifers, as well as of relic waters, should also be prevented [13,14,15]. Furthermore, the use of non-renewable resources must be diminished and the rise of projects pointing at an ideal and sustainable use of surface runoff must be encouraged. Thus, a multi-dimensional view on the exploitation of water resources is considered necessary [16].
Constructing projects that guarantee the exploitation of surface water through adequate, dispersed, small-scale harvesting systems (small dams, mountainous-hilly reservoirs) will possibly be more ecologically approachable than big-scale ones or those over-exploiting ground water. In addition, these systems might assist in various sustainable tasks, such as protection of natural environment, local-scale hydropower energy systems etc., while creating new opportunities for local jobs. Taking into account the evolving constraints, which arose through the recent economic crisis, inexpensive projects, in terms of economic value, become very challenging for local development [17,18,19,20,21,22,23,24]. Small-scale mountainous reservoirs are those, which serve local development purposes [25]. These are low-cost projects of high domestic local added value and should be supported in the future [26,27]. The choice of constructing small reservoirs takes into account economic criteria, social imperatives, and environmental commitments [28].
Developing a model that simulates natural phenomena is not an easy task. Either the same difficulty occurs when attempting to simulate the hydrological cycle, by lack of full knowledge of its internal processes or, more often, by lack of primary measured data. Geographic information systems (GIS) has made it easier and faster to process data to produce reliable simulation models. Thus, the integration of hydrological processes into a GIS environment has now reached the maturity level to allow a high degree of accuracy in simulating those processes. Many projects worldwide combine GIS and specific hydrological models to study a variety of procedures concerning dams and reservoirs. Most of these projects takes the existence of a dam or a reservoir for granted and simulates their operation under various scenarios [29,30,31].
In view of the above, this paper presents a new methodological framework that can contribute efficiently to the construction of effective, low-cost systems for harvesting rainwater [32]. It proposes a contemporary and integrated approach for selecting suitable sites within a catchment, to construct small-scale dams/reservoirs, by coupling GIS analysis techniques, SWAT (acronym for Soil and Water Assessment Tool, Austin, TX, USA) hydrological model [33], and reservoir simulation software (RSS, Athens, Greece). The main goal is to quantify the annual runoff for a catchment, based on meteorological and spatial data (via SWAT), which then will be used as entry data in the RSS. The calculated monthly failure (in terms of meeting the water demand) by RSS qualifies the optimal positioning of the reservoir. Finally, the efficiency of the proposed methodological framework is verified in several stages throughout its application, by field measurements, the Nash–Sutcliffe index and the assessment of the simulated failure rates of the reservoirs scenarios. The verification results support the efficiency of the proposed methodology.

2. Material and Methods
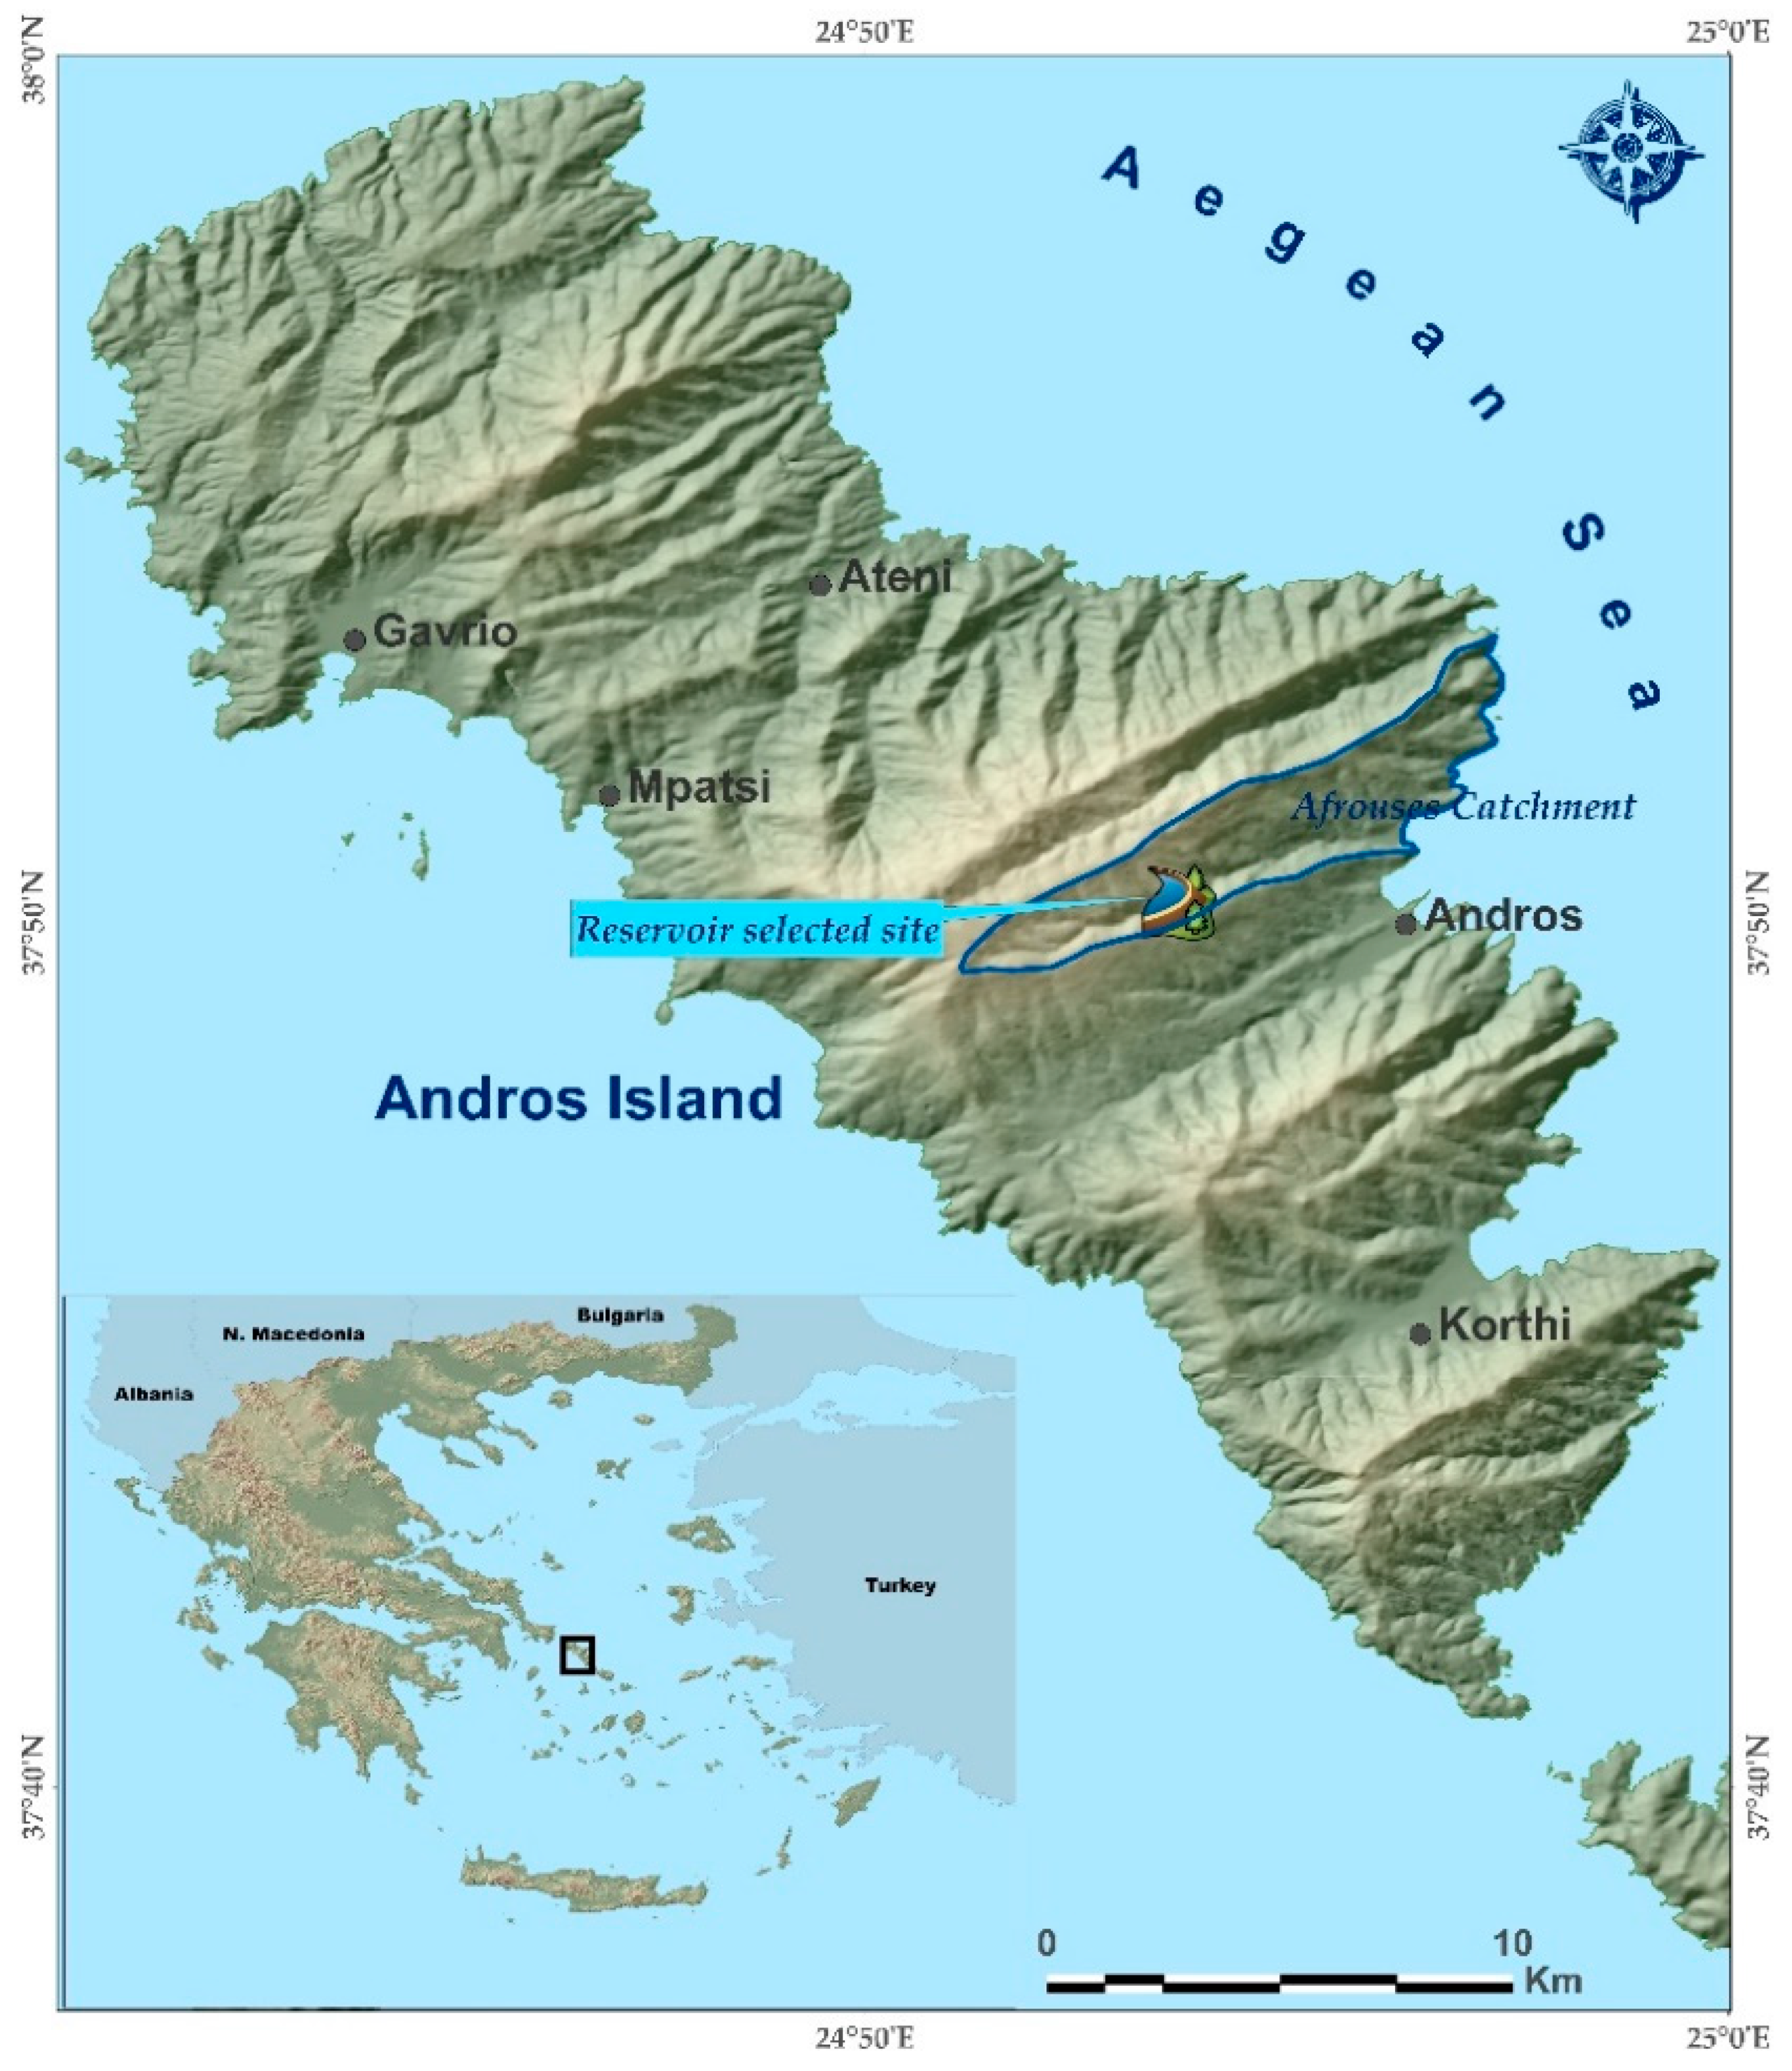
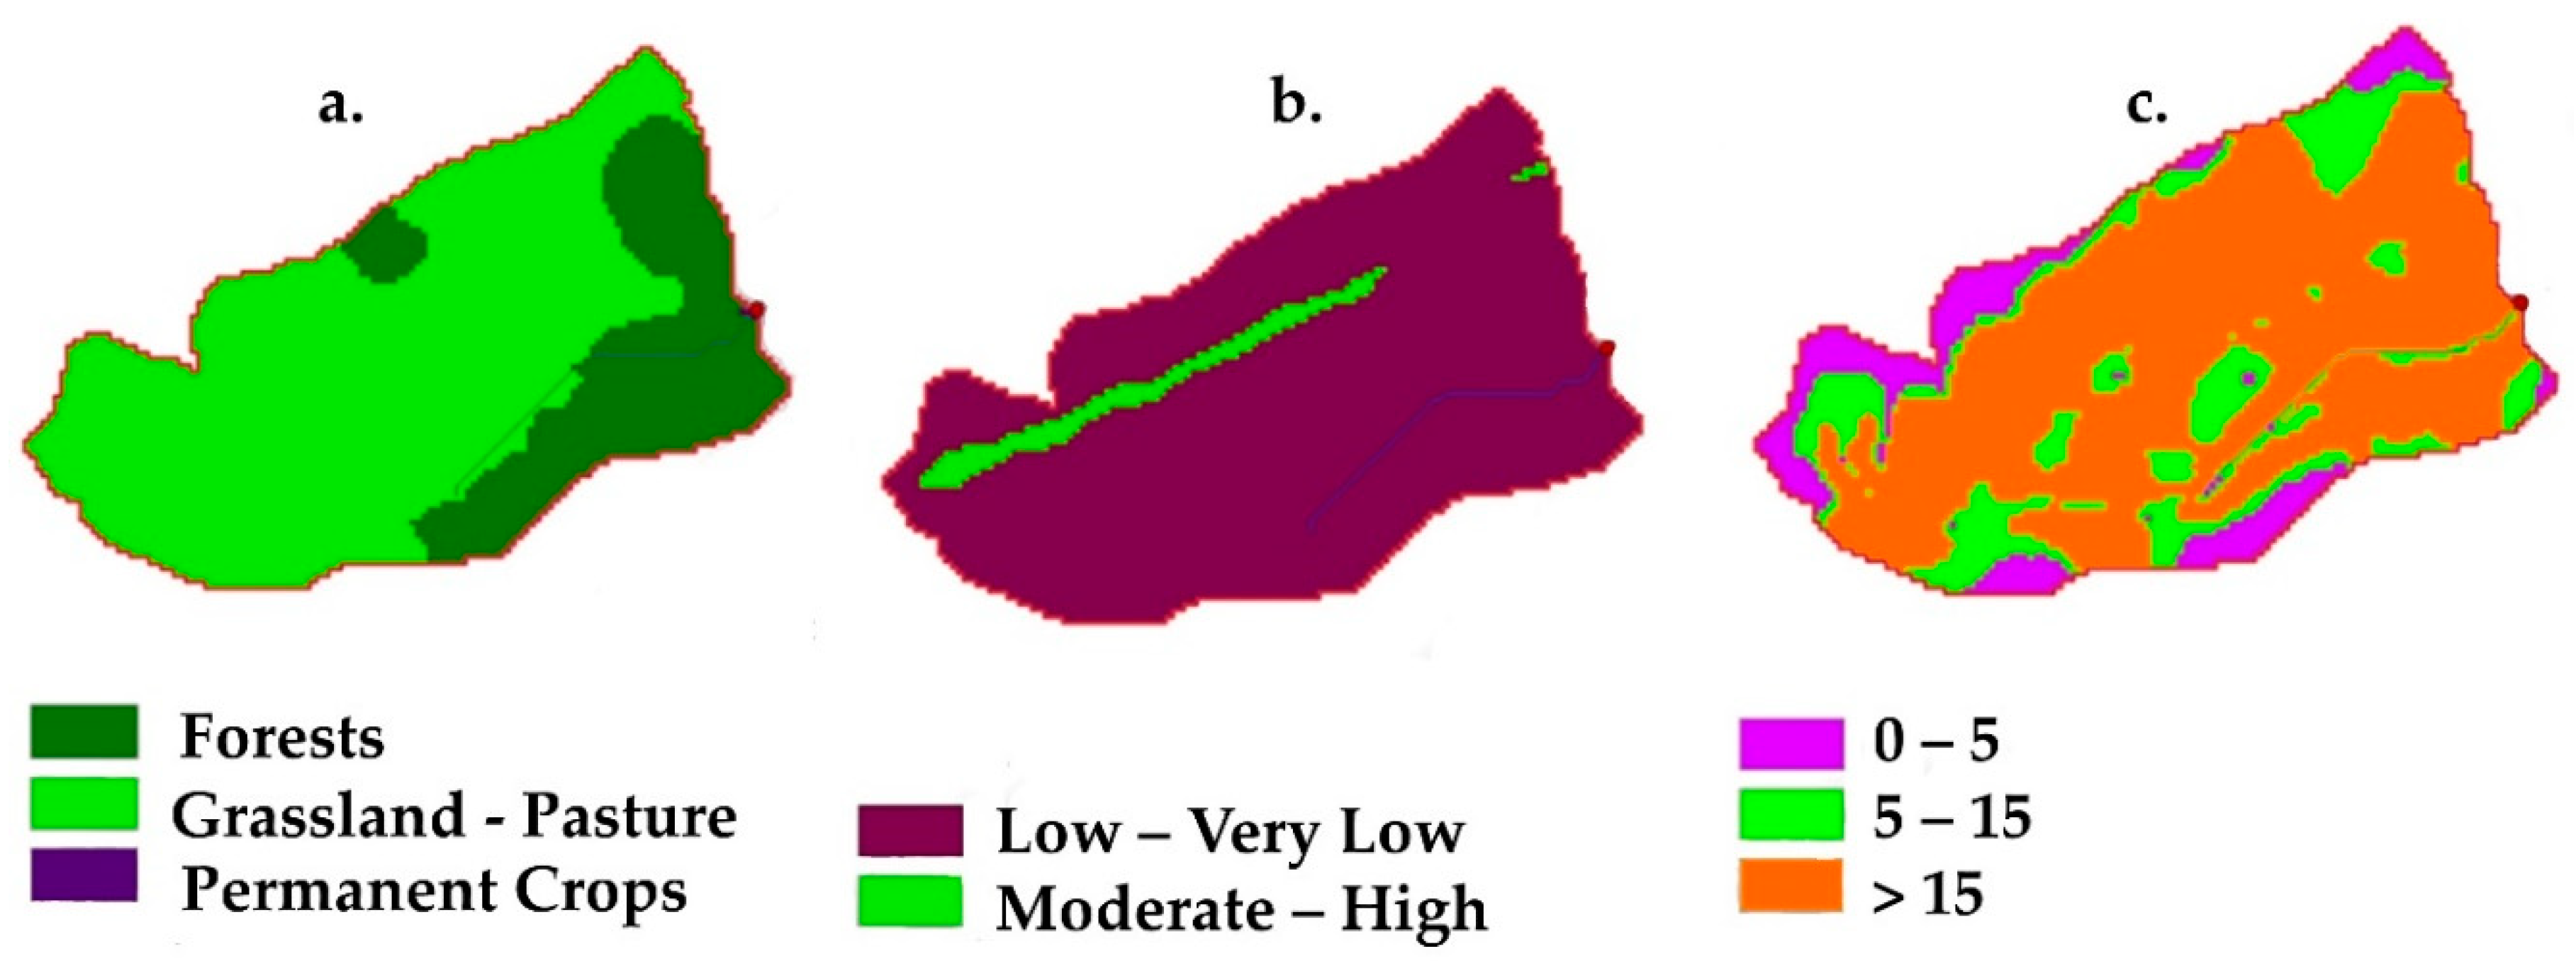
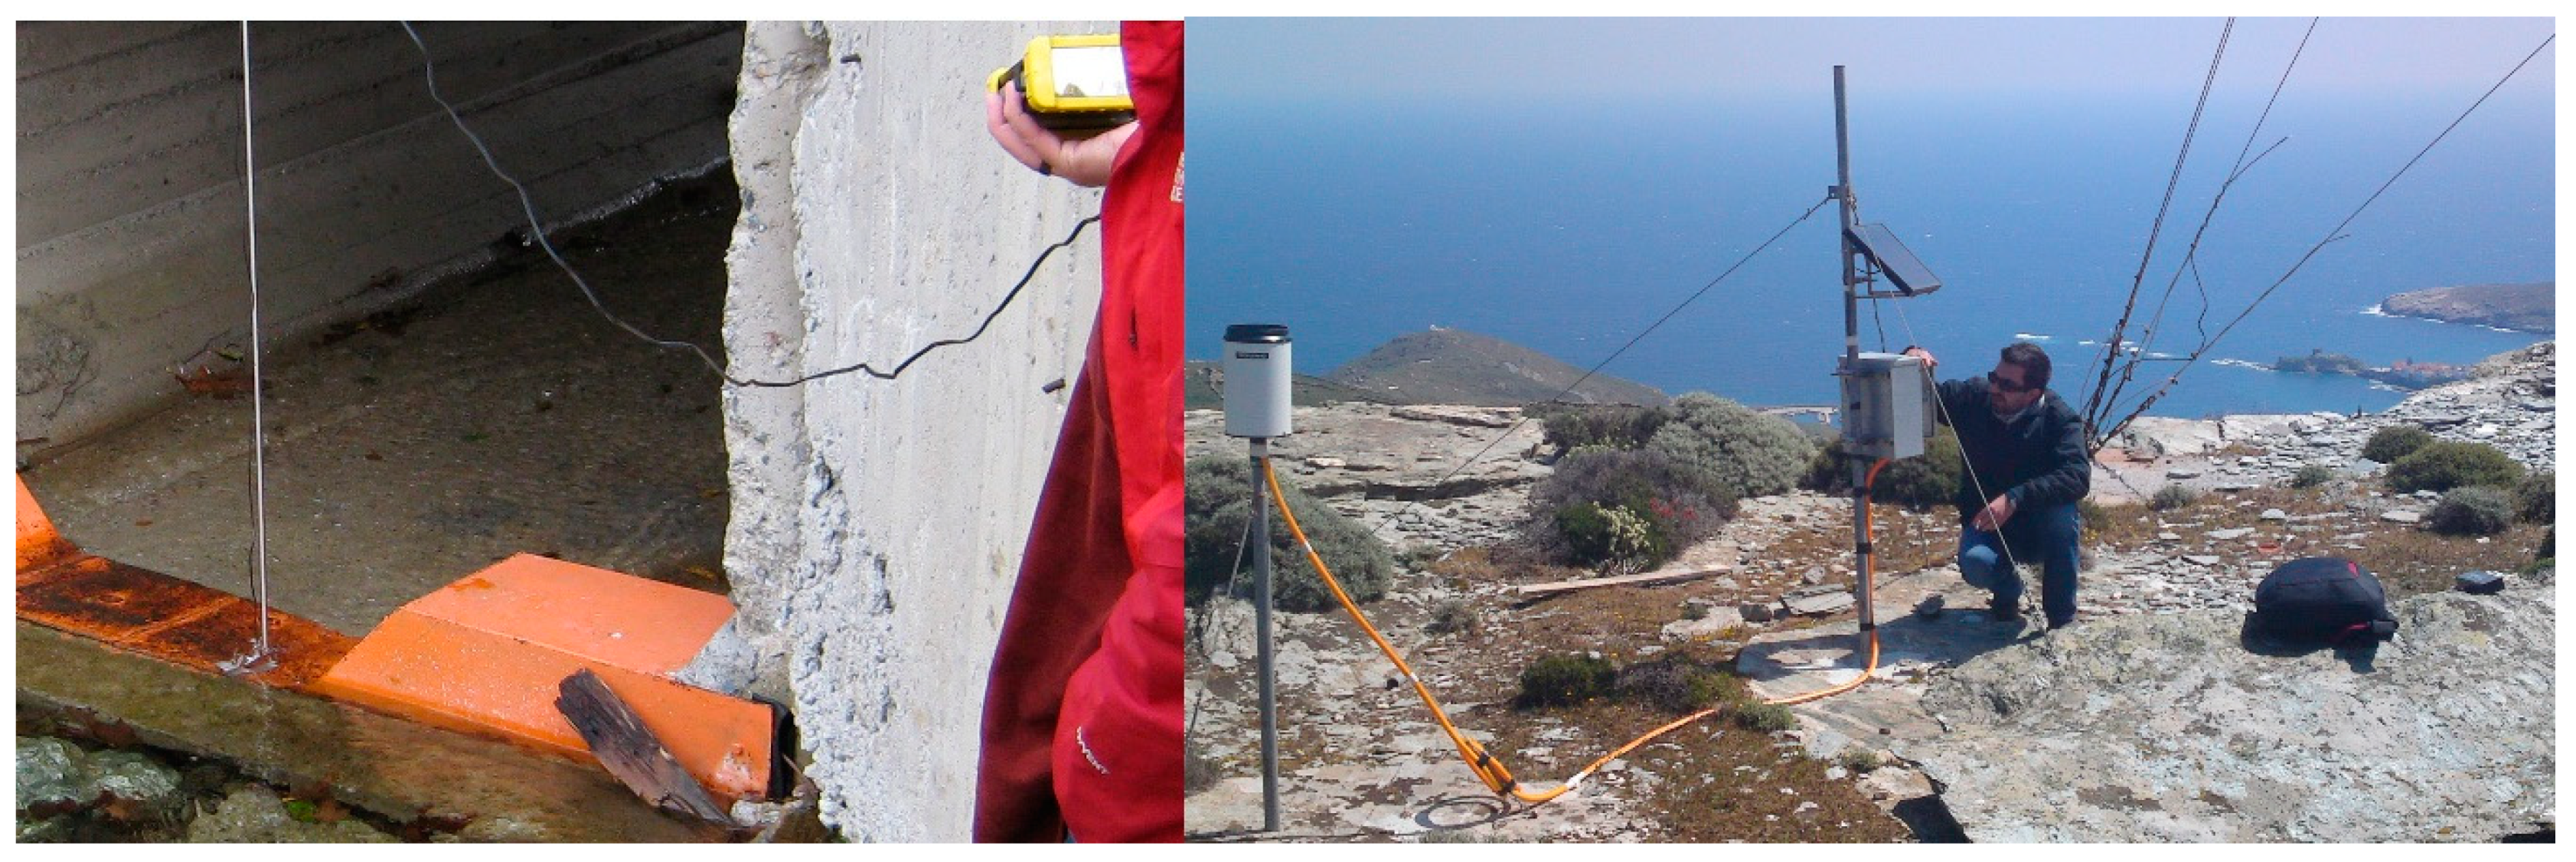
2.1. Study Area

Andros Island, Cyclades, Greece, was the wider study area for this research project (Figure 1). Andros is the northernmost island of the Cyclades cluster, between Evoia Island and Tinos Island. It has a very intense topography and elongated shape with a direction from NW to SE. It is the second island in Cyclades (after Naxos) in terms of area extent, covering almost 375 km2 with a perimeter of about 180 km. As far as the island’s anthropogenic environment is concerned, the population of Andros is about 10,000 residents. During the summer, the population of the island gets ten times bigger, resulting in very serious problems in relation to water supply.
Afrouses catchment, which is the selected study area, covers an area of 12.9 km2, with a perimeter of 28.70 km. The average altitude of the catchment is 515 m, and the average slope is 30%. The dominant type of land cover is grassland-pasture and as far as the geological background is concerned slates, amphibolites, and quartzites are the dominant formation types. Afrouses catchment is characterized by ephemeral surface flow mostly due to intense and short-term rainfall events.

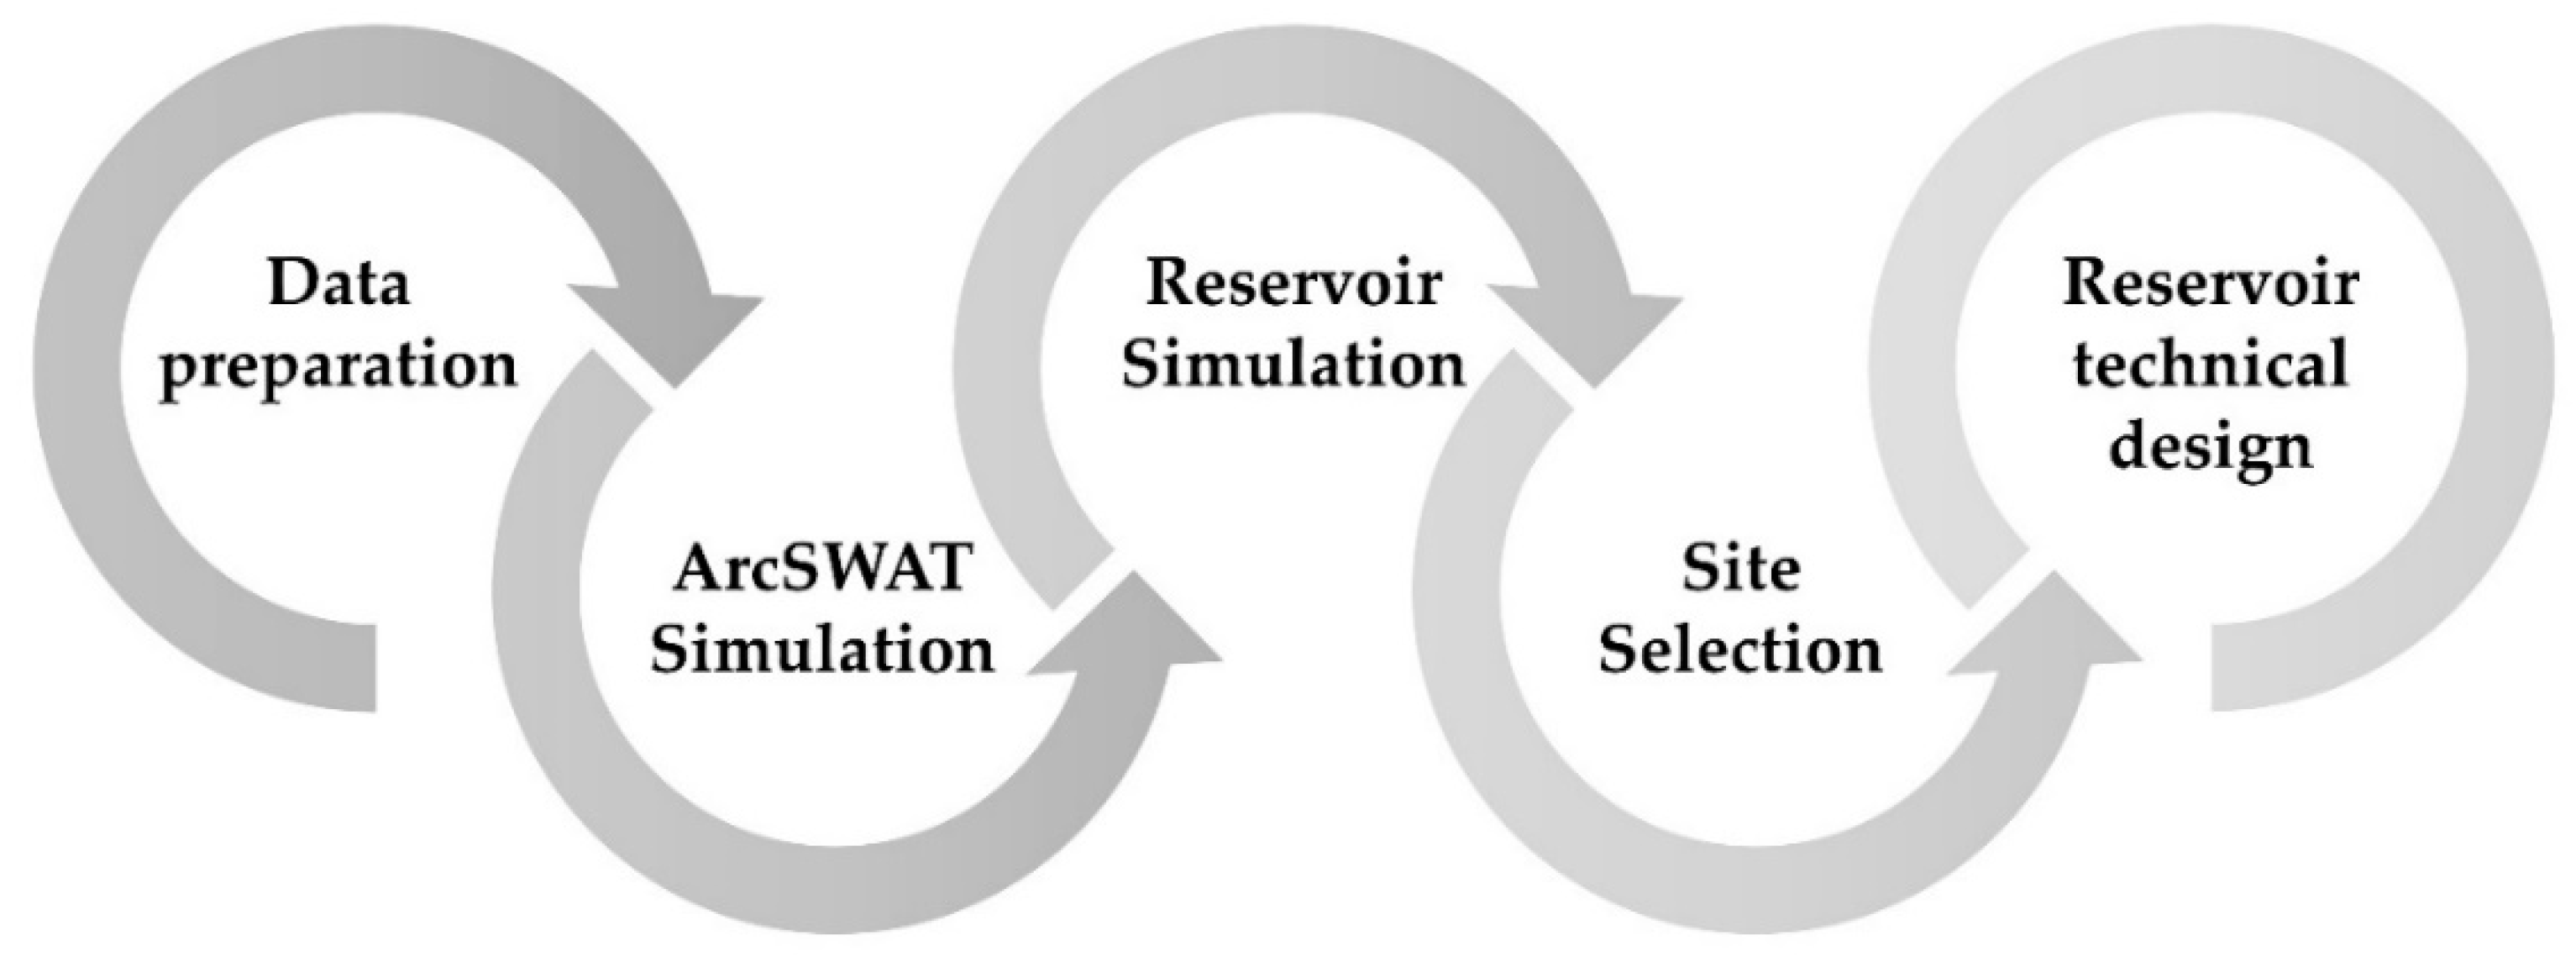
2.2. Methodological Framework

2.2.1. Overview and Data

The conceptual scheme of this research is presenting in Figure 2.
The proposed methodological framework includes procedures related to hydrological analysis, modeling using the SWAT software, and to the RSS by Technologismiki. A summary of the main steps of the proposed framework is provided in Figure 3.
The evolution of GIS technology has led to improvements in data processing and to the development of more sophisticated and reliable simulation models. The hydrological model used in this work, coupled with GIS environment, is SWAT. The simulation of the hydrological cycle by SWAT requires a large amount of meteorological and spatial data [34].
However, execution of the model is quite easy. Routines run serially, which means that the program does not allow the user to proceed to the next step without completing the previous one. The model uses the standard equations of hydrology to simulate the hydrological cycle. SWAT model has been used within Mediterranean regions giving very accurate results [35,36,37,38,39,40,41] and worldwide in a variety of applications [42,43,44,45,46,47,48,49,50].
All the procedures of the runoff simulation are carried out within an ArcGIS context. The input data for this work is presented in Table 1.
In particular, the primary input data to execute SWAT are (Figure 4): (i) a Digital Elevation Model (DEM) by Aster GDEM (28 × 28 m pixel size), (ii) a land-cover layer (produced by the Greek Ministry of Agriculture land cover map, scale 1:5000), (iii) a hydrolithological layer of Andros by combining the hydraulic characteristics of each formation (produced by the Institute of Geology and Mineral Exploration geological map of Andros, scale 1:50,000), and (iv) meteorological data available by the Hellenic National Meteorological Service for the period 1980–2000 [51]. A correlation between the permeability of each hydrogeological formation and the equivalent permeability of SWAT’s database was established to produce a SWAT-compatible soil map [37]. The hydrologic analysis of the used DEM covers the needs of the work, as it provides satisfactory results [52].

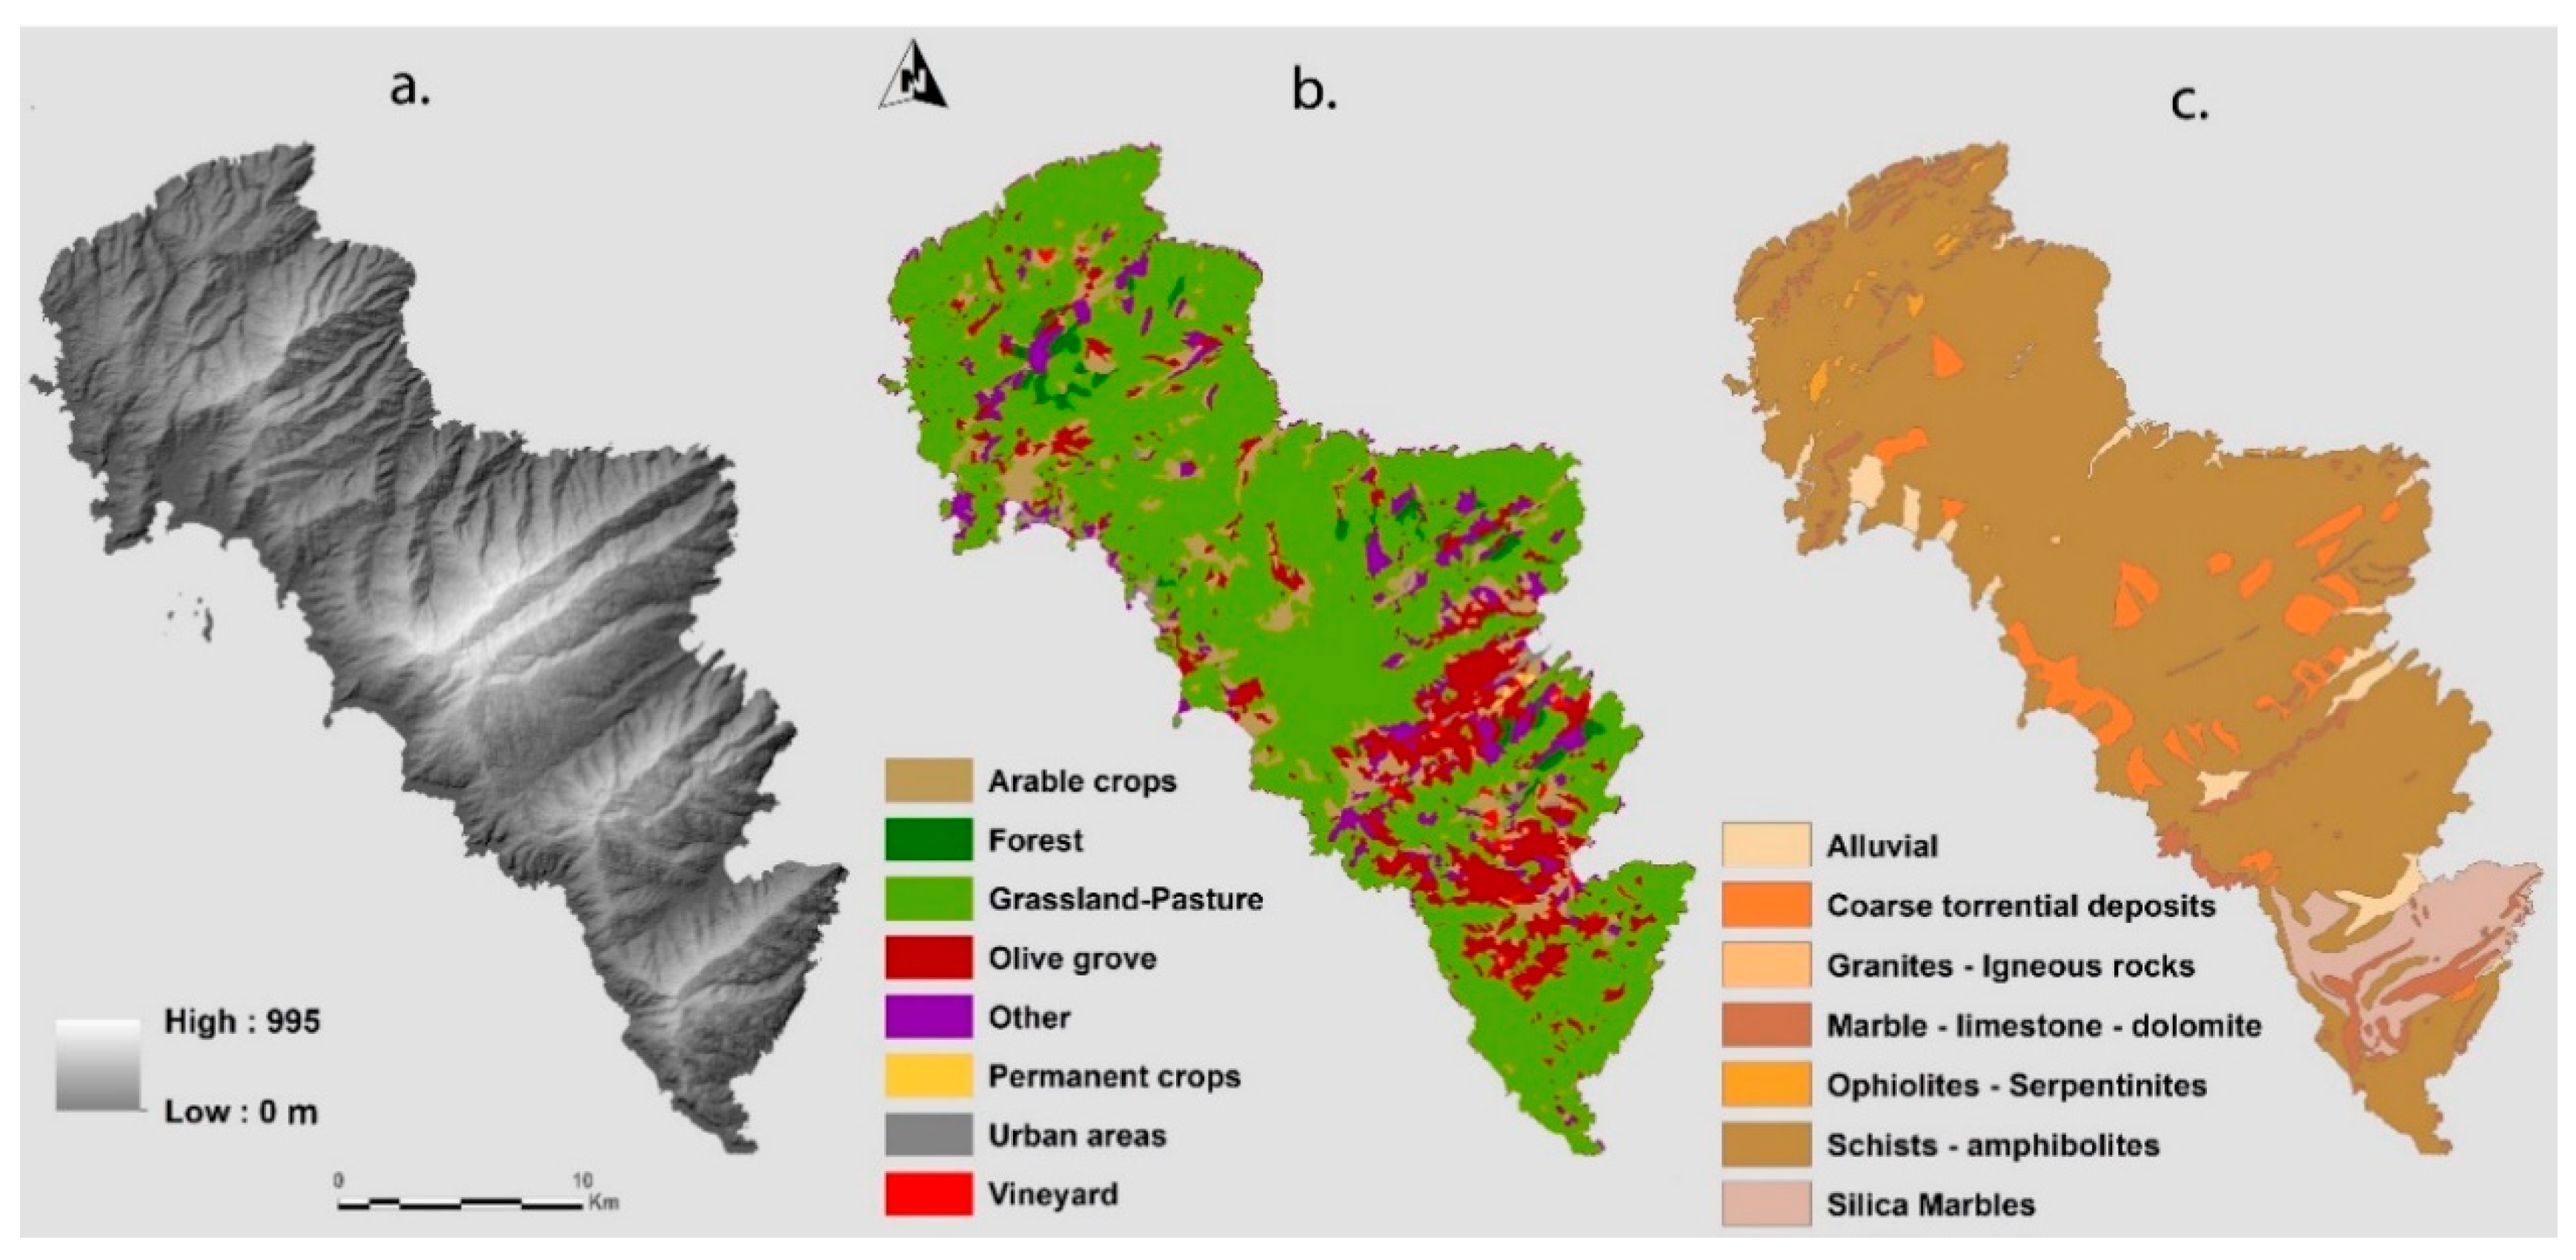
2.2.2. Hydrological and Background Analysis—SWAT Simulation

All the background data (hydrological and meteorological characteristics, land cover/use, soil map, etc.) that are needed as inputs to the SWAT model can be prepared and analyzed both manually/individually in a GIS software or by using the SWAT toolbox that works as an extension in ArcGIS software. In this study, the second choice was selected as it offers direct control and display over each action in a very easy step-by-step routine [53,54].
Thus, background data preparation and analysis are the most crucial steps of the modeling process.
As far as the hydrological analysis of the study area is concerned, the first step is DEM processing. Andros island DEM follows the standard hydrological analysis procedure, which in the following order includes the:
(a)
filling of possible sinks and smoothing of possible excessive elevations lifts resolving thus possible water trapping or pseudo-changes in flow direction [55]
(b)
estimation of flow direction
(c)
estimation of flow accumulation
(d)
creation of streams and outlets of each catchment
It must be underlined that before catchment delineation, a threshold of 100 Ha is selected. Thus, the produced catchments will be over 1 km2 in extent, avoiding the creation of very small sub-catchments. The analysis process continues by selecting specific outlets. At this point, the Afrouses catchment is selected for further research on possible reservoir creation. This choice was based on its special spatial characteristics, namely its proximity to the biggest settlement of the Andros Island (Andros settlement), its hydrological and hydrogeological background (low-very low permeability resulting in small losses in percolation), etc. SWAT analyzes and records the characteristics of the selected catchment.
The above procedure must be performed twice, once for each selected dam location. The model must be executed for each of them. The next step refers to the Hydrological Response Units (HRUs) analysis which demands (a) the land cover/use map, (b) the soil map and (c) the slope map of the catchment. HRUs are smaller hydrological entities, within the sub-basins, that have the same characteristics of hydrological soil type (same water permeability–soil map elements), land uses, and slope. Each HRU is treated separately from the model and then all together compose, as the final result, the hydrological cycle. This separation gives the user the ability to achieve a detailed setting of the model in the catchment.
SWAT offers the prospect to either import historical data of rainfall, temperature, wind speed, and solar radiation or generate a statistical weather station, in the absence of previous data. The second solution was chosen for this current work. The next step was devoted to the execution of the simulation scenarios. SWAT simulation was carried out for two selected dam sites within the studied catchment (Afrouses catchment), to estimate runoff for each upstream sub-catchment. After setting and importing the background data in the SWAT model, the simulation process of the two selected scenarios follows. In this project, the simulation time period for the two dam location scenarios, and for the Afrouses catchment as a whole, is from 1 January 2020 to 31 December 2119 (100 years). The model calculates the parameters of the hydrological cycle for each simulation year.

2.2.3. SWAT Modeling Evaluation

A field campaign took place in the studied catchment in order to optimally evaluate the model based on true data. The field measurements of the in situ research were accomplished by current meters for the water velocity/volume recording, water level by a water level logger, and for the meteorological parameters by a meteorological gauge station that was installed at a suitable location inside the studied catchment. The time period of the measurements was September 2009 to September 2013.
Thus, using the available measurements of surface runoff (water yield) and the simulated results, to evaluate the performance of the model, the Nash–Sutcliffe index (corresponds to a perfect match of simulation and measured values between −∞ and 1) and R2 (indicates the magnitude of the correlation between simulated and measured values and ranges between 0 and 1) are used [56]. If the Nash–Sutcliffe index and R2 are 1, then the model is considered to be the best possible.
The Nash–Sutcliffe coefficient [57] is given by the next Formula (1):
E = t = 1 T ( Q 0 t Q s t ) 2 t 1 T ( Q 0 t Q 0 ¯ ) 2
where Qo is the observed flow rate, Qs is the simulated flow rate and Q ¯ is the observed flow rate at a time t.
R2 is given by Formula (2):
R 2 =   [ i = 1 n ( Q 0 Q ¯ s ) ( Q s Qs ¯ ) i = 1 n ( Q 0 Qo ¯ ) 2 i = 1 n ( Q s Qs ¯ ) 2 ] 2
where Qo is the observed flow rate, Qo ¯ is the mean observed flow rate, Qs is the simulated flow rate and Qs ¯ is the mean simulated flow rate during the model evaluation time.

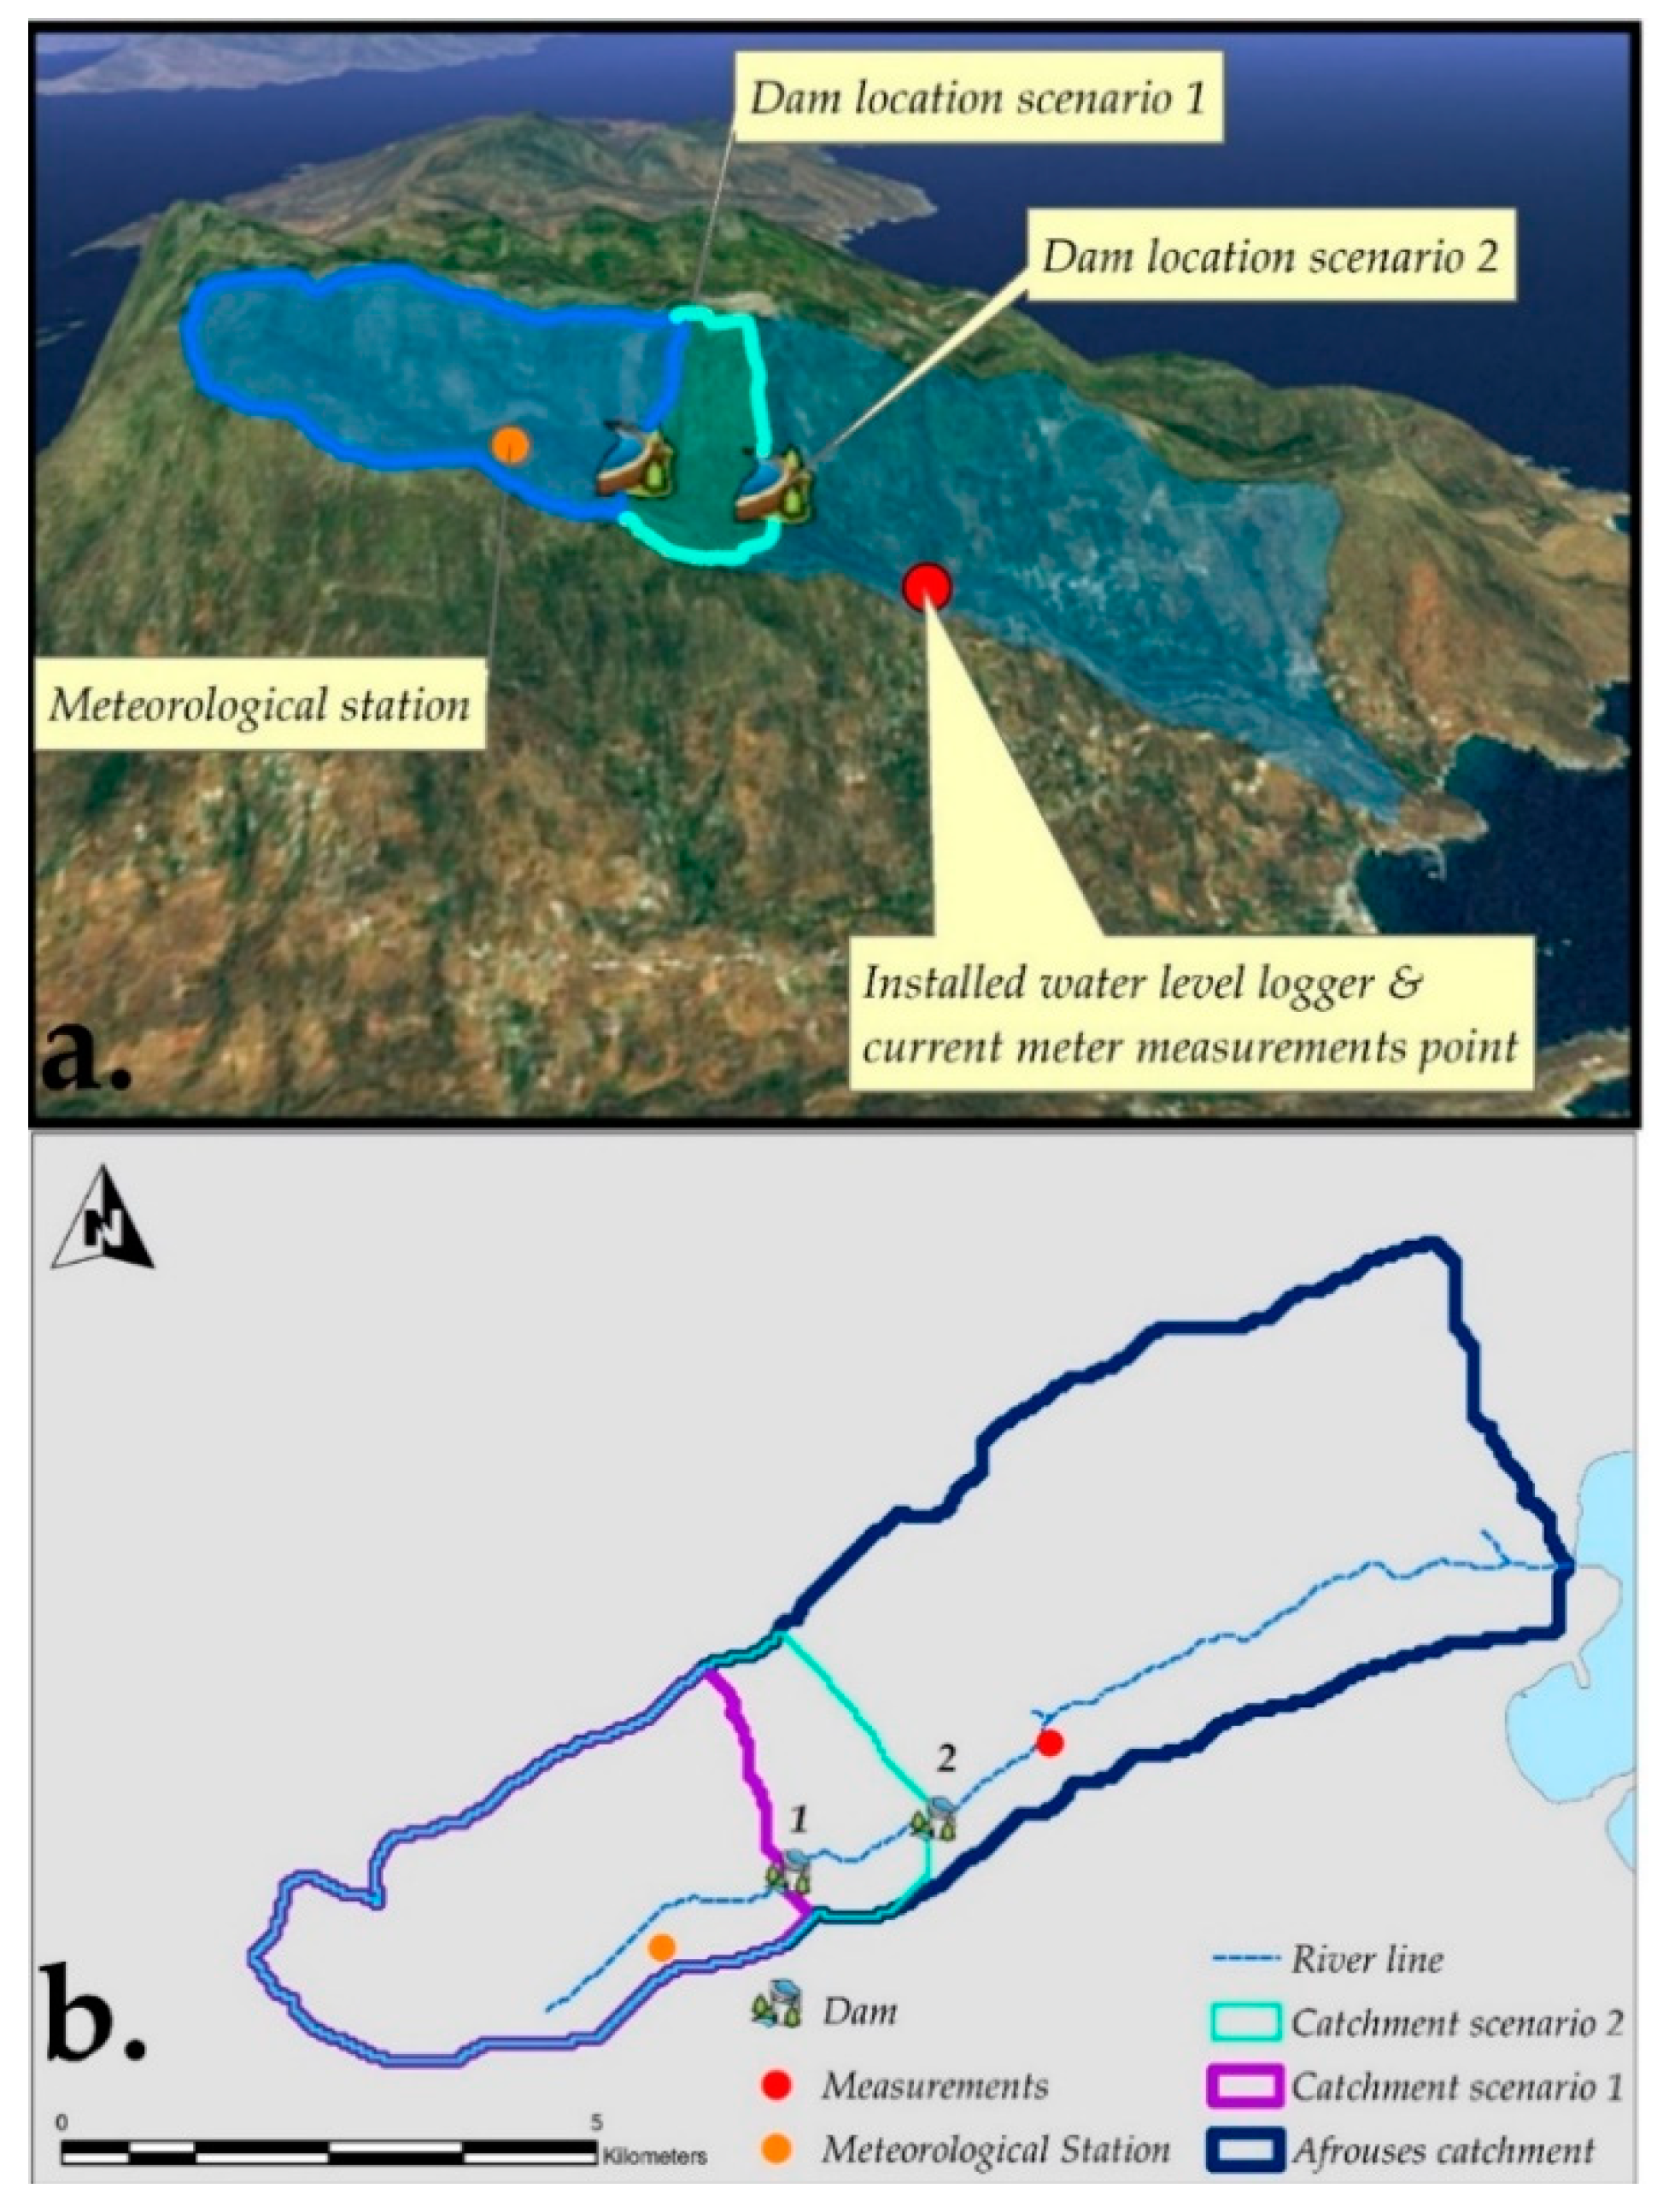
2.2.4. Reservoir Simulation

RSS simulates the operation of a single- or multi-purpose reservoir, i.e., water storage system. Thus, the operation of each of the two reservoirs, created by the dam location scenarios, is simulated via RSS. The SWAT modeling results (simulated values of surface runoff) are the entry data for the RSS, which simulates the reservoir operation for single or multiple probability in meeting the water demand. The input data, required for the execution of this software, are presented in Figure 3. The Level-Area Curve which is needed, is presented in Table 2.
Afrouses catchment, the two dam location scenarios and the corresponding reservoirs that were modeled in SWAT are presented in Figure 5.
A specific scenario was assumed in terms of monthly outflow rates, according to which in the months with low consumption in Andros Island, from October to March (period without great needs for domestic water and irrigation), the coefficients are smaller (from 4 to 6% of the total draw-off amount). In April there is an increase in the seasonal population (due to Easter) and the percentage rises by 9%. The same goes for the month of May, where the first vacationers arrive on the island. In June, where there are more vacationers in general but also weekend vacationers (as Andros is very close to Athens), the rate rises to 11%. In July, there is a higher increase in the seasonal population and the percentage rises to 14%. In August, as in most tourist areas, the seasonal population peaks and the percentage rises to 18% (about 1/5 of the annual water draw-off).
During the same period (summertime) irrigation needs are also increased. However, domestic water use is the key need at the summer period due to the augmented seasonal population (tourism), placing thus irrigation demand at a lower level of significance. Finally, in September, the percentage drops to 12%, because there are still vacationers on the island.
In terms of operating volumes, the maximum and minimum operating levels of the reservoir are imported. For the first month of simulation, the initial level (or volume) can be imported manually or automatically calculated by the model.
At this point it should be clarified that by importing the minimum operation level, the available amount of water draw-off is determined, without emptying the reservoir and with the maximum level essentially determining the height of the dam. For the needs of this research, dams up to 15 m (8, 9, 10, 11, 12, 13, 14, and 15 m) are adopted, a height that sets the limit for small dams and the annual water extraction volume up to 200,000 m3 (50,000, 100,000, 150,000, and 200,000 m3). For example, in the first selected dam location, where the absolute altitude is 520 m, the minimum operating level is considered to be 524 m, which means that 1352 m3 will always remain in the reservoir, for a 15 m dam the maximum operating level will be 535 m.
Finally, when all the above data are imported, the simulations begin. As already mentioned, this research examines the possibility of constructing a dam at two different selected locations in the Afrouses catchment, while creating a water reservoir based on the water availability failure rates of a certain water extraction volume per year. To address this matter, the number of failed months is needed, information that is given from the simulation. Thus, for example when the number of failed months is 223 in a total of 1200 months the failure (F) is: F = 223/1200 = 0.18583 ≈ 18.6%. The above example presents the way that the simulation works to define the possibility of building a dam and creating a reservoir.

3. Results

3.1. SWAT Modeling and Background Analysis

SWAT model showed an average annual rainfall of almost 570 mm and surface runoff of about 290 mm (for the selected catchment), which is in line with the Master Management Plan of the Greek Ministry of Development (661 mm and 293 mm respectively), which was developed according to EU Water Framework Directive. Thus, the simulation is considered to provide acceptable results based on the assumptions made and the data used [50]. In addition, the annual surface runoff coefficient of the catchment is calculated at 0.52. The water capacity of the catchment is 23 mm/km2. It must be noted that the mean annual rainfall value that was imported in the SWAT model was 569.4 mm (almost identical to the value that SWAT calculated).
Dam location scenario 1 forms an upstream drainage sub-catchment of 3.63 km2 extent and 10.9 km perimeter. The spatial background characteristics of this basin are presented in Figure 6.
Table 3 summarizes the SWAT results for the first year of the simulation in the first selected site (scenario 1).
A table such as the previous one is produced for each of the 100 years of SWAT simulation for the first site (scenario 1) within Afrouses catchment.
Dam location scenario 2 forms an upstream drainage basin of 4.73 km2 extent and 12.7 km perimeter. The spatial background characteristics of this basin are presented in Figure 7.
SWAT modeling results for dam location scenario 2 are presented in Table 4.
Taking into consideration the adopted assumptions and the data that were used for the simulations the results are considered satisfactory [58]. For validation purposes, the SWAT modeling results were compared with the corresponding ones of the Master Management Plan of the Greek Ministry of Development, as mentioned previously. This study used a Thornwaite-type rainfall-runoff model and calculated the catchment’s runoff coefficient at 0.44, a slightly decreased value compared to the one calculated by SWAT. On the other hand, the catchment’s water capacity was reported in this study to be at 23 mm/km2, which is equal to the one calculated by SWAT.

3.2. SWAT Modeling Evaluation Results

The validation of the model, as mentioned before, was based on true data. Current meters, water level logger, and meteorological data were used for this purpose (Figure 8).
Table 5 presents the results of the evaluation for the measurement and simulated values.
The above results indicate that the selected catchment presents an excellent candidate for further study in constructing a small reservoir.

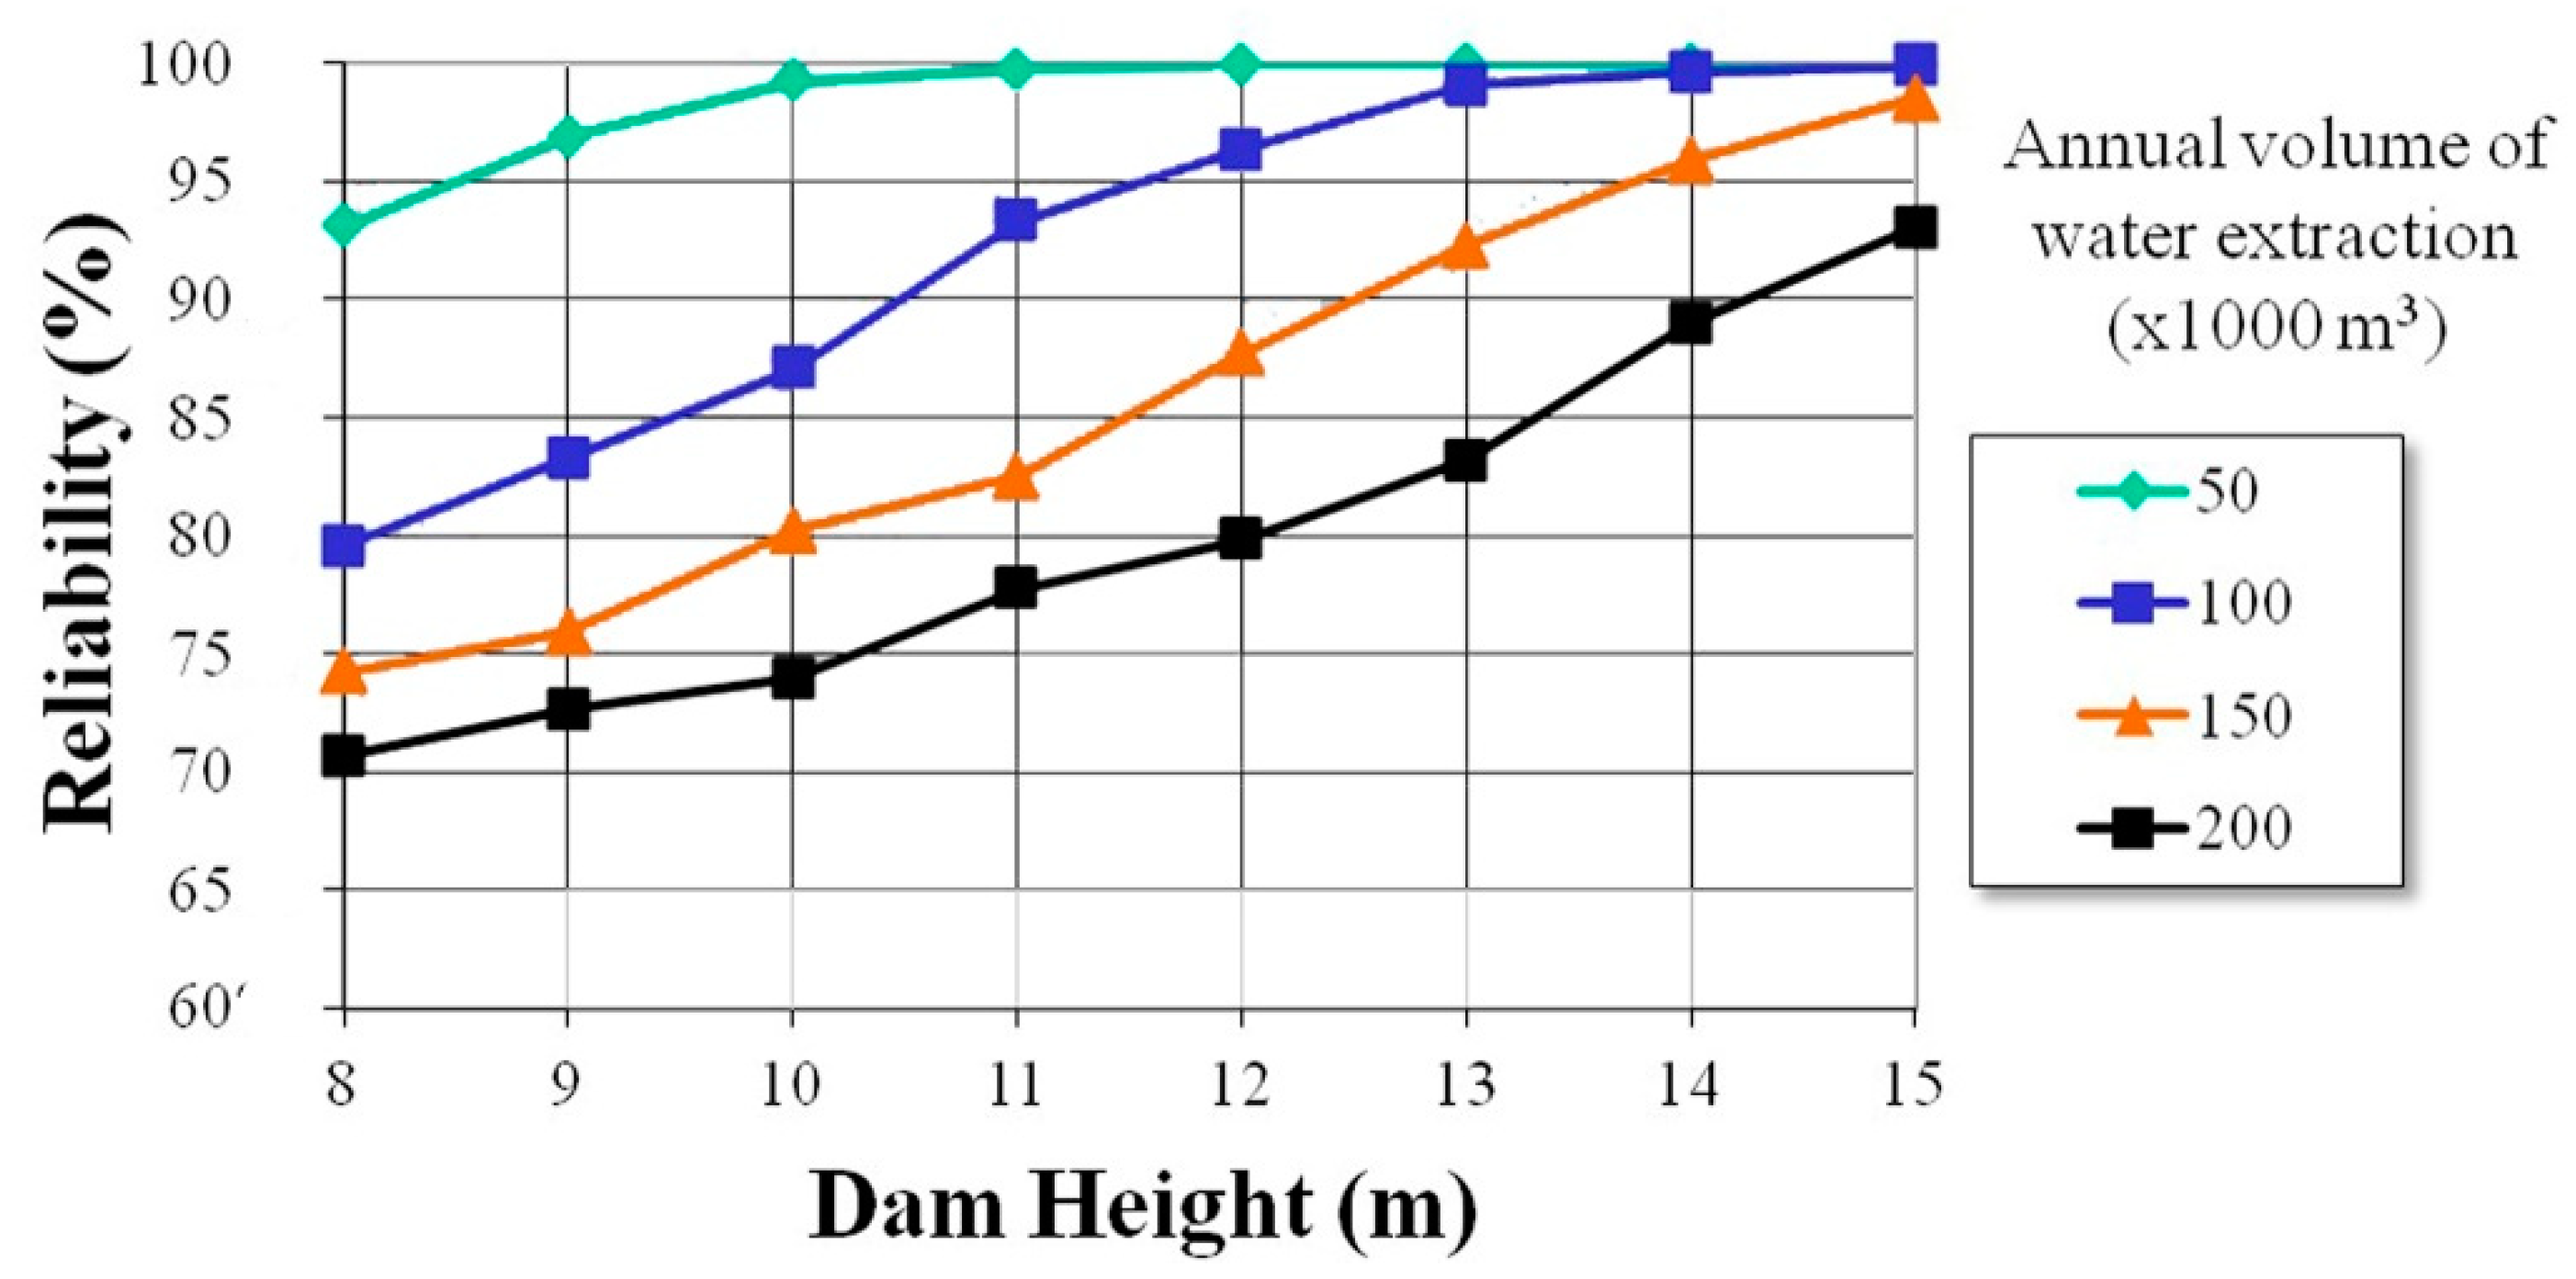
3.3. Reservoir Simulation

As already mentioned, SWAT produced simulations for 100 years for two different dam sites (two scenarios) within Afrouses catchment. This means that the software produced 2400 tables like Table 3; Table 4 above. These data tables were the initial inputs for the RSS, along with the rest required data as described in the Section 2.2.
The results of the reservoir simulation are presented in Figure 9.
It is clear that when the dam height is increasing (from 8 to 15 m), and the annual extraction volume increases as well (from 50,000 to 200,000 m3), then the failure rate increases too.
In particular, for low volumes up to 50,000 m3, the creation of a reservoir in the first selected dam site is possible. For dam height of 8 m the failure rate is 14.3% and for dam height 9 m the failure rate falls below 10% (9.9%). It is noticeable that the first dam site is inappropriate for creating a reservoir, as it cannot meet the demand for large water extraction volumes. In the present study, the site’s failure rate is ~20%, even for a dam height of 15 m and a volume of 200,000 m3. These estimates are considered to be quite high and not acceptable to meet the demand (since, based on the results, failure mainly occurs during the summer season). Therefore, the first dam site (scenario 1) is inadequate to meet the water needs. Thus, the second dam site is a more reliable solution for high usable water volume of about 200,000 m3. Also, a dam with a height up to 15 m is acceptable to meet the water needs (acceptable failure rate of 7%). The Pareto front is another way to present the reliability of the results. Thus, the second dam site (reliability for every dam height and every annual volume of water extraction) eloquently presents the reasons for the eligibility of the second site (Figure 10).

4. Discussion

The methodological framework presented in this research work examines first the specific and unique characteristics of the selected study area (catchment) and then any possible intervention (reservoir) in it. The obtained results revealed that creating small-scale water reservoirs in the study catchment is feasible, provided that certain prerequisite criteria are met.
Cyclades Prefecture in Greece (a cluster of islands) experiences water scarcity, dependent on the annual and seasonal climate fluctuations and in particular rainfall. Cyclades islands are characterized by a permanent deficit in their annual spring and summer (May–September) water balance, hydrological uncertainty, and water inefficiency. These islands exhibit a lack of efficient countermeasures to deal with the rapid degradation of their water capital [59].
In this work, several sites were initially examined in Andros Island to build dams and therefore to create a small reservoir. After this thorough site examination, the Afrouses catchment was chosen as the best place to build a dam. This choice was based on the spatial characteristics of the area such as slope, low-very low permeability of the geological formations, and altitude (Afrouses catchment is located on the highest mountain of Andros Island). In addition, it must be highlighted that in terms of geological/geotechnical conditions of the selected dam sites (two reservoir scenarios), a complete geotechnical research study has taken place which included stress tests for the reservoirs, geological background analysis, geotechnical slopes stability tests, etc. Also, this choice was based on its proximity to the capital of Andros Island, where most of the people of the island live, and where the highest touristic pressure occurs.
In general, the key outcome of this research is that with the results produced by the SWAT hydrological model as inputs, the reservoir simulation presented two acceptable and applicable choices. First, it is possible to build a dam in the selected location 1, for extracting low annual water volumes (up to 50,000 m3) and for a dam height of not less than 9 m, while second, for higher annual water volumes (up to 200,000 m3) and for heights of about 14–15 m, the selected dam location 2 is suitable.
At this point, it must be underlined that the assumptions that were made at several stages of the methodology define a specific uncertainty framework, according to which the results of this research are evaluated. It must also be emphasized that the developed methodology can be used as a standard procedure for quantifying surface runoff, which can be incorporated into a broader management framework. This means for example that on a practical level, prior to the implementation of any project (dam construction), a geological study must be carried out in order to clarify the local hydrogeological conditions. Moreover, this research work highlights the need for additional measures to avoid possible failures. In addition, in terms of meteorological data, the SWAT model provides the choice to the user to create a weather generator. Thus, in absence of historical time series, the statistical background of these meteorological data (of the weather generator) should be defined properly. Specifically, rainfall and temperature statistics (average maximum and minimum air temperature, standard deviation for maximum and minimum air temperature, average amount of precipitation, standard deviation for daily precipitation, etc.) should be valid in order for climate-change effects to be taken under considerations and co-estimated by the weather generator [37].
Another crucial aspect that must be taken into consideration is the effect of sediment yield in reservoir operation. In this study, the rate of sediment yield is very low, as estimated by the SWAT model (Table 3 and Table 4) and the assumption that the operation of the reservoir will not be affected was adopted. This was based on the fact that the geological background of the study area is not highly erodible (based on the results of the detailed geotechnical study that took place in the frame of this work) along with the fact that intense rainfall events are not frequent, thus lowering the erosion dynamics. Nevertheless, if in some period during the reservoir’s operational life increased sediment deposition is observed, thus reducing its efficiency, sediment removal actions can be considered. Furthermore, in cases of high sediment yield (e.g., calculated by SWAT), reservoir simulation can be modified accordingly.
The presented methodology offers results that can be continuously optimized as the data that are used become more and more reliable. In any case, this methodology can exceed its initial research purpose and become a very useful management tool. It can become part of a wider management plan, not only for Andros Island but also, in a more general scope, for island complexes where due to their isolation from the main continental inland, sustainable and efficient exploitation and management of their natural resources (e.g., rainfall–surface runoff) is a necessity.
Further development and optimization of the presented integrated methodology can include specific actions, which can result in the best possible approach to the real conditions of each area to be applied. Such actions can be an even more thorough calibration of the modeling and simulation processes (SWAT, reservoir simulation), based on true data from each studied site [60], and sensitivity analysis as well [61]. Furthermore, the surface runoff results of the applied methodology have been compared with those of other methods [62], as well as with satellite imagery of the reservoir surface [63], and consequently with the available water volume for extraction, and were found to converge satisfactorily.
Among the planned future actions, for testing and developing the predictive ability of the presented research methodology, simulations are included that will take into account various climate-change scenarios [64] and/or underestimated meteorological data, while exploring and analyzing each of the estimated runoff volumes by the SWAT model [65]. Another parameter that will be tested via various scenarios is the possible surface runoff alternations due to systematic changes in land use/cover [66]. Synthesis of a valid and detailed soil map, based on in situ measurements and recordings, is another action currently developing, as expected, with great certainty, to contribute in producing even more reliable results from SWAT modeling [67]. It must be mentioned here that the hydrologic analysis of the used DEM (pixel size 28 × 28 m) covers the needs of this current work, since it provides satisfactory results, as Chaplot already pointed out that there is no reason to use a very accurate DEM to obtain better predictions [52]. Nevertheless, the used DEM cell size in this research is very close to the lower limit (better resolution) that Chaplot used in his work.
Following the aforementioned conceptual logic for evolving the presented integrated methodological framework, it is of equal importance to investigate specific/individual flood phenomena through daily simulations, in order to develop flood design maps, as well as scenarios for protective actions and works against catastrophic events [68]. This investigation also makes sense in relation to climate-change scenarios, as for example a small increase in temperature will lead to an increase in evaporation and consequently a decrease in surface runoff [69].
In the present study, as mentioned above, the assessment of sediment yield that was attributed by the model along with the other results was not taken into consideration in the evaluation process. This is also a parameter that is important to be considered (as long as there are reliable soil data), as it plays a critical role in the reservoir’s operation, in terms of availability of water volume for extraction [70].
In addition, the results of the reservoir simulation can be explored in light of different scenarios regarding changes in the water demand distribution rates per month, as well as different extraction volumes from the reservoir depending on variations in demand. For the second case, comparisons can be made with other research or applied works on reservoir management that use control curves [71].
Another point that could be explored further is the comparison of the produced results for the selected dam locations, with the results of other similar works that relate to the location and size of the reservoir [72]. Also, the size of the dam, compared to more classical methods used for its determination, could be explored additionally [73]. Finally, in the present work, it is possible to measure/quantify the sustainability of the examined reservoirs using a methodology for measuring it with specific indicators, such as resilience, reliability, vulnerability, and relative vulnerability of the project [74].
All previous suggestions aim at improving the reliability, completeness, and predictive ability of the methodology proposed herein and constitute a satisfactory framework for developing an integrated decision-making system. It could be a policy-making tool towards the research and application of sustainable and optimum reservoir construction, in various mountainous and semi-mountainous areas in Greece, but worldwide as well. In this context, research projects funded by national bodies, such as local authorities, aim at advancing local development. It must be also highlighted that in the research project “Utilization of surface runoff in Andros Island via the creation of mountainous water reservoirs” (2009–2014), the possibility of applying the developed methodology in catchments of similar scale in the Aegean islands and beyond was examined, as the application in Andros Island was only a pilot. This project has been accepted by the municipality of Andros and is in the process of finding the necessary funding to implement it.

5. Conclusions

In the present paper, an integrated and contemporary methodological framework, based on geoinformation technologies, was introduced for exploiting surface runoff, by creating small mountain and semi-mountain water reservoirs. With this approach, descriptive and spatial information are coupled in the best possible way, to produce reliable results, which will lead to the adoption of the best and most sustainable practices. The presented methodology can be a part of a general and holistic management framework for viable water resources exploitation. This was demonstrated using as a case study the island of Andros, in Greece. Andros Island (and specifically Afrouses catchment) was selected as the pilot study area for applying the research methodology, due to its specific characteristics of particular interest. The fact that the island experiences sufficient rainfall in the period from September to April, combined with the increased needs of the dry season and the lack of primary meteorological data, led to its selection as the study area (it is considered important to apply this research in areas with limited data adequacy).
Results showed that by using the proposed scheme it is possible to create small water reservoirs, if certain criteria that have been set from the beginning are met. A small prediction uncertainty was present, resulting from the various simulation uncertainty and the assumptions made in some stages of the research. On the other hand, the validation process and the comparative analysis of the results, along with the comparison with similar works found in the literature, managed to minimize (or even eliminate in some cases) these uncertainties. In any case, this research work highlights the need for adopting additional measures to avoid potential failures in the design and/or operation of a small-scale reservoir. Furthermore, it must be mentioned that the results of the presented methodology can be continuously optimized as the data used become more and more reliable.
Taking into consideration all the above, it must be underlined that by selecting the best available sites for constructing small-scale reservoirs, it is easy to create a network of them, using local human resources and materials, thereby creating low-cost projects with high socio-economic benefits in local scale. This is a huge step towards sustainable exploitation of surface runoff and an ideal countermeasure for areas suffering from water scarcity.
In conclusion, the potential that rises by coupling geoinformation technologies, such as GIS, with simulation process modeling offers a potentially promising roadmap towards improving our ability to provide a mathematical representation of our natural environment. As the proposed methodology can be automated to simulate both present and future conditions, it may offer a very promising tool to the scientific and wider community for a better understanding of our dynamically changing physical environment. As such, it could assist research and practical applications alike.

Author Contributions

Conceptualization, E.P.; methodology, E.P., K.K. and A.P.; software, K.K., N.S., A.P., P.L., G.P.P. and C.C.; writing—original draft preparation, K.K., A.P., E.P. and C.C.; writing—review and editing, K.K., N.S., A.P., E.P., P.L., G.P.P. and C.C.; visualization, K.K.; supervision, E.P., K.K.; project administration, E.P.; funding acquisition, E.P. All authors have read and agreed to the published version of the manuscript.

Funding

This research was funded by the Municipality of Andros and by the Region of Southern Aegean.

Acknowledgments

The authors would like to thank the anonymous reviewers for their valuable contribution to this manuscript.

Conflicts of Interest

The authors declare no conflict of interest.

References

  1. Petropoulos, G.P.; Sandric, I.; Hristopulos, D.; Nahum Carlson, T. Evaporative Fluxes and Surface Soil Moisture Retrievals in a Mediterranean Setting from Sentinel-3 and the “Simplified Triangle”. Remote Sens. 2020, 12, 3192. [Google Scholar] [CrossRef]
  2. Stathopoulos, N.; Kalogeropoulos, K.; Polykretis, C.; Skrimizeas, P.; Louka, P.; Karymbalis, E.; Chalkias, C. Introducing flood susceptibility index using remote-sensing data and geographic information systems. In Remote Sensing of Hydrometeorological Hazards; Informa UK Limited: Boca Raton, FL, USA, 2017; pp. 381–400. [Google Scholar]
  3. Stathopoulos, N.; Kalogeropoulos, K.; Chalkias, C.; Dimitriou, E.; Skrimizeas, P.; Louka, P.; Papadias, V. A Robust remote sensing-spatial modeling-remote sensing (R--M--R) approach for flood hazard assessment. In Spatial Modeling in GIS and R for Earth and Environmental Science, 1st ed.; Pourghasemi, H.R., Gokceoglu, C., Eds.; Elsevier: Amsterdam, The Netherlands, 2019; pp. 391–410. [Google Scholar]
  4. Penning-Rowsell, E.C.; Smith, K. Environmental hazards: Assessing risk and reducing disaster. Geogr. J. 1993, 159, 349. [Google Scholar] [CrossRef]
  5. Smith, K. Environmental Hazards; Informa UK Limited: New York, NY, USA, 2009. [Google Scholar]
  6. Maantay, J.A.; Maroko, A. Mapping urban risk: Flood hazards, race, & environmental justice in New York. Appl. Geogr. 2009, 29, 111–124. [Google Scholar] [CrossRef] [PubMed] [Green Version]
  7. Smith, K. Regions of Risk: A Geographical Introduction to Disasters, 1st ed.; Routledge: Abingdon, UK, 2014. [Google Scholar]
  8. Temam, D.; Uddameri, V.; Mohammadi, G.; Hernandez, E.A.; Ekwaro-Osire, S. Long-term drought trends in Ethiopia with implications for dryland agriculture. Water 2019, 11, 2571. [Google Scholar] [CrossRef] [Green Version]
  9. Zhang, J.; Wang, F. Changes in the risk of extreme climate events over East Asia at different global warming levels. Water 2019, 11, 2535. [Google Scholar] [CrossRef] [Green Version]
  10. Reynolds, J.F.; Smith, D.M.S.; Lambin, E.F.; Turner, B.L.; Mortimore, M.J.; Batterbury, S.P.J.; Downing, T.E.; Dowlatabadi, H.; Fernández, R.J.; Herrick, J.E.; et al. Global desertification: Building a science for dryland development. Science 2007, 316, 847–851. [Google Scholar] [CrossRef] [Green Version]
  11. Thomas, R.J. Opportunities to reduce the vulnerability of dryland farmers in Central and West Asia and North Africa to climate change. Agric. Ecosyst. Environ. 2008, 126, 36–45. [Google Scholar] [CrossRef]
  12. Scott, C.A.; El-Naser, H.; Hagan, R.E.; Hijazi, A. Facing water scarcity in Jordan. Water Int. 2003, 28, 209–216. [Google Scholar] [CrossRef]
  13. Konikow, L.F.; Kendy, E. Groundwater depletion: A global problem. Hydrogeol. J. 2005, 13, 317–320. [Google Scholar] [CrossRef]
  14. Wada, Y.; Van Beek, L.P.H.; Van Kempen, C.M.; Reckman, J.W.T.M.; Vasak, S.; Bierkens, M.F.P. Global depletion of groundwater resources. Geophys. Res. Lett. 2010, 37. [Google Scholar] [CrossRef] [Green Version]
  15. Scanlon, B.R.; Faunt, C.C.; Longuevergne, L.; Reedy, R.C.; Alley, W.M.; McGuire, V.L.; McMahon, P.B. Groundwater depletion and sustainability of irrigation in the US High Plains and Central Valley. Proc. Natl. Acad. Sci. USA 2012, 109, 9320–9325. [Google Scholar] [CrossRef] [PubMed] [Green Version]
  16. Ho, L.; Goethals, P.L. Opportunities and challenges for the sustainability of lakes and reservoirs in relation to the Sustainable Development Goals (SDGs). Water 2019, 11, 1462. [Google Scholar] [CrossRef] [Green Version]
  17. Meigh, J. The impact of small farm reservoirs on urban water supplies in Botswana. Nat. Resour. Forum 1995, 19, 71–83. [Google Scholar] [CrossRef]
  18. Wisser, D.; Frolking, S.; Douglas, E.M.; Fekete, B.M.; Schumann, A.H.; Vörösmarty, C.J. The significance of local water resources captured in small reservoirs for crop production-A global-scale analysis. J. Hydrol. 2010, 384, 264–275. [Google Scholar] [CrossRef] [Green Version]
  19. Krol, M.S.; De Vries, M.J.; Van Oel, P.R.; De Araújo, J.C. Sustainability of small reservoirs and large scale water availability under current conditions and climate change. Water Resour. Manag. 2011, 25, 3017–3026. [Google Scholar] [CrossRef] [Green Version]
  20. Mioduszewski, W. Small water reservoirs-their function and construction. J. Water Land Dev. 2012, 17, 45–52. [Google Scholar] [CrossRef] [Green Version]
  21. Mays, L.W.; Antoniou, G.P.; Angelakis, A. History of water cisterns: Legacies and lessons. Water 2013, 5, 1916–1940. [Google Scholar] [CrossRef] [Green Version]
  22. Fowe, T.; Karambiri, H.; Paturel, J.-E.; Poussin, J.-C.; Cecchi, P. Water balance of small reservoirs in the Volta basin: A case study of Boura reservoir in Burkina Faso. Agric. Water Manag. 2015, 152, 99–109. [Google Scholar] [CrossRef]
  23. Chang, C.-H.; Cai, L.-Y.; Lin, T.-F.; Chung, C.-L.; Van Der Linden, L.; Burch, M.D. Assessment of the impacts of climate change on the water quality of a small deep reservoir in a humid-subtropical climatic region. Water 2015, 7, 1687–1711. [Google Scholar] [CrossRef] [Green Version]
  24. Point, P. La Valeur Économique des Hyrosystèmes; Economica: Paris, France, 1999. [Google Scholar]
  25. Helvetas. Cooperation Suisse au Développement, Manuel Technique pour l’ Approvisionnement en Eau des Zones Rurales; SKAT, ATOL: Zurich, Switzerland, 1985. [Google Scholar]
  26. USG. Design of Small Dams; USG Printing Office: Denver, CO, USA, 1965. [Google Scholar]
  27. USDI. Design of Small Dams; Bureau of Reclamation: Denver, CO, USA, 1987. [Google Scholar]
  28. Forzieri, G.; Gardenti, M.; Caparrini, F.; Castelli, F. A methodology for the pre-selection of suitable sites for surface and underground small dams in arid areas: A case study in the region of Kidal, Mali. Phys. Chem. Earth Parts A/B/C 2008, 33, 74–85. [Google Scholar] [CrossRef]
  29. Khayyun, T.S.; Alwan, I.A.; Hayder, A.M. Hydrological model for Hemren dam reservoir catchment area at the middle River Diyala reach in Iraq using ArcSWAT model. Appl. Water Sci. 2019, 9, 133. [Google Scholar] [CrossRef] [Green Version]
  30. Molina-Navarro, E.; Trolle, D.; Martínez-Pérez, S.; Sastre-Merlín, A.; Jeppesen, E. Hydrological and water quality impact assessment of a Mediterranean limno-reservoir under climate change and land use management scenarios. J. Hydrol. 2014, 509, 354–366. [Google Scholar] [CrossRef]
  31. Ghoraba, S.M. Hydrological modeling of the Simly Dam watershed (Pakistan) using GIS and SWAT model. Alex. Eng. J. 2015, 54, 583–594. [Google Scholar] [CrossRef] [Green Version]
  32. Drouart, E.; Vouillamoz, J.M. Alimentation en Eau des Populations Menaces. Hermann Éditeurs des Sciences et des Arts; ACF: Paris, France, 1999. [Google Scholar]
  33. Neitsch, S.L.; Arnold, J.G.; Kiniry, J.R.; Srinivasan, R.; Williams, J.R. Soil and Water Assessment Tool Input/Output File Documentation Version 2005; USDA-ARS, Soil and Water Research Laboratory: Austin, TX, USA, 2004. [Google Scholar]
  34. Zheng, J.; Li, G.-Y.; Han, Z.-Z.; Meng, G.-X. Hydrological cycle simulation of an irrigation district based on a SWAT model. Math. Comput. Model. 2010, 51, 1312–1318. [Google Scholar] [CrossRef]
  35. Kalogeropoulos, K.; Chalkias, C.; Pissias, E.; Karalis, S. Application of the SWAT model for the investigation of reservoirs creation. In Advances in the Research of Aquatic Environment; Springer Science and Business Media LLC: Berlin, Germany, 2011; Volume 2, pp. 71–79. [Google Scholar]
  36. Gioti, E.C.; Riga, K.; Kalogeropoulos, K.; Chalkias, C. A GIS-based flash flood runoff model using high resolution DEM and meteorological data. EARSeL eProceedings 2013, 12, 33–43. [Google Scholar]
  37. Kalogeropoulos, K.; Chalkias, C. Modelling the impacts of climate change on surface runoff in small Mediterranean catchments: Empirical evidence from Greece. Water Environ. J. 2012, 27, 505–513. [Google Scholar] [CrossRef]
  38. Kalogeropoulos, K.; Karalis, S.; Karymbalis, E.; Chalkias, C.; Chalkias, G.; Katsafados, P. Modeling flash floods in Vouraikos River Mouth, Greece. In Proceedings of the MEDCOAST Conference, Marmaris, Turkey, 30 October–3 November 2013; Volume 2, pp. 1135–1146. [Google Scholar]
  39. Kalogeropoulos, K.; Stathopoulos, N.; Psarogiannis, A.; Penteris, D.; Tsiakos, C.; Karagiannopoulou, A.; Krikigianni, E.; Karymbalis, E.; Chalkias, C. A GIS-based method for flood risk assessment. In Proceedings of the European Geosciences Union General Assembly, Vienna, Austria, 17–22 April 2016. [Google Scholar]
  40. Chalkias, N.S.C. Applied Hydrological modeling with the use of geoinformatics: Theory and practice. In Empirical Modeling and Its Applications; IntechOpen: Rijeka, Croatia, 2016; pp. 61–86. [Google Scholar]
  41. Tsanakas, K.; Gaki-Papanastassiou, K.; Kalogeropoulos, K.; Chalkias, C.; Katsafados, P.; Karymbalis, E. Investigation of flash flood natural causes of Xirolaki Torrent, Northern Greece based on GIS modeling and geomorphological analysis. Nat. Hazards 2016, 84, 1015–1033. [Google Scholar] [CrossRef]
  42. Jin, X.; Jin, Y. Calibration of a distributed hydrological model in a data-scarce basin based on GLEAM datasets. Water 2020, 12, 897. [Google Scholar] [CrossRef] [Green Version]
  43. Leng, M.; Yu, Y.; Wang, S.; Zhang, Z. Simulating the hydrological processes of a meso-scale watershed on the Loess Plateau, China. Water 2020, 12, 878. [Google Scholar] [CrossRef] [Green Version]
  44. Senent-Aparicio, J.; Alcalá, F.J.; Liu, S.; Jimeno-Sáez, P. Coupling SWAT Model and CMB Method for modeling of high-permeability bedrock basins receiving interbasin groundwater flow. Water 2020, 12, 657. [Google Scholar] [CrossRef] [Green Version]
  45. Abbas, S.A.; Xuan, Y. Impact of precipitation pre-processing methods on hydrological model performance using high-resolution gridded dataset. Water 2020, 12, 840. [Google Scholar] [CrossRef] [Green Version]
  46. Liu, Y.; Cui, G.; Li, H. Optimization and application of snow melting modules in SWAT model for the alpine regions of Northern China. Water 2020, 12, 636. [Google Scholar] [CrossRef] [Green Version]
  47. Chen, Q.; Chen, H.; Wang, J.; Zhao, Y.; Chen, J.; Xu, C.-Y. Impacts of climate change and land-use change on hydrological extremes in the Jinsha river basin. Water 2019, 11, 1398. [Google Scholar] [CrossRef] [Green Version]
  48. Hotchkiss, R.H.; Jorgensen, S.F.; Stone, M.C.; Fontaine, T.A. Regulated river modeling for climate change impact assessment: The Missouri river1. JAWRA J. Am. Water Resour. Assoc. 2000, 36, 375–386. [Google Scholar] [CrossRef]
  49. Srinivasan, R.; Zhang, X.; Arnold, J.G. SWAT Ungauged: Hydrological budget and crop yield predictions in the upper Mississippi river basin. Trans. ASABE 2010, 53, 1533–1546. [Google Scholar] [CrossRef]
  50. Wagner, P.D.; Kumar, S.; Fiener, P.; Schneider, K. Technical note: Hydrological modeling with SWAT in a monsoon-driven environment: Experience from the Western Ghats, India. Trans. ASABE 2011, 54, 1783–1790. [Google Scholar] [CrossRef]
  51. Stathopoulos, N.; Skrimizeas, P.; Kalogeropoulos, K.; Louka, P.; Tragaki, A. Statistical analysis and spatial correlation of rainfall in Greece for a 20-year time period. In Proceedings of the EasyChair Preprints; EasyChair: Manchester, UK, 2019. [Google Scholar]
  52. Chaplot, V. Impact of DEM mesh size and soil map scale on SWAT runoff, sediment, and NO3–N loads predictions. J. Hydrol. 2005, 312, 207–222. [Google Scholar] [CrossRef]
  53. Jacobs, J.; Angerer, J.; Vitale, J.; Shrinivasan, R.; Kaitho, R. Mitigating economic damage in Kenya’s upper Tana river basin: An application of Arc-View SWAT. J. Spat. Hydrol. 2007, 7, 23–46. [Google Scholar]
  54. Milewski, A.; Sultan, M.; Yan, E.; Becker, R.; Abdeldayem, A.; Soliman, F.; Gelil, K.A. A remote sensing solution for estimating runoff and recharge in arid environments. J. Hydrol. 2009, 373, 1–14. [Google Scholar] [CrossRef]
  55. Schäuble, H.; Marinoni, O.; Hinderer, M. A GIS-based method to calculate flow accumulation by considering dams and their specific operation time. Comput. Geosci. 2008, 34, 635–646. [Google Scholar] [CrossRef]
  56. Shimelis, G.; Ragahavan, S.; Bijan, D. Hydrological modelling in the lake Tana basin, Ethiopia using SWAT model. Open Hydrol. J. 2008, 2, 49–62. [Google Scholar]
  57. Nash, J.E.; Sutcliffe, J.E. River flow forecasting through conceptual models: Part I: A dis-cussion of principles. J. Hydrol. 1970, 10, 282–290. [Google Scholar] [CrossRef]
  58. Bouraoui, F.; Benabdallah, S.; Jrad, A.; Bidoglio, G. Application of the SWAT model on the Medjerda river basin (Tunisia). Phys. Chem. Earth Parts A/B/C 2005, 30, 497–507. [Google Scholar] [CrossRef]
  59. Pissias, V.; Psarogiannis, A.; Kalogeropoulos, K. Water savings-A necessity in a changing environment. The case of small reservoirs. In Proceedings of the WIN4life International Conference, Tinos, Greece, 19–21 September 2013. [Google Scholar]
  60. Green, C.H.; Van Griensven, A. Autocalibration in hydrologic modeling: Using SWAT2005 in small-scale watersheds. Environ. Model. Softw. 2008, 23, 422–434. [Google Scholar] [CrossRef]
  61. Kannan, N.; White, S.; Worrall, F.; Whelan, M. Sensitivity analysis and identification of the best evapotranspiration and runoff options for hydrological modelling in SWAT-2000. J. Hydrol. 2007, 332, 456–466. [Google Scholar] [CrossRef]
  62. Bourletsikas, A.; Baltas, E.; Mimikou, M. Rainfall-runoff modeling for an experimental watershed of Western Greece using extended time-area method and GIS. J. Spat. Hydrol. 2006, 6, 1. [Google Scholar]
  63. Finch, J. Monitoring small dams in semi-arid regions using remote sensing and GIS. J. Hydrol. 1997, 195, 335–351. [Google Scholar] [CrossRef]
  64. Wu, K.; Johnston, C.A. Hydrologic response to climatic variability in a Great Lakes Watershed: A case study with the SWAT model. J. Hydrol. 2007, 337, 187–199. [Google Scholar] [CrossRef]
  65. Ficklin, D.L.; Luo, Y.; Luedeling, E.; Zhang, M. Climate change sensitivity assessment of a highly agricultural watershed using SWAT. J. Hydrol. 2009, 374, 16–29. [Google Scholar] [CrossRef]
  66. Ullrich, A.; Volk, M. Application of the Soil and Water Assessment Tool (SWAT) to predict the impact of alternative management practices on water quality and quantity. Agric. Water Manag. 2009, 96, 1207–1217. [Google Scholar] [CrossRef]
  67. Muttiah, R.S.; Wurbs, R.A. Scale-dependent soil and climate variability effects on watershed water balance of the SWAT model. J. Hydrol. 2002, 256, 264–285. [Google Scholar] [CrossRef]
  68. Ko, C.; Cheng, Q. GIS spatial modeling of river flow and precipitation in the Oak Ridges Moraine area, Ontario. Comput. Geosci. 2004, 30, 379–389. [Google Scholar] [CrossRef]
  69. Frederick, K.D.; Major, D.C. Climate change and water resources. Clim. Chang. 1997, 37, 7–23. [Google Scholar] [CrossRef]
  70. Mixon, D.M.; Kinner, D.A.; Stallard, R.F.; Syvitski, J.P. Geolocation of man-made reservoirs across terrains of varying complexity using GIS. Comput. Geosci. 2008, 34, 1184–1197. [Google Scholar] [CrossRef]
  71. Adeloye, A.; Psarogiannis, A.; Montaseri, M. Improved heuristic reservoir operation using control curves incorporating the vulnerability norm, Water Resources Systems-Hydrological Risk, Management and Development. In Proceedings of The Symposium HS02b held during IUGG2003 at Sapporo, July 2003. IAHS Publ. 2003, 281, 192–199. [Google Scholar]
  72. Sawunyama, T.; Senzanje, A.; Mhizha, A. Estimation of small reservoir storage capacities in Limpopo River Basin using geographical information systems (GIS) and remotely sensed surface areas: Case of Mzingwane catchment. Phys. Chem. Earth Parts A/B/C 2006, 31, 935–943. [Google Scholar] [CrossRef]
  73. Furnans, J.; Austin, B. Hydrographic survey methods for determining reservoir volume. Environ. Model. Softw. 2008, 23, 139–146. [Google Scholar] [CrossRef]
  74. Loucks, D.P. Quantifying trends in system sustainability. Hydrol. Sci. J. 1997, 42, 513–530. [Google Scholar] [CrossRef]
Figure 1. The study area, the Afrouses catchment and the finally selected dam site (Afrouses catchment).
Water 12 03182 g001
Figure 2. The conceptual scheme of the research.
Water 12 03182 g002
Figure 3. A flowchart summarizing the main steps of the proposed methodology.
Water 12 03182 g003
Figure 4. Spatial Data for the SWAT simulation: (a) DEM, (b) Andros Land Cover Map, (c) Andros Lithology Map.
Water 12 03182 g004
Figure 5. Afrouses catchment, dam location scenarios and corresponding reservoirs, (a) 3D perspective, (b) 2D perspective.
Water 12 03182 g005
Figure 6. Dam location scenario 1: (a) land cover, (b) permeability, (c) slopes (%).
Water 12 03182 g006
Figure 7. Dam location scenario 2: (a) land cover, (b) permeability, (c) slopes (%).
Water 12 03182 g007
Figure 8. Measurements with current meter and the installed meteorological station.
Water 12 03182 g008
Figure 9. Simulation failure rate (%) for (a) the first selected dam site and (b) the second dam selected site, based on the results of the Reservoir Simulation Software (V50 stands for 50,000 m3 of annual volume extraction, V100 for 100,000 m3 of annual volume extraction, etc.).
Water 12 03182 g009
Figure 10. The Pareto front for the second dam site.
Water 12 03182 g010
Table 1. The Primary data of the methodology.
TypeDetailsSource
DEMRaster (28 × 28 m pixel size)Advanced Spaceborne Thermal Emission and Reflection Radiometer Global Digital Elevation Model (Aster GDEM)
Land coverVector (initial analog map scale 1:5000)Greek Ministry of Agriculture
HydrolithologyVector (initial analog map scale 1:50,000)Institute of Geology and Mineral Exploration
Meteorological data (rainfall, temperature, wind, solar radiation)TablesHellenic National Meteorological Service
Table 2. Level-Area-Volume data for the level-area Curve for the selected sites.
First SiteSecond Site
LevelAreaVolume (Between)Total VolumeLevelAreaVolume (Between)Total Volume
(m a.s.l.)(m2)(m3)(m3)(m a.s.l.)(m2)(m3)(m3)
520013520420021280
52467649881352424106474522128
528181810,2486340428266218,0129580
532330617,68816,588432634434,52827,592
536553829,57834,27643610,92054,10662,120
5409251 63,85444016,133 116,226
Table 3. SWAT results for the first year of simulation for the first selected site (scenario 1).
UNIT WATERSED
TIMEPRECSURQLATQGWQSWETPETYIELDYIELD
(month)(mm)(mm)(mm)(mm)(mm)(mm)(mm)(mm)(t/ha)
177.13025.57052.621849.1625.570
290.580.1652.180.4572.2211.1118.0652.790.03
373.81032.274.3968.6438.4170.936.660
47.501.64.4950.2824.26140.36.090
57.5301.582.2119.5236.7106.553.790
62.88000.462.4919.91132.960.460
72.58000.180.744.33129.020.180
83.1400.10.070.343.44112.270.160
910.8703.040.020.557.6184.923.070
1023.1706.90.012.0114.8286.326.910
1189.68040.68026.4324.5875.5440.680
12218.60.87117.811.6466.335.75116.8120.320.17
2020607.461.03281.7213.9266.3238.94122.81296.660.2
Where PREC: Precipitation, SURQ: Surface runoff, LATQ: Lateral inflow, GWQ: Base runoff, SW: Amount of water in soil profile, ET: Actual Evapotranspiration, PET: Potential Evapotranspiration, SED YIELD: Sediment yield.
Table 4. SWAT results for the first year of simulation for the second selected site (scenario 2).
UNIT WATERSED
TIMEPRECSURQLATQGWQSWETPETYIELDYIELD
(month)(mm)(mm)(mm)(mm)(mm)(mm)(mm)(mm)(t/ha)
177.130.0026.120.0052.1017.9849.2026.120.00
290.580.1553.060.4371.3211.0517.9953.630.03
373.810.0032.784.1367.7438.3270.8336.910.00
47.500.001.644.2149.5924.03140.325.850.00
57.530.001.612.0821.0434.47106.233.700.00
62.880.000.000.432.7621.16132.640.430.00
72.580.000.000.170.744.60128.730.170.00
83.140.000.100.060.353.43111.970.160.00
910.870.003.120.020.627.4884.683.140.00
1023.170.007.060.011.9914.7486.297.070.00
1189.680.0041.570.0025.7324.3775.6541.580.00
12218.600.81119.781.5565.4735.44117.11122.130.16
2020607.460.95286.8413.0965.47237.071121.64300.870.19
Table 5. Statistical evaluation indicators of the model.
Mean (mm)Std (mm)
Measurements24575
Simulation238 *63
Nash–Sutcliffe coefficient0.79
R20.85
* This simulated flow value (runoff) corresponds to the specific measured time period (in situ), namely September 2009 to September 2013.
Publisher’s Note: MDPI stays neutral with regard to jurisdictional claims in published maps and institutional affiliations.

