Article

Impact of the Mean Daily Air Temperature Calculation on the Rainfall-Runoff Modelling

Faculty of Civil and Geodetic Engineering, University of Ljubljana, 1000 Ljubljana, Slovenia
*
Author to whom correspondence should be addressed.
Water 2020, 12(11), 3175; https://doi.org/10.3390/w12113175
Submission received: 12 October 2020 / Revised: 12 November 2020 / Accepted: 12 November 2020 / Published: 13 November 2020
(This article belongs to the Special Issue Modelling Hydrologic Response of Non­-homogeneous Catchments)

Abstract

:
Conceptual rainfall-runoff models besides precipitation and discharge data generally require estimates of the mean daily air temperature as input data. For the estimation of the mean daily air temperature, there are different methods available. The paper presents an evaluation of the impact of the mean daily air temperature calculation on the rainfall-runoff modelling results. Additionally, other measured variables and rating curve uncertainty were assessed. Differences in the mean daily air temperature values were evaluated for the 33 meteorological stations in Slovenia and additional investigations were conducted for four selected meso-scale catchments located in different climates. The results of the application of four equations for the mean air temperature calculation yielded the mean absolute error values between 0.56–0.80 °C. However, the results of rainfall-runoff modelling showed that these differences had an almost negligible impact on the model results. Differences in the mean simulated discharge values were no larger than 1%, while differences in the maximum discharge values were a bit larger, but did not exceed 5%. A somewhat larger impact on the model results was observed when precipitation and water level measurements’ uncertainty was included. However, among all analysed input data uncertainties, the rating curve uncertainty can be regarded as the most influential with differences in the simulated mean discharge values in the range of 3% and differences in the maximum discharge values up to 14%.

1. Introduction

In recent decades, numerous rainfall-runoff models have been developed [1,2]. These types of models can be used for various applications such as water management, engineering design, climate change studies, risk management, etc. [3,4,5,6,7]. Precipitation and discharge data are the main input variables in all types of rainfall-runoff models. In addition, some model types such as conceptual (i.e., storage-based) rainfall-runoff models also require other input data such as potential evapotranspiration [2]. Numerous equations are available for estimating potential evapotranspiration, and, among them, some of the simplest ones require only air temperature data and a station location to calculate potential evapotranspiration [8]. In addition, models with an included snow module also require air temperature data to account for snow accumulation and melting processes since temperature is the main driver of snow-rain partition [2,4,9,10]. Furthermore, it should be noted that some models also require minimum and maximum air temperature values. For example, the Soil and Water Assessment Tool (SWAT) model requires mean daily minimum and maximum air temperatures for the individual month [11].
Since rainfall-runoff models are very often run on the daily time scale [2], estimates of mean daily air temperature are required as input data. For the estimation of the mean daily air temperature, there are different approaches based on hourly data, maximum and minimum daily temperatures, or on manual air temperature measurements at certain hours [12,13,14,15,16,17,18]. Although previous studies showed that, in most cases, mean daily air temperature values using different equations yield similar long-term mean values [12,13]. Additionally, some studies have investigated the effect of the potential evapotranspiration time step (i.e., temporally varying or same seasonally variable) on the rainfall-runoff model results and shown that the use of temporally varying potential evapotranspiration did not yield systematic model improvements [19]. No significant differences in the estimation of the annual potential evapotranspiration were detected when studying the effect of the climate data time step [20]. However, other studies showed that the differences in extreme values can be relatively large when using different air temperature estimates [16]. In addition, small differences can also lead to relatively large deviations when daily air temperature data are used for specific applications such as the calculation of the winter wheat development rate [12]. Therefore, it is not clear how different mean daily air temperature estimates based on different equations affect the results of the rainfall-runoff modelling with the conceptual hydrological model. Although it could be concluded from the results of the previous studies [19] that the impact will not be significant, it is worth doing this modelling exercise since the differences in the air temperature estimates at a daily time step can be relatively significant [13,18] and this could affect some of the important modelled processes such as snow melting or snow accumulation that depend on air temperature threshold values. Moreover, it is also interesting to compare this impact with other sources of uncertainty related to the rainfall-runoff modelling such as measurement errors.
Therefore, the main objective of this study was to evaluate the influence of the mean daily air temperature values calculated using different equations on the results of the rainfall-runoff modelling. More specifically, the next research questions were investigated: (i) whether there are any tested methods (equations) for the mean air temperature calculation, which outperforms others and it is possible to identify a geographical pattern, (ii) what influence the mean daily air temperature has on the results of the rainfall-runoff modelling using a conceptual model with and without snow module, and (iii) whether the influence of temperature is greater than the influence of the measurement errors.

2. Data and Methods

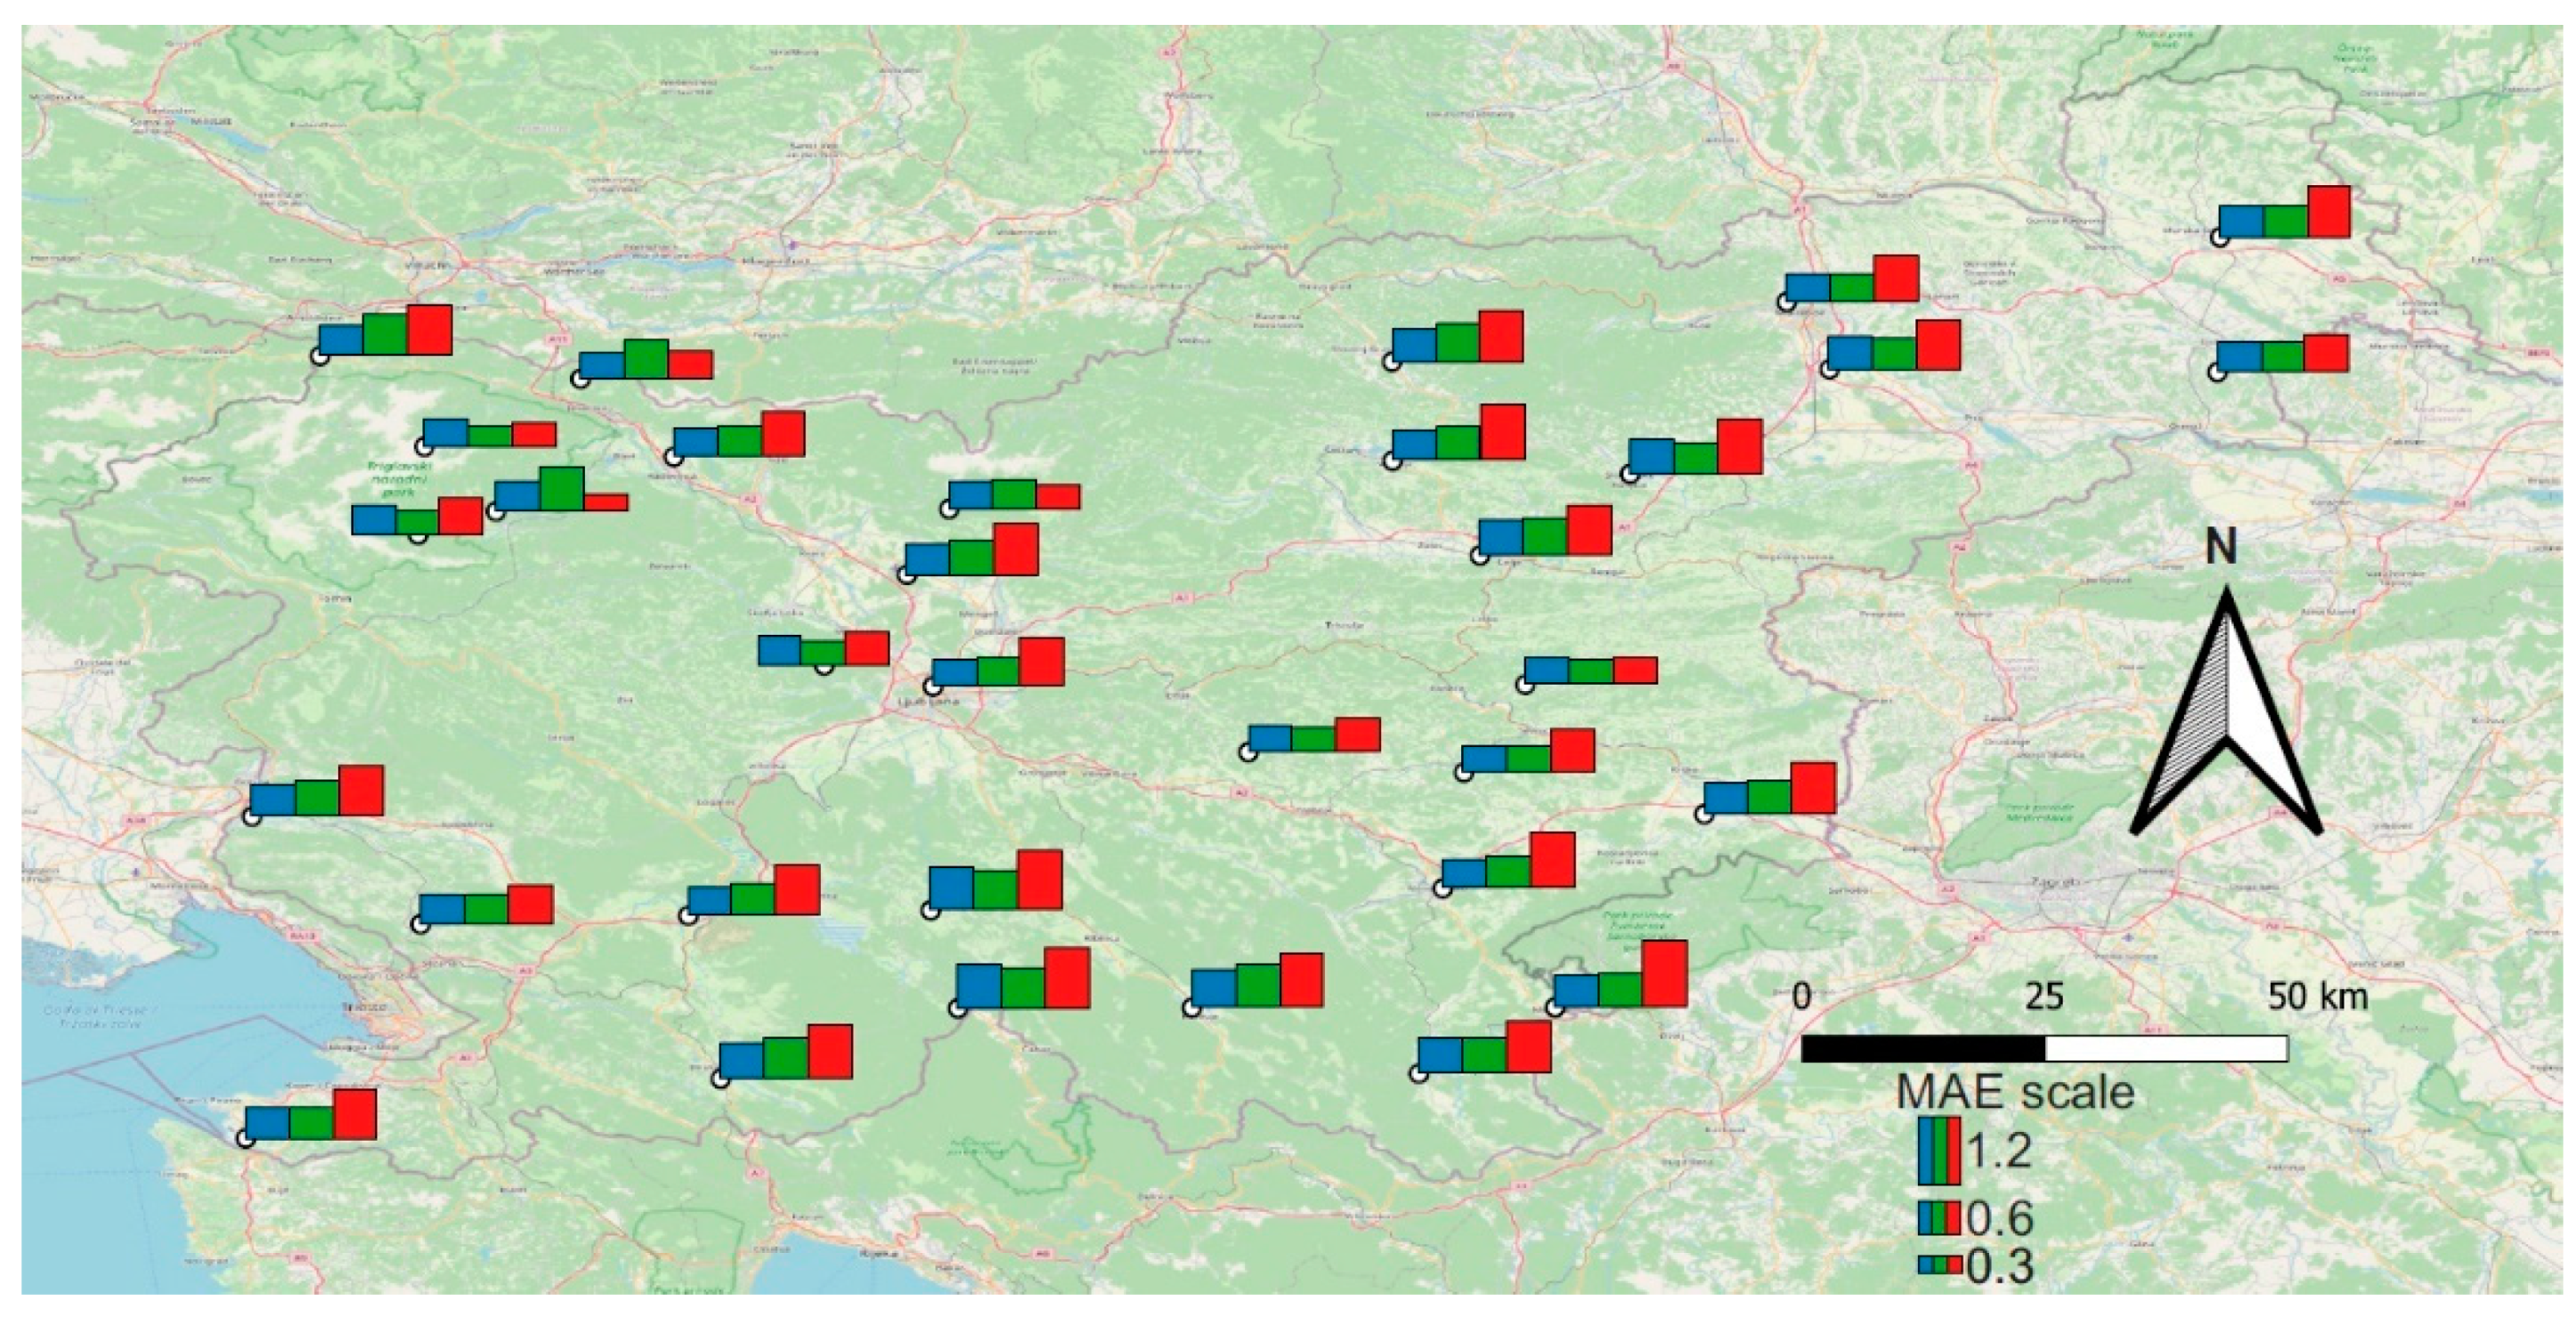
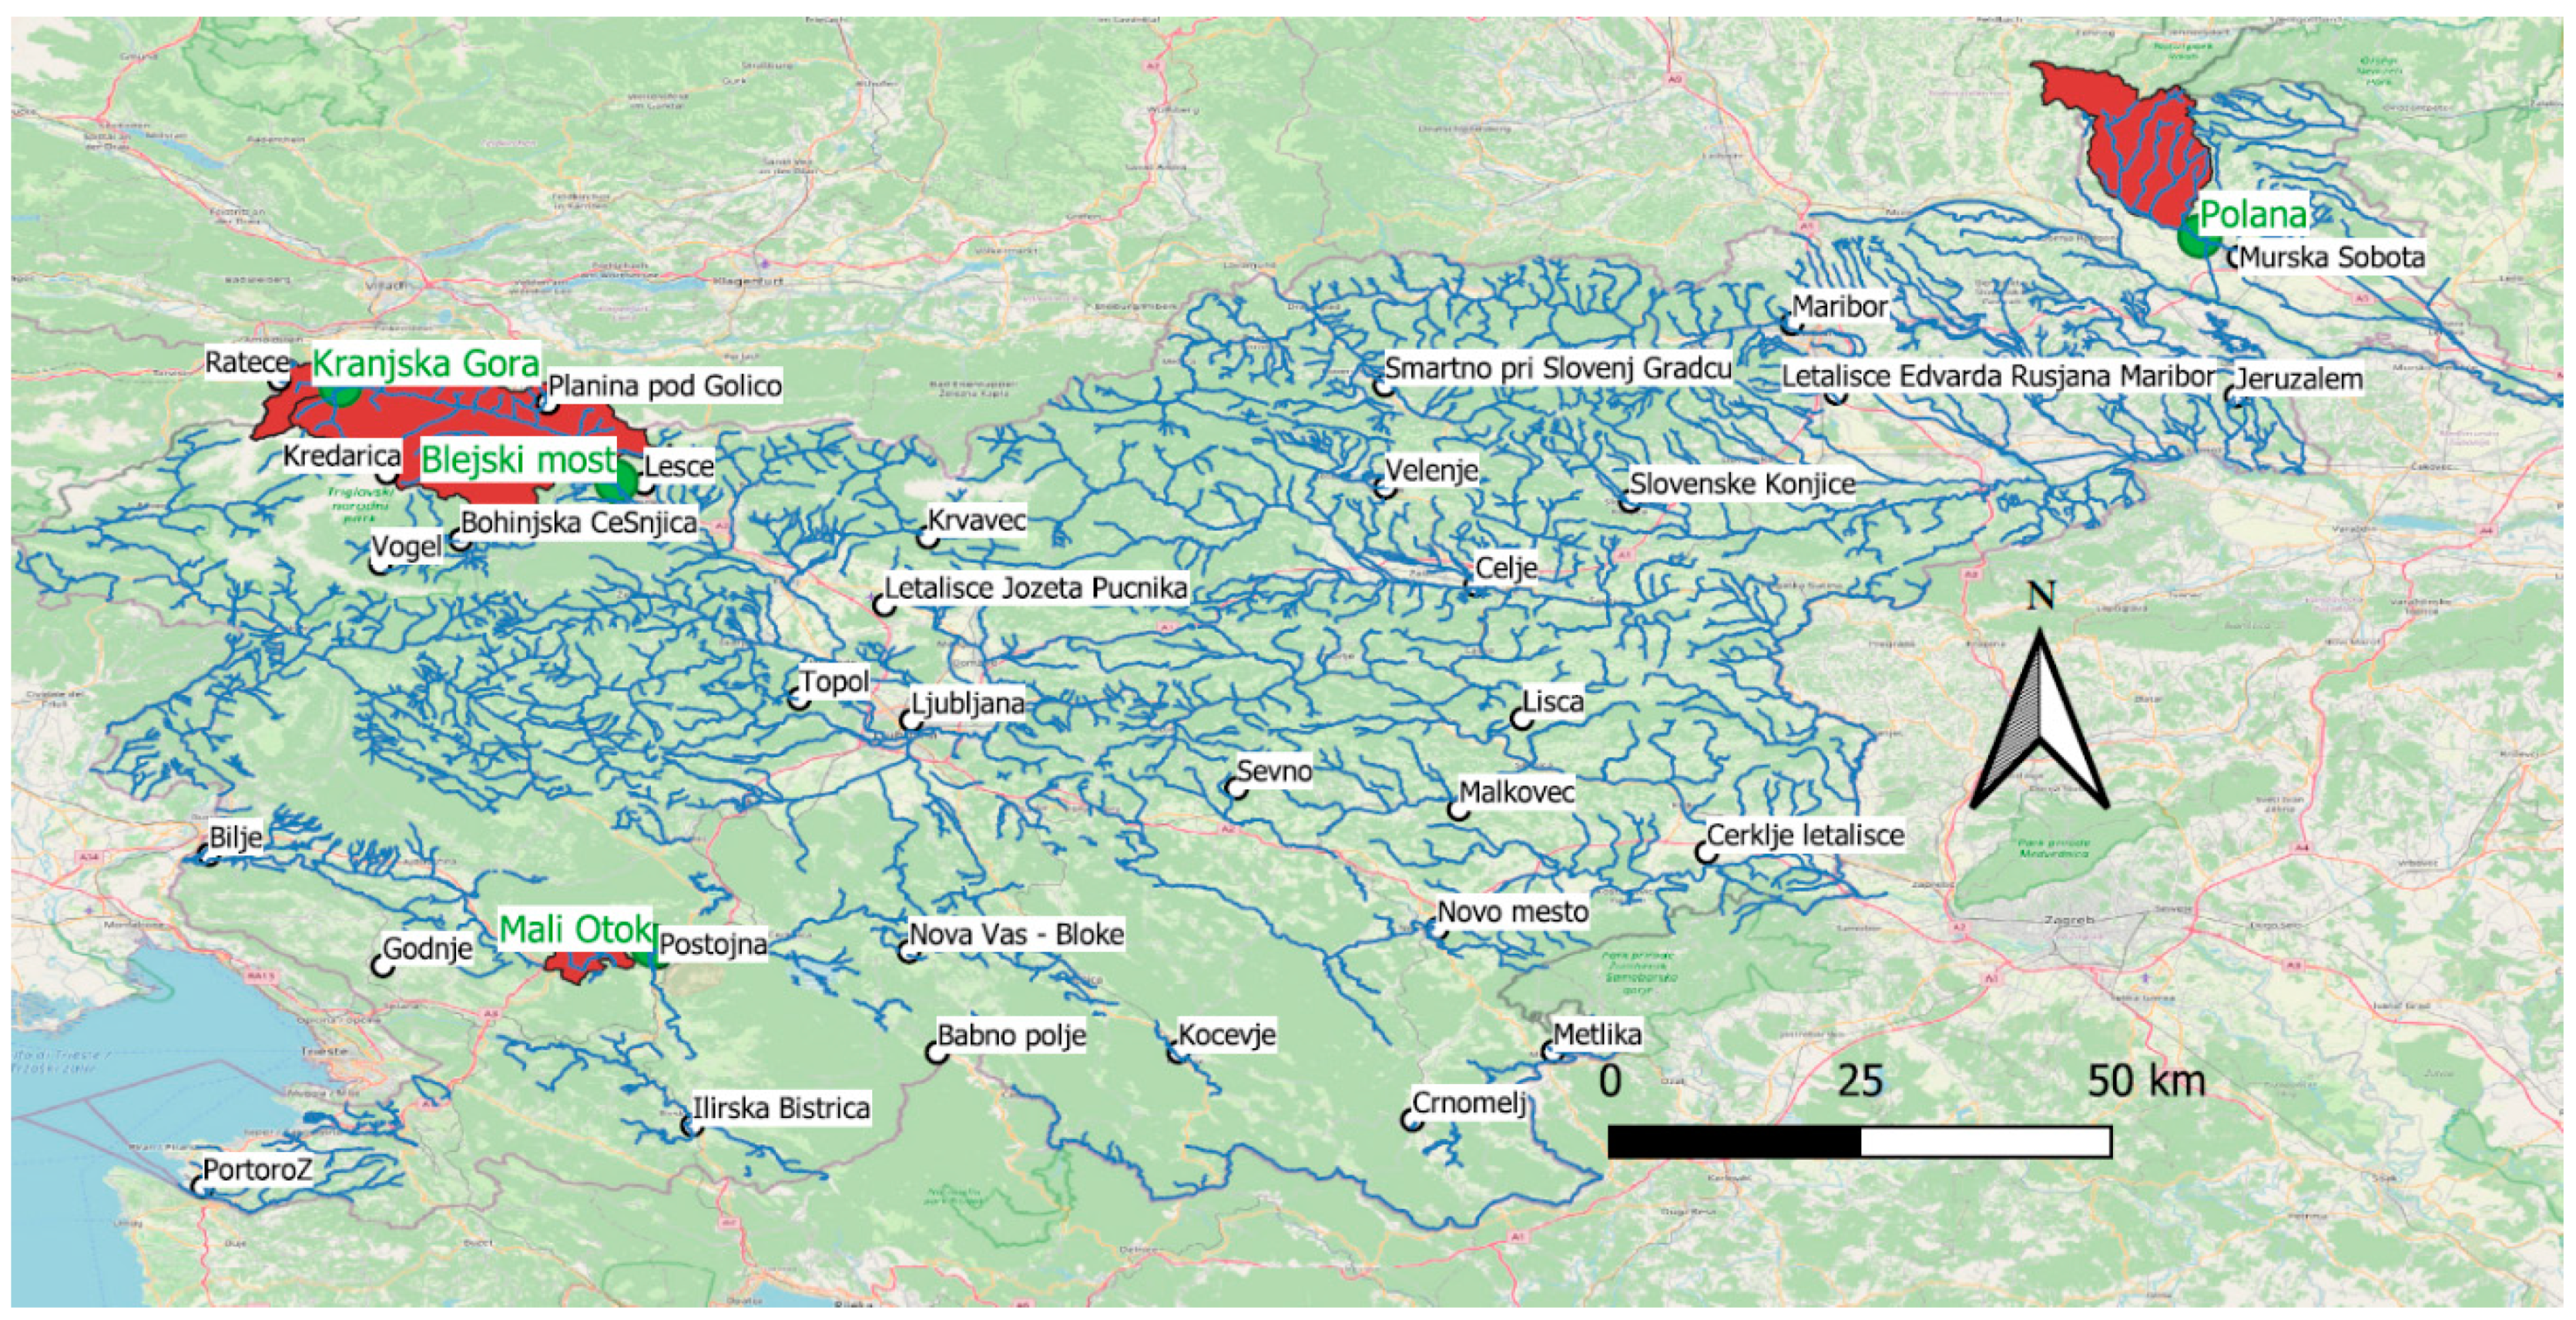
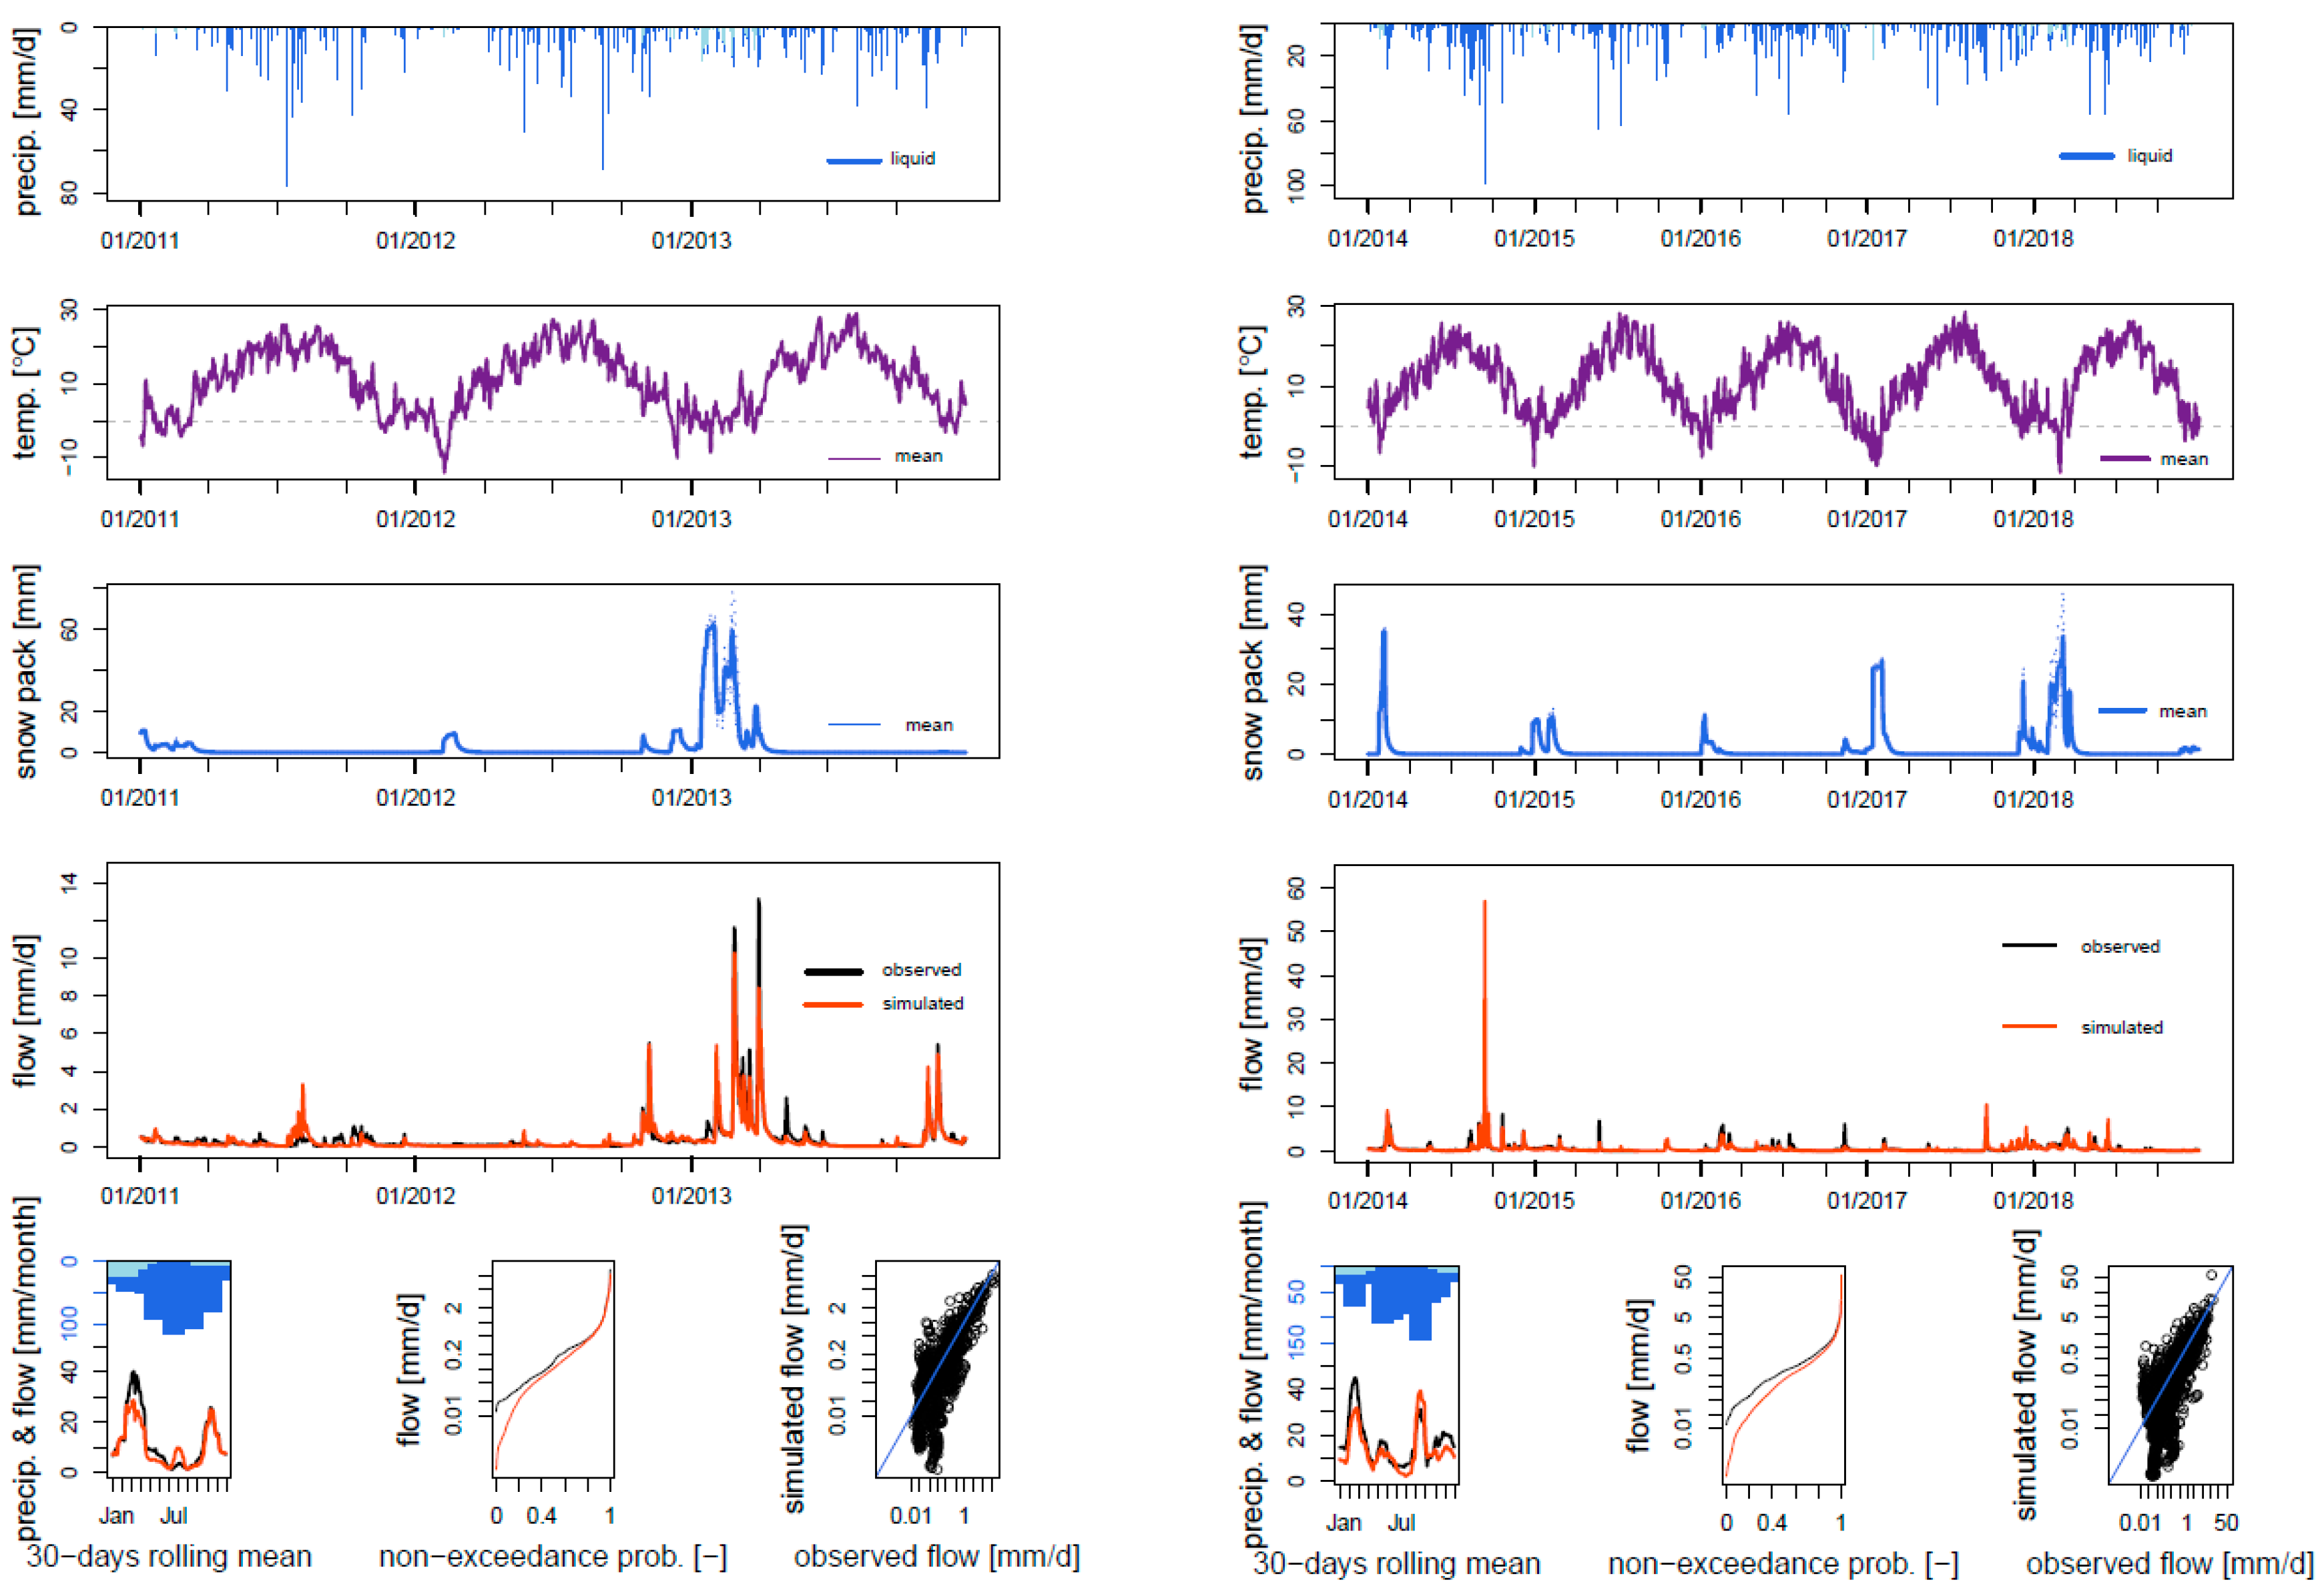
2.1. Data and Study Area

As an input data, hourly air temperature measurements conducted at 2 m height using the Vaisala QMT103 temperature probe were used [21]. Period from 1 January, 2010 until 31 May, 2020 was applied in the study. Measurements were conducted at 33 locations in Slovenia performed in the scope of the Slovenian Environment Agency monitoring (Figure 1). For 20 stations, the complete data period was available, and, for the other 13 stations, 5 to 7 years of data were available. Stations elevation ranged from 2 m a.s.l. (i.e., Portorož station) to 2513 m a.s.l. (i.e., Kredarica station). Additional information about the climate types in Slovenia can be found in Dolšak et al. [22]. Based on the hourly air temperature measurements, the mean daily air temperature data was calculated using the next four equations [13].
T 0 = i = 1 24 T i / 24
T 1 = ( T 7 + T 14 + 2 × T 21 ) / 4
T 2 = ( T MAX + T MIN ) / 2
T 3 = ( T 7 + T 13 + 2 × T 19 ) / 4
where Ti, TMAX, and TMIN are hourly air temperature values, and maximum and minimum daily air temperature values, respectively. Moreover, T7, T13, T14, T19, and T21 are hourly air temperature values measured at 7:00, 13:00, 14:00, 19:00, and 21:00, respectively. According to Conner and Foster (2008), the T0 (Equation (1)) was selected as the “true” mean daily air temperature in this study and deviations between the Equations (1) and (2), Equations (1)–(3), and Equations (1)–(4) were evaluated. Mean Absolute Error (MAE) was applied for this purpose. It should be noted that many other equations for the estimation of the mean daily air temperature can also be found in the literature [12]. Additional information about the origin of different equations and regions, where these are mostly used can be found in the existing literature [12,13,16,18,23,24]. It should be noted that Equation (2) is the one that is the most frequently used in Slovenia for calculating the mean daily air temperature. In this case, manual readings at 7:00, 14:00, and 21:00 are used as an input and not continuous hourly measurements. Some historical background of various equations that can be used to calculate the mean daily air temperature is provided by Conner and Foster [23]. Most of the equations used today originated more than 100 years ago and are based on the assumptions and knowledge of that time [23].
In order to evaluate the impact of the equation used for the mean daily air temperature calculations on the rainfall-runoff modelling results, four meso-scale catchments in Slovenia were selected (Figure 1 and Table 1). These were selected on the basis of the availability of discharge and precipitation data and with the aim of selecting catchments with one meteorological station, which is relatively representative for the whole catchment, so as not to introduce additional uncertainty due to spatial interpolation. It should be noted that using only one station per catchment may not be appropriate for the description of the spatial rainfall patterns. However, since the aim of the study was not to set up the best possible model but to evaluate the impact of the daily air temperature on the modelling results, it can be argued that such an assumption can be considered acceptable. However, spatial interpolation of rainfall may introduce additional uncertainty that could affect the modelling results. Additionally, catchments in different climate zones were selected. For example, the two nested catchments of Sava Dolinka are located in the Alpine climate, while the catchments of Ledava and Nanoščica are located in a temperate continental climate [22].

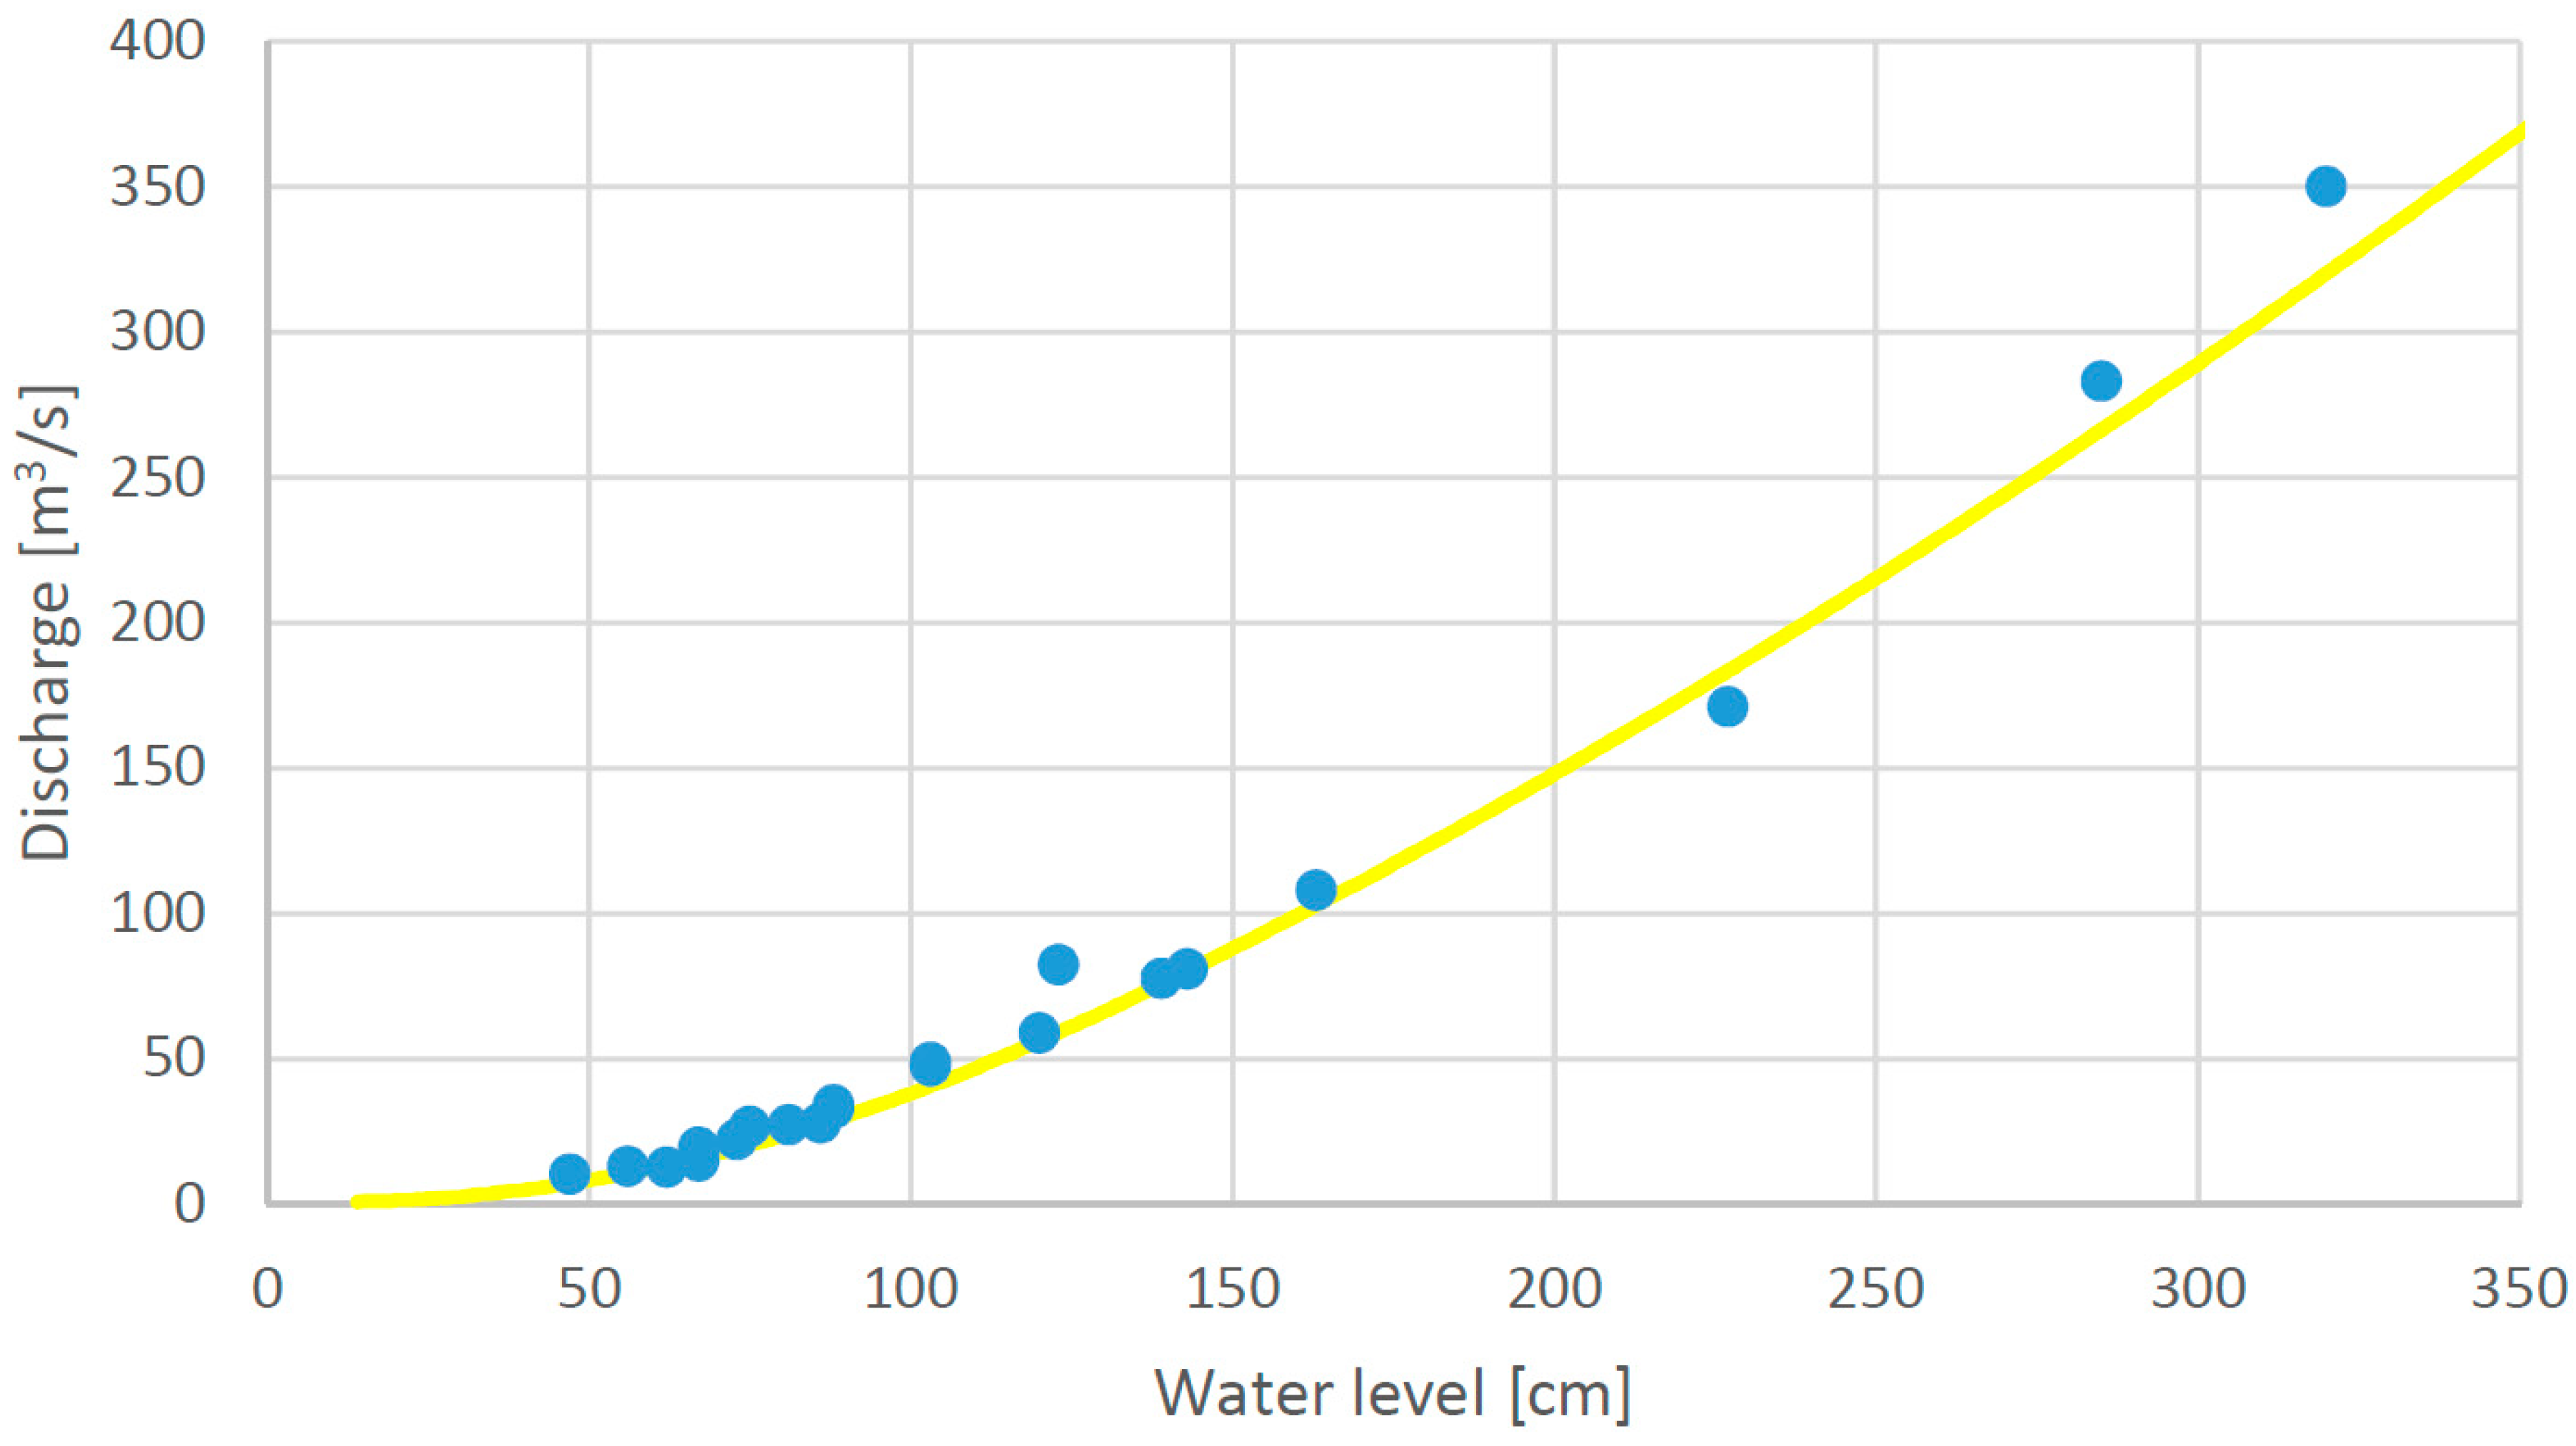
2.2. Hydrological Modelling

For the hydrological rainfall-runoff modelling, the Génie Rural à 4 paramètres Journalier (GR4J) and the enhanced model versions GR6J and CemaNeige GR6J were selected [25,26,27,28]. Detailed description of the models is provided in the existing literature [4,9,25,26,27]. The required input data used by the GR4J and GR6J models are precipitation and potential evapotranspiration, while discharge data is needed for model calibration and performance evaluation [25,27,28]. Moreover, the CemaNeige GR6J model also requires air temperature data and a catchment hypsometric curve in order to account for the snow accumulation and melting [4,9]. In this study, the potential evapotranspiration was calculated using the equation proposed by Oudin et al. [8] based on the daily air temperature data and station location. In case of the GR4J and GR6J models, the impact of the daily air temperature equation was evaluated through the potential evapotranspiration calculation, while, in case of the CemaNeige GR6J model, the daily air temperature data was used directly in the snow module as well as for the potential evapotranspiration calculations. The period of 2010–2013 was used for calibration of all applied rainfall-runoff models (i.e., GR4J, GR6J, and CemaNeige GR6J) with a one-year warm-up period (i.e., year 2010) and 2014–2018 was used for the models’ performance evaluation. A method proposed by Michel (1991) was applied for rainfall-runoff model calibration [26,28,29]. The Root Mean Square Error (RMSE) criteria was used in the process of model calibration [26,28]. For all four selected catchments, the impact of different equations (Equations (1)–(4)) for the mean daily air temperature calculation was evaluated for the GR4J, GR6J, and CemaNeige GR6J models using the previously described approach. Additionally, for the Blejski otok station on the Sava Dolinka river, we also evaluated the impact of other parameters on the model results, namely the impact of the model performance criteria for the model calibration, where Nash-Sutcliffe (NSE), Kling-Gupta (KGE), and updated Kling-Gupta (KGE2) criteria were used [30,31,32]. The impact of the warm-up period length, where half a year and a two years’ warm-up was applied during the calibration period. Additionally, the impact on the measurements and rating curve uncertainty was analysed.

2.3. Measurement Error of the Model Input Data

Measurement error impact on the rainfall-runoff modelling was evaluated and compared to the impact of the selected equation for the calculation of the mean daily air temperature. All the calculations were performed for the Blejski otok station on the Sava Dolinka river, while the Rateče station was used as a reference meteorological station for this catchment. Air temperature measurements were conducted using the Vaisala QMT103 sensor, where the performance of this sensor in terms of accuracy conforms to the ¼ DIN 43760B standard [21]. This means that the air temperature T measurement error is ± ( 0.3 4 + 0.005 × | T | / 4 ) , which is approximately ± 0.1 °C in the case that air temperature ranges between −20 °C to +30 °C. Additionally, rainfall measurements were conducted using Pluvio 250 (i.e., Pluvio 1) sensor manufactured by OTT. Reported manufacturer error is ± 2 % [33]. In the extensive comparison of rain gauges, Wauben [34] indicated that OTT Pluvio 250 error is generally close to the reported values by the manufacturer (sometimes a bit larger), but the total precipitation is within the ± 0.5 % . Thus, this value was also considered in further investigations in the scope of this paper. Furthermore, water level measurements at the Blejski station are conducted using VEGAPULS 67 radar, whose reported accuracy is ± 2   mm [35]. Additionally, water level measurements are also conducted using the OTT pressure level sensor PLS, whose reported accuracy is ± 0.05   % [36]. Since measurements from both sensors are combined to determine the discharge values, the ± 0.1 % accuracy was used for further investigations. All measurements were performed in the scope of the Slovenian Environment Agency monitoring.
Additionally, discharge and water level measurements used to construct the rating curve were also obtained from the Slovenian Environment Agency. The standard error of the estimate was calculated using the next equation [37].
S e ( Q ) = t × [ [ Q i Q c Q c × 100 ] 2 N 2 ]
where Qi is the discharge measurement, Qc is the corresponding discharge taken from the rating curve, N is the number of discharge measurements, and t is Student’s t correction at the 95% confidence level, which is around 2 for 20 or more measurements [37].
The impact of the measurement error on the rainfall-runoff modelling results was accounted using normal distribution, which can be used to estimate random uncertainty [37]. This means that a randomly generated error, which is within the range of the reported sensor accuracy was added to the measurement. The procedure was repeated 100 times and the hydrological model was consequently run 100 times using different input data changed according to randomly generated errors. For example, in the case of precipitation time series, a randomly generated value within the range of ± 0.5 % was added to every measurement. Four different cases were investigated: (i) only an air temperature (T) error was considered, (ii) both air temperature and a precipitation (P) error were considered, (iii) air temperature, precipitation, and the discharge (Q) error were considered and (iv) air temperature, precipitation, discharge, and the rating curve (RC) error were considered.

3. Results and Discussion

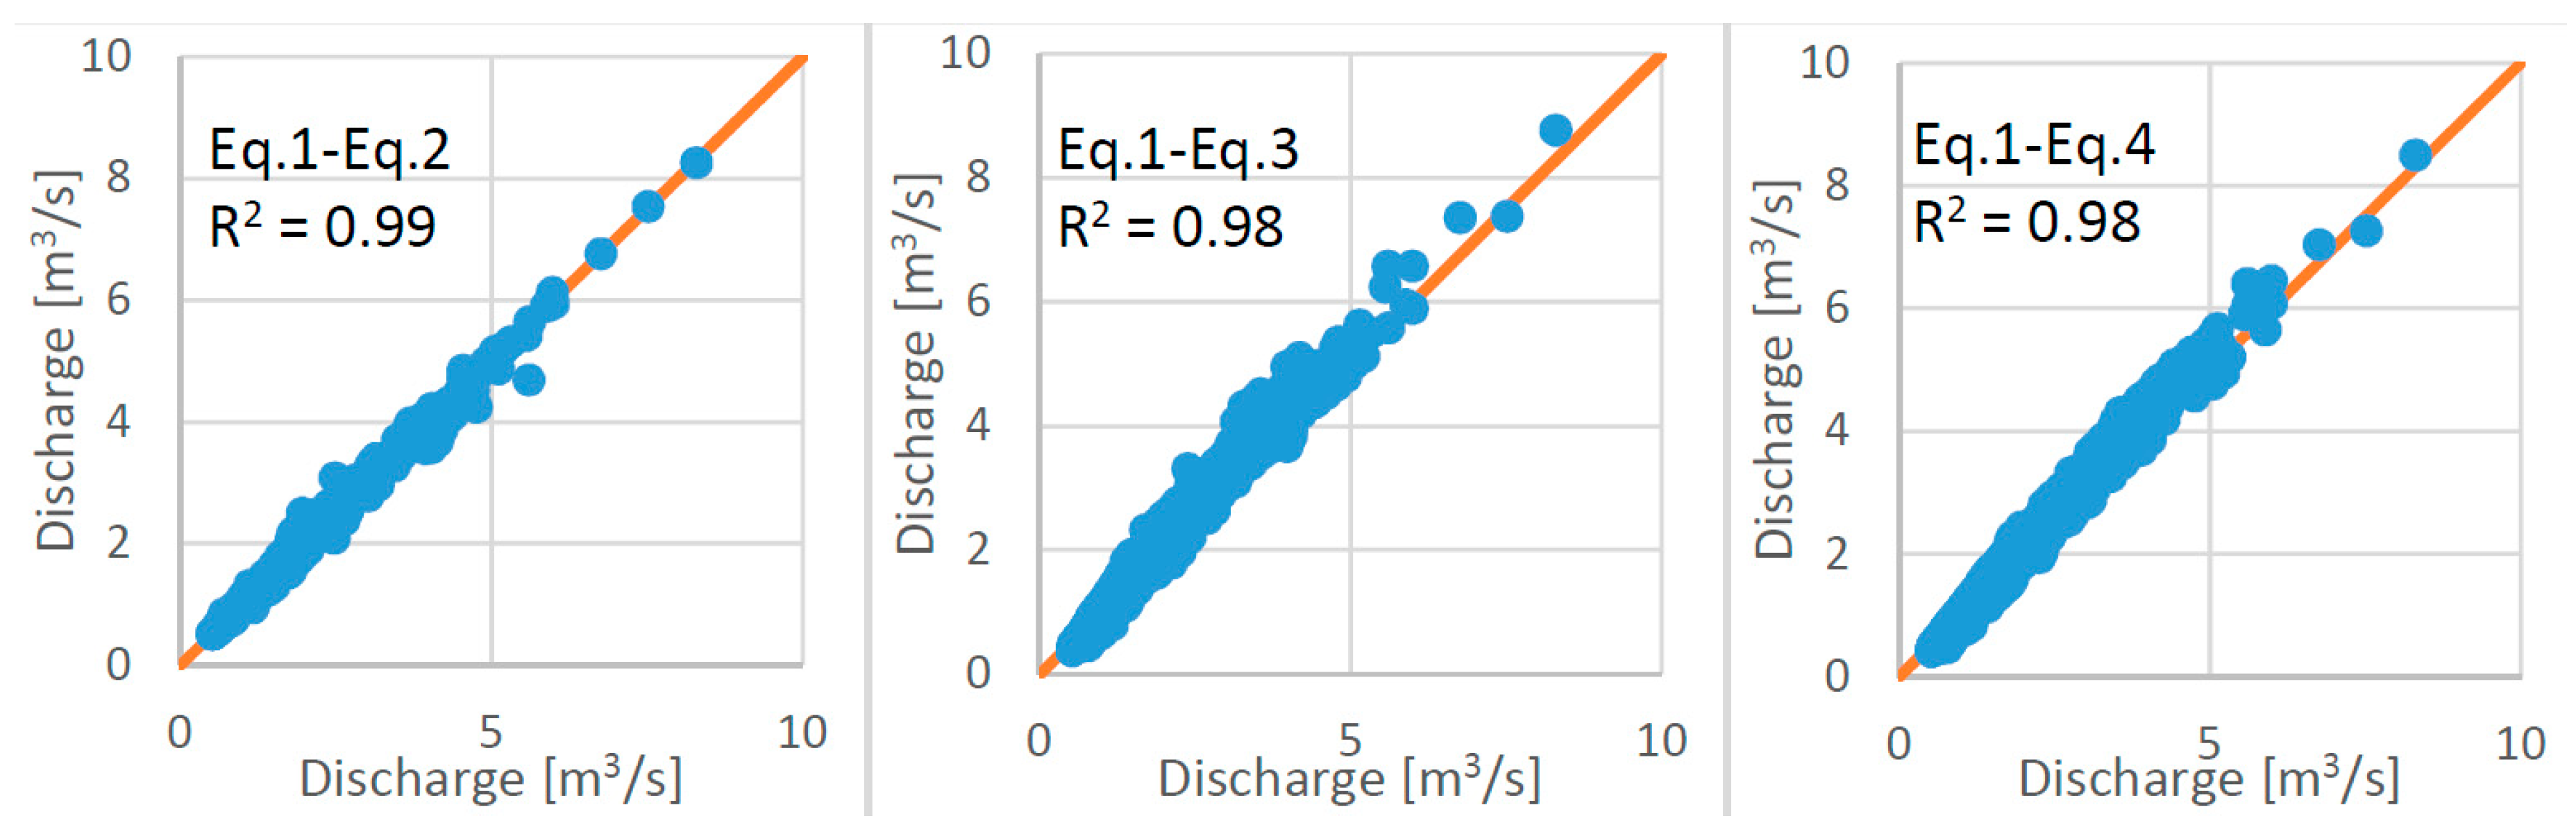
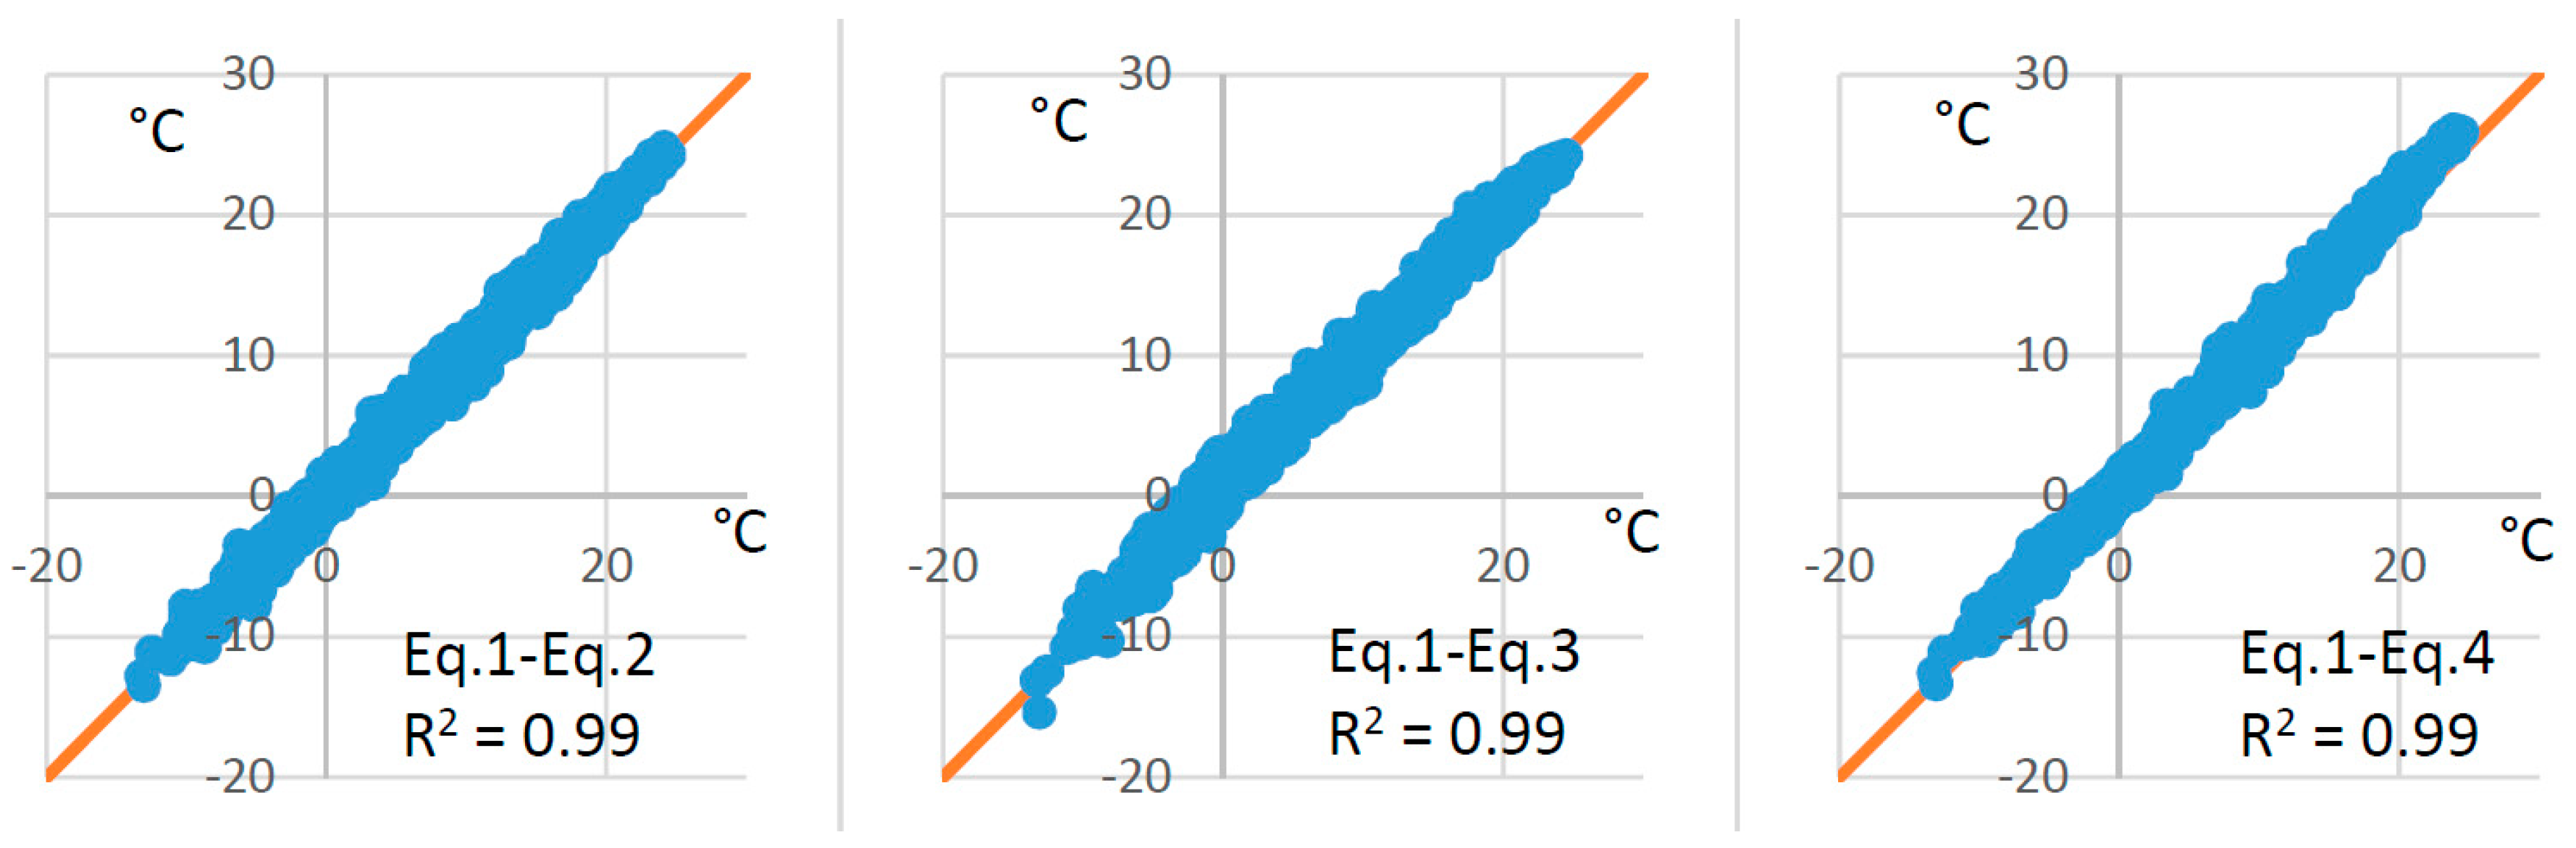
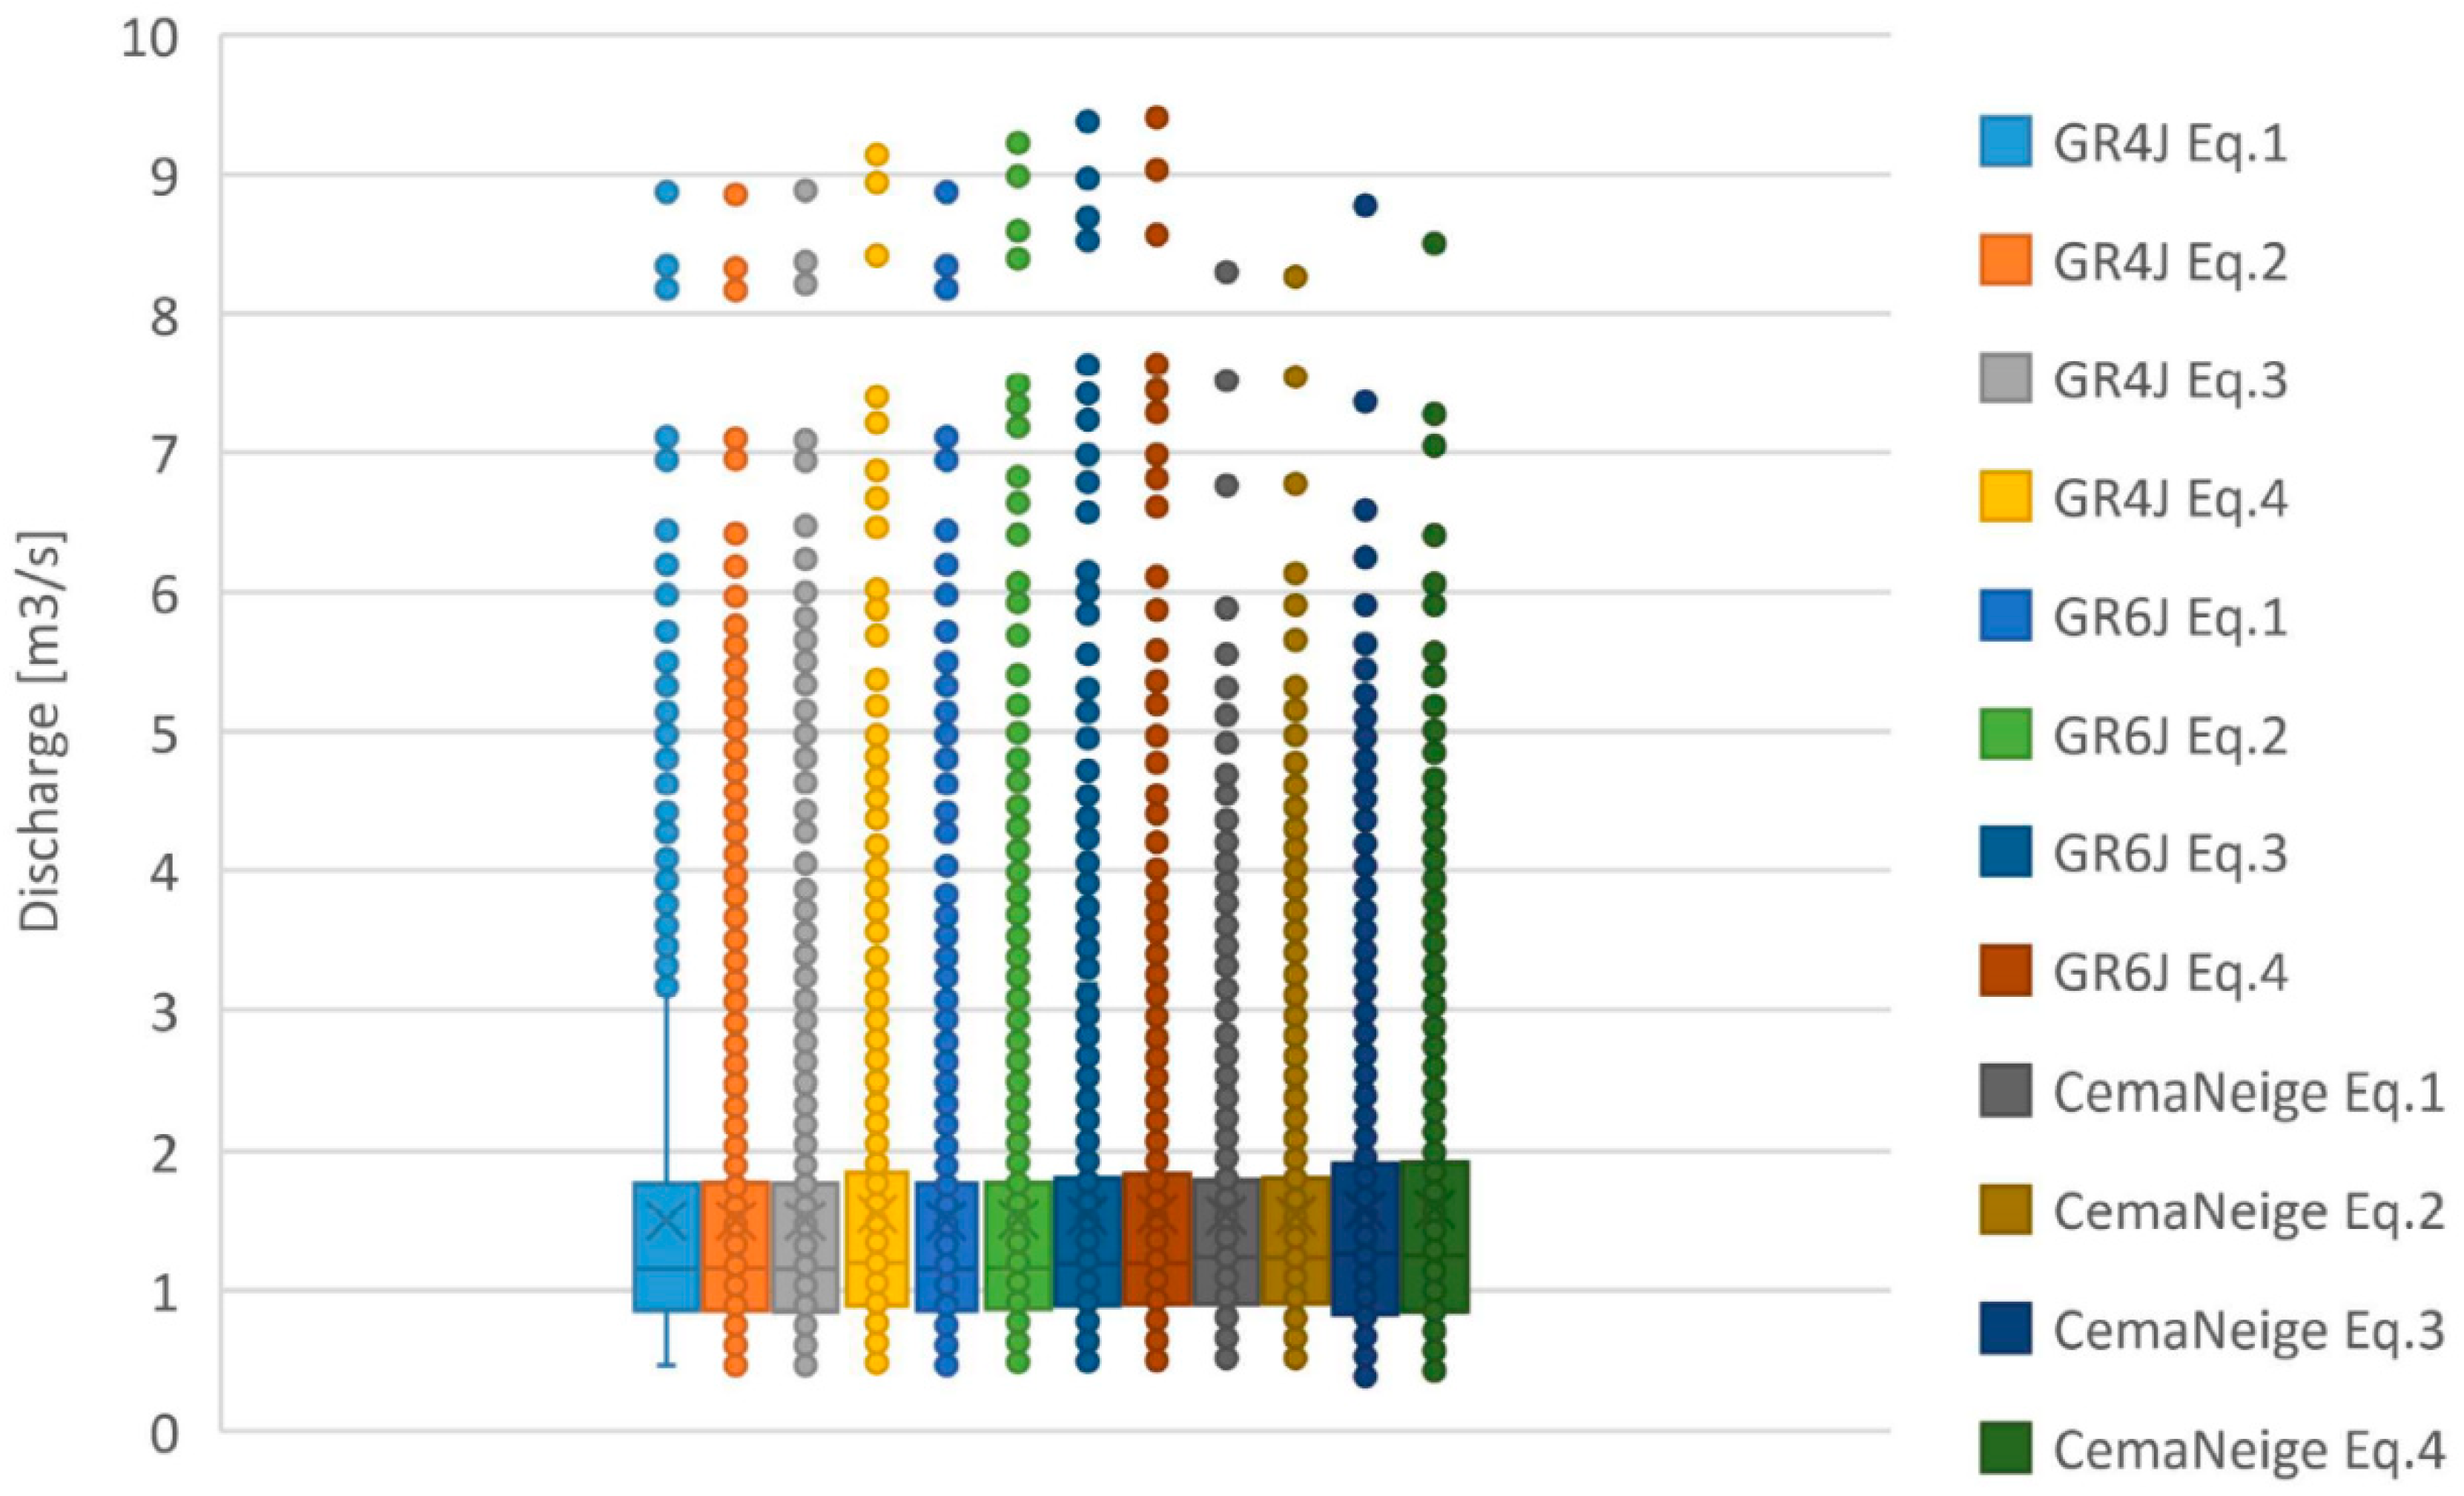
3.1. Mean Daily Air Temperature Calculation Using Multiple Equations

In the first step of the study, the differences in the mean daily air temperature values derived using different equations were calculated (Figure 2). One can notice that Equations (2) and (3) yielded relatively similar MAE values (Figure 2). More specifically, for Equation (2), the MAE values ranged from 0.46 to 0.78 °C with a mean value of 0.56 °C. Moreover, for Equation (3), the MAE values ranged from 0.36 to 0.78 °C with a mean value of 0.58 °C. On the other hand, Equation (4) yielded larger MAE values that ranged from 0.29 to 1.19 °C with a mean value of 0.80 °C. Similarly, Bonacci et al. [13] found that Equations (2) and (3) yielded better performance than Equation (4) for the Zagreb meteorological station in Croatia. However, different results were obtained for the other two analysed stations in Croatia. Additionally, Weiss and Hays [12] emphasized that there was relatively good agreement between tested methods and Equation (1) based on the Root Mean Square Error (RMSE) values. Similar results were obtained in this study based on the MAE criterion. Furthermore, it can also be seen that, on average, all three applied equations overestimated the daily air temperature values derived using Equation (1). This overestimation was the largest in the case of Equation (4) (i.e., mean 0.63 °C), followed by Equation (3) (i.e., mean 0.22 °C) and Equation (2) (i.e., mean 0.02 °C). Similarly, Villarini et al. [16] pointed out that the equation, based on the average of minimum and maximum daily temperature overestimates, the daily values for up to 10% when focusing on extreme values. Additionally, the results of the study also demonstrate that there is no clear geographical pattern in the outperformance of a specific equation in Slovenia (Figure 2). Furthermore, it should be noted that these results are more important for the historical periods when the hourly data were not available and daily air temperature was calculated using one of the equations Equations (2)–(4) (e.g., Equation (2) in Slovenia). Thus, using hourly measurements enables one to investigate possible errors before the period of hourly measurements.

3.2. Impact of the Mean Daily Air Temperature on the Rainfall-Runoff Modelling Results

In the next step of the study, we investigated how differences in daily air temperature values (Section 3.1) affect the results of the rainfall-runoff modelling. The modelling was carried out for four selected catchments using three model versions (i.e., GR4J, GR6J, and CemaNeige GR6J). The first step was the model calibration, and Figure 3 shows an example of the calibration and validation performance for the Polana station on the Ledava river using the CemaNeige GR6J model. A similar model performance was achieved for the other three catchments. Furthermore, simulation of the snow accumulation and melting can be regarded as acceptable based on climatic characteristics while taking into consideration the fact that no measured information about this variable was available. It should be noted that the main objective was not to achieve optimal model performance, but to evaluate the impact of the mean daily air temperature on the rainfall-runoff results using a model with acceptable performance. We are aware of the fact that the performance of the models could be improved by including additional stations with precipitation and air temperature data and a better description of the spatial precipitation and air temperature patterns. The performance of the tested models using different equations for mean daily air temperature estimates are shown in Table 2. The performance of models for individual catchment is almost exactly the same no matter which equation was used for the mean daily air temperature estimates. The same is true for the range of simulated discharge data (Figure 4). In most cases, there are greater differences between the models (e.g., GR4J and CemaNeige GR6J) than between different input mean daily air temperature values based on considered equations (Table 2 and Figure 4). This is especially the case for the GR4J and GR6J models where air temperature is used to calculate the potential evapotranspiration (Figure 4). It should be noted that, for the other three investigated catchments, the differences between the GR4J and GR6J model results using different input data (i.e., Equations (1)–(4)) were even smaller than in the case of the Kranjska Gora station, presented in Figure 4. More specifically, the differences in the mean discharge values were, in the majority of the cases, less than 1%. In two cases, the differences were up to 2%. Furthermore, the largest differences in the simulated mean discharge values were observed for the CemaNeige GR6J model for the Kranjska Gora station on the Sava Dolinka river in case of using Equations (1) and (4) for mean air temperature estimates (Figure 4 and Figure 5). In this case, the difference in the mean discharge was around 3% (i.e., 1.58 m3/s and 1.53 m3/s for the Equation (4) and (1), respectively). Furthermore, somewhat larger differences were obtained for maximum simulated values in case results using Equation (1) are compared with the rainfall-runoff models results using Equations (2)–(4). More specifically, in some cases, the differences were within the range of 5% but mostly in the range of 1%–2%. The differences in the mean daily air temperature values using Equations (1)–(4) were within the range of 5% (i.e., for the 2014–2018 period) (Figure 6). Moreover, the differences in the maximum daily air temperature values derived using different equations (i.e., Equations (1)–(4)) for stations that are used for the rainfall-runoff modelling (i.e., Rateče, Postojna, Murska Sobota) were within the range of 8% (Figure 6). Therefore, it is clear that rainfall-runoff process minimizes the differences in the mean daily air temperature data since precipitation is the main input variable (i.e., compare the scatter shown in Figure 5 and Figure 6). Thus, these differences in the rainfall-runoff model results can be regarded as relatively small, especially if one considers uncertainty of rainfall-runoff modelling results related to the parameters’ estimation or model structural uncertainty [38,39]. Additionally, the next section discusses the impact of other factors on the rainfall-runoff modelling results.

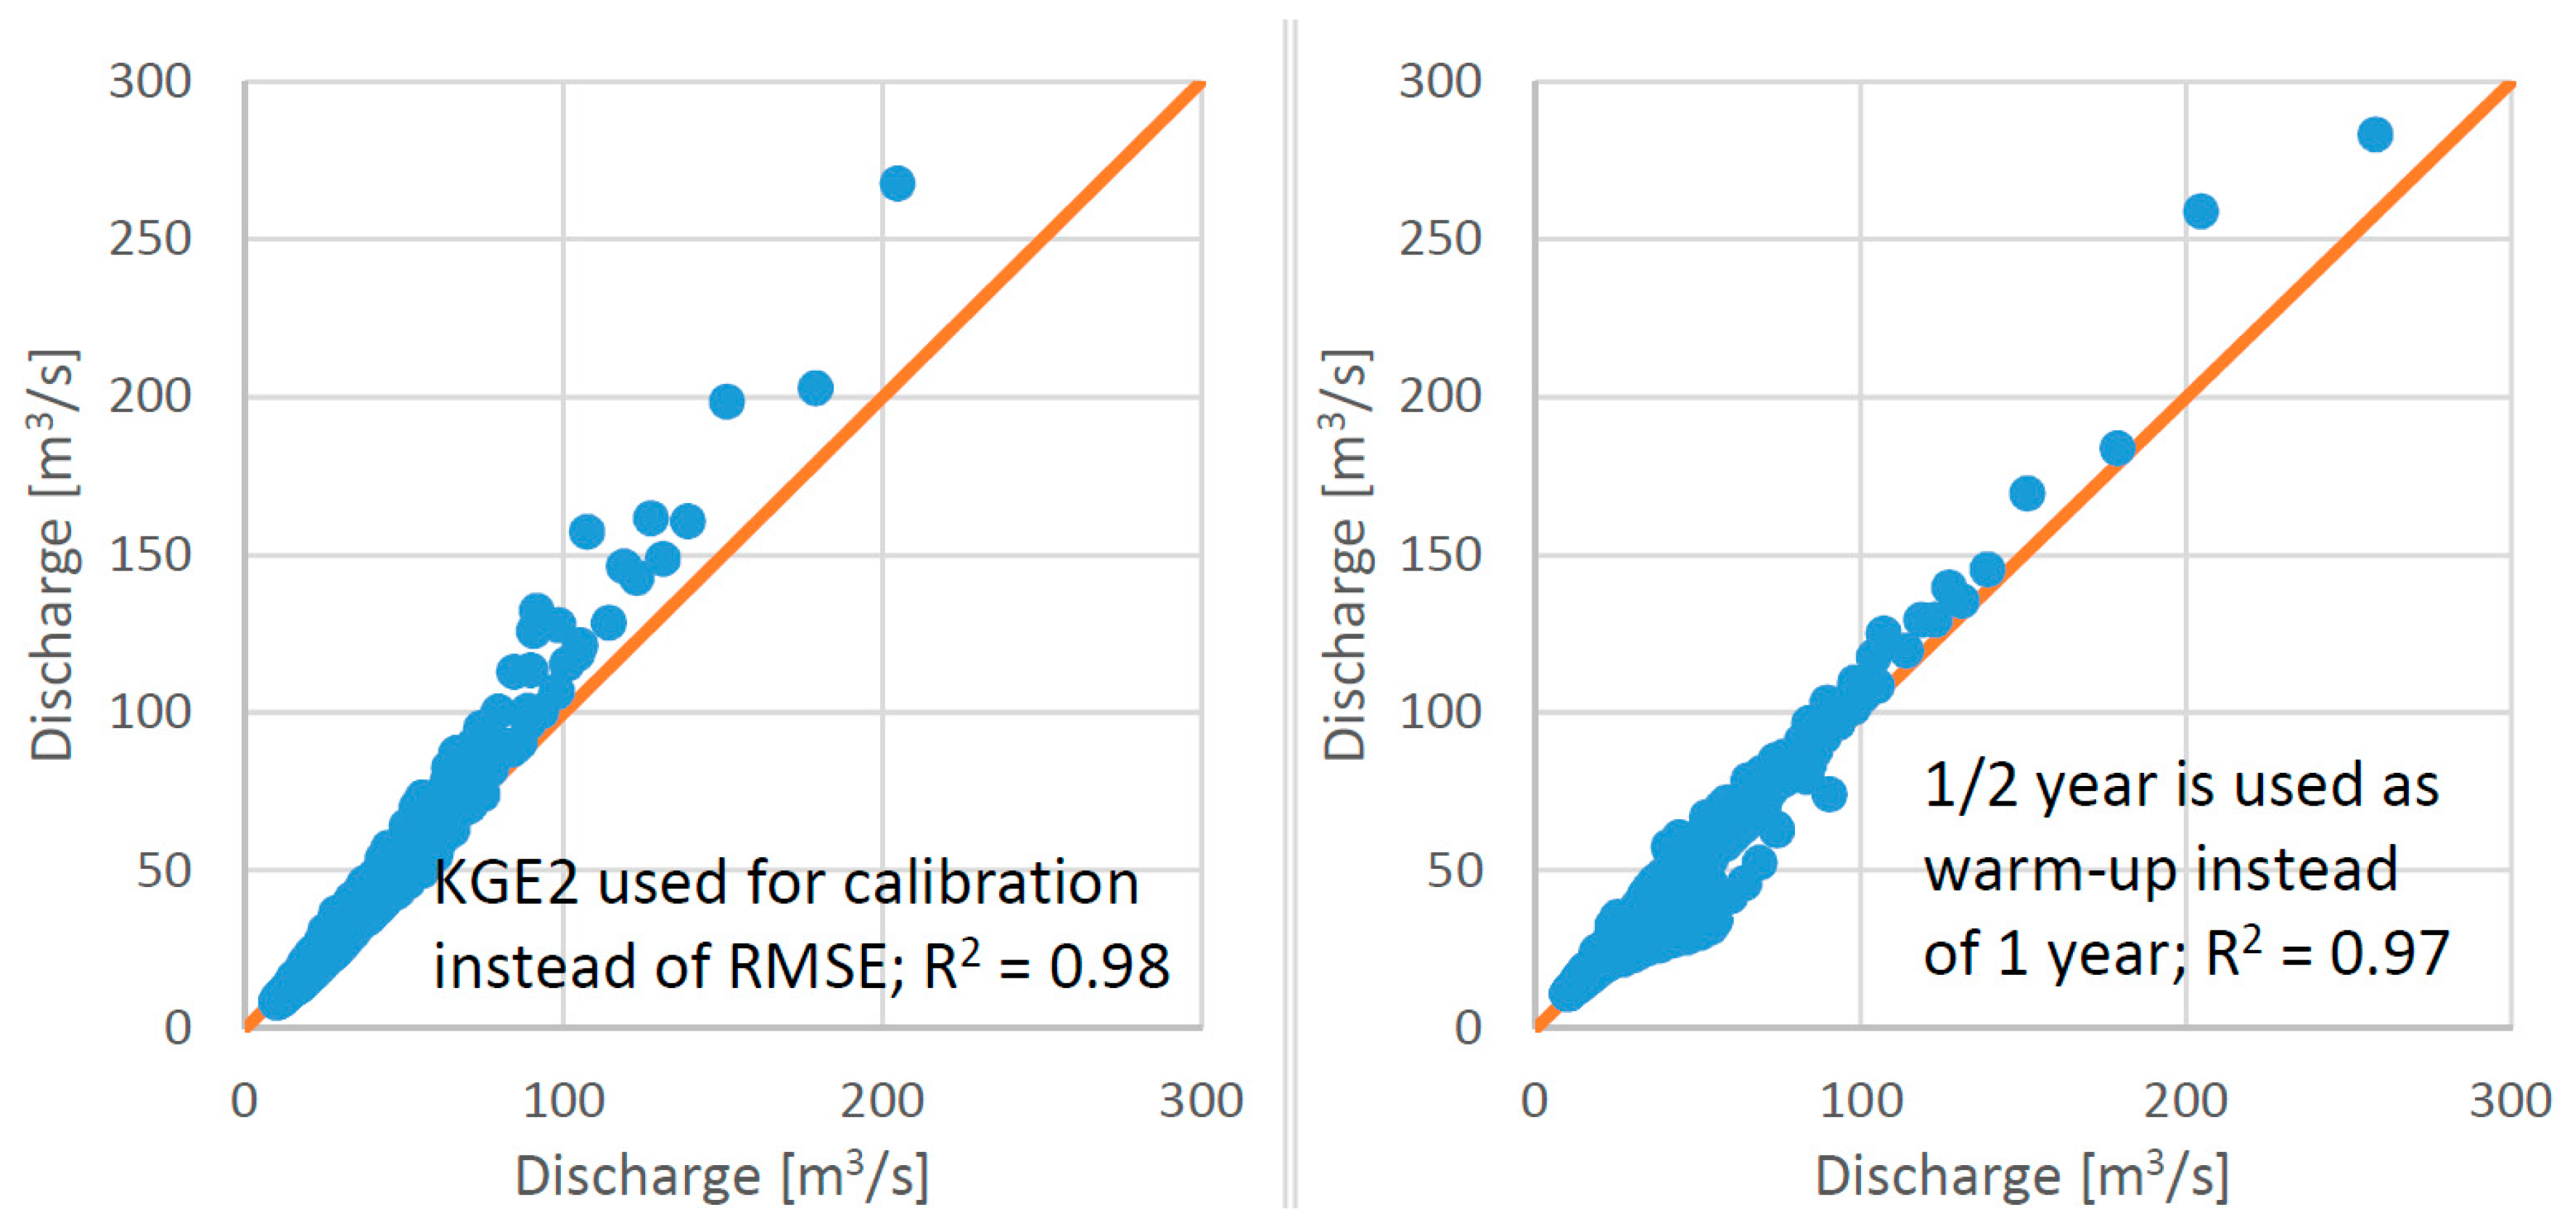
3.3. Impact of the Measurements Error on the Rainfall-Runoff Modelling Results

All the calculations that were carried out in the scope of this part of the study were performed for the Blejski station on the Sava Dolinka river. The first step was the evaluation of the impact of the performance criteria used for the model calibration. KGE, KGE2, and NSE were applied and compared to the results obtained using RMSE (i.e., using Equation (1) for the mean daily air temperature determination in all cases). The differences in the mean simulated discharge values were in the range of 2%, while the differences in the maximum discharge values were much larger and within the range of 30% (Figure 7). These differences in the maximum discharge values also yielded differences in the overall model performance. In a similar manner, the impact of the length of the model warm-up period on the results was also evaluated (Figure 7). In this case, the differences in the mean simulated discharge values were in the range of 6% and were larger for the CemaNeige GR6J model than for the GR4J and GR6J models. Additionally, differences in the maximum simulated discharge values were in the range of 20%, which also impacted the model performance. The results show that performance criteria used in the process of model calibration and the length of the warm-up period had a larger effect on the model results than selection of the equation used for calculating the mean daily air temperature (Section 3.2). Similar results would be expected in the case of shortening or extending the length of the calibration period [40]. However, some studies have indicated that shorter periods could be sufficient for efficient model calibration [41,42]. Moreover, use of a different calibration method would likely also have a relatively significant impact on the rainfall-runoff modelling results [43,44].
In the next step, we evaluated the impact of the measurements error and rating curve error (uncertainty) on the modelling results. The estimated errors and the methodology are presented in the Data and Methods section. Using described methodology, the uncertainty in the rating curve (water level-discharge relation) was also estimated. The periodical discharge measurements and currently valid rating curve for the Blejski station on the Sava Dolinka river are shown in Figure 8. Using the methodology described in Data and Methods, it was estimated that the standard error is ± 35 % . This information was used for the estimation of measurements error and rating curve uncertainty on the rainfall-runoff modelling results. Based on 100 model runs, differences in model results were evaluated for the GR4J and CemaNeige GR6J models (Table 3). The results show that consideration of only air temperature (T) measurement uncertainty had almost no impact on the model results. Additionally, consideration of precipitation and water level measurements uncertainty yielded slightly larger deviations among 100 model runs (Table 3). However, the differences were up to 1% for the maximum simulated discharge values and smaller for the mean discharge values (Table 3). Furthermore, additional consideration of the rating curve uncertainty yielded differences in the simulated mean discharge values in the range of 3%, while differences in the maximum discharge values were up to 14% (Table 3). It can be concluded that precipitation measurement uncertainty yields only slightly smaller variability in the results of the multiple model runs than consideration of different mean daily air temperature values calculated using Equations (1)–(4). Furthermore, the variability in the model results due to the rating curve uncertainty is larger than in the case that mean daily air temperature data is calculated with Equation (4) instead of Equation (1).

4. Conclusions

Equation (3) as well as Equation (2), which is also very frequently used in Slovenia for the calculation of the mean daily air temperature, both yield similar MAE values in case Equation (1) results, which are used as a “true” mean daily air temperature estimates. The mean MAE values were around 0.55 °C. Moreover, MAE values using Equation (4) are larger for most of the analysed stations (i.e., mean MAE was around 0.80 °C). Furthermore, no geographical pattern could be observed based on the presented results.
For the investigated catchment differences in the mean daily air temperature values due to use of different equations were almost negligible in relation to the rainfall-runoff modelling results. In most cases, the differences in the mean simulated discharge values were not larger than 1%. Although differences in the maximum discharge values were a bit larger, these did not exceed 5% and were mostly in the range of 1%–2%.
Evaluation of different variable measurements and rating curve uncertainty indicated that air temperature measurement did not have any significant impact on the results. A somewhat larger impact was observed when precipitation and water level measurement uncertainty was included. However, rating curve uncertainty can be regarded as the most influential among all analysed input data uncertainties. This uncertainty had a much larger effect on the rainfall-runoff modelling results than for the use of Equation (4) instead of Equation (1) for mean daily air temperature definition. Furthermore, the investigation also revealed that selection of the performance criteria used in the process of model calibration is as important as consideration of measurements and rating curve uncertainty. The impact of the selection of the performance criteria is much larger than the impact of the mean daily air temperature equation selection. Similar conclusions can also be made for the length of the model calibration warm-up period.

Author Contributions

N.B.: conceptualization, methodology, investigation, software, writing—original draft. L.C.: investigation. M.Š.: writing—review & editing, supervision. All authors have read and agreed to the published version of the manuscript.

Funding

The Slovenian Research Agency (ARRS) through the grant “P2-0180” supported this work.

Acknowledgments

We used publicly available data, supplied by the Slovenian Environment Agency and their support is greatly acknowledged. The critical and useful comments of three reviewers and academic editor greatly improved this work.

Conflicts of Interest

The authors declare no conflict of interest.

References

  1. Addor, N.; Melsen, L.A. Legacy, Rather Than Adequacy, Drives the Selection of Hydrological Models. Water Resour. Res. 2019, 55, 378–390. [Google Scholar] [CrossRef] [Green Version]
  2. Knoben, W.J.M.; Freer, J.E.; Fowler, K.J.A.; Peel, M.C.; Woods, R.A. Modular Assessment of Rainfall-Runoff Models Toolbox (MARRMoT) v1.2: An open-source, extendable framework providing implementations of 46 conceptual hydrologic models as continuous state-space formulations. Geosci. Model Dev. 2019, 12, 2463–2480. [Google Scholar] [CrossRef] [Green Version]
  3. Bezak, N.; Šraj, M.; Rusjan, S.; Mikoš, M. Impact of the rainfall duration and temporal rainfall distribution defined using the Huff curves on the hydraulic flood modelling results. Geosciences 2018, 8, 69. [Google Scholar] [CrossRef] [Green Version]
  4. Valéry, A.; Andréassian, V.; Perrin, C. “As simple as possible but not simpler”: What is useful in a temperature-based snow-accounting routine? Part 2—Sensitivity analysis of the Cemaneige snow accounting routine on 380 catchments. J. Hydrol. 2014, 517, 1176–1187. [Google Scholar] [CrossRef]
  5. Sezen, C.; Bezak, N.; Šraj, M. Hydrological modelling of the karst Ljubljanica River catchment using lumped conceptual model. Acta Hydrotech. 2018, 31, 87–100. [Google Scholar] [CrossRef]
  6. Sezen, C.; Bezak, N.; Bai, Y.; Šraj, M. Hydrological modelling of karst catchment using lumped conceptual and data mining models. J. Hydrol. 2019, 576, 98–110. [Google Scholar] [CrossRef]
  7. Lavtar, K.; Bezak, N.; Šraj, M. Rainfall-runoff modeling of the nested non-homogeneous Sava River sub-catchments in Slovenia. Water 2020, 12, 128. [Google Scholar] [CrossRef] [Green Version]
  8. Oudin, L.; Hervieu, F.; Michel, C.; Perrin, C.; Andréassian, V.; Anctil, F.; Loumagne, C. Which potential evapotranspiration input for a lumped rainfall-runoff model? Part 2—Towards a simple and efficient potential evapotranspiration model for rainfall-runoff modelling. J. Hydrol. 2005, 303, 290–306. [Google Scholar] [CrossRef]
  9. Valéry, A.; Andréassian, V.; Perrin, C. “As simple as possible but not simpler”: What is useful in a temperature-based snow-accounting routine? Part 1—Comparison of six snow accounting routines on 380 catchments. J. Hydrol. 2014, 517, 1166–1175. [Google Scholar] [CrossRef]
  10. Ruelland, D. Should altitudinal gradients of temperature and precipitation inputs be inferred from key parameters in snow-hydrological models? Hydrol. Earth Syst. Sci. 2020, 24, 2609–2632. [Google Scholar] [CrossRef]
  11. Du, X.; Shrestha, N.K.; Ficklin, D.L.; Wang, J. Incorporation of the equilibrium temperature approach in a Soil and Water Assessment Tool hydroclimatological stream temperature model. Hydrol. Earth Syst. Sci. 2018, 22, 2343–2357. [Google Scholar] [CrossRef] [Green Version]
  12. Weiss, A.; Hays, C.J. Calculating daily mean air temperatures by different methods: Implications from a non-linear algorithm. Agric. For. Meteorol. 2005, 128, 57–65. [Google Scholar] [CrossRef]
  13. Bonacci, O.; Željković, I.; Trogrlić, R.Š.; Milković, J. Differences between true mean daily, monthly and annual air temperatures and air temperatures calculated with three equations: A case study from three Croatian stations. Theor. Appl. Climatol. 2013, 114, 271–279. [Google Scholar] [CrossRef]
  14. Ma, Y.; Guttorp, P. Estimating daily mean temperature from synoptic climate observations. Int. J. Climatol. 2013, 33, 1264–1269. [Google Scholar] [CrossRef]
  15. Sakellariou, N.K.; Kambezidis, H.D. Improving the estimation of the true mean monthly and true mean annual air temperatures in Greece. Atmos. Sci. Lett. 2016, 17, 13–18. [Google Scholar] [CrossRef] [Green Version]
  16. Villarini, G.; Khouakhi, A.; Cunningham, E. On the impacts of computing daily temperatures as the average of the daily minimum and maximum temperatures. Atmos. Res. 2017, 198, 145–150. [Google Scholar] [CrossRef]
  17. Bonacci, O.; Roje-Bonacci, T. Analyses of the Zagreb Grič observatory air temperatures indices for the period 1881 to 2017. Acta Hydrotech. 2018, 31, 67–85. [Google Scholar] [CrossRef]
  18. Bonacci, O.; Željković, I. Differences between true mean temperatures and means calculated with four different approaches: A case study from three Croatian stations. Theor. Appl. Climatol. 2018, 131, 733–743. [Google Scholar] [CrossRef]
  19. Oudin, L.; Michel, C.; Anctil, F. Which potential evapotranspiration input for a lumped rainfall-runoff model? Part 1 - Can rainfall-runoff models effectively handle detailed potential evapotranspiration inputs? J. Hydrol. 2005, 303, 275–289. [Google Scholar] [CrossRef]
  20. Oudin, L.; Moulin, L.; Bendjoudi, H.; Ribstein, P. Estimating potential evapotranspiration without continuous daily data: Possible errors and impact on water balance simulations | Estimation de l’évapotranspiration potentielle sans données journalières régulières: Erreurs possibles et impact sur les simul. Hydrol. Sci. J. 2010, 55, 209–222. [Google Scholar] [CrossRef] [Green Version]
  21. Vaisala QMT103. Available online: http://www.inemet.com/pdf/sensores/qmt103.pdf (accessed on 10 July 2020).
  22. Dolšak, D.; Bezak, N.; Šraj, M. Temporal characteristics of rainfall events under three climate types in Slovenia. J. Hydrol. 2016, 541, 1395–1405. [Google Scholar] [CrossRef]
  23. Conner, G.; Foster, S. Searching for the daily mean temperature. In Proceedings of the 17th Conference on Applied Climatology, 88th Annual Meeting American Meteorological Society, Whistler, BC, Canada, 11 August 2008. [Google Scholar]
  24. National Oceanic and Atmospheric Administration U.S. Available online: https://www.ncdc.noaa.gov/wdcmet/data-access-search-viewer-tools/world-weather-records-wwr-clearinghouse (accessed on 10 July 2020).
  25. Perrin, C.; Michel, C.; Andréassian, V. Improvement of a parsimonious model for streamflow simulation. J. Hydrol. 2003, 279, 275–289. [Google Scholar] [CrossRef]
  26. Coron, L.; Thirel, G.; Delaigue, O.; Perrin, C.; Andréassian, V. The suite of lumped GR hydrological models in an R package. Environ. Model. Softw. 2017, 94, 166–171. [Google Scholar] [CrossRef]
  27. Pushpalatha, R.; Perrin, C.; Le Moine, N.; Mathevet, T.; Andréassian, V. A downward structural sensitivity analysis of hydrological models to improve low-flow simulation. J. Hydrol. 2011, 411, 66–76. [Google Scholar] [CrossRef]
  28. Coron, L.; Perrin, C.; Delaigue, O.; Thirel, G.; Michel, C. airGR: Suite of GR Hydrological Models for Precipitation-Runoff Modelling 2018. Available online: https://cran.r-project.org/web/packages/airGR/index.html (accessed on 10 July 2020).
  29. Michel, C. Hydrologie Appliquée aux Petits Bassins Ruraux; Cemagref: Grenoble, France, 1991. [Google Scholar]
  30. Nash, J.E.; Sutcliffe, J.V. River flow forecasting through conceptual models part I—A discussion of principles. J. Hydrol. 1970, 10, 282–290. [Google Scholar] [CrossRef]
  31. Gupta, H.V.; Kling, H.; Yilmaz, K.K.; Martinez, G.F. Decomposition of the mean squared error and NSE performance criteria: Implications for improving hydrological modelling. J. Hydrol. 2009, 377, 80–91. [Google Scholar] [CrossRef] [Green Version]
  32. Kling, H.; Fuchs, M.; Paulin, M. Runoff conditions in the upper Danube basin under an ensemble of climate change scenarios. J. Hydrol. 2012, 424–425, 264–277. [Google Scholar] [CrossRef]
  33. WMO OTT Pluvio—Weighing Gauge. 2020. Available online: https://www.wmo.int/pages/prog/www/IMOP/publications/IOM-84_Lab_RI/IOM-84_DataSheets/WeighingGauge_Germany_OTTpluvio.pdf (accessed on 10 July 2020).
  34. Wauben, W. KNMI Contribution to the WMO Laboratory Intercomparison of Rainfall Intensity Gauges; KNMI: De Bilt, The Netherlands, 2006; Available online: http://bibliotheek.knmi.nl/knmipubTR/TR287.pdf (accessed on 10 July 2020).
  35. VEGA VEGAPULS 67. Available online: https://www.vega.com/en/products/product-catalog/level/radar/vegapuls-67 (accessed on 10 July 2020).
  36. OTT OTT PLS - Pressure Level Sensor. Available online: https://www.ott.com/products/water-level-1/ott-pls-pressure-level-sensor-959/ (accessed on 10 July 2020).
  37. Herschy, R. Hydrometry: Principles and Practice; Wiley: Hoboken, NJ, USA, 1999; ISBN 978-0-471-97350-8. [Google Scholar]
  38. Renard, B.; Kavetski, D.; Kuczera, G.; Thyer, M.; Franks, S.W. Understanding predictive uncertainty in hydrologic modeling: The challenge of identifying input and structural errors. Water Resour. Res. 2010, 46. [Google Scholar] [CrossRef]
  39. Gupta, A.; Govindaraju, R.S. Propagation of structural uncertainty in watershed hydrologic models. J. Hydrol. 2019, 575, 66–81. [Google Scholar] [CrossRef]
  40. Bai, Y.; Bezak, N.; Sapač, K.; Klun, M.; Zhang, J. Short-Term Streamflow Forecasting Using the Feature-Enhanced Regression Model. Water Resour. Manag. 2019, 33, 4783–4797. [Google Scholar] [CrossRef]
  41. Perrin, C.; Oudin, L.; Andreassian, V.; Rojas-Serna, C.; Michel, C.; Mathevet, T. Impact of limited streamflow data on the efficiency and the parameters of rainfall-runoff models. Hydrol. Sci. J. 2007, 52, 131–151. [Google Scholar] [CrossRef] [Green Version]
  42. Juston, J.; Seibert, J.; Johansson, P.-O. Temporal sampling strategies and uncertainty in calibrating a conceptual hydrological model for a small boreal catchment. Hydrol. Process. 2009, 23, 3093–3109. [Google Scholar] [CrossRef]
  43. Duan, Q.; Sorooshian, S.; Gupta, V. Effective and efficient global optimization for conceptual rainfall-runoff models. Water Resour. Res. 1992, 28, 1015–1031. [Google Scholar] [CrossRef]
  44. Vidmar, A.; Brilly, M.; Sapač, K.; Kryžanowski, A. Efficient calibration of a conceptual hydrological model based on the enhanced Gauss-Levenberg-Marquardt procedure. Appl. Sci. 2020, 10, 3841. [Google Scholar] [CrossRef]
Figure 1. Location of the considered meteorological and climatological stations (white dots) and location of four selected catchments (red areas, green dots show water level gauging stations) with a river network in Slovenia (blue lines).
Water 12 03175 g001
Figure 2. Mean Absolute Error (MAE) values between Equations (1) and (2) (blue bar), Equations (1)–(3) (green bar), and Equations (1)–(4) (red bar) using mean daily air temperature data.
Water 12 03175 g002
Figure 3. Evaluation of the CemaNeige GR6J model for the calibration (left) and validation (right) period. Top two panels show input precipitation and air temperature data. Middle panel shows modelled snow pack values. Lower two panels show a comparison between simulated and observed discharge data using daily discharge values, 30-days rolling mean, flow duration curve, and scatter plot.
Water 12 03175 g003
Figure 4. Comparison of different model results using different estimates of mean daily air temperature values for the Kranjska Gora station on the Sava Dolinka river.
Water 12 03175 g004
Figure 5. Comparison among the CemaNeige GR6J results for the Kranjska Gora station on the Sava Dolinka river using different input values for the mean air temperature estimates. X-axis in all three cases show results obtained using Equation (1) while the y-axis show results using Equation (2), Equation (3), and Equation (4) (from left to right).
Water 12 03175 g005
Figure 6. Comparison of mean daily air temperature values for the Rateče station on the Sava Dolinka river using different input values for the mean air temperature estimates. In all three cases, the x-axis shows the mean daily air temperature estimates using Equation (1) while the y-axis show values obtained using Equation (2), Equation (3), and Equation (4) (from left to right).
Water 12 03175 g006
Figure 7. Impact of the efficiency criteria used for the CemaNeige GR6J model calibration (left figure) and impact on the length of the model warm-up period (right figure) on the model results in the validation period for the Blejski most station on the Sava Dolinka river. In both cases, the x-axis shows discharge values obtained using Equation (1), RMSE as a criterion for the calibration, and one year as a warm-up period. In the left figure, the y-axis shows the results using the KGE2 for model calibration. In the right figure, the y-axis shows the results using half-year data for the model warm-up period instead of one year.
Water 12 03175 g007
Figure 8. Rating curve (yellow line) for the Blejski most station on the Sava Dolinka river with periodical discharge and water level measurements (points).
Water 12 03175 g008
Table 1. Main characteristics of catchments used in this study for hydrological modelling. Mean discharge in the period of 2010–2018 as well as mean annual precipitation, number of snow days, and mean min., mean, and mean max. air temperature for the 2010–2019 period are presented.
RiverSava DolinkaSava DolinkaLedavaNanoščica
Discharge gauging stationKranjska GoraBlejski mostPolanaMali Otok
Catchment area (km2)4050920951
Mean discharge (m3/s)1.625.31.21.6
Precipitation and air temperature stationRatečeRatečeMurska SobotaPostojna
Station elevation864 m a.s.l.864 m a.s.l.187 m a.s.l.533 m a.s.l.
Mean annual precipitation (mm)165516558411532
Number of days with snow cover1051053035
Mean min., mean and max. air temperature (°C)2.5, 7.5, 13.72.5, 7.5, 13.76.3, 11.2, 16.85.5, 10.4, 15.7
Table 2. Root Mean Square Error (RMSE) criteria values for discharge results (mm) in case of four investigated catchments for the calibration and validation periods using different input values for the mean air temperature estimates.
StationPeriodGR4JGR6JCemaNeige GR6J
Equation (1)Equation (2)Equation (3)Equation (4)Equation (1)Equation (2)Equation (3)Equation (4)Equation (1)Equation (2)Equation (3)Equation (4)
Kranjska GoraCalibration1.761.761.761.761.761.761.761.771.521.521.481.49
Validation1.671.661.641.671.661.641.661.671.081.081.141.18
PolanaCalibration0.690.690.690.680.640.640.640.640.460.460.480.48
Validation1.091.091.091.071.351.321.341.291.261.221.241.20
Mali otokCalibration2.522.522.522.522.512.512.502.502.352.412.322.39
Validation2.552.552.552.562.542.542.552.552.582.582.602.59
Blejski mostCalibration2.082.082.082.082.002.002.002.001.761.801.711.77
Validation2.602.602.602.602.462.452.462.491.761.801.731.76
Table 3. Overview of the measurements and rating curve errors on the rainfall-runoff modelling results using GR4J and CemaNeige GR6J models. The difference between the minimum and maximum simulated discharge values of the 100 model runs, calculated for all mean and maximum simulated discharge values, is shown.
ModelStatisticsTT, PT, P, QT, P, Q, RC
GR4JMean~0%<1%<1%3%
Maximum~0%1%1%14%
CemaNeige GR6JMean~0%<1%<1%2%
Maximum~0%1%1%13%
Publisher’s Note: MDPI stays neutral with regard to jurisdictional claims in published maps and institutional affiliations.

