Influence of Land Use Change on Hydrological Cycle: Application of SWAT to Su-Mi-Huai Area in Beijing, China


Abstract
:1. Introduction
2. Methodology
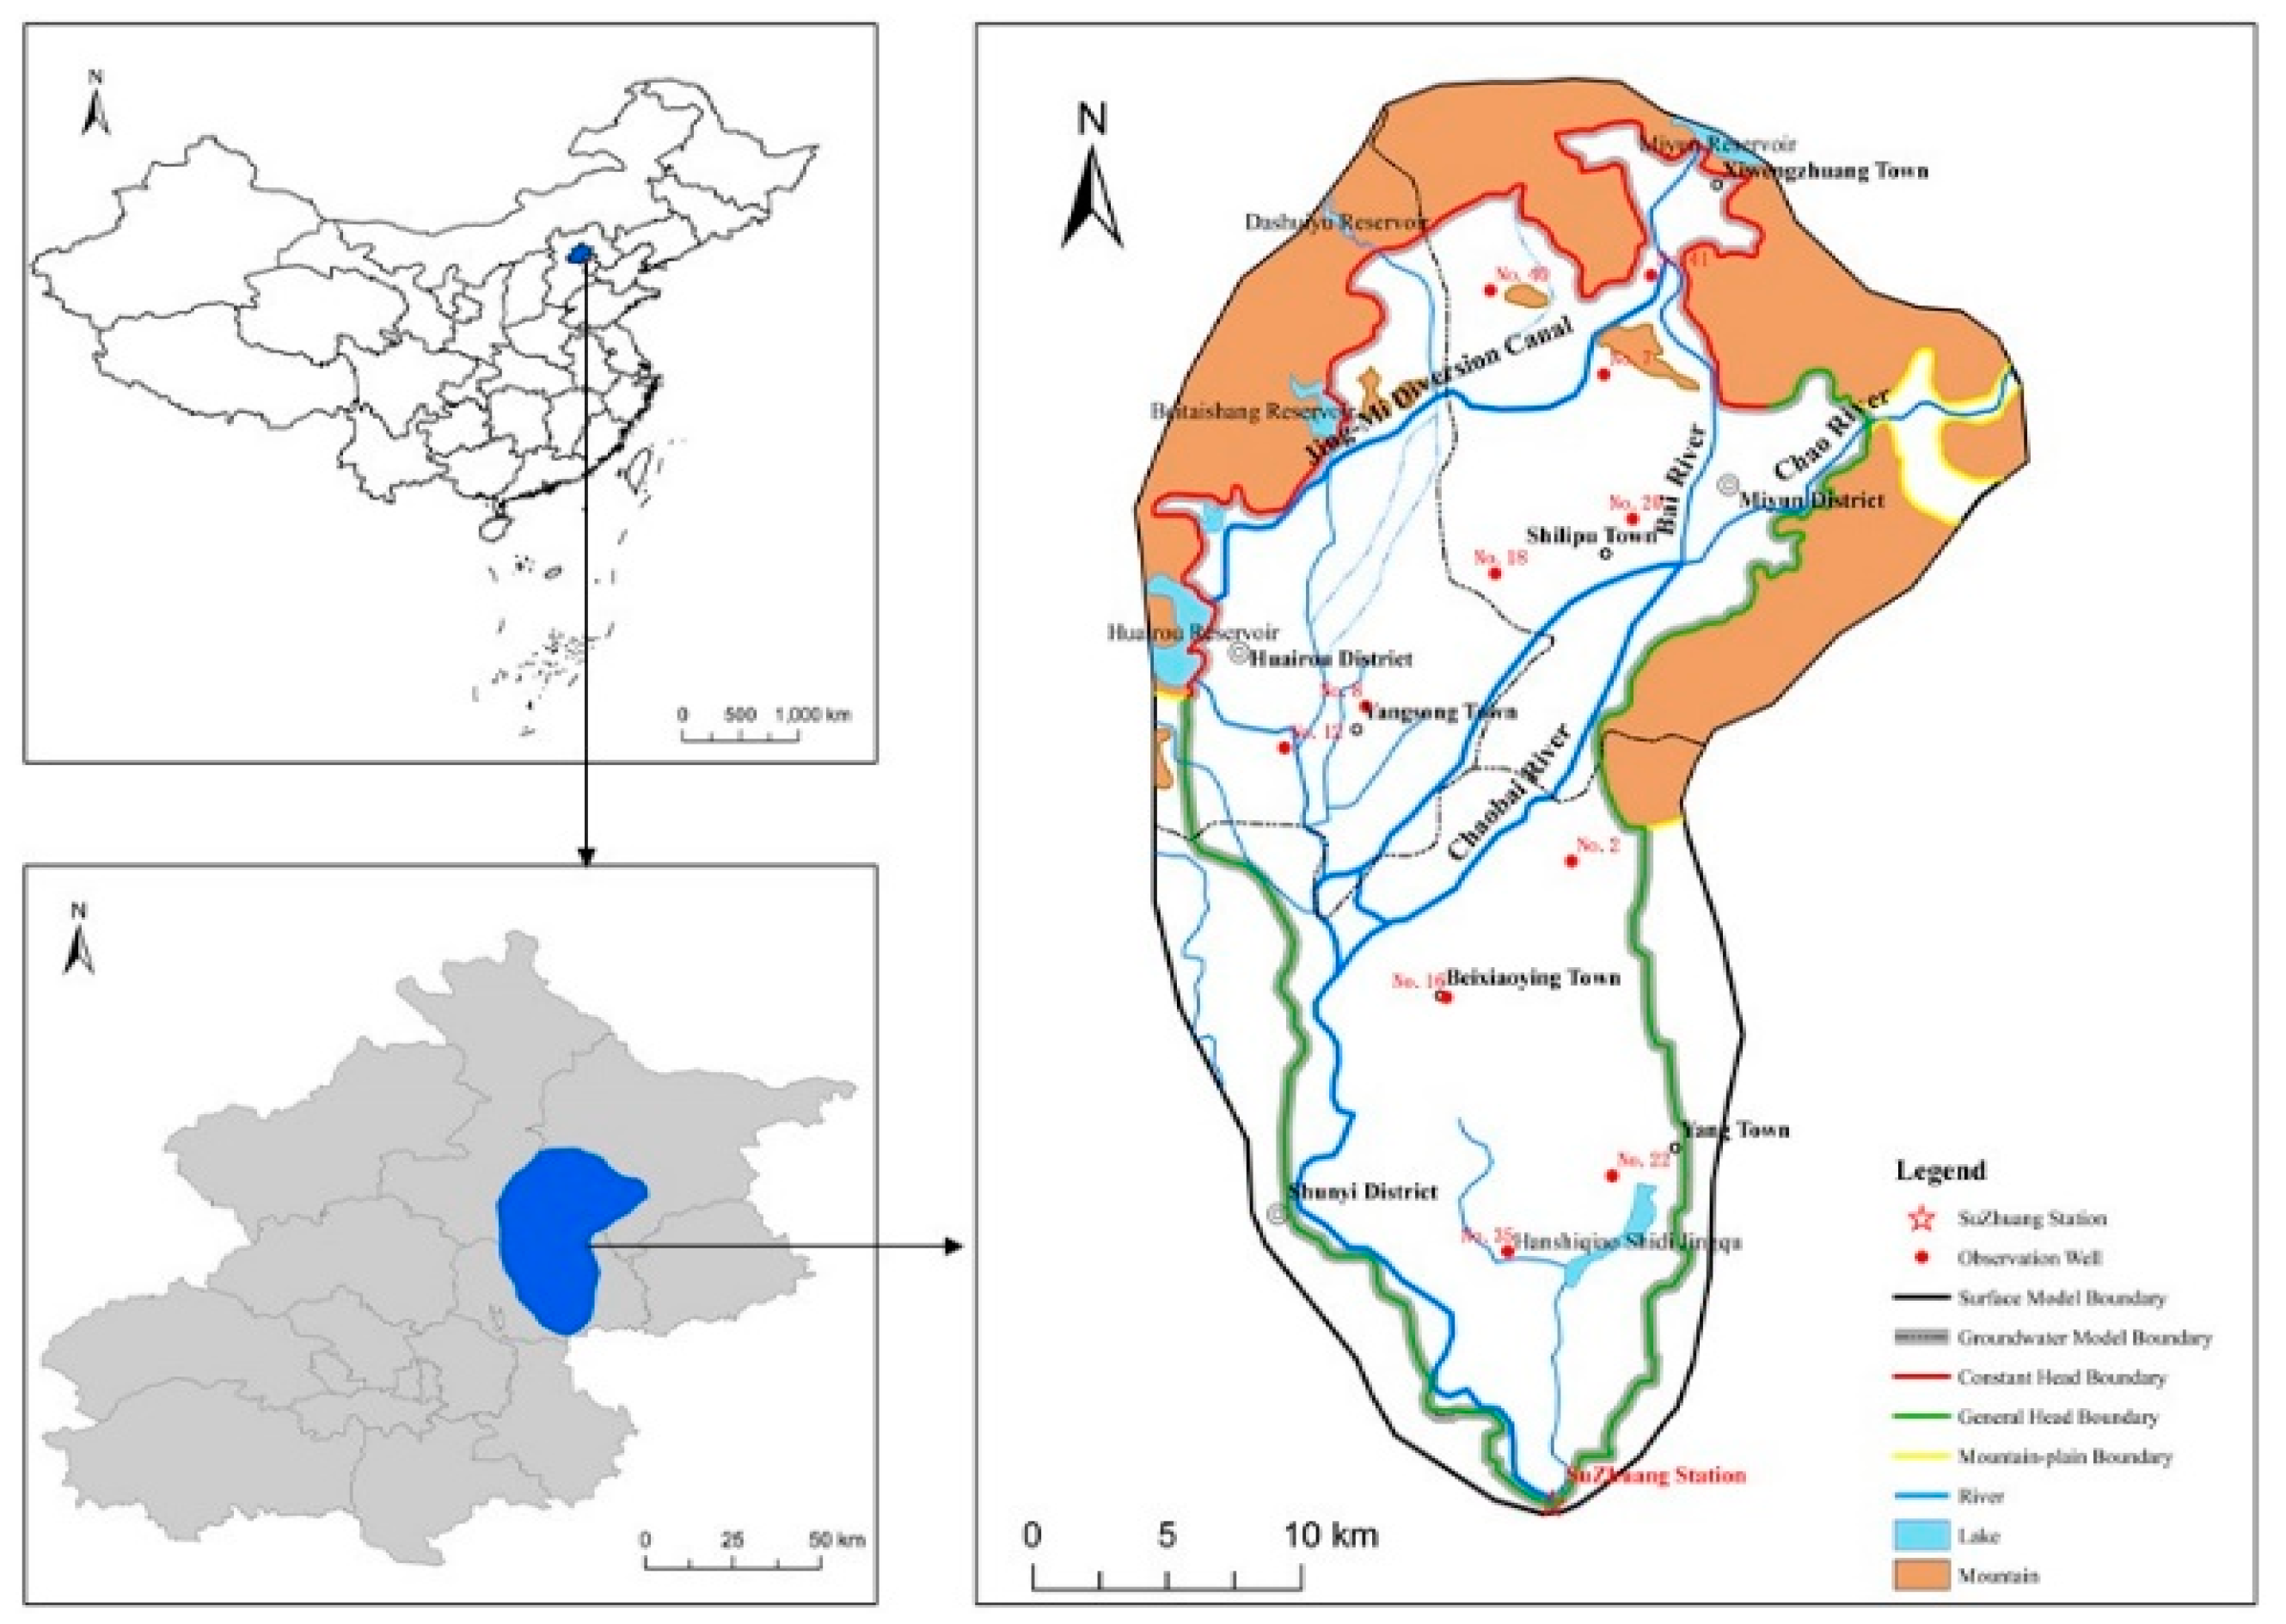
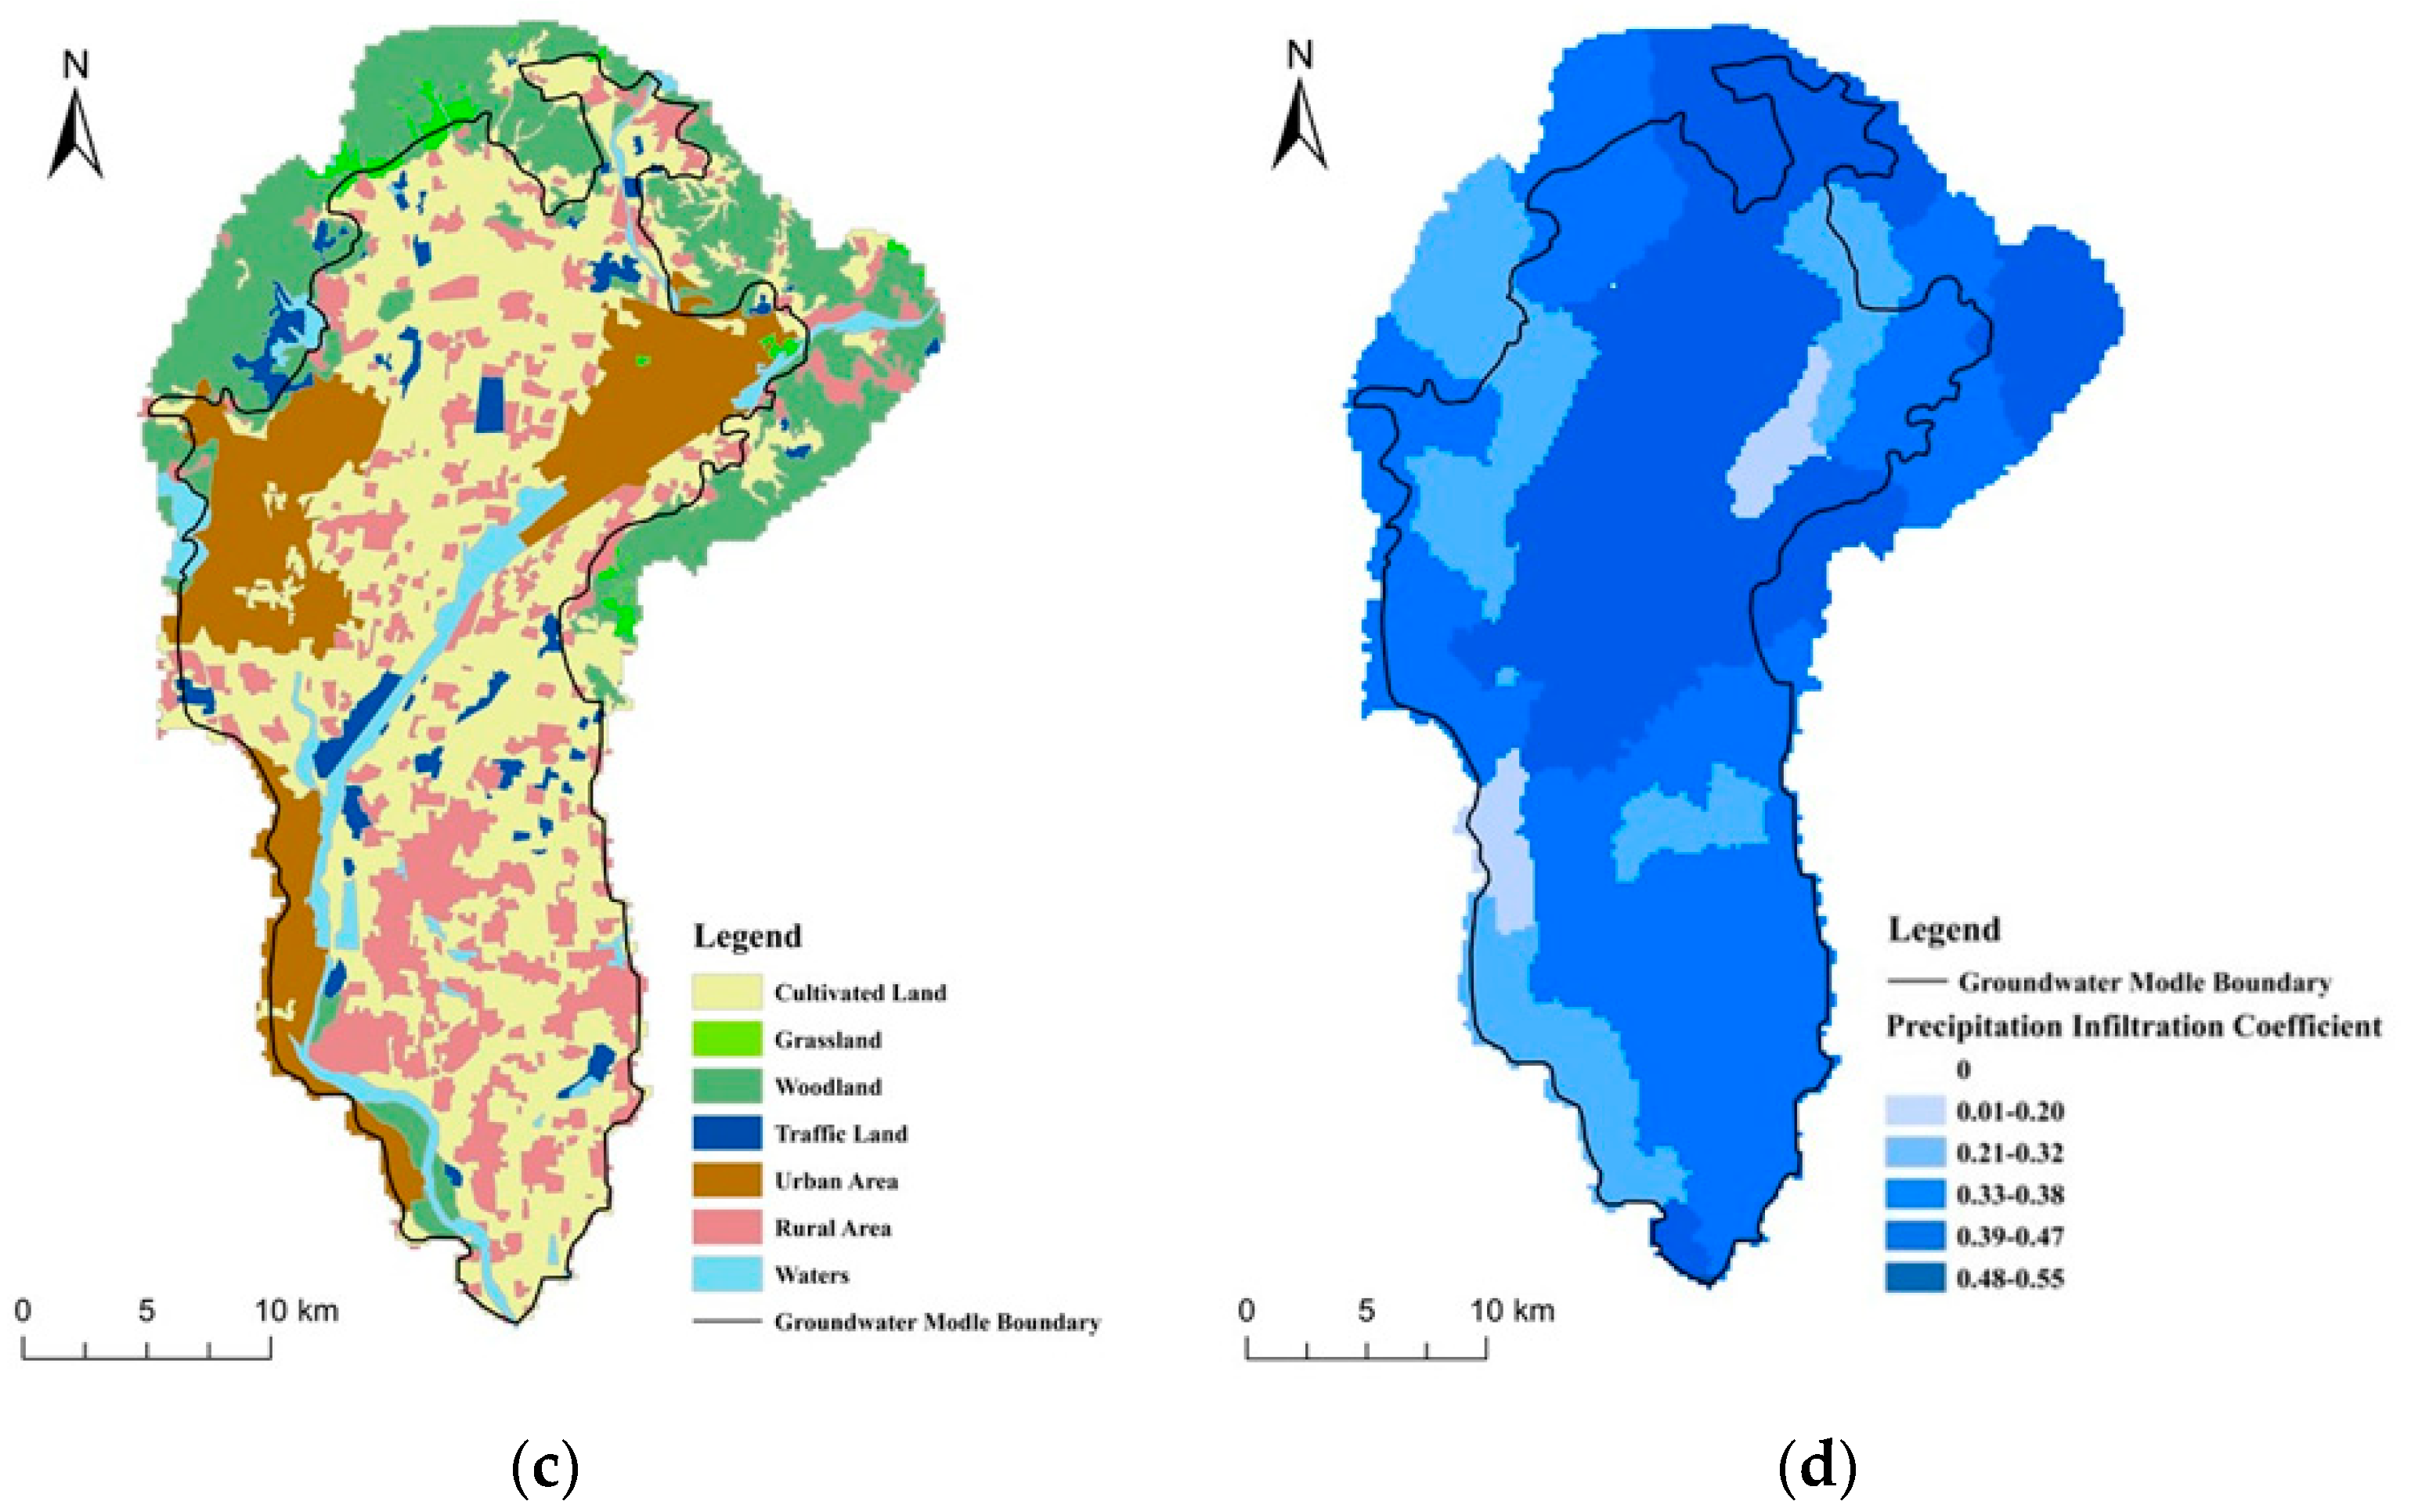
2.1. Study Area
2.2. Water Balance Modeling
2.2.1. SWAT Model
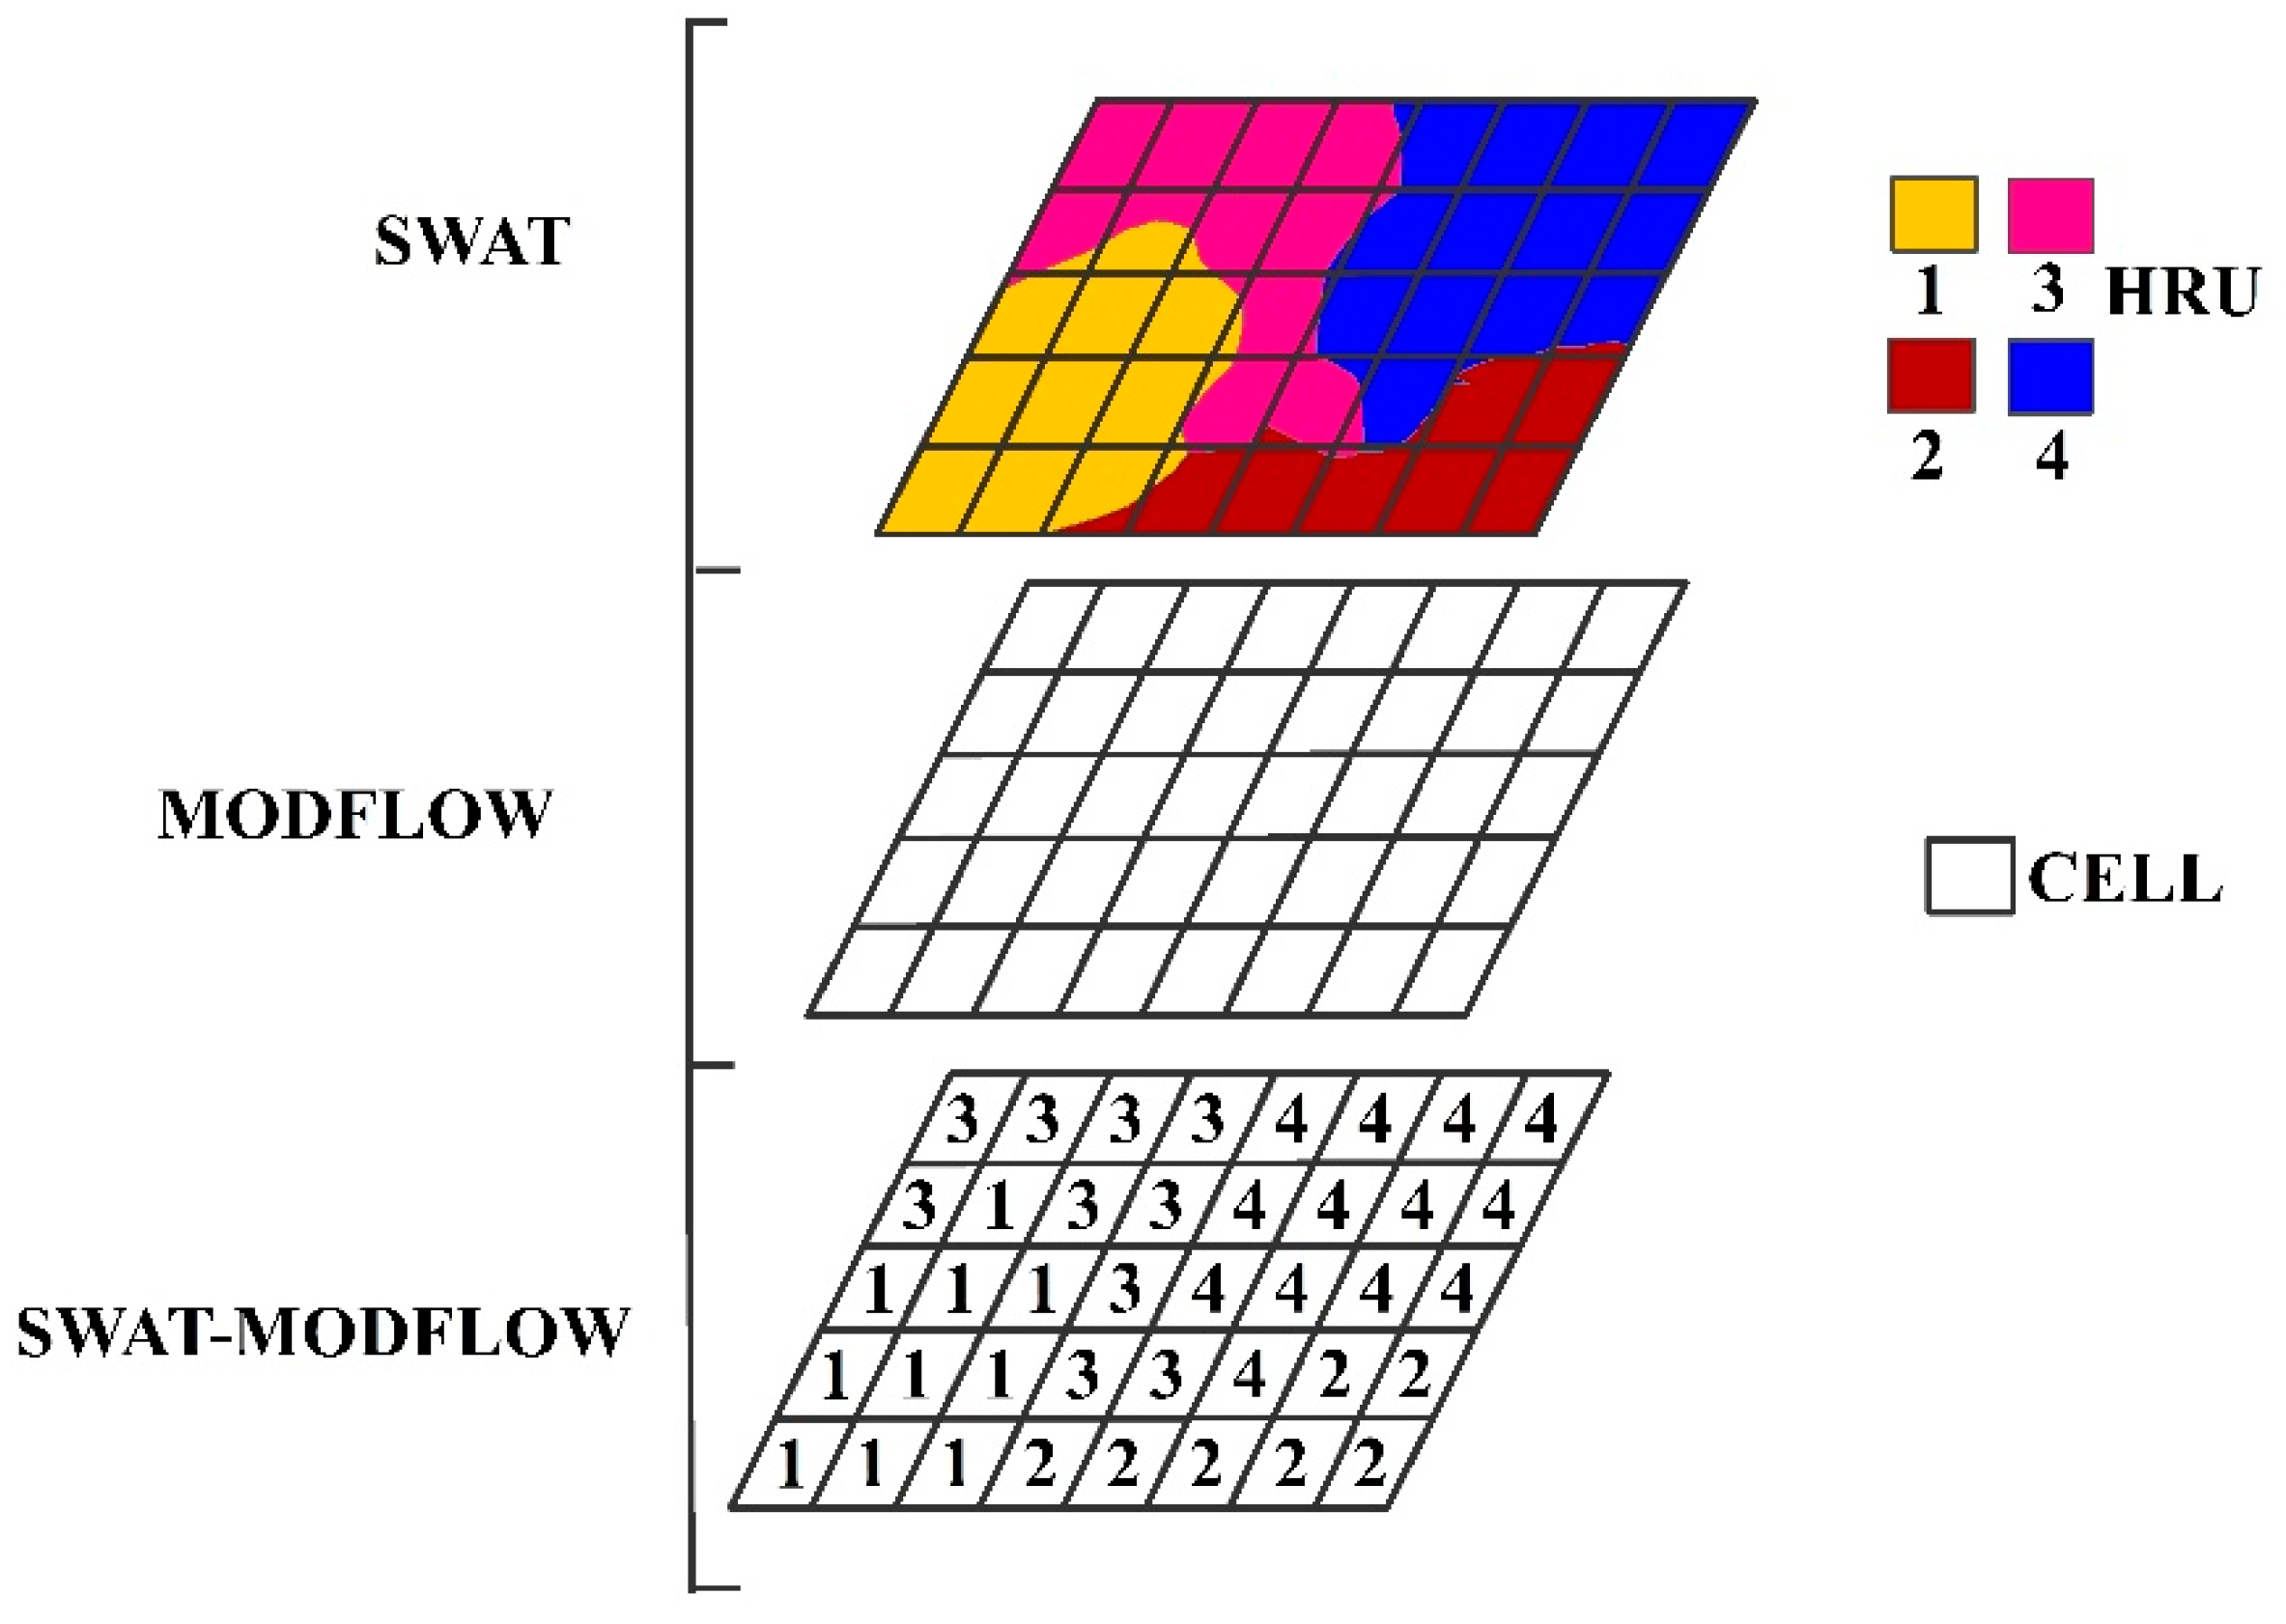
2.2.2. SWAT-MODFLOW Coupling
MODFLOW Model
The Semi-loose Coupling
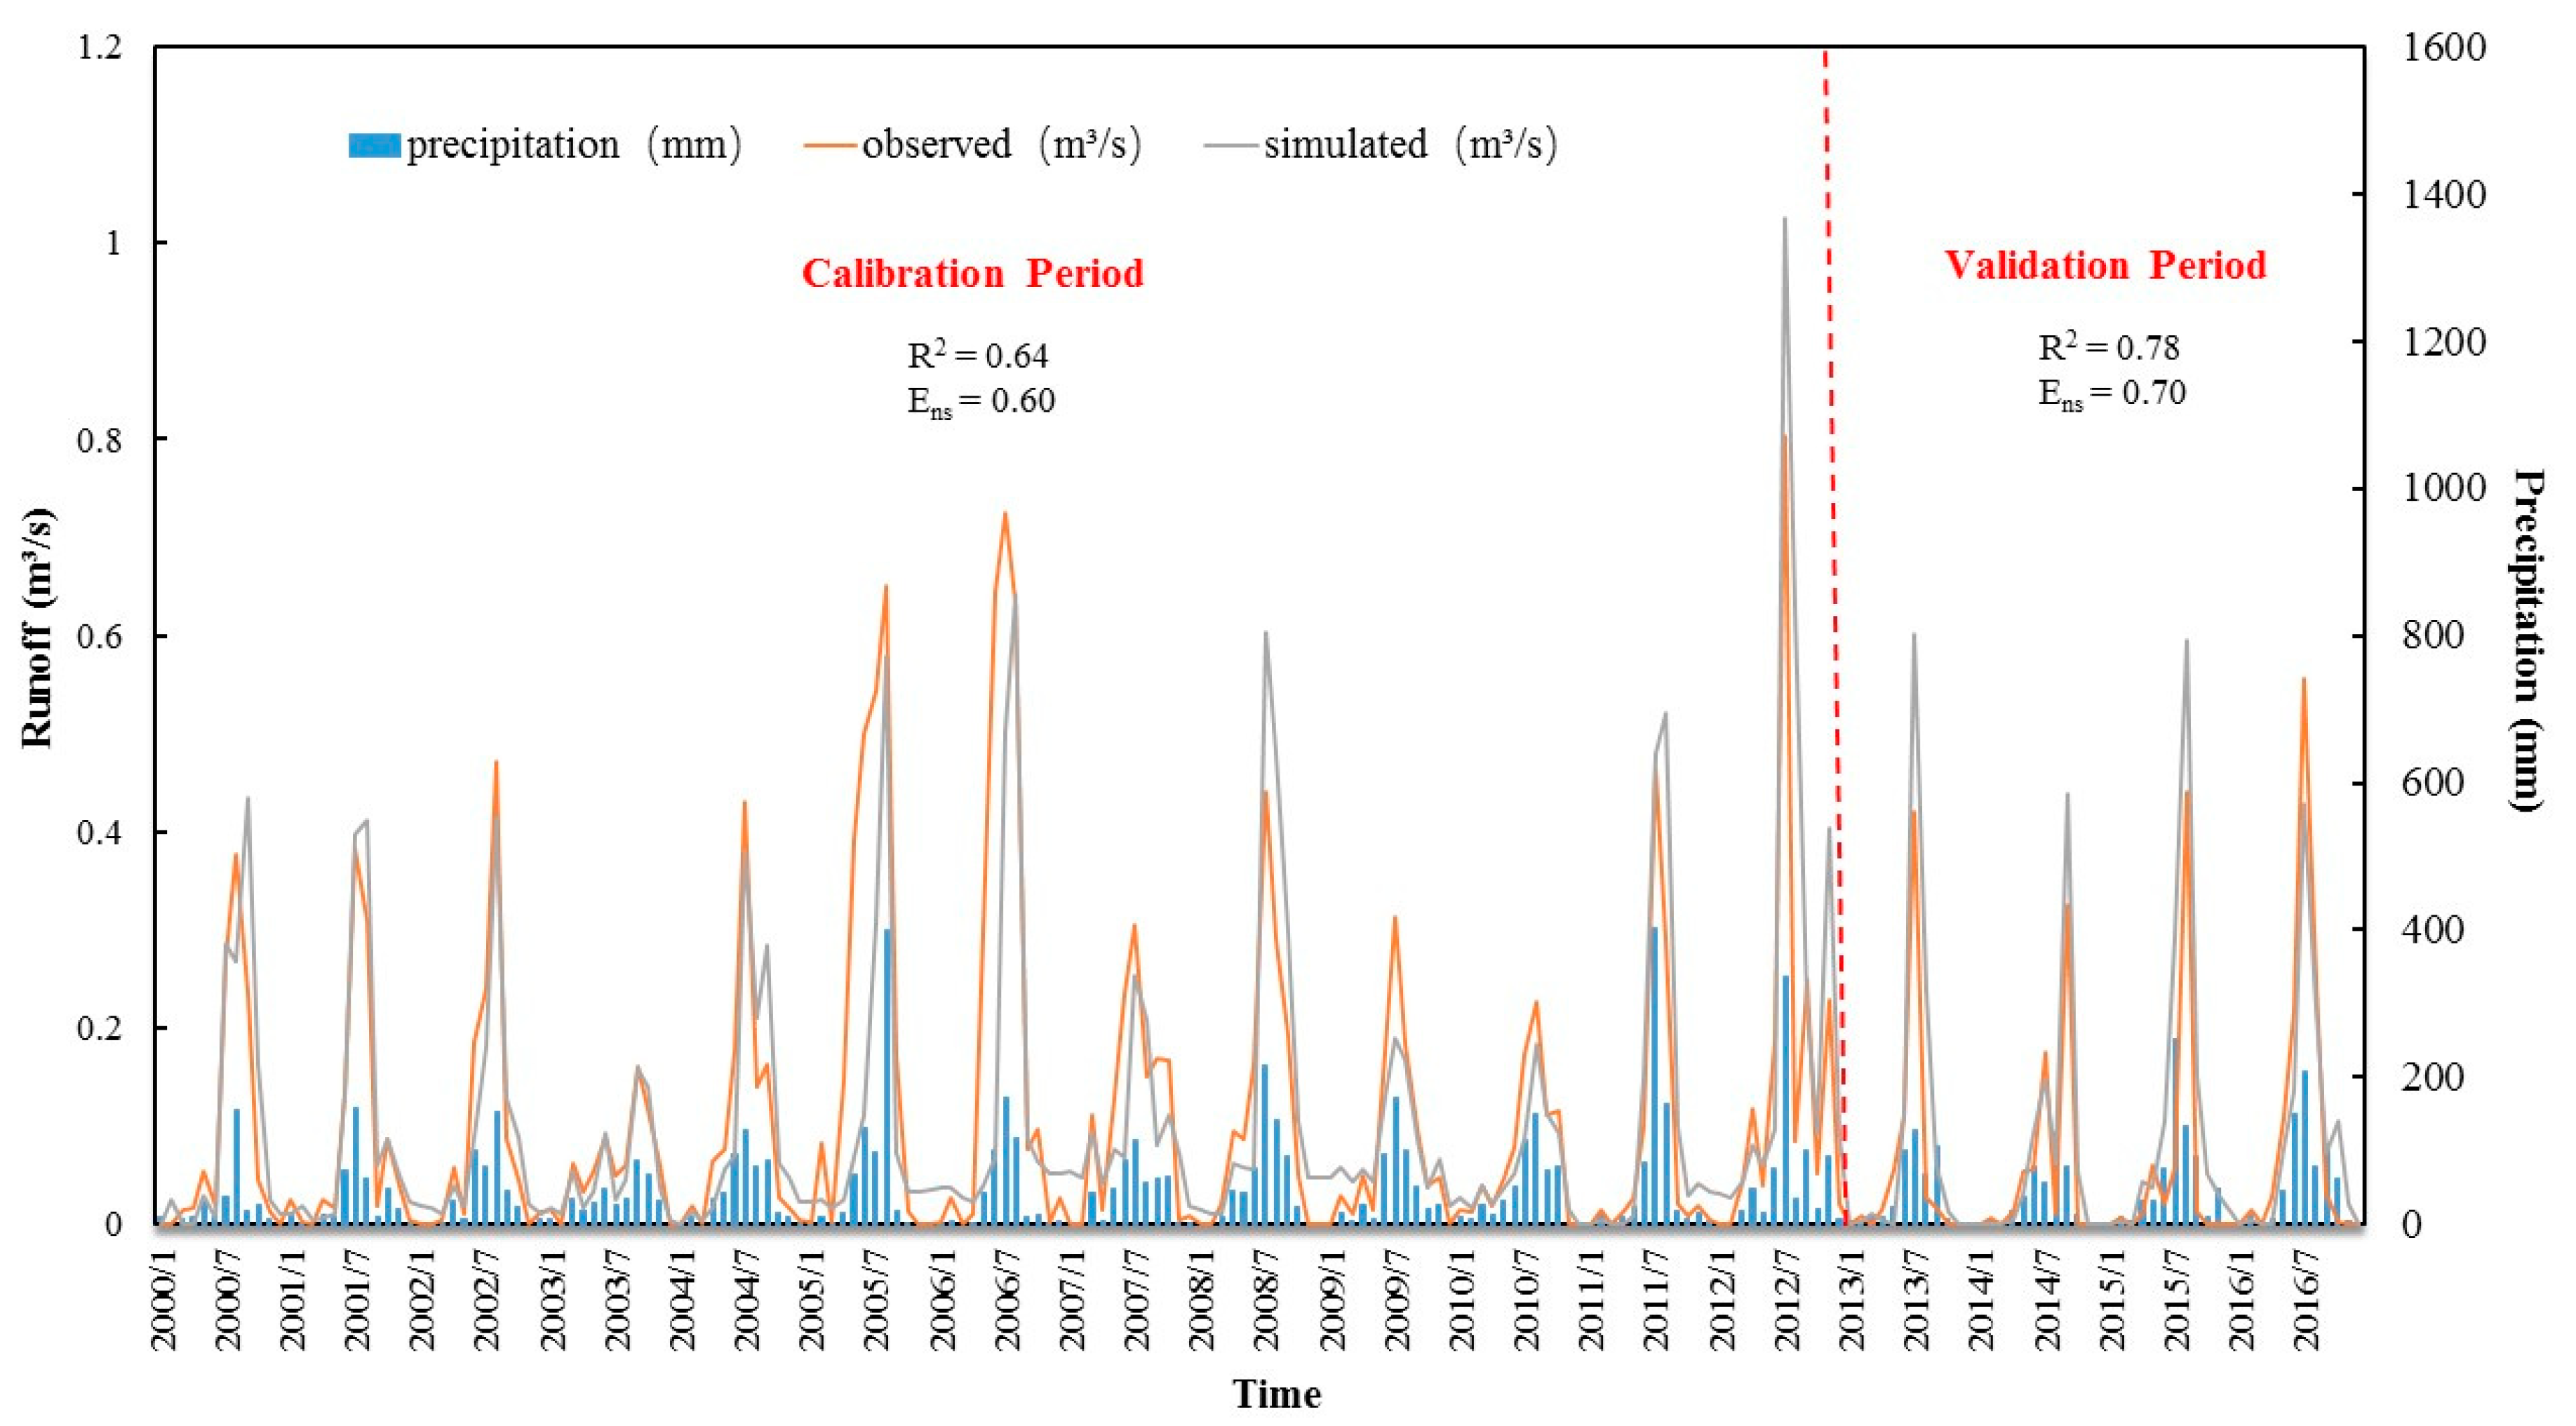
2.2.3. Model Calibration and Validation
2.3. Precipitation Frequency Analysis and Precipitation Infiltration Coefficient
3. Results and Discussion
3.1. The Results of Model Calibration and Validation
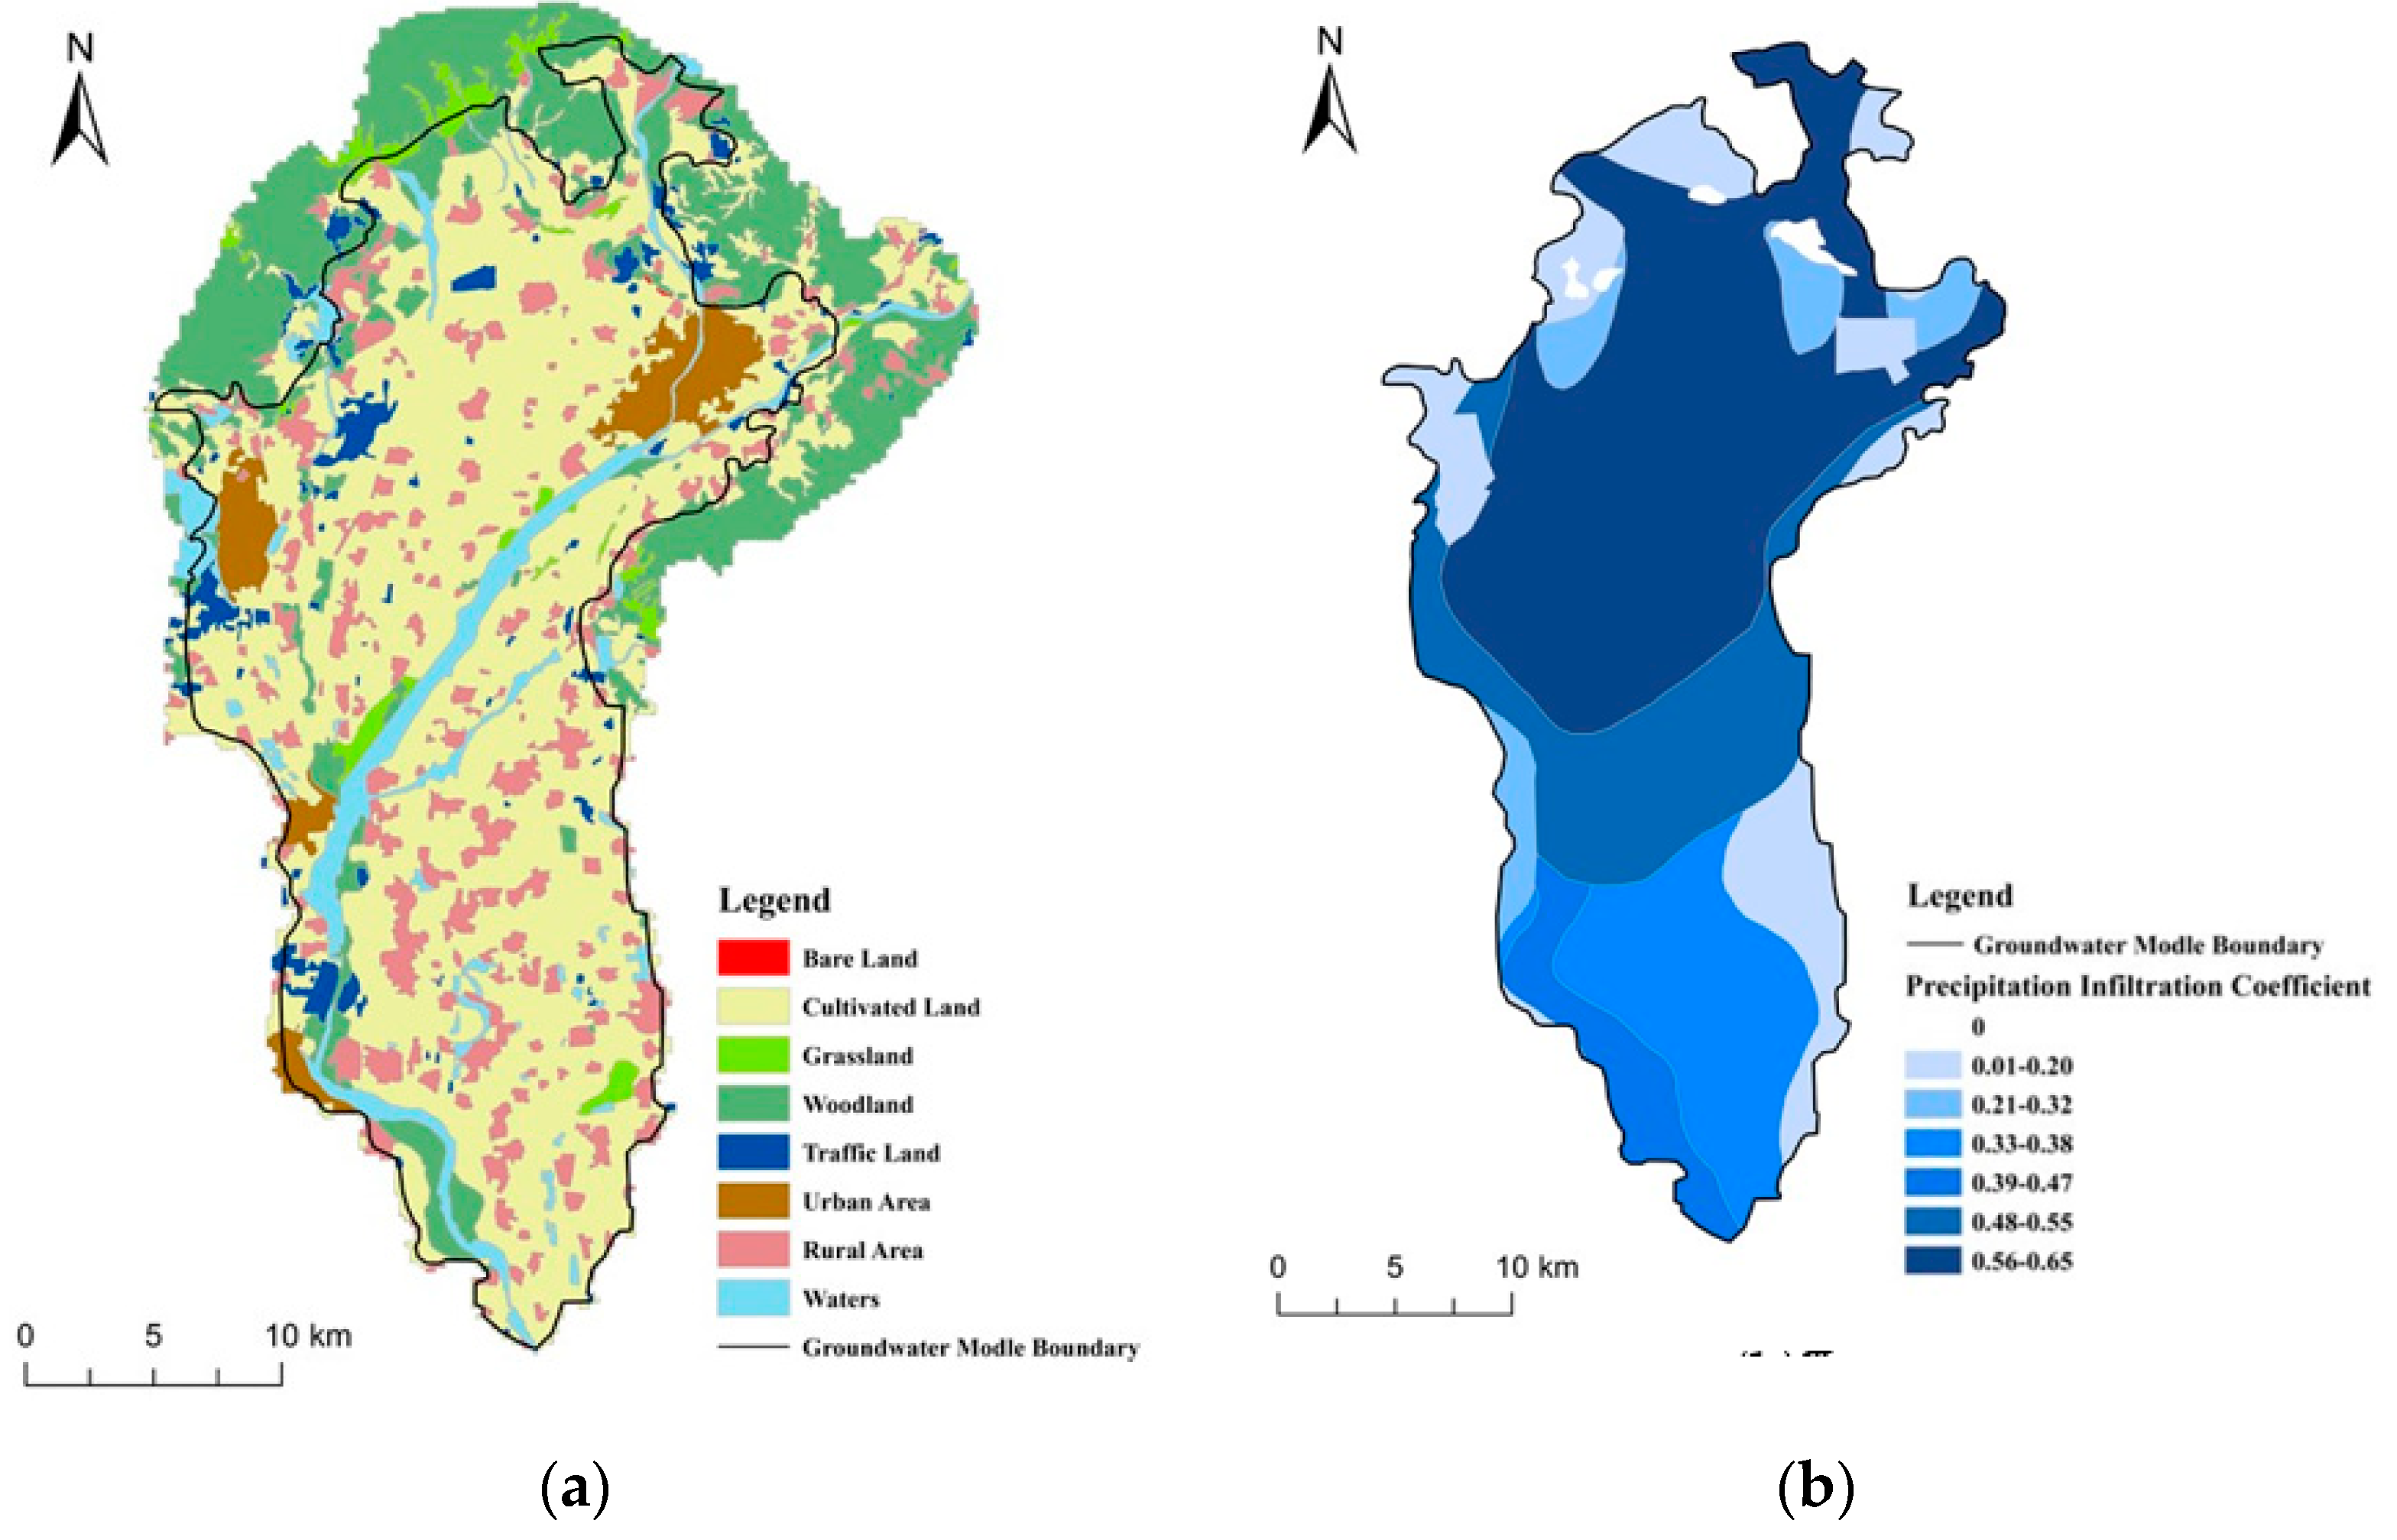
3.2. Influence of Underlying Surface Change on Precipitation Infiltration Coefficient
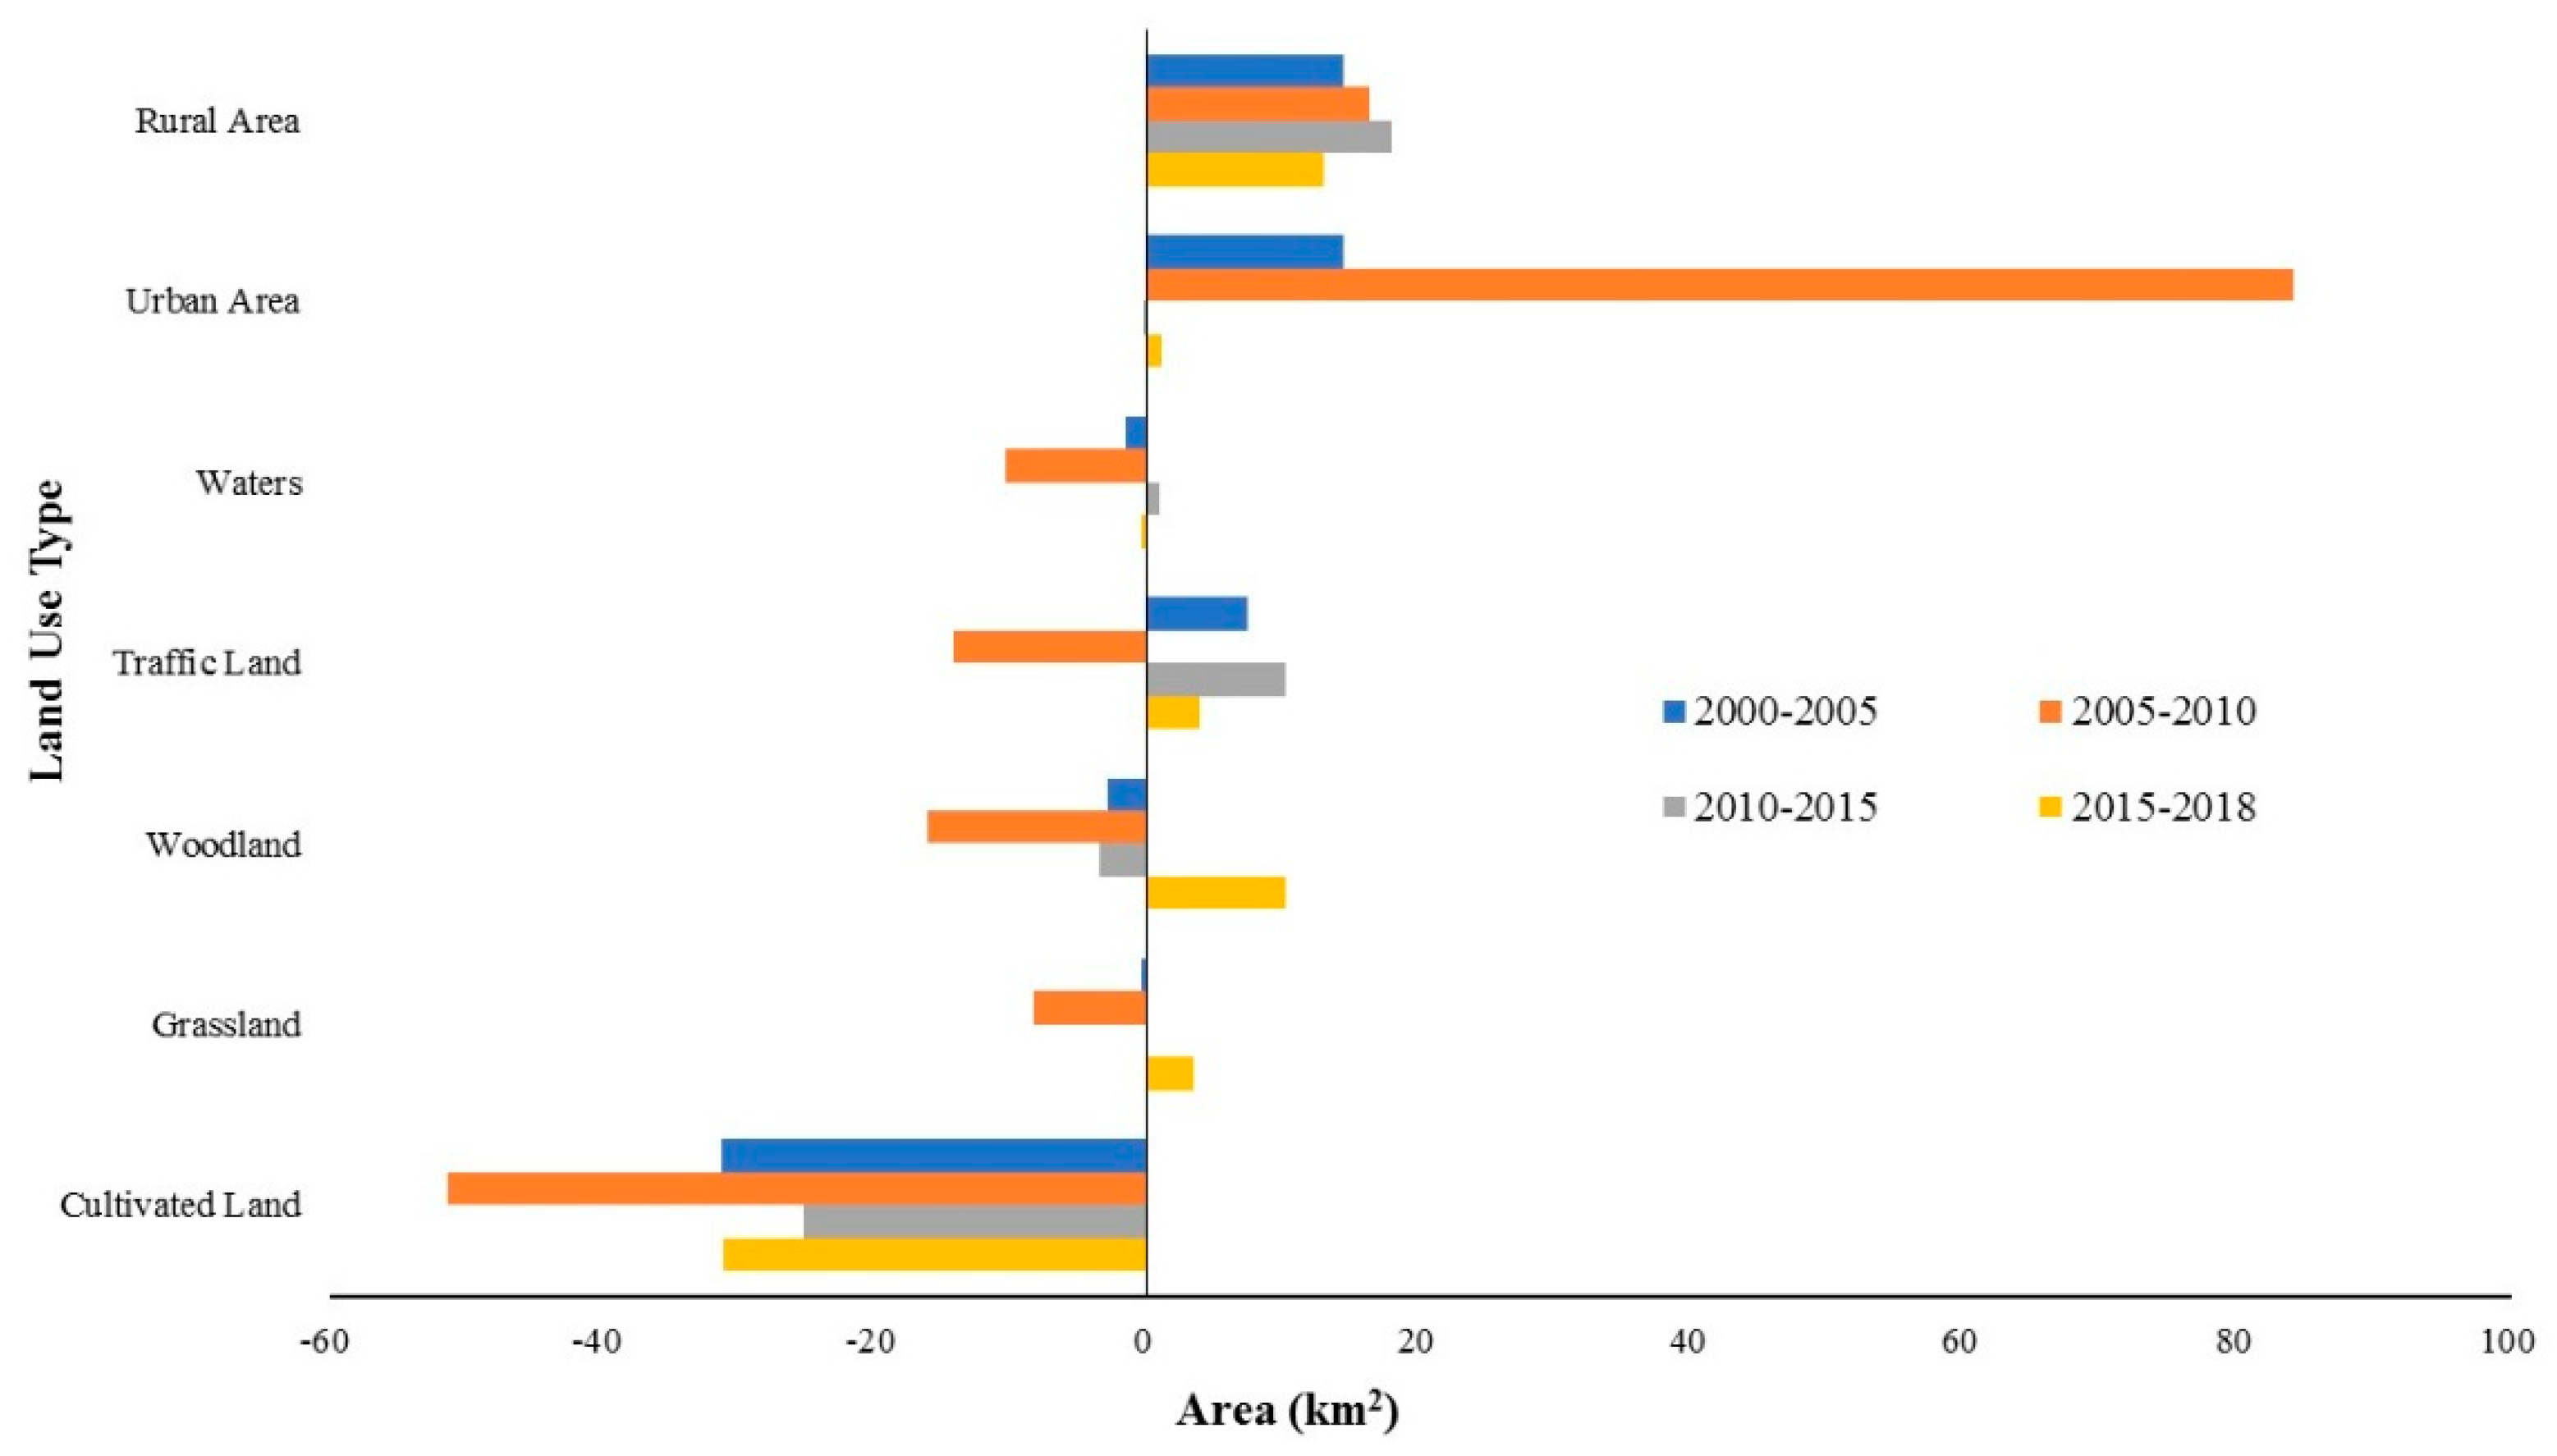
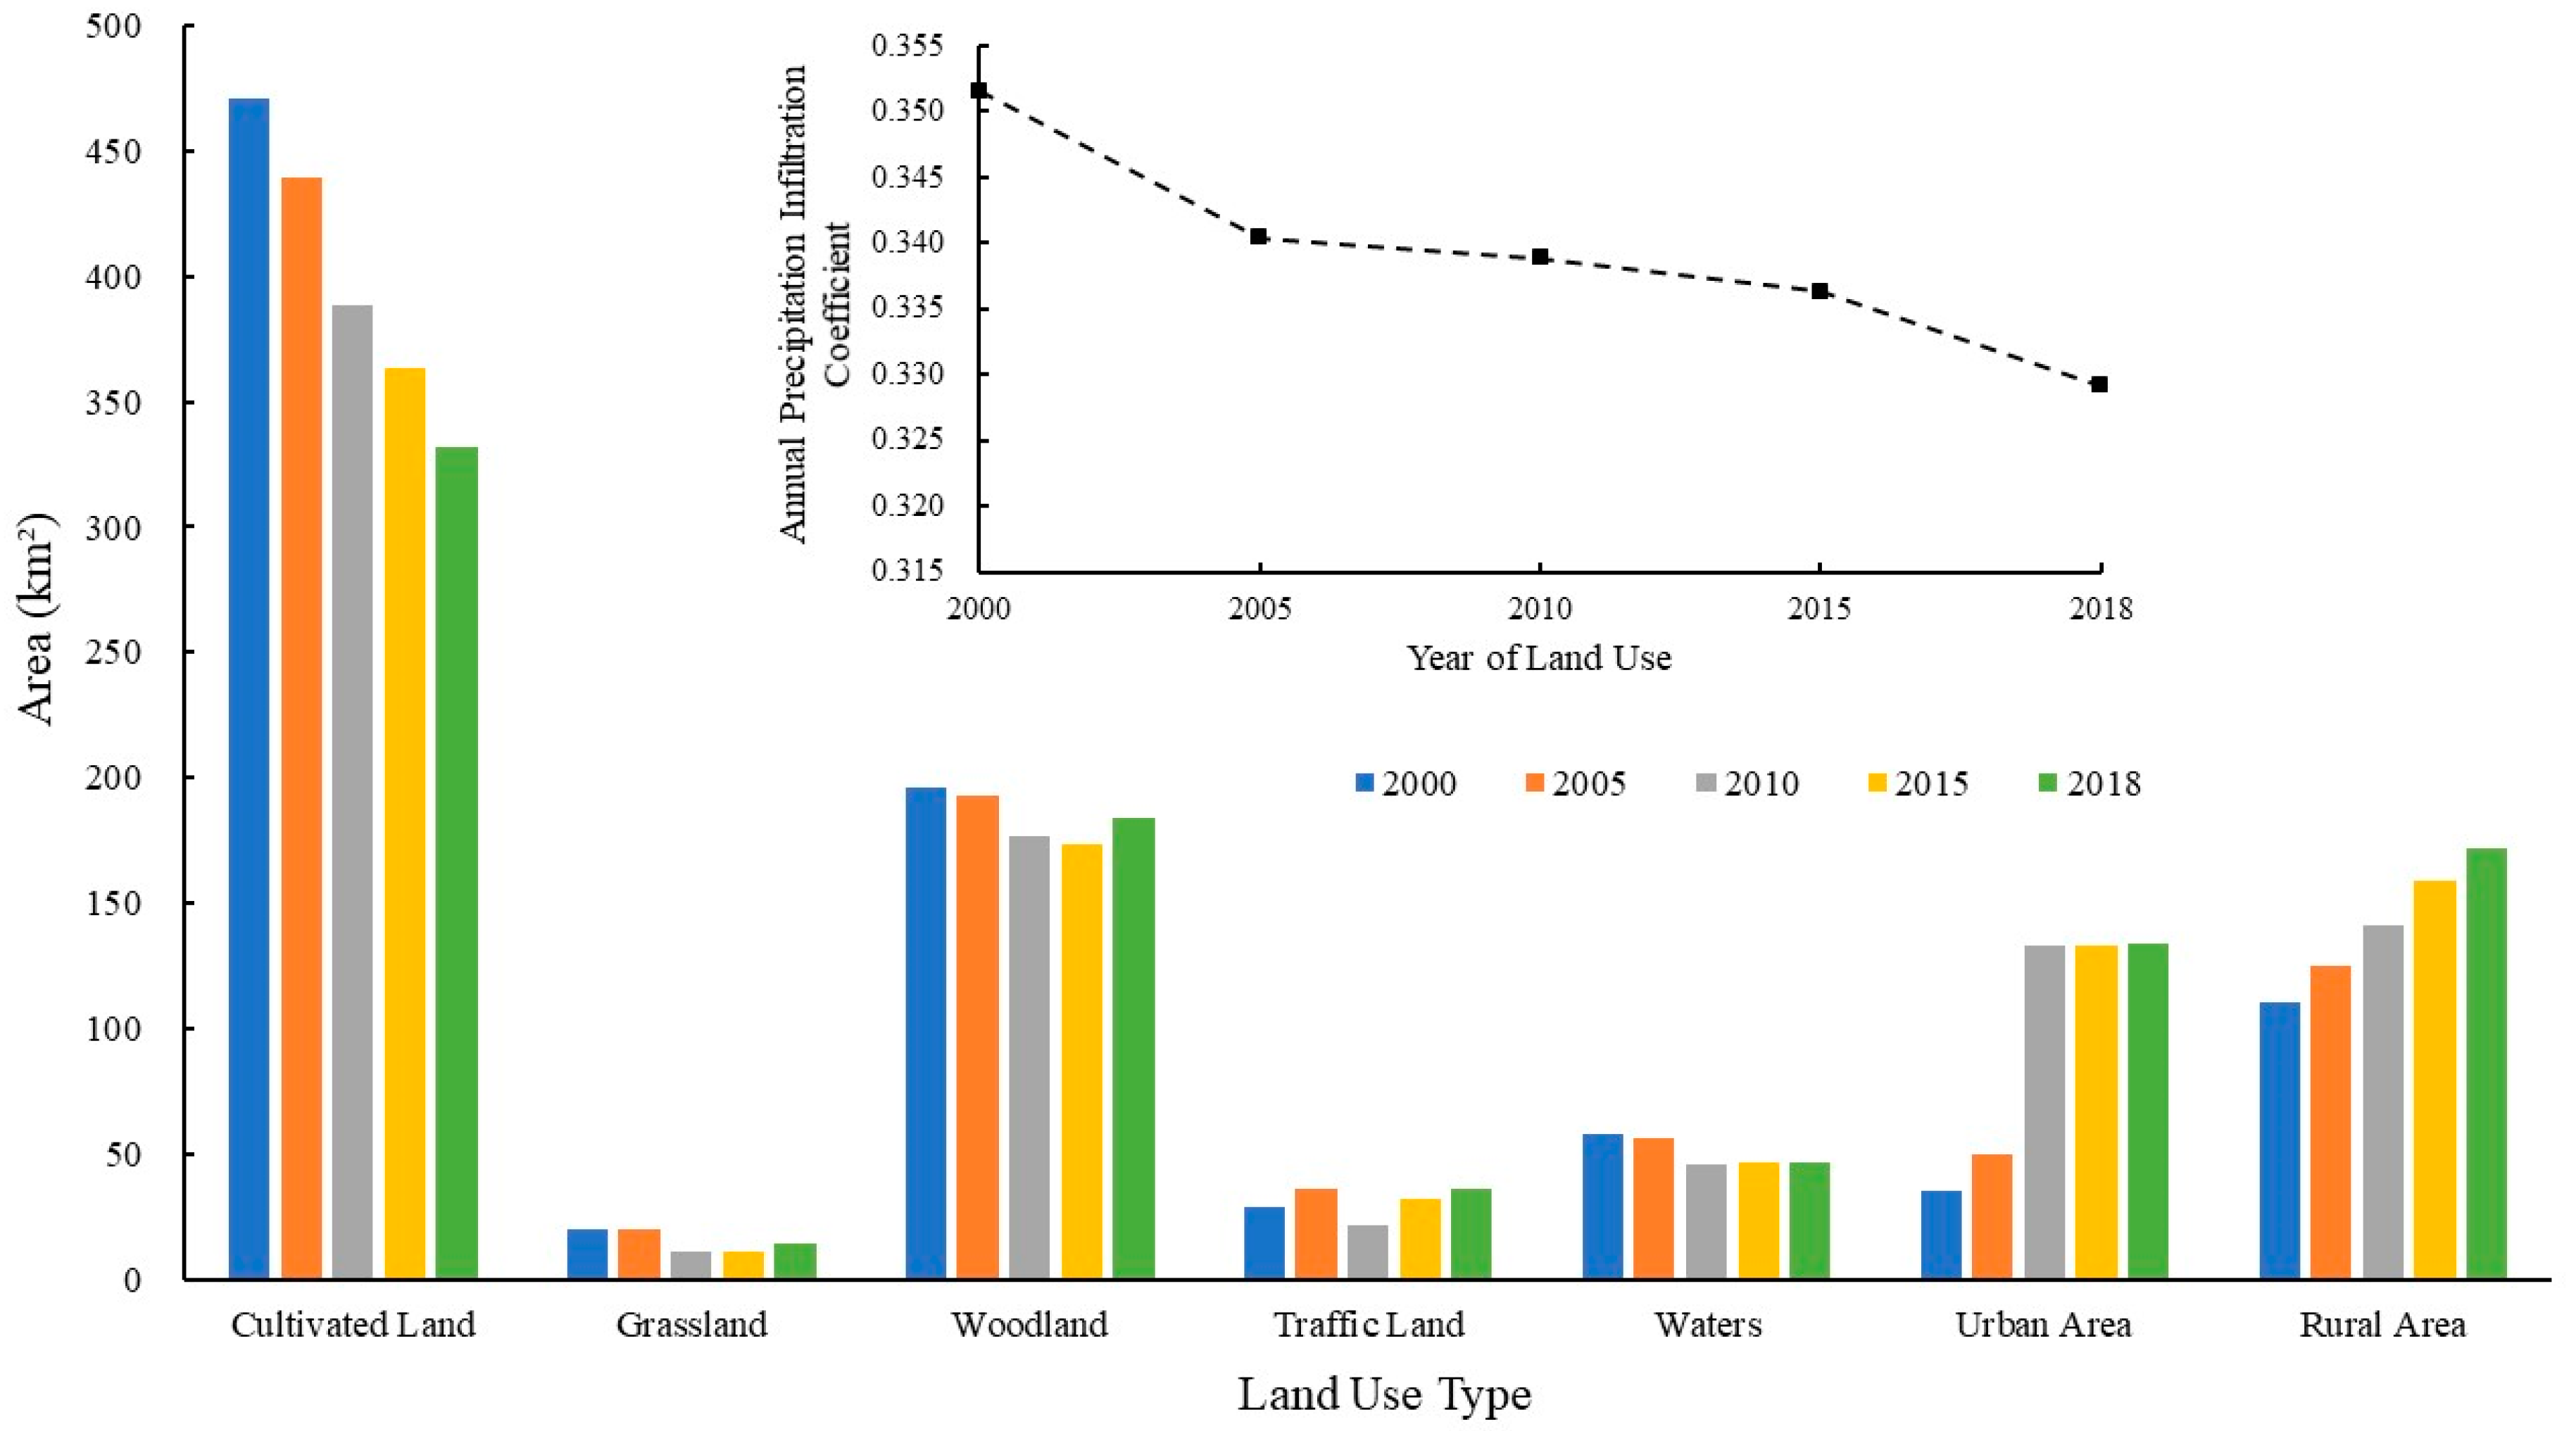
3.2.1. Analysis on Land Use Change
3.2.2. Influence of Land Use Change on Precipitation Infiltration Coefficient
Spatial Variation Analysis of Precipitation Infiltration Coefficient
Time Variation Analysis of Precipitation Infiltration Coefficient
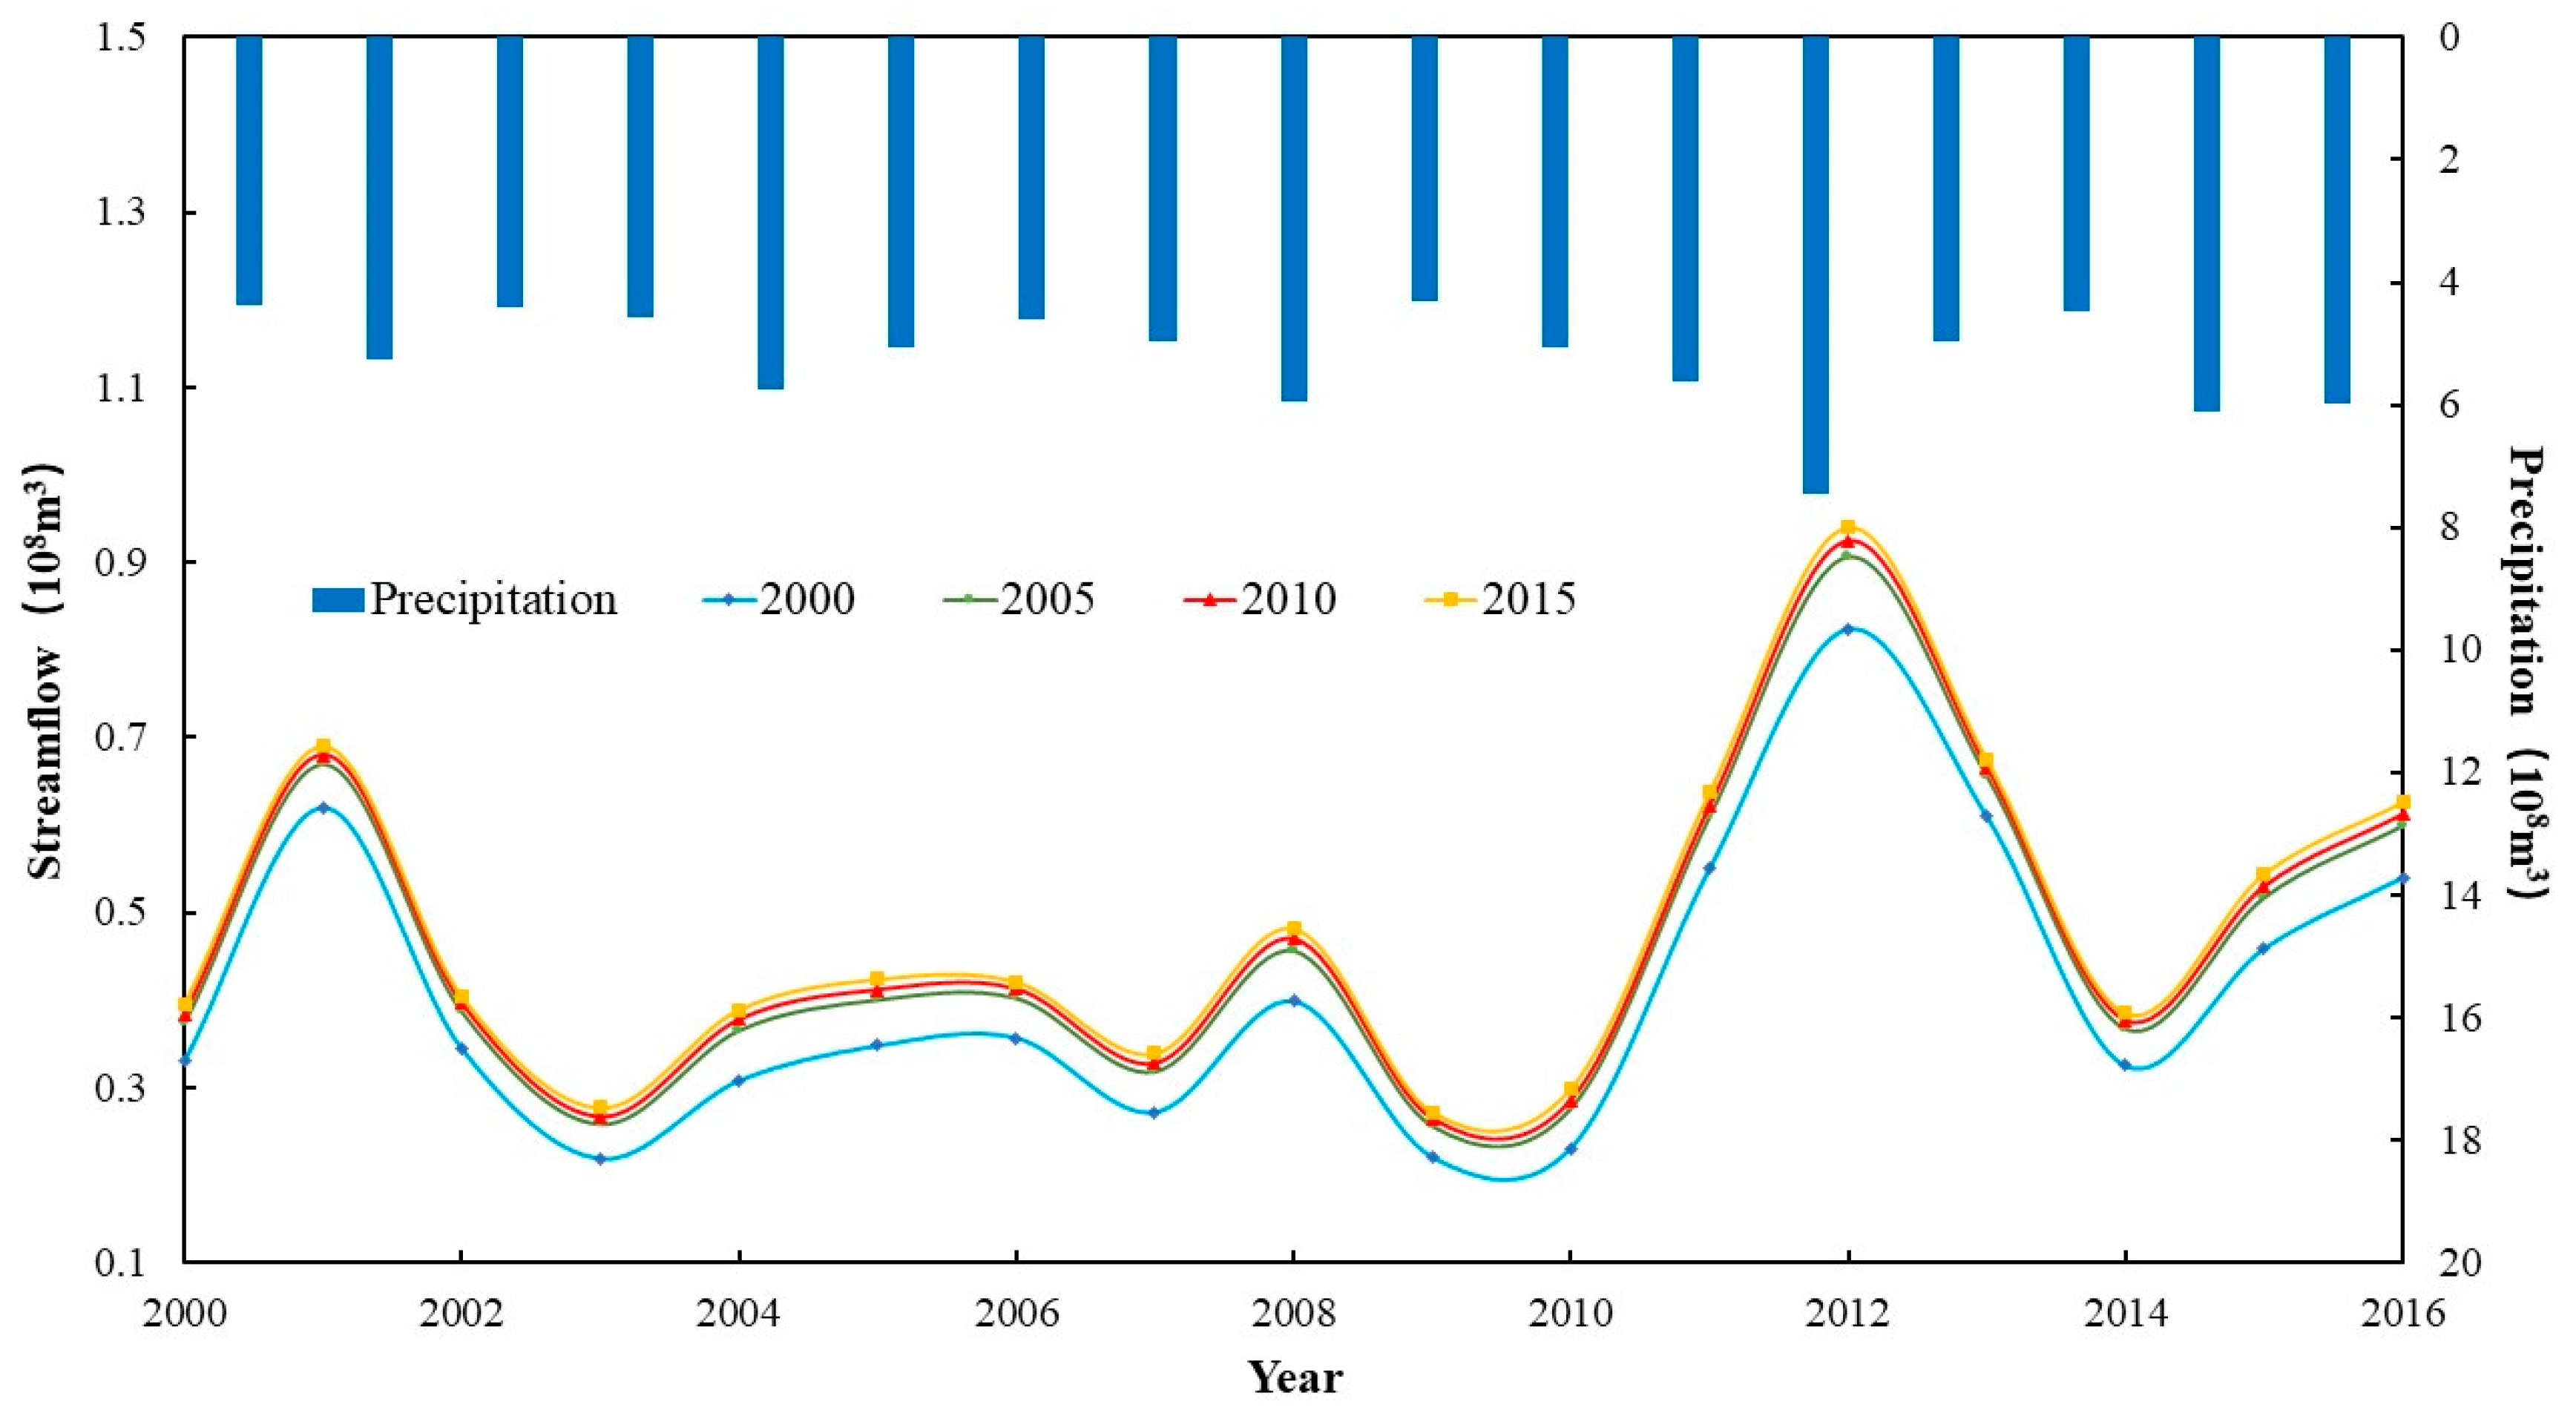
3.3. Influence of Land Use Change on Hydrological Cycle
3.3.1. Runoff Generation
3.3.2. Analysis of Water Balance in Typical Years
4. Conclusions
Author Contributions
Funding
Acknowledgments
Conflicts of Interest
Appendix A

| Serial Number | Year | Precipitation (mm) | Guarantee Rate | Serial Number | Year | Precipitation (mm) | Guarantee Rate |
|---|---|---|---|---|---|---|---|
| 1 | 1959 | 1041.3 | 1.61% | 32 | 1974 | 561.5 | 51.61% |
| 2 | 1956 | 997.5 | 3.23% | 33 | 2010 | 555.7 | 53.23% |
| 3 | 1969 | 907.5 | 4.84% | 34 | 1976 | 548.9 | 54.84% |
| 4 | 1994 | 875.1 | 6.45% | 35 | 1989 | 529.0 | 56.45% |
| 5 | 1964 | 811.2 | 8.06% | 36 | 2009 | 524.4 | 58.06% |
| 6 | 1990 | 809.8 | 9.68% | 37 | 1966 | 523.1 | 59.68% |
| 7 | 1979 | 797.1 | 11.29% | 38 | 1982 | 523.0 | 61.29% |
| 8 | 1973 | 753.6 | 12.90% | 39 | 2004 | 508.2 | 62.90% |
| 9 | 2012 | 753.6 | 14.52% | 40 | 1996 | 505.9 | 64.52% |
| 10 | 2005 | 744.9 | 16.13% | 41 | 1988 | 497.3 | 66.13% |
| 11 | 1958 | 743.6 | 17.74% | 42 | 1968 | 491.7 | 67.74% |
| 12 | 2011 | 742.8 | 19.35% | 43 | 1963 | 491.2 | 69.35% |
| 13 | 1987 | 713.0 | 20.97% | 44 | 2007 | 487.0 | 70.97% |
| 14 | 1998 | 709.8 | 22.58% | 45 | 1971 | 483.8 | 72.58% |
| 15 | 2015 | 692.2 | 24.19% | 46 | 1983 | 476.1 | 74.19% |
| 16 | 1991 | 691.4 | 25.81% | 47 | 2013 | 465.4 | 75.81% |
| 17 | 1978 | 676.3 | 27.42% | 48 | 2006 | 465.2 | 77.42% |
| 18 | 1977 | 676.2 | 29.03% | 49 | 1972 | 455.6 | 79.03% |
| 19 | 2016 | 676.1 | 30.65% | 50 | 2002 | 451.3 | 80.65% |
| 20 | 1957 | 661.8 | 32.26% | 51 | 1975 | 437.2 | 82.26% |
| 21 | 1967 | 660.2 | 33.87% | 52 | 1993 | 437.2 | 83.87% |
| 22 | 2008 | 652.0 | 35.48% | 53 | 1960 | 420.9 | 85.48% |
| 23 | 1995 | 637.0 | 37.10% | 54 | 2001 | 417.3 | 87.10% |
| 24 | 1985 | 631.8 | 38.71% | 55 | 2014 | 414.2 | 88.71% |
| 25 | 1992 | 615.4 | 40.32% | 56 | 1980 | 402.4 | 90.32% |
| 26 | 1986 | 609.1 | 41.94% | 57 | 2003 | 387.8 | 91.94% |
| 27 | 1962 | 605.0 | 43.55% | 58 | 1981 | 347.1 | 93.55% |
| 28 | 1984 | 578.7 | 45.16% | 59 | 2000 | 313.9 | 95.16% |
| 29 | 1997 | 577.8 | 46.77% | 60 | 1965 | 305.8 | 96.77% |
| 30 | 1961 | 576.0 | 48.39% | 61 | 1999 | 304.7 | 98.39% |
| 31 | 1970 | 567.4 | 50.00% | Annual average precipitation: 588.82 mm | |||
References
- Andreas, N.C. Groundwater and its economic nature. Q. J. Eng. Geol. Hydrogeol. 2019, 53, 176–188. [Google Scholar] [CrossRef]
- Gleeson, T. Global groundwater sustainability. Ground Water. 2020, 58, 484–485. [Google Scholar] [CrossRef] [PubMed] [Green Version]
- Zhao, H.; Gao, L.; Dong, S.F. Tasks of groundwater management and conservation recently in China. China Water Resour. 2013, 1, 22–25. (In Chinese) [Google Scholar]
- Qiao, W.; Howard, K.W.F.; Li, W.; Zhang, S.; Zhang, X.; Niu, Y. Coordinated exploitation of both coal and deep groundwater resources. Environ. Earth Sci. 2020, 79, 120. [Google Scholar] [CrossRef]
- Xu, K. Analysis on relationship between the precipitation & groundwater replenishment. Ground Water 2004, 26, 272–274. (In Chinese) [Google Scholar]
- Meng, S.; Liu, J.; Zhang, Z.; Lei, T.; Qian, Y.; Li, Y. Spatiotemporal evolution characteristics study on the precipitation infiltration recharge over the past 50 years in the North China Plain. J. Earth Sci. 2015, 26, 416–424. [Google Scholar] [CrossRef]
- Qi, Z.; Zhou, J.; Ji, Y.; Sun, Y.; Wang, Z.; Zheng, Y. Research on the precipitation infiltration recharge law in arid area based on long series observation data. J. Water Resour. Water Eng. 2019, 30, 124–133. (In Chinese) [Google Scholar]
- Min, Z.; Meng, J.; Xiu, W.; Zhong, Z. Analysis of precipitation recharge using observed data of lysimeter. Geol. Sci. Technol. Inf. 2002, 21, 37–40. (In Chinese) [Google Scholar]
- Yang, X. Analysis on change rule of the precipitation infiltration compensating coefficient by lysimeter. J. Water Resour. Water Eng. 2009, 20, 150–152. (In Chinese) [Google Scholar]
- Strobach, E.; Harris, B.D.; Dupuis, J.C.; Kepic, A.W. Time-lapse borehole radar for monitoring rainfall infiltration through podosol horizons in a sandy vadose zone. Water Resour. Res. 2014, 50, 2140–2163. [Google Scholar] [CrossRef] [Green Version]
- Song, B.; Zha, Y.; Yang, J. An analysis of groundwater recharge from precipitation and irrigation based on Ross numerical models. China Rural Water Hydropower 2012, 9, 55–59. (In Chinese) [Google Scholar]
- Wang, F.; Liao, Z. Study of the precipitation infiltration recharge with the D. 18O isotopes peak displacement method. J. Jilin Univ. 2007, 37, 284–287. (In Chinese) [Google Scholar]
- Healy, R.W.; Cook, P.G. Using groundwater levels to estimate recharge. Hydrogeol. J. 2002, 10, 91–109. [Google Scholar] [CrossRef]
- Scanlon, B.R. Evaluation of liquid and vapor water flow in desert soils based on chlorine 36 and tritium tracers and nonisothermal flow simulations. Water Resour. Res. 1992, 28. [Google Scholar] [CrossRef]
- Gao, Y.; Chen, J.; Luo, H.; Wang, H. Prediction of hydrological responses to land use change. Sci. Total Environ. 2020, 708, 134998. [Google Scholar] [CrossRef]
- Shi, H.; Chen, J. Characteristics of climate change and its relationship with land use/cover change in Yunnan Province, China. Int. J. Clim. 2018, 38, 2520–2537. [Google Scholar] [CrossRef]
- Germer, S.; Neill, C.; Vetter, T.; Joaquin, C.; Krusche, A.V.; Elsenbeer, H. Implications of long-term land-use change for the hydrology and solute budgets of small catchments in Amazonia. J. Hydrol. 2009, 364, 349–363. [Google Scholar] [CrossRef]
- Gupta, S.C.; Kessler, A.C.; Brown, M.K.; Zvomuya, F. Climate and agricultural land use change impacts on streamflow in the upper midwestern United States. Water Resour. Res. 2015, 51, 5301–5317. [Google Scholar] [CrossRef]
- Cherubin, M.R.; Franco, A.L.C.; Cerri, C.E.P.; Oliveira, D.; Davies, C.A.; Cerri, C.C. Sugarcane expansion in Brazilian tropical soil-Effects of land use change on soil chemical attributes. Agric. Ecosyst. Environ. 2015, 211, 173–184. [Google Scholar] [CrossRef]
- Jin, X.; Jin, Y.; Yang, D.X. Improved SWAT and its application to a region with severe land use/land cover changes. J. Geo-Inf. Sci. 2018, 20, 1064–1073. (In Chinese) [Google Scholar]
- Aboelnour, M.; Gitau, M.W.; Engel, B.A. A comparison of streamflow and baseflow responses to land-use change and the variation in climate parameters using SWAT. Water 2020, 12, 191. [Google Scholar] [CrossRef] [Green Version]
- Zhang, H.; Wang, B.; Liu, D.; Zhang, M.; Yu, Q. Using an improved swat model to simulate hydrological responses to land use change: A case study of a catchment in tropical Australia. J. Hydrol. 2020, 585, 124822. [Google Scholar] [CrossRef]
- Mohseni, N.; Sepehr, A.; Hosseinzadeh, S.R.; Golzarian, M.R.; Shabani, F. Variations in spatial patterns of soil–vegetation properties over subsidence-related ground fissures at an arid ecotone in northeastern Iran. Environ. Earth Sci. 2017, 76, 234. [Google Scholar] [CrossRef]
- Kerrou, J.; Renard, P.; Tarhouni, J. Status of the Korba groundwater resources (Tunisia): Observations and three-dimensional modelling of seawater intrusion. Hydrogeol. J. 2020, 18, 1173–1190. [Google Scholar] [CrossRef]
- Sun, X.; Peng, J.; Cui, X.; Jiang, Z. Relationship between ground fissures, groundwater exploration and land subsidence in Taiyuan basin. Chin. J. Geol. Hazard Control 2016, 27, 91–98. (In Chinese) [Google Scholar]
- Zhang, A. Groundwater in Beijing; China Land Press: Beijing, China, 2008; p. 58. [Google Scholar]
- Zhao, Z.; Wang, H.; Bai, Q.; Wu, Y.; Wang, C. Quantitative analysis of the effects of natural and human factors on a hydrological system in Zhangweinan Canal Basin. Water 2020, 12, 186. [Google Scholar] [CrossRef]
- Gao, F.; Feng, G.; Han, M.; Dash, P.; Liu, C. Assessment of surface water resources in the big sunflower river watershed using coupled SWAT-MODFLOW model. Water 2019, 11, 528. [Google Scholar] [CrossRef] [Green Version]
- Bauwe, A.; Kahle, P.; Lennartz, B. Hydrologic evaluation of the curve number and Green and Ampt infiltration methods by applying Hooghoudt and Kirkham tile drain equations using SWAT. J. Hydrol. 2016, 537, 311–321. [Google Scholar] [CrossRef]
- Neitsch, S.L.; Arnold, J.G.; Kiniry, J.R. Soil and Water Assessment Tool Theoretical Documentation Version 2009; Texas Water Resources Institute: Temple, TX, USA, 2011. [Google Scholar]
- Zhang, J.; Li, J.; Yin, B.; Gao, Y.; Liu, X. Evaluation of land use change of Jungar Banner based on land use transfer matrix. Bull. Soil Water Conserv. 2018, 38, 131–134. (In Chinese) [Google Scholar]
- Bailey, R.T.; Wible, T.C.; Arabi, M.; Records, R.M.; Ditty, J. Assessing regional-scale spatio-temporal patterns of groundwater-surface water interactions using a coupled SWAT-MODFLOW model. Hydrol. Process. 2016, 30, 4420–4433. [Google Scholar] [CrossRef]
- Han, Z.; Shao, J.; Cui, Y.; Cheng, T.; Yang, C. Preprocessing optimization of groundwater flow model based on MODFLOW. J. Jilin Univ. 2014, 44, 1290–1296. (In Chinese) [Google Scholar]
- Chu, J.; Zhang, C.; Zhou, H. Research and Application of Interface and Frame Structure of SWAT and MODFLOW Models Coupling. Prog. Geol. 2011, 30, 335–342. (In Chinese) [Google Scholar]
- Zhang, X.; Mao, Y.; Dong, J.; Li, Z. A coupled model simulation and application of SWAT-MODFLOW. Water Resour. Prot. 2010, 26, 49–52. (In Chinese) [Google Scholar]
- Kim, N.W.; Chung, I.M.; Won, Y.S.; Arnold, J.G. Development and application of the integrated SWAT–MODFLOW model. J. Hydrol. 2008, 356, 1–16. [Google Scholar] [CrossRef]
- Liu, W. Hydrological Simulation and Runoff Response Analysis Based on SWAT Model: A Case Study of Weihe River in Guanzhong Area. Ph.D. Thesis, Northwest University, Xi’an, China, 2014. (In Chinese). [Google Scholar]
- Nash, J.E.; Sutcliffe, J.V. River flow forecasting through conceptual models—A discussion of principles. J. Hydrol. 1970, 10, 282–290. [Google Scholar] [CrossRef]
- Mendona, F.; Oliveira, R.P.D.; Lollo, D. Effects of land use changes on streamflow and sediment yield in Atibaia River Basin-SP, Brazil. Water 2020, 12, 1711. [Google Scholar] [CrossRef]
- Krause, P.; Boyle, D.P.; Base, F. Comparison of different efficiency criteria for hydrological model assessment. Adv. Geosci. 2005, 5, 89–97. [Google Scholar] [CrossRef] [Green Version]
- Ramanarayanan, T.S.; Williams, J.R.; Dugas, W.A.; Hauck, L.M.; McFarland, A.M.S. Using APEX to identify alternative practices for animal waste management: Part II. Model application. Paper number 972209. In Proceedings of the American Society of Agricultural Engineers Annual International Meeting, Minneapolis, MN, USA, 10–14 August 1997. [Google Scholar]
- Jin, G.; Wang, J.; Zheng, S.; Song, J. Measurement and estimation of the parameters for groundwater resources computation. Adv. Water Sci. 1997, 8, 16–24. (In Chinese) [Google Scholar]
- Zhang, L.; Cui, Y.; Liang, G.; Liang, L.; Wang, X. Application of SWAT-MODFLOW coupling model in groundwater balance analysis. South-to-North Water Transf. Water Sci. Technol. 2020, 18, 176–183. (In Chinese) [Google Scholar]
- Pan, Y.; Gong, H.; Zhou, D.; Li, X.; Nakagoshi, N. Impact of land use change on groundwater recharge in Guishui River Basin, China. Chin. Geogr. Sci. 2011, 21, 734–743. [Google Scholar] [CrossRef]
- Adhikari, R.K.; Mohanasundaram, S.; Shrestha, S. Impacts of land-use changes on the groundwater recharge in the Ho Chi Minh city, Vietnam. Environ. Res. 2020, 185, 109440. [Google Scholar] [CrossRef] [PubMed]
- Sertel, E.; Imamoglu, M.Z.; Cuceloglu, G.; Erturk, A. Impacts of land cover/use changes on hydrological processes in a rapidly urbanizing mid-latitude water supply catchment. Water 2019, 11, 1075. [Google Scholar] [CrossRef] [Green Version]
- Nigussie, T.A.; Altunkaynak, A. Assessing the hydrological response of Ayamama watershed from urbanization predicted under various landuse policy scenarios. Water Resour. Manag. 2016, 30, 3427–3441. [Google Scholar] [CrossRef]
- Gao, Y.; Yuan, Y.; Wang, H.; Schmidt, A.R.; Wang, K.; Ye, L. Examining the effects of urban agglomeration polders on flood events in Qinhuai River Basin, China with HEC-HMS model. Water Sci. Technol. 2017, 75, 2130–2138. [Google Scholar] [CrossRef]
- Carlson, T.N.; Arthur, S.T. The impact of land use-land cover changes due to urbanization on surface microclimate and hydrology: A satellite perspective. Glob. Planet. Chang. 2000, 25, 49–65. [Google Scholar] [CrossRef]
- H uff, F.A.; Changnon, S.A. Climatological assessment of urban effects on precipitation at St. Louis. J. Appl. Meteorol. 1972, 11, 823–842. [Google Scholar] [CrossRef] [Green Version]
- Graaf, I.E.M.D.; Gleeson, T.; Beek, L.P.H.R.V.; Sutanudjaja, E.H.; Bierkens, M.F.P. Environmental flow limits to global groundwater pumping. Nature 2019, 574, 90–94. [Google Scholar] [CrossRef]
- Liu, Y.; Xu, Y.; Shi, Y. Hydrological effects of urbanization in the qinhuai river basin, China. In Proceedings of the Engineering, International Conference on Modern Hydraulic Engineering (CMHE), Nanjing, China, 9–11 March 2012. [Google Scholar]


| Method | Data Type | Scale | Year | |
|---|---|---|---|---|
| SWAT Model | Spatial Data | DEM 1 | 90 × 90 m | |
| Land Use Map 2 | 1000 × 1000 m | 2010 | ||
| Soil Type Map 3 | 1000 × 1000 m | 2015 | ||
| Attribute Data 4 | Meteorological Data | Diurnal Scale | 2000–2016 | |
| Reservoir Data | Monthly Scale | 2000–2016 | ||
| Runoff Data | Monthly Scale | 2000–2016 | ||
| Land Use Analysis | Landsat 8 Remote Sensing Image 2 | 30 × 30 m | 2000, 2005, 2010, 2015, 2018 | |
| Land Use Types | 2015 | ||||||||
|---|---|---|---|---|---|---|---|---|---|
| Grassland | Urban Area | Cultivated Land | Traffic Land | Woodland | Rural Area | Waters | Total | ||
| 2000 | Grassland | 9.50 | 0.29 | 3.07 | 4.30 | 1.03 | 0.58 | 1.13 | 19.90 |
| Urban Area | 0.01 | 34.39 | 0.21 | 0.00 | 0.02 | 0.00 | 0.29 | 34.92 | |
| Cultivated Land | 0.58 | 55.32 | 317.24 | 12.68 | 11.15 | 67.28 | 6.58 | 470.84 | |
| Traffic Land | 0.34 | 13.55 | 3.89 | 4.54 | 1.12 | 4.85 | 0.42 | 28.72 | |
| Woodland | 0.40 | 6.53 | 17.69 | 5.35 | 157.10 | 6.12 | 2.78 | 195.97 | |
| Bare Land | 0.00 | 0.07 | 0.01 | 0.00 | 0.06 | 0.00 | 0.00 | 0.15 | |
| Rural Area | 0.16 | 15.81 | 12.04 | 2.46 | 2.31 | 77.06 | 0.29 | 110.12 | |
| Waters | 0.02 | 7.11 | 9.08 | 2.64 | 0.71 | 2.94 | 34.95 | 57.45 | |
| Total | 11.02 | 133.07 | 363.23 | 31.96 | 173.51 | 158.83 | 46.45 | 918.06 | |
| Precipitation | Frequency | Typical Year |
|---|---|---|
| (mm) | ||
| >1000 | 1 | 1959 |
| 900–1000 | 2 | 1956, 1969 |
| 800–900 | 3 | 1964, 1994 |
| 700–800 | 8 | 2005, 2012 |
| 600–700 | 13 | 2008, 2016 |
| 500–600 | 13 | 2009, 2010 |
| 400–500 | 16 | 2007, 2013 |
| 300–400 | 5 | 2000, 2003 |
| Equilibrium Term | Rainy Year | Normal Year | Dry Year | ||||
|---|---|---|---|---|---|---|---|
| 2012 | 2010 | 2013 | |||||
| Before Change | After Change | Before Change | After Change | Before Change | After Change | ||
| Recharge | Precipitation Infiltration | 263 | 220 | 180 | 119 | 175 | 109 |
| Agricultural Irrigation Supply | 22 | 22 | 27 | 27 | 22 | 22 | |
| Irrigation Supply of Canal System | 6 | 6 | 8 | 8 | 6 | 6 | |
| Pipe Leakage Supply | 67 | 67 | 67 | 67 | 67 | 67 | |
| Lateral Recharge in Piedmont | 52 | 81 | 39 | 45 | 51 | 48 | |
| Boundary Lateral Inflow Recharge | 20 | 24 | 17 | 21 | 21 | 25 | |
| Subtotal | 430 | 419 | 338 | 286 | 343 | 277 | |
| Discharge | Exploitation | 429 | 429 | 424 | 424 | 339 | 339 |
| Boundary Lateral Outflow | 0.1 | 0.09 | 0.2 | 0.14 | 0.1 | 0.07 | |
| Lateral Outflow Between Layers | 15 | 9 | 18 | 12 | 7 | 3 | |
| Subtotal | 445 | 439 | 442 | 436 | 346 | 342 | |
| Total | Difference | −15 | −19 | −104 | −150 | −3 | −65 |
| Vertical Exchange Capacity | −174 | −177 | −185 | −186 | −133 | −131 | |
Publisher’s Note: MDPI stays neutral with regard to jurisdictional claims in published maps and institutional affiliations. |
© 2020 by the authors. Licensee MDPI, Basel, Switzerland. This article is an open access article distributed under the terms and conditions of the Creative Commons Attribution (CC BY) license (http://creativecommons.org/licenses/by/4.0/).
Share and Cite
Zhang, L.; Wang, C.; Liang, G.; Cui, Y.; Zhang, Q. Influence of Land Use Change on Hydrological Cycle: Application of SWAT to Su-Mi-Huai Area in Beijing, China. Water 2020, 12, 3164. https://doi.org/10.3390/w12113164
Zhang L, Wang C, Liang G, Cui Y, Zhang Q. Influence of Land Use Change on Hydrological Cycle: Application of SWAT to Su-Mi-Huai Area in Beijing, China. Water. 2020; 12(11):3164. https://doi.org/10.3390/w12113164
Chicago/Turabian StyleZhang, Linlin, Caiyuan Wang, Guixing Liang, Yali Cui, and Qiulan Zhang. 2020. "Influence of Land Use Change on Hydrological Cycle: Application of SWAT to Su-Mi-Huai Area in Beijing, China" Water 12, no. 11: 3164. https://doi.org/10.3390/w12113164
APA StyleZhang, L., Wang, C., Liang, G., Cui, Y., & Zhang, Q. (2020). Influence of Land Use Change on Hydrological Cycle: Application of SWAT to Su-Mi-Huai Area in Beijing, China. Water, 12(11), 3164. https://doi.org/10.3390/w12113164