Article

Exploring the Dominant Runoff Processes in Two Typical Basins of the Yellow River, China

College of Water Conservancy Science & Engineering, Zhengzhou University, Zhengzhou 450001, China
*
Author to whom correspondence should be addressed.
Water 2020, 12(11), 3055; https://doi.org/10.3390/w12113055
Submission received: 27 September 2020 / Revised: 28 October 2020 / Accepted: 28 October 2020 / Published: 30 October 2020
(This article belongs to the Special Issue Catchment-Scale Solutions in the Context of Climate Change)

Abstract

:
Storm runoff in basins is comprised of various runoff processes with widely disparate infiltration and storage capacities, such as Hortonian overland flow (HOF), saturated overland flow (SOF), sub-surface flow (SSF), and deep percolation (DP). Areas may be classified according to these various runoff processes based on the soil characteristics, geology, topography, and land-use. This study analyzes changes in runoff components in the Jialu River basin and the Fen River (Jingle sub-basin) during runoff generation from 1980 to 2013 using the runoff segmentation method. Based on the decision scheme, the dominant runoff process (DRP) in the basins was distinguished using geographic information system (GIS) tools. The impact of different runoff process distributions on the changes in the runoff for the basin was determined. The results show that the floods in the Jialu River basin and Jingle sub-basin were dominated by overland flow components. Compared with 1980–1999, the proportion of overland flow components for 2000–2013 in two basins showed a decreasing trend by 8.3% and 7.1%, respectively, while the interflow and underground runoff components increased. In addition, HOF was the DRP in the Jialu River basin and Jingle sub-basin from 2000 to 2013. The area of the rapid runoff processes (HOF, SOF1, and SSF1) in the Jialu River basin and Jingle sub-basin accounted for 89% and 78% of the entire basin, respectively. In contrast, the slow runoff processes (SOF2, SSF2, and DP) accounted for 11% and 22% of the entire basin, respectively. The runoff of the Jingle sub-basin was substantially lower than that of the Jialu River basin under the same rainfall conditions, because of the influence of the distribution of different runoff processes. Compared with the Jialu River Basin, the peak discharge and runoff of Jingle sub-basin were 190.4 m3/s and 2.85 mm lower on average, respectively. The results of this study provide useful information to understand land-use changes and formulate management practices to reduce flooding in the Yellow River.

1. Introduction

Water resources play an important role in life and have extremely high socio-economic significance in different sectors, such as agriculture, industry, trade, food production, and hydropower generation [1]. However, in recent decades, the over-exploitation and reckless use of water resources have created major challenges such as the pollution, depletion, and inequitable distribution of the resource. This threatens socio-economic development and the natural environment [2,3,4]. The runoff in the Yellow River has significantly reduced, with sudden changes occurring after the 1980s [5,6,7]. Human activities (e.g., Grain for Green Project) and climate change (e.g., changes to rainfall and temperature) are considered to be the key factors causing dramatic reductions in the runoff in the middle reaches of the Yellow River [8]. Climatic variation changes the spatio-temporal distribution of global water resources [9], and changes in the underlying surface conditions are one of the driving factors in the short-term [10,11]. In the background of population growth and increasing demands for natural resources, there is an urgent need for improved watershed management and hydrological disaster prevention. As part of this, the focus must be placed on the impact of underlying surface conditions on regional runoff generation mechanisms.
The direction of change and degree of the underlying surface cover patterns profoundly impact the runoff generation in the basin. Land-use variations, such as converting farmlands to forests and grasslands, desertification, urbanization, and wetland reclamation, influence the changes in the distribution of surface water resources under the same rainfall conditions. Such land-use changes have altered the catchment runoff generation process, leading to flooding or drought [12]. Soil types determine the physical properties and infiltration characteristics of the soil, and the study of soil infiltration performance is the basis and prerequisite for exploring the runoff generation mechanisms of the watershed [13]. Slope is a major topographical factor that influences soil infiltration, runoff velocity, and soil stability. Overland flow and interflow on slopes are important components of watershed runoff, directly affecting the hydrological process of the watershed [14]. Variations in the underlying surface conditions caused by land-use, soil types, and topographical factors have an objective impact on runoff and floods. Consideration must be given to bringing these factors together to discern the runoff processes that occur at a given site and how these processes influence runoff generation in the basin during intensive rainfall events.
Determination of the dominant runoff process (DRP) is an important method for the detailed investigation and analysis of soil hydrological parameters, including hydrological predictions of the basin, water resources’ protection and management, and flood and erosion hazard prevention [15,16,17]. The DRP is defined as the runoff process that mostly contributes to runoff generation during a rainfall event. DRPs are divided into Hortonian overland flow (HOF), saturated overland flow (SOF), sub-surface flow (SSF), and deep percolation (DP). The research methods used to study the DRP in the basin in recent years may be divided into two: (1) manual field investigation and (2) automatic recognition based on geographic information system (GIS), also called GIS-DRP. While (1) is the best and most reliable way to understand the DRPs in different areas of the watershed, this method is expensive and time-consuming. As such, it is only suitable for small basins. Naef et al. (2002) proposed that assessing the impact of land-use change on storm runoff could be based on the distribution of the DRP in the watershed [18], where DRP is determined through detailed soil data combined with remote sensing topographic data. On the basis of the GIS-DRP method, Scherrer and Naef (2003) carried out a series of studies to establish a decision scheme and a DRP distribution map of two small areas in Switzerland. They were then able to analyze the flood response according to the location and spatial extent of the DRP maps [19]. Antonetti et al. (2016) tested the applicability of different automatic DRP mapping methods to a study region in Germany and quantified the uncertainties of hydrological simulations due to differing spatial distributions of DRP [20].
The middle reaches of the Yellow River basin in China experience the most severe instances of soil erosion in the world. Researchers have carried out many studies on the influence of climatic conditions and underlying surface factors on the runoff generation process in the basin, such as runoff coefficient simulation, surface runoff prediction, and the contribution rate of different influencing factors, each yielding varying results [21,22]. However, only a few studies investigated the DRP in basins. This study uses the Jialu River basin and Jingle sub-basin in the middle reaches of the Yellow River as study sites. The underlying surface factors were used to comprehensively determine the DRP in each area of the basins and analyze the relationship between the distribution of different runoff processes and runoff generation. This study had three aims: (1) analyze the changes in the runoff composition at different periods in the basins, (2) test the suitability of GIS-DRP method for typical basins in the Yellow River, and (3) discuss the difference of flood process in the basins due to different spatial distribution of DRPs. Combining the knowledge of the spatial distribution of DRPs in a watershed with the current land use can provide useful information for flood risk management as well as for soil and water conservation in the typical basins of the Yellow River.

2. Materials and Methods

2.1. Study Area

The Jingle sub-basin is located in the north and upper reaches of the Fen River basin (Figure 1); it is one of the largest tributaries of the Yellow River. The drainage area of the Jingle sub-basin is 2799 km2. The area has an average annual precipitation of 503 mm (based on 1980–2013 data), 60% of which occurs between July and September. The average annual runoff in the basin is 2.28 × 10⁹ m3 (based on 1980–2013 data). The area is predominantly covered by forest and grass, followed by farmland. The underlying bedrock consists of limestone, sandstone, shale, and conglomerate. Additional details on this basin are provided in Table 1.
The Jialu River basin is a first-order tributary in the mid reaches of the Yellow River. It originates from the eastern part of the Ordos Plateau (Figure 1). The drainage area of the Jialu River basin is 1134 km2, and the basin has an average annual precipitation of 375 mm (based on 1980–2013 data). Frequently occurring floods in July and August often lead to substantial soil erosion in the basin. The average annual runoff in the basin is 0.61 × 10⁹ m3 (based on 1980–2013 data). The area is predominantly covered by grass and farmlands. The underlying bedrock consists of limestone, sandstone, and alluvial rock (Table 1).

2.2. Data Collection

2.2.1. Hydro-Meteorological Data

The collected hydrological data included precipitation, evaporation, and runoff from 1980 to 2013. There are 16 hydro-meteorological stations in the Jingle sub-basin and six hydro-meteorological stations in the Jialu River basin (Figure 1). Area-averaged rainfall and evaporation data were obtained using the Thyssen polygon method. Hydrological stations were extracted from the data of the Yellow River basin [23]. Floods that reached a minimum peak flow rate of 100 m3/s during the study period (from 1980 to 2013) were included in this study. In total, 90 flood events that occurred between July and September were selected; of these, 50 occurred in the Jingle sub-basin and the remaining 40 occurred in the Jialu River basin.

2.2.2. Spatial Data

Table 2 lists all spatial data sources available in digital form, including those containing data on soil type, soil characteristics, and geological information. The soil map (Figure 2) contained the spatial distribution information of soil for the entire basin, and the mapping units are based on the genetic soil classification of China and converted and correlated to the FAO (The Food and Agriculture Organization) Revised Legend [24]; loam and sandy loam are the main soil types in the study area. The soil information map contained basic soil information for Shaanxi and Shanxi provinces. Land use data and slope data are raster data, and soil data and geological data are vector data.

2.3. Methods

2.3.1. Runoff Division

The analysis of the changes in the runoff components of the basins in recent years can better reflect the changes in the dominant runoff process in the basins, but the classification of runoff components is a key and difficult task in hydrological and eco-hydrological research, because of the absence of unified standards in concepts and methods [25,26]. By comparing different separation methods, it was found that the Oblique line separation method was simple and applicable for the daily average flow process line separation. Although it was arbitrary to a certain extent, the segmentation results were equally accurate [25]. Oblique line separation was used to connect the flood rising point and receding point in an oblique straight line on the daily average flow process line; the part below the oblique line was considered as the baseflow, and up the oblique line was considered as the direct runoff.
Baseflow is the sum of underground runoff and slow interflow, whereas direct runoff includes overland flow and fast interflow [27]. Because of the different runoff generation mechanisms between fast interflow and overland flow, the interflow is generated as well as flows within the soil layer, and this flow is slower than the overland flow [28]. Therefore, the direct runoff was divided into a part of the fast interflow component, based on differences in confluence velocity. The gentle recession section between the two inflection points in Figure 3 was caused by a small area of interflow occurring in the study area and the low flow rate of the interflow. The inflection points of the receding section are selected by experience, and linear interpolation is made between the rising point and the inflection point of the receding section to obtain the flow of different runoff components using a combination of Microsoft Excel and ActiveX Automation.

2.3.2. Antecedent Precipitation Index

The antecedent precipitation index (API) reaction was defined as the amount of rainfall retained in the soil following a rainfall event. In this study, we used the recursive formula method [29] to estimate the accumulation of rainfall in the soil during the early stages of flood. The API was defined mathematically as follows:
A P I t = k P t 1 + k 2 P t 2 + + k n ( A P I t n + P t n )
where APIt is the antecedent precipitation index (mm) on day t; APIt−1 is the antecedent precipitation index (mm) on t 1 day; n is the number of previous rain days affecting the runoff (usually ~15 d); Pt is the t d rainfall (mm); Pt−1 and Pt−2 are the rainfall (mm) 1 d and 2 d prior to t d, respectively; and k is the daily regression coefficient of the soil water content, defined as follows:
k = 1 E m W m
where Em is the watershed evapotranspiration capacity (mm) and Wm is the water storage capacity (mm) of the watershed.

2.3.3. Determination of the Dominant Runoff Process

The runoff processes are subdivided into HOF (1 and 2), SOF (1 and 2), SSF (1 and 2), and DP according to the conditions of their occurrence and their runoff response [30]; the detailed information of runoff processes is shown in Table 3. Multiple runoff processes may occur at one site during a rainfall event. The process that contributed most to the runoff was identified as the DRP.
The determination of the DRP is developed in different steps as follows. (1) Information about the land use, vegetation, hydrogeology, and topography of watershed is collected. (2) Based on these data, the DRP at the plot sites was identified according to the decision schemes in ARCGIS (Figure 4). The most important factors were infiltration, storage capacity, lateral flow capacity of the soil, and the underlying geology. To distinguish the storage capacities of different soils, we used the numbers 1 and 2 to represent high and low storage capacity, respectively.
Rainfall intensity needs to exceed the infiltration capacity for HOF to occur. The infiltration capacity of the soil is dependent on soil texture, bulk density, water content, and the number of macropores. HOF1 is likely to occur on soils with severe infiltration hindrances, a small number of macropores, and very high clay content, or on bedrock surfaces with low permeability, which is typical of roads and urban areas. HOF2 is a slightly delayed form of HOF, as it occurs in soils affected by compaction and low macro-porosity or surface sealing, soils easily affected by hydrophobicity, or soils with moderate macro-porosity, where the surrounding matrix of soils has low water exchange.
If precipitation encounters a soil layer with significantly lower permeability, and further downward flow in the soil is inhibited, a temporary saturation zone is formed at the interface of heterogeneous soil. With the accumulation of water, it will eventually reach the surface and cause SOF. Moist or wet soils may become saturated during a short rainfall event, during which SOF1 is expected to occur (refer to Figure 4). In thick and macroporous soils with a permeable matrix, a very delayed SOF will result in SOF2. DP is expected to occur on permeable and thick soils, or very permeable shallow soils and bedrock.
Rapid subsurface flow (SSF1) occurs if an impervious layer or impervious bedrock appears on a steep slope with very shallow soil and an effective lateral flow path system. SSF2 occurs in deep soils with a high storage capacity. In the main sandy areas of the Yellow River, the slope has an interactive effect on slope erosion. The amount of slope erosion increases by 0.4–1.5 times with a 5% to 15% rise in slope [31,32]. Therefore, the rules stipulate that SOF may occur on slopes below 15% and SSF occurs on slopes above 15% in non-forested areas. In forests, because of the root system, priority lateral flow paths were more frequent, and SSF was found on 5% of slopes.
The main steps to identify DRP based on ArcGIS are as follows. Firstly, the raster calculator in ArcGIS is used to extract different types of data from the land use data and slope data, so that the same layer contains only the same type of data, then the conversion tool is used to convert to a vector layer. Finally, using the intersect method of the overlay tool, different types of data are superimposed on each other according to the discrimination rules, and the distribution of DRP is obtained.

3. Results and Discussion

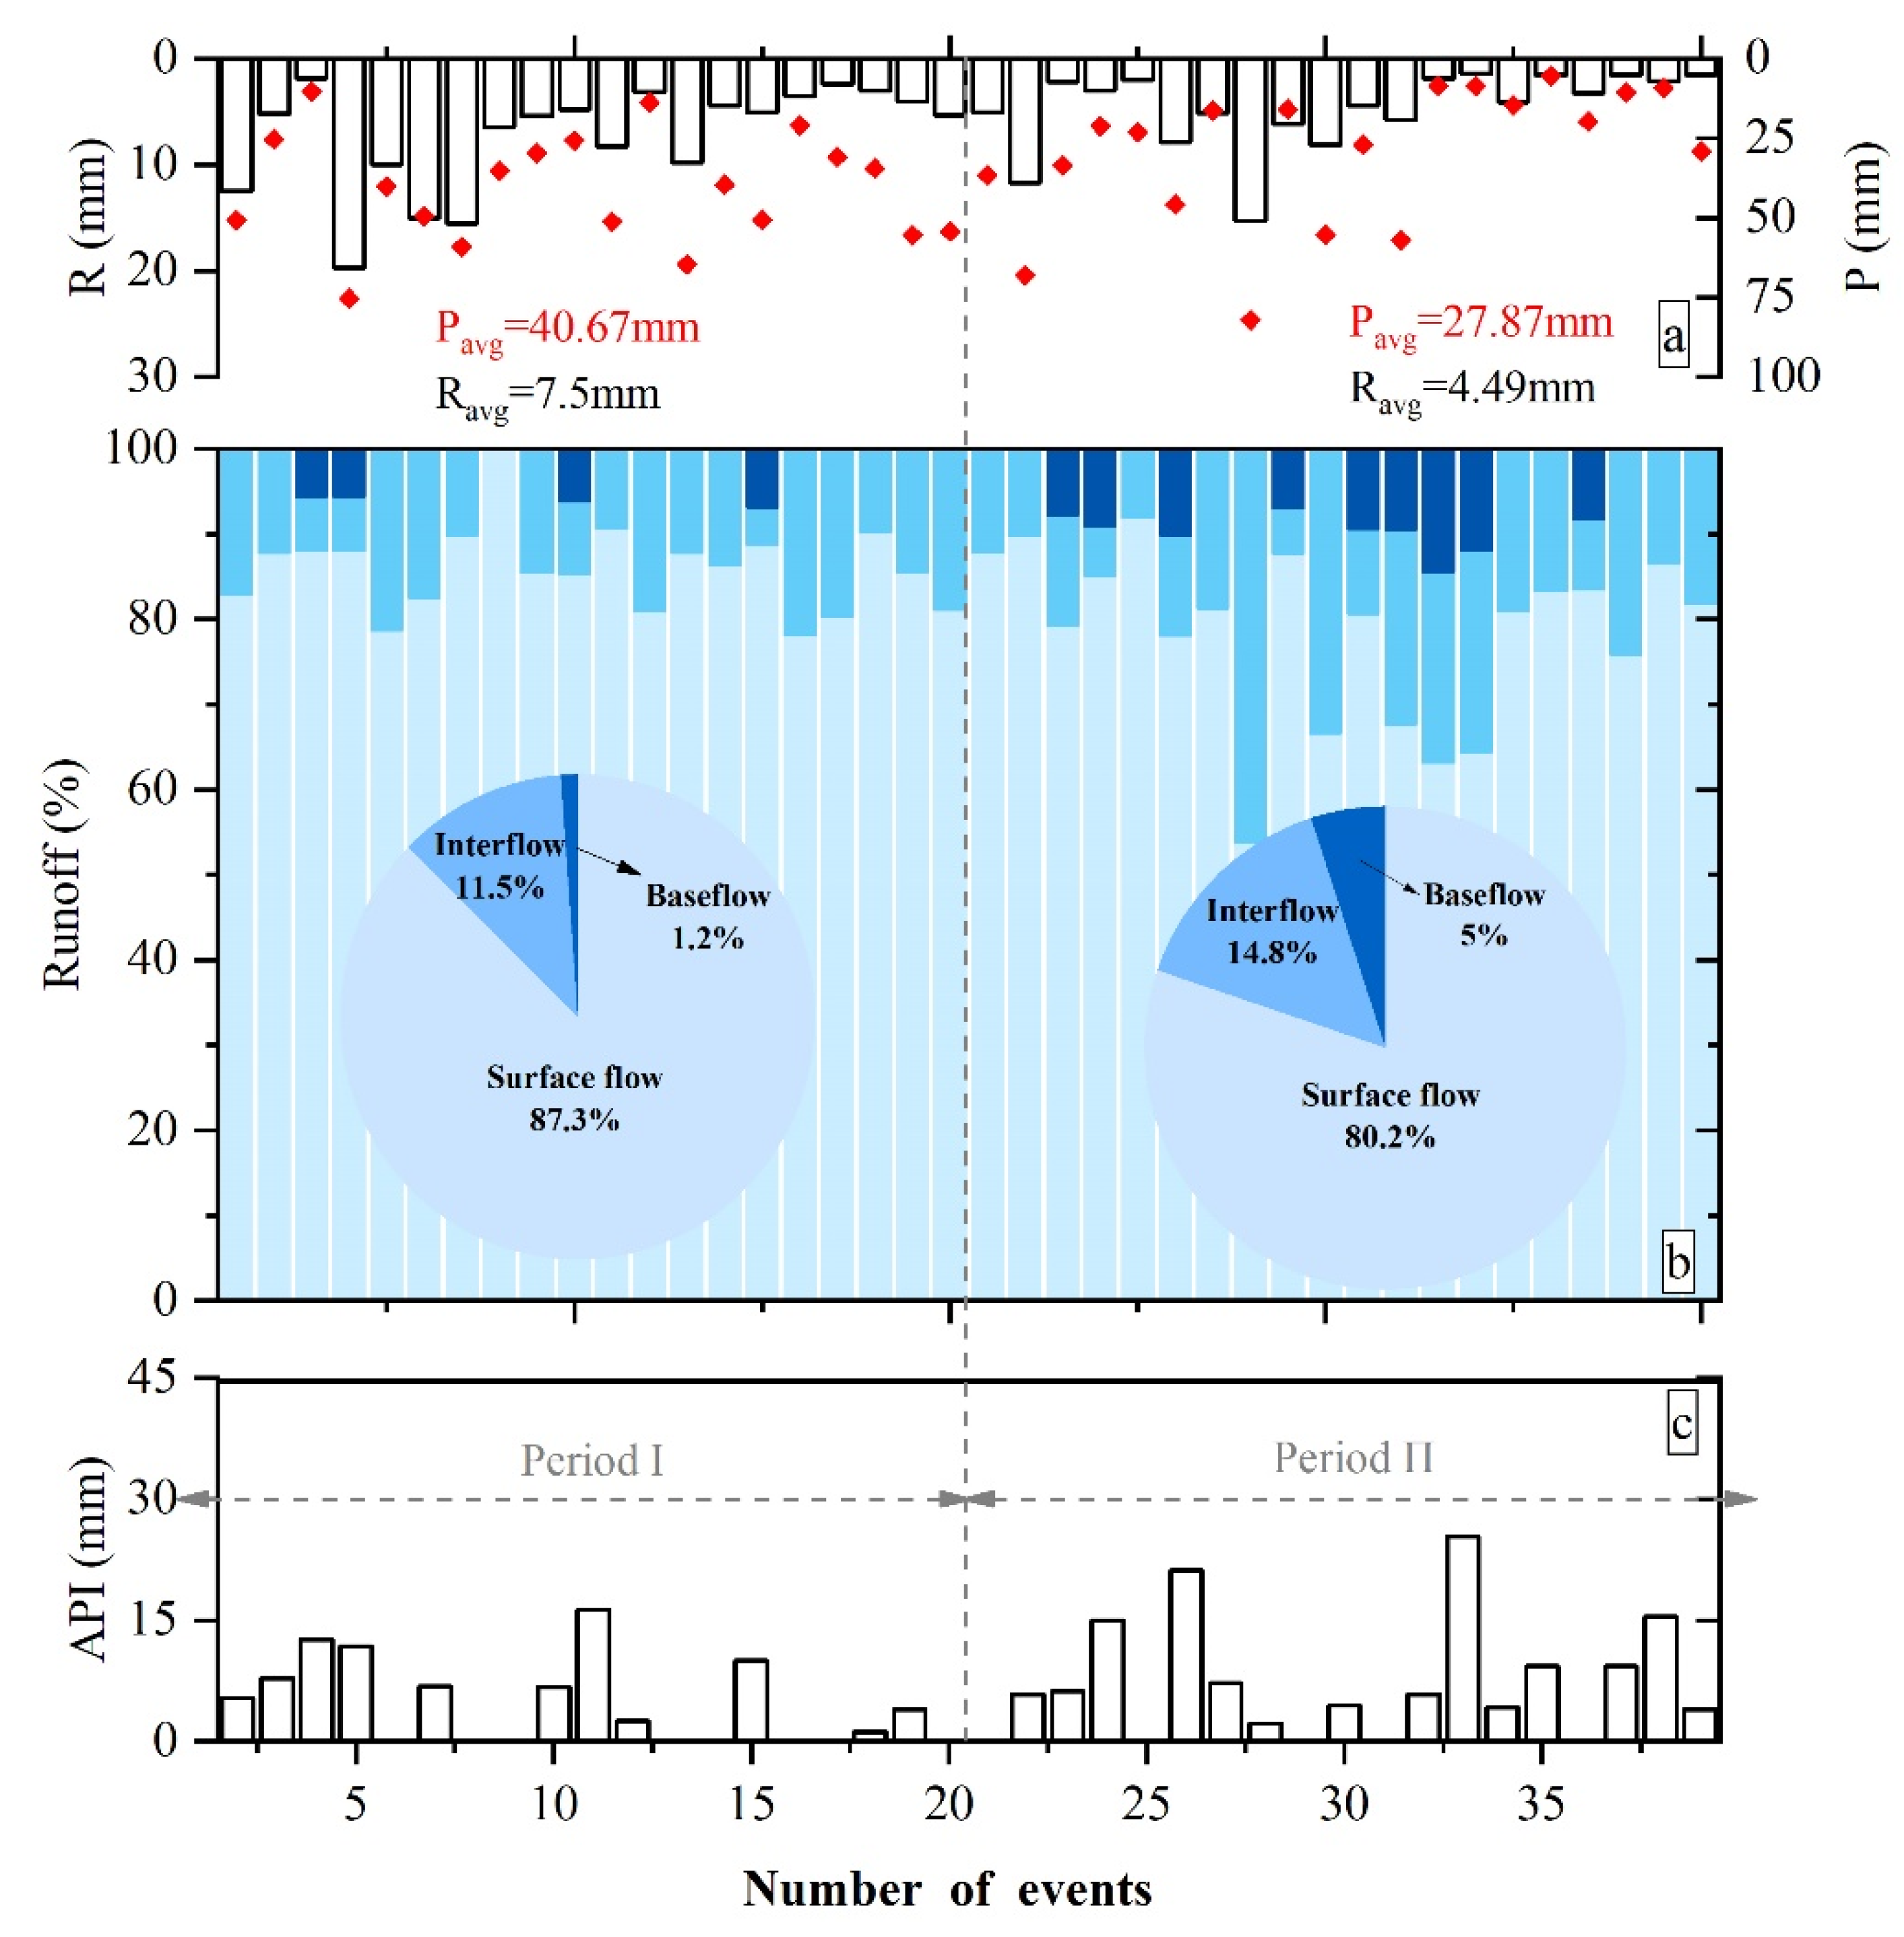
3.1. Changes in Runoff Composition Trends

The Grain for Green Project was initiated in 1999 for the Yellow River, China. It has substantially improved the underlying surface conditions in the hilly and gully areas. As such, 1999 was chosen as the time node in this study, where changes in the runoff generation processes for the Jingle and Jialu River basins were studied in two periods: 1980–1999 and 2000–2013 [33]. The segmentation results for runoff components of selected floods in the two basins from 1980 to 2013 are shown in Figure 5. Among the 40 precipitation-runoff events selected in the Jialu River basin, the average value of precipitation (Pavg) during the first stage (the first 20 events) was 40.67 mm and the average value of runoff (Ravg) was 7.5 mm. The overland flow was the main runoff component for flood processes, accounting for 87.3%, followed by the interflow, accounting for approximately 11.5%; the Pavg and Ravg during the second stage were 27.87 mm and 4.49 mm, which are 31% and 40% less than the first period, respectively. The overland flow continued to be the main runoff component during the second stage for flood processes, although its proportion decreased to 80.2%; the proportion of interflow and baseflow increased by 3.3% and 3.8%, respectively. Among the 40 selected floods, the API of floods with base flow components was 11.05 mm, while the API of floods without base flow components was only 3.83 mm.
Fifty precipitation-runoff events were selected in the Jingle sub-basin to analyze runoff processes (Figure 6). Compared with the first stage (first 30 events), Pavg increased by 6.4% and Ravg decreased by 28% during the second stage. The proportion of overland flow decreased from 85.1% to 76.8%, whereas the proportion of interflow and baseflow increased by 4% and 4.3%, respectively. In addition, the API of floods with base flow components was 9 mm, while the API of floods without base flow components was only 4.02 mm. The results show that the changes in runoff components for the two basins had similar fluctuation patterns, and runoff of floods events drastically decreased in the two basins after the year 2000 [34]. In addition, the generation of baseflow was substantially affected by the API. The higher the soil moisture on the eve of rainfall, the easier it was for topsoil to reach saturation. This also meant that the interflow and slow saturated overland flow were easier to produce and the proportion of baseflow components increased [35,36,37].

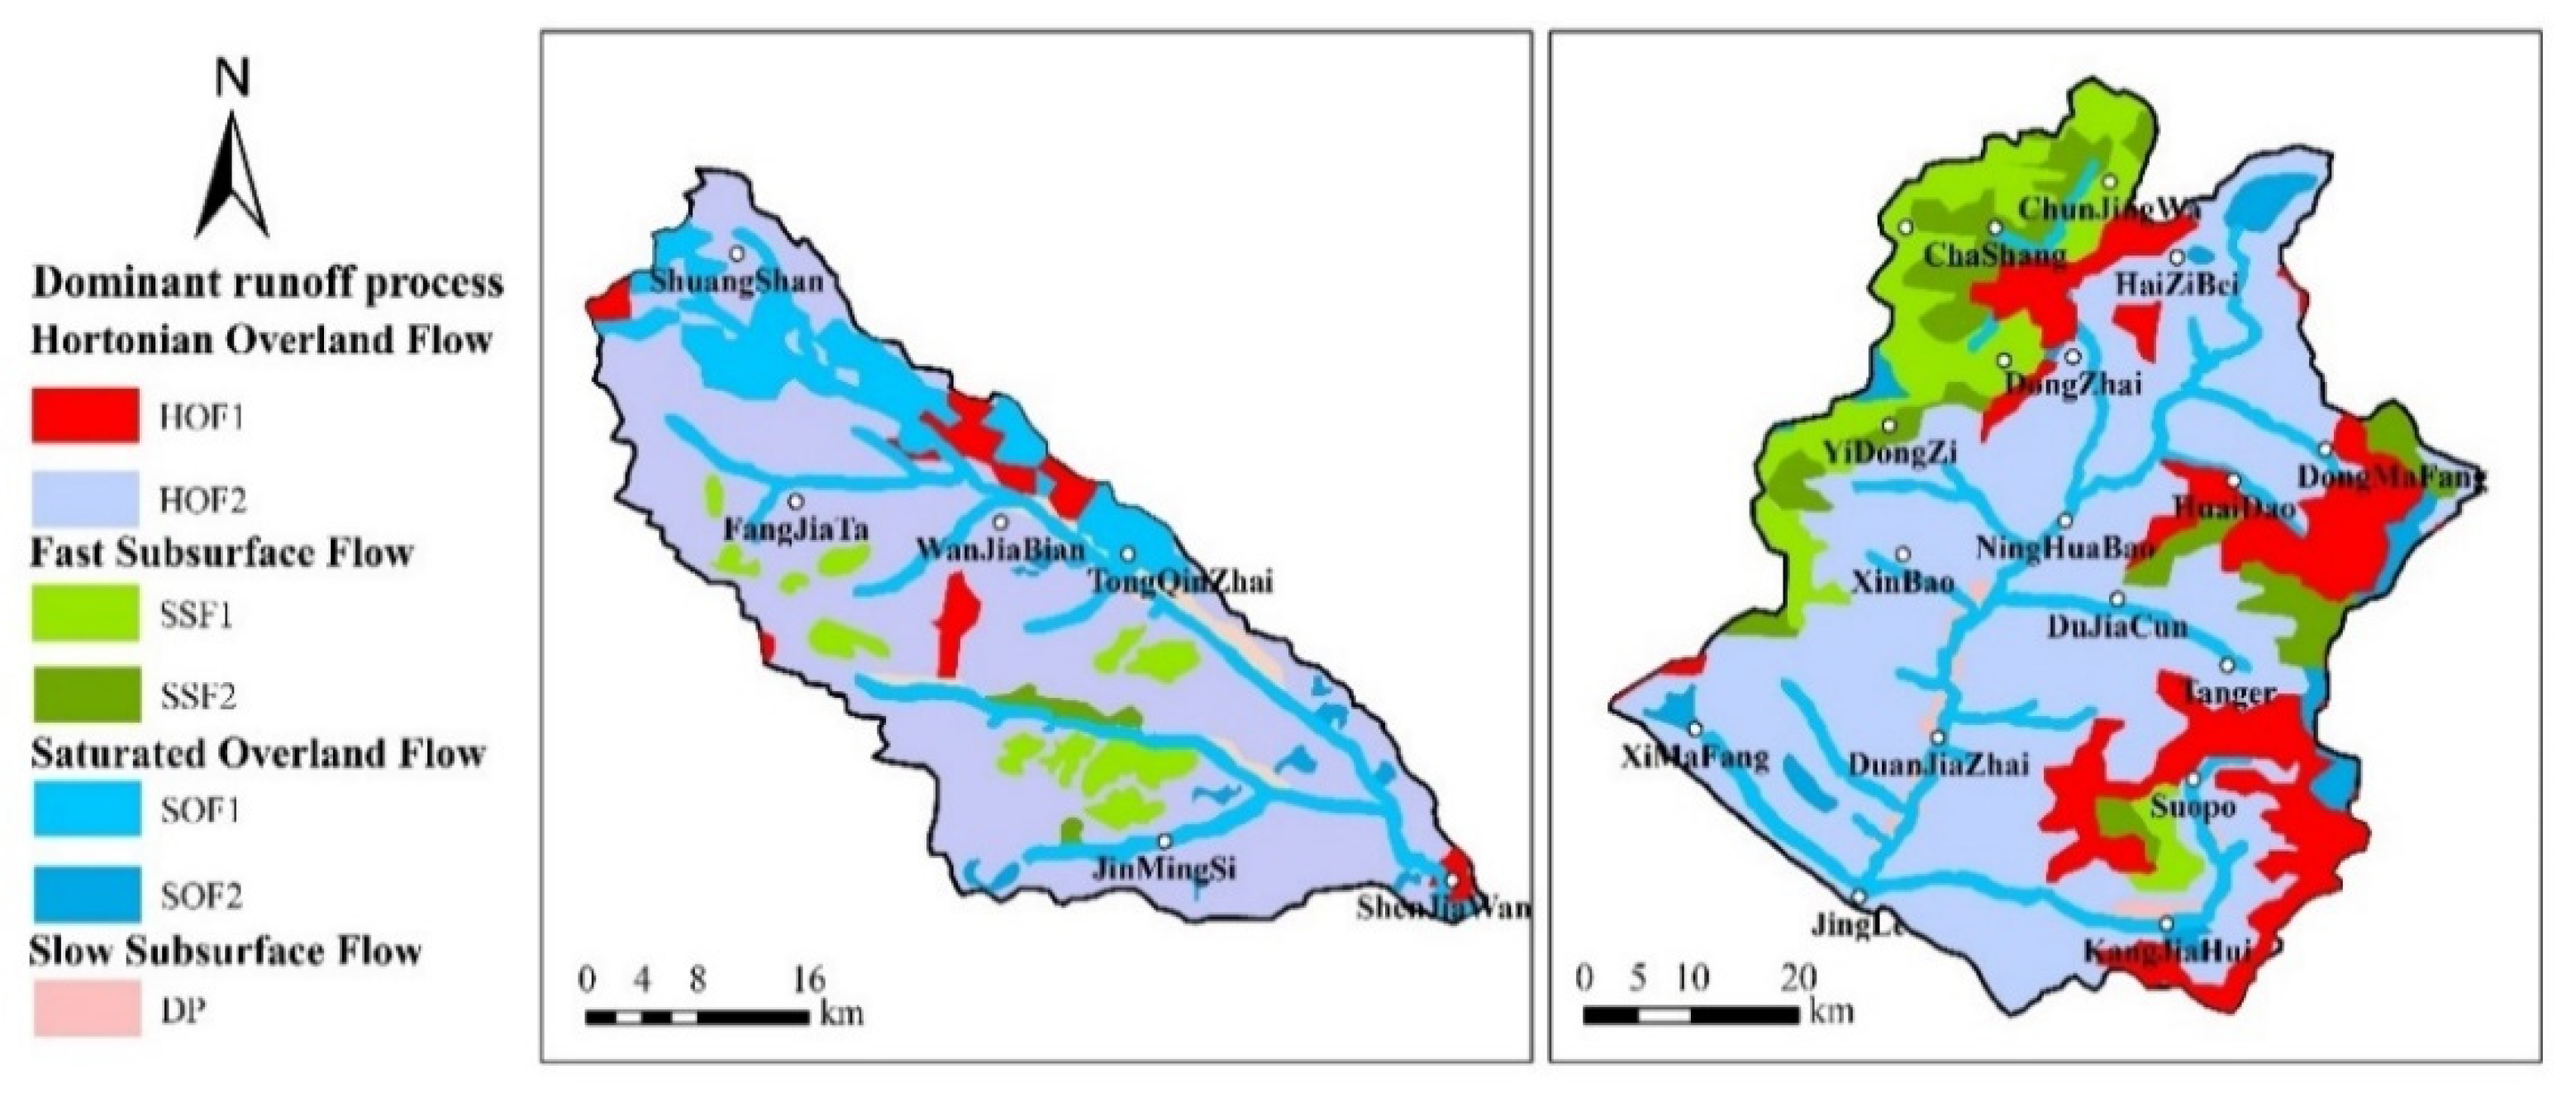
3.2. Spatial Distribution of DRP

The spatial distribution of the DRP in both basins is shown in Figure 7. Figure 8 presents quantitative information on areal DRP contributions. The DRP in most areas south of the Jialu River basin and mid Jingle sub-basin was HOF2, accounting for 38% and 41% of the area, respectively. The surface soil in this region was silty loam, and the land-use type alternated between grassland and farmland. The kinetic energy impact of raindrops was very large, directly damaging the surface soil structure, reducing soil voids, and enhancing soil hydrophobicity [38]. This caused a sharp reduction in the infiltration rate and the occurrence of HOF2. The surface soil types around the rivers in the two basins were mainly loam, with a slope less than 5% and a relatively high soil moisture level. The surface soil could quickly reach saturation and occur SOF1 during a short rainfall event. In addition, a part of the farmland (topsoil was loam or cinnamon soil) in the two watersheds was covered on the sandstone ridge. As the terrain was flat, the surface soil had a high water storage capacity and the underlying soil was believed to have low permeability, indicating that the DRP of the region was SOF2; the area occupied was only 5% and 7% of the Jialu River basin and Jingle River sub-basin.
Because of the differences in topography and geomorphology, the distribution of some runoff processes was distinctly different in both basins. The area of SOF1 in the Jialu River basin accounted for 30% of the basin, whereas the area of SSF in the Jingle sub-basin accounted for 25% (Figure 8). The surface soil in the northern part of the Jialu River basin was dominated by red sandy soil and sandy loam, and the subsoil type was loam and part bedrock. The sandy soil was characterized by intense macropores, good matrix permeability, and low storage capacity of the shallow soil. The frequent saturation during rainfall within a short duration indicated that SOF1 was the DRP for this basin. The northwest and southeast parts of the Jingle sub-basin were densely covered with forests, the surface soil was loam or sandy loam, the vegetation coverage in this area was high, the organic matter content and capillary porosity of the soil were relatively large, the terrain was steep, and the slope was greater than 20%. When rainfall occurred, the impervious geological substratum and significant terrain slope cause strong lateral flow, instigating the SSF runoff process.
One of the most important purposes of this study was to test how well GIS-DRP methods can map large catchments. Most of the previous studies on DRPs were applied to small watersheds with an area <10 km2; DRP maps were automatically established based on complex discrimination rules and detailed information regarding the underlying surface [19,20]. In this study, the two basins of the Yellow River span an area >1000 km2, and DRP maps were obtained using simplified mapping methods (mainly based on surface soil information and land-use maps). The maps differed in terms of the accuracy and distribution of the DRPs from a previous study [15,16,17,18,19]. These differences were mainly due to the low resolution of soil and geological data, which could not well represent the storage and permeability of the soil and depict geological formations in the study area. For typical sandy areas in the middle reaches of the Yellow River, the single surface soil and land-use types compensate for the low accuracy of remote sensing data. Although the DRP map was of relatively low resolution, it was still able to reflect the spatial distribution of DRPs in the watershed. It also had a certain auxiliary effect on watershed runoff simulation and improved the accuracy of hydrological models.

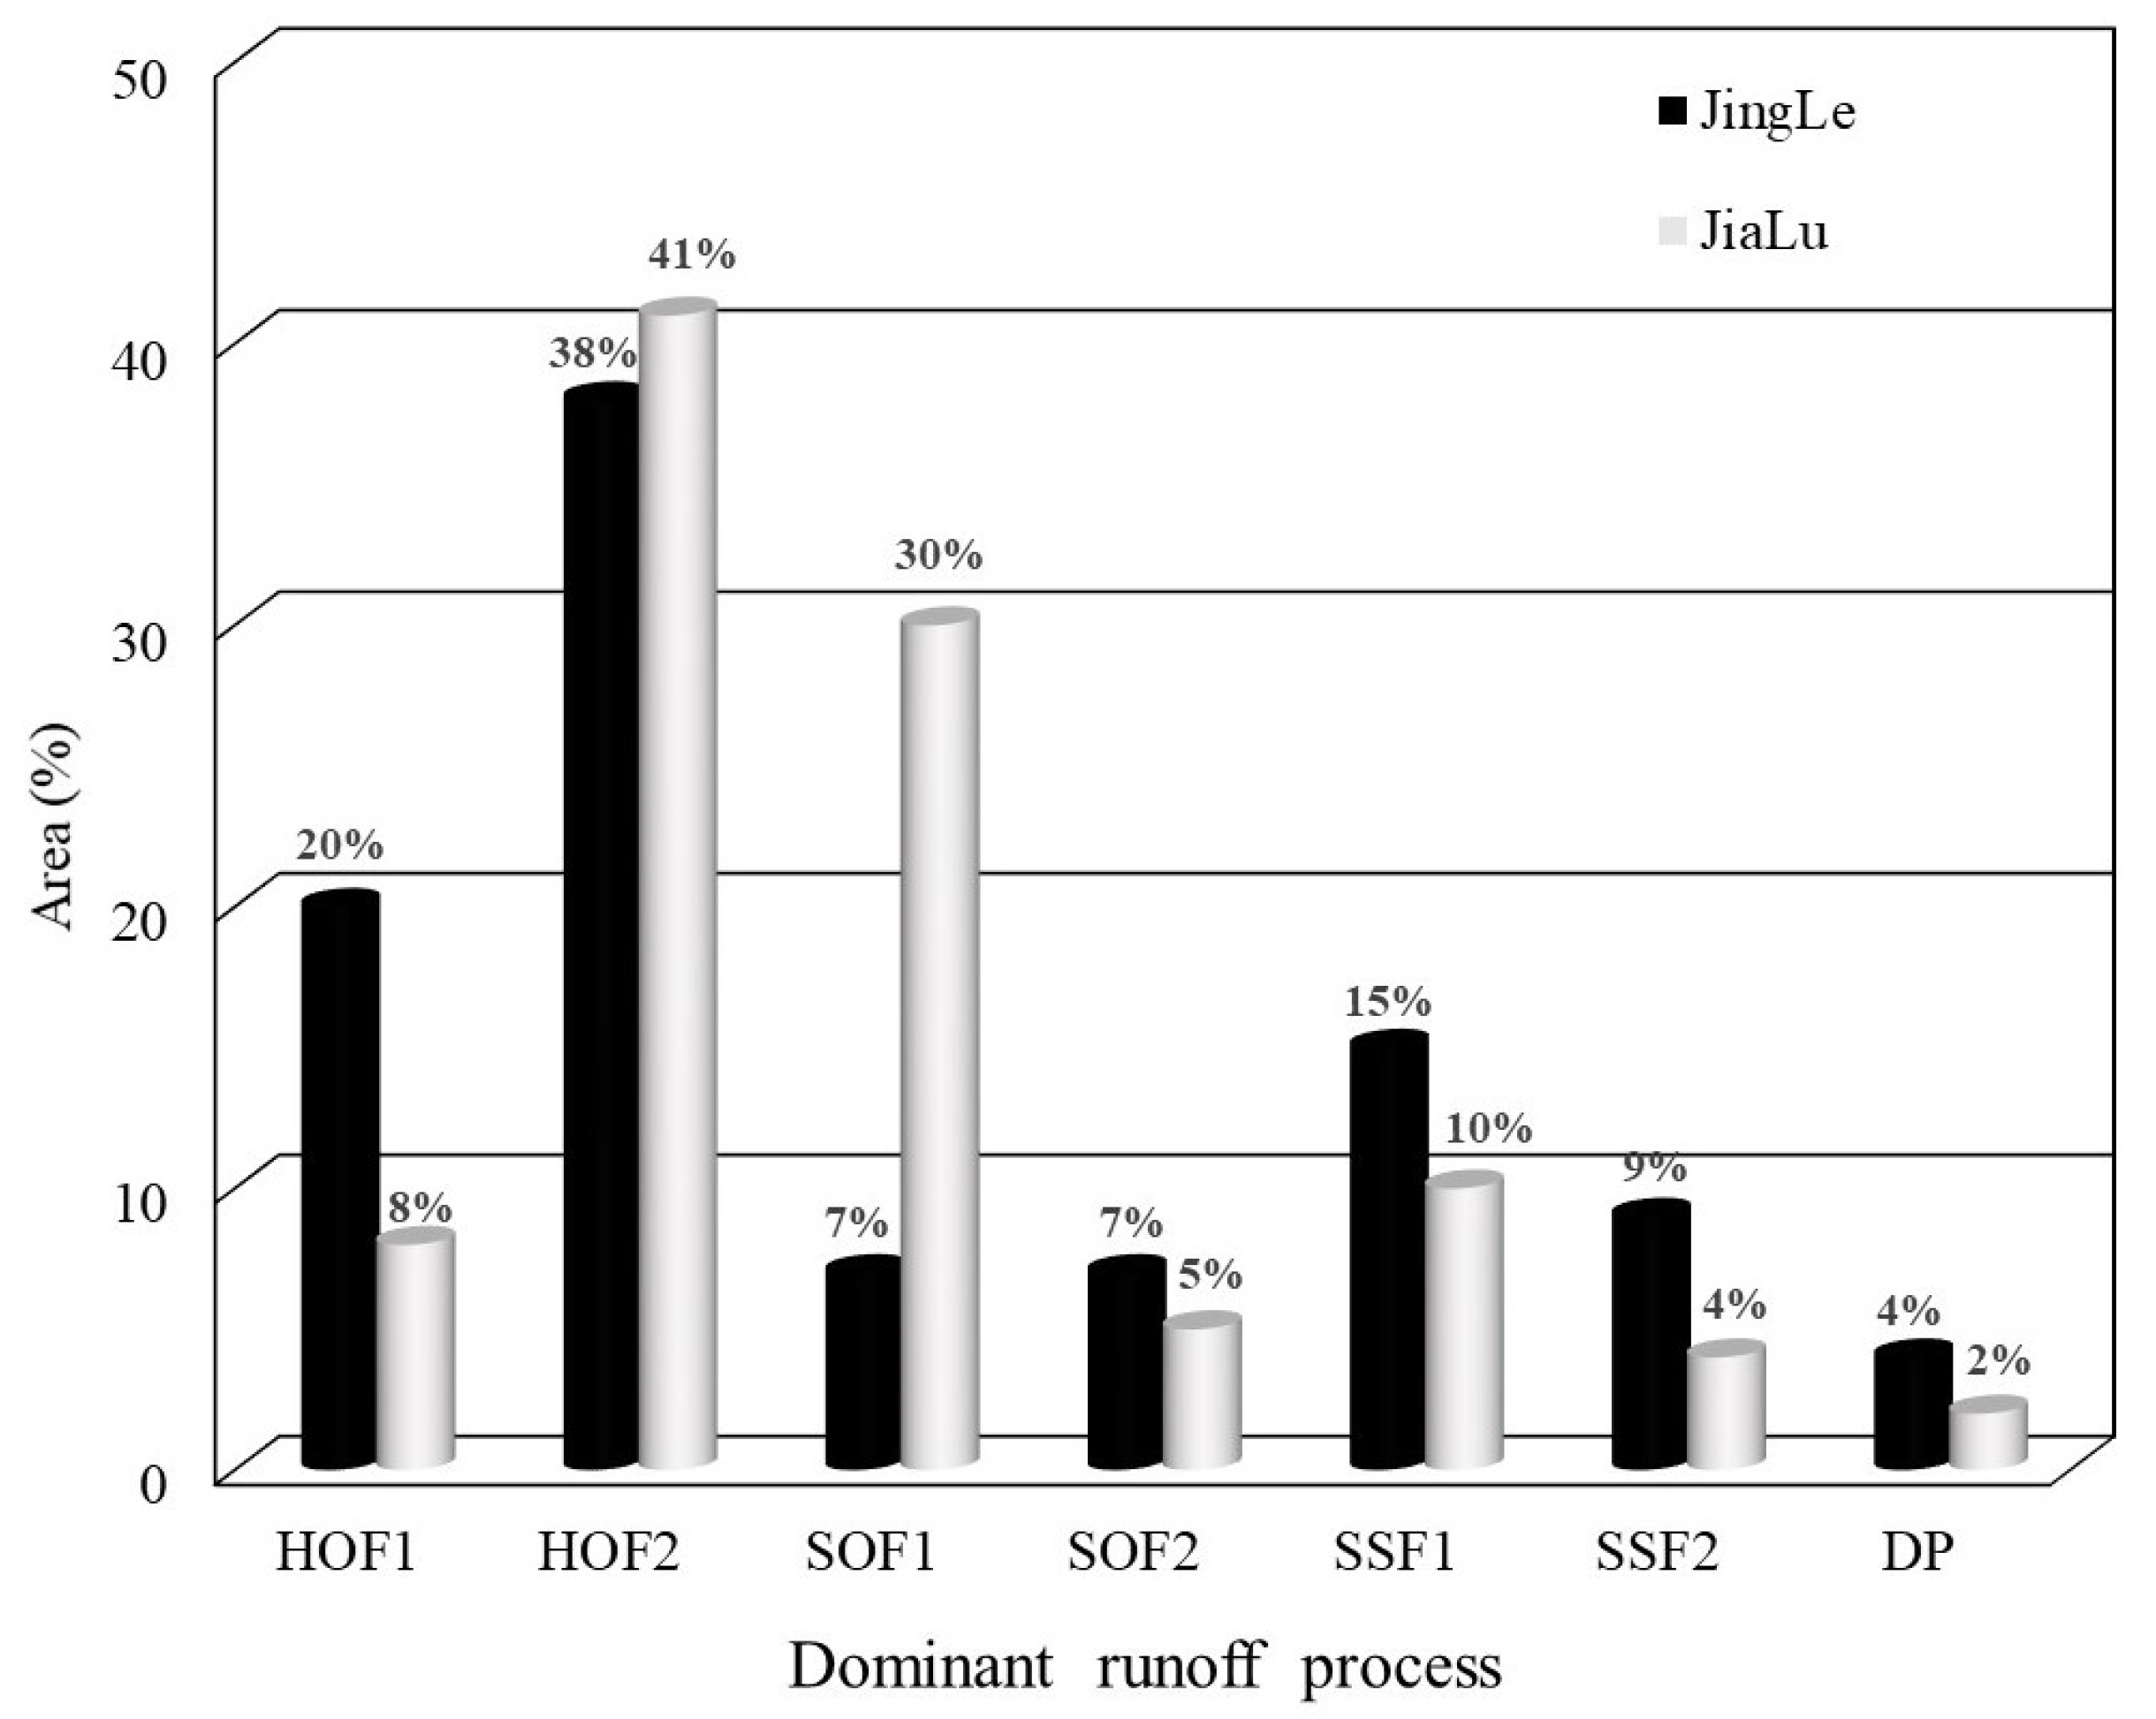
3.3. DRP Maps and Runoff Compositions

The flow process line in the outlet section of the basin was a result of the superposition of different runoff components generated by multiple runoff processes in various areas of the basin during rainfall events. The overland flow was super-permeable and saturated overland flow, primarily produced by two runoff processes: HOF and SOF. For the middle reaches of the Yellow River, where the climate is arid and the soil unsaturated zone is tens of meters thick, it was difficult to generate deep underground runoff through precipitation [39]. Therefore, this study classified baseflow as the sum of shallow underground runoff and slow interflow [25,27], largely produced by two runoff processes: SSF2 and DP.
Figure 9 shows that the proportion of the runoff components of the floods in the two basins from 2000 to 2013 was the same as the proportion of the area occupied by the corresponding runoff processes in the basin. The proportion of overland flow components (76.8% and 80.2% for the Jialu River basin and Jingle sub-basin, respectively) was roughly the same as the sum of the proportions of HOF and SOF (72% and 83% for the Jialu River basin and Jingle sub-basin, respectively). The proportion of baseflow components was also essentially the same as the sum of the proportions of SSF2 and DP. These results confirm the rationality and validity of the DRP discriminant rules based on the soil type, land-use, and topographic conditions of the basin. The rule was also verified by applying it to different basins, implying that the discriminant rule of the DRP is universally applicable to the main sandy areas of the Yellow River.

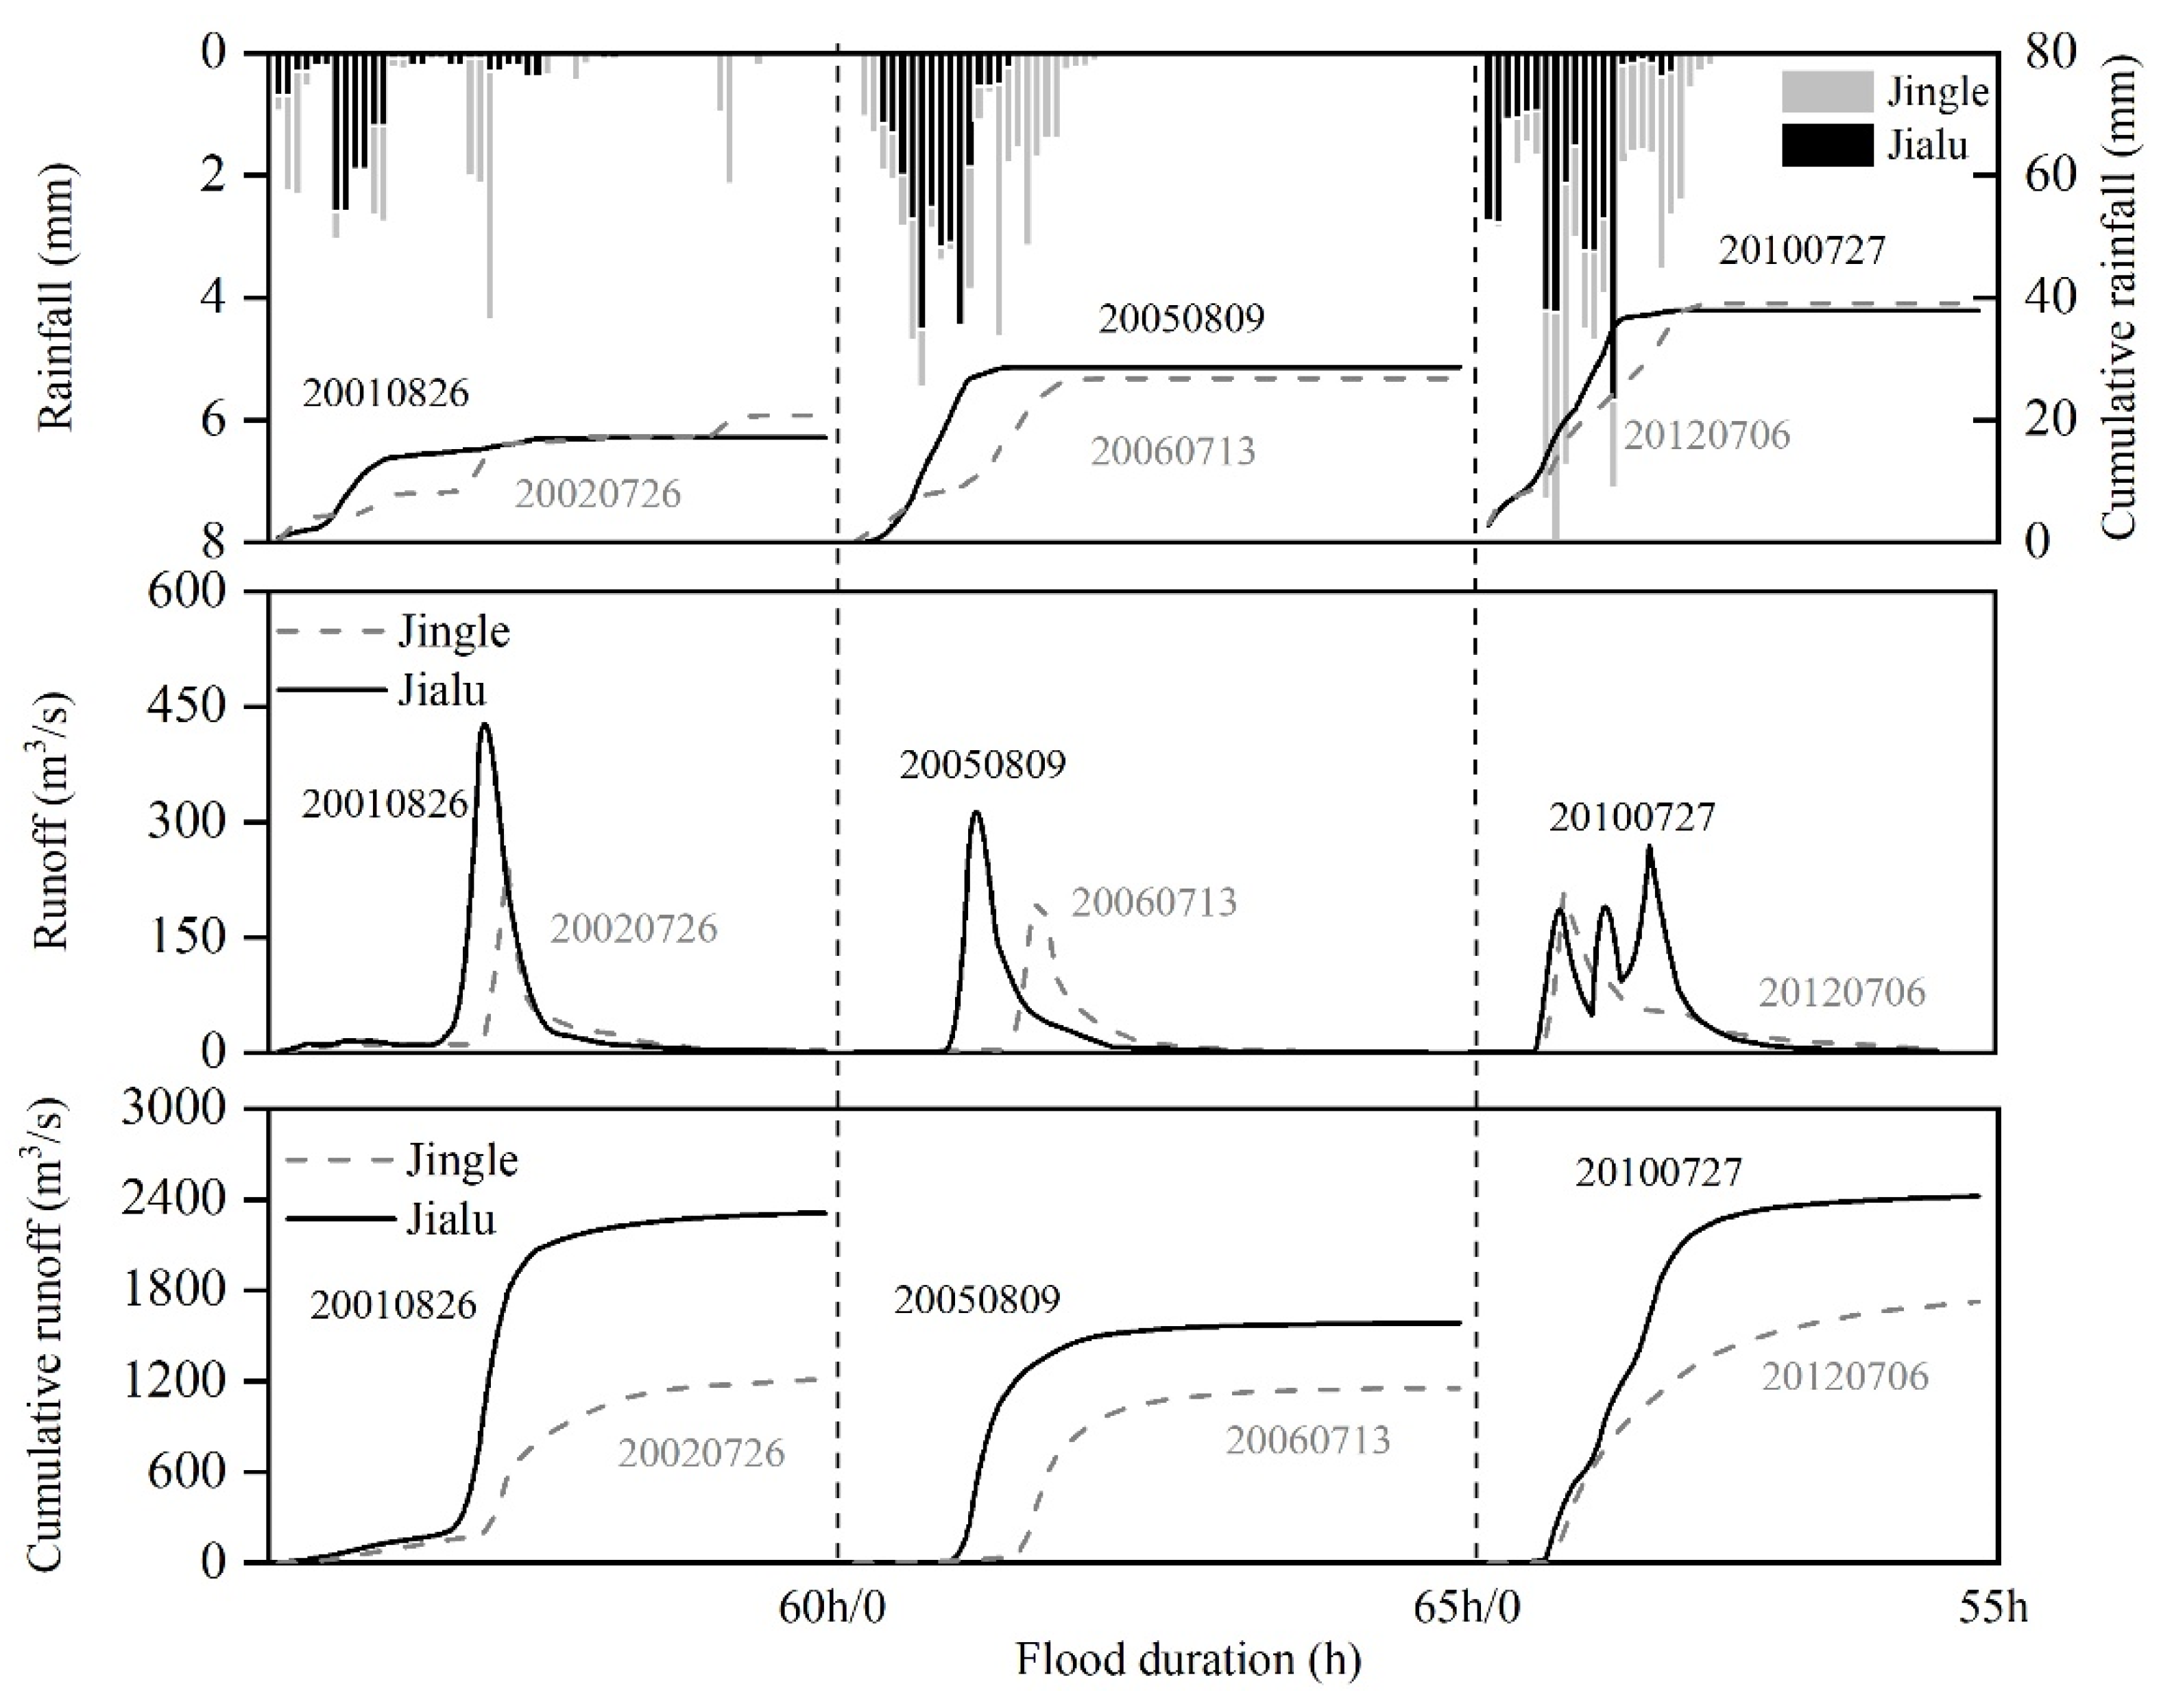
3.4. DRP Maps’ Reaction to Flood Process

Depending on the distribution of the DRP, basins react very differently to identical large rainfall events. Basins with large areas of HOF, SOF1, or SSF1 processes react rapidly and strongly [40]. Based on rainfall simulation experiments on farmland, grassland, and woodland (slope > 20%), Naef et al. (2007) found that the runoff generation capacity of different runoff processes with the same rainfall conditions was in the order of HOF2 > SOF1 > SSF1 > SOF2 [41]. When rainfall occurs in the Jialu River basin and Jingle sub-basin, rapid runoff processes are able to generate a large amount of runoff in a relatively short period to form a flood peak at the outlet of the basin. The soil had been in a state of water deficit for a long time because the study regions were characterized by deep groundwater storage and greater evaporative capacity than precipitation. Numerous studies have shown that extreme drying of shallow soil (0–2.3 m) in most basins after the rainy season may be substantially alleviated [42,43,44]. Therefore, in regions where DP, SOF2, and SSF2 runoff processes occurred in the two basins, most of the rainfall was retained in the shallow soil in the form of soil moisture. A part of this soil moisture was absorbed by plants during the growth period of vegetation and the other part was consumed in the form of evaporation after precipitation. As such, it was seldom that water entered the river as a component of underground runoff.
The area of rapid runoff processes, including HOF1, HOF2, SSF1, and SOF1, in the Jialu River basin accounted for 89% of the entire basin. The rapid runoff processes in the Jingle sub-basin accounted for only 78% of the total basin, whereas the DP, SOF2, and SSF2 processes accounted for 22%. Three groups of rainfall events with similar rainfall characteristics (precipitation and rainfall intensity) were selected from the two basins (Table 4), and their corresponding flood processes were analysed (Figure 10). When a rainfall event with the same characteristics occurred in the two basins, the rapid runoff processes in the Jialu River basin accounted for a greater proportion of the basin area, such that runoff was rapidly generated after rainfall hit the ground. Compared with the Jingle sub-basin, the peak time of Jialu River basin is 3.8 h earlier on average, and the peak discharge and runoff of Jialu River basin were 190.4 m3/s and 2.85 mm higher on average, respectively. The difference of similar rainfall under various runoff processes is the most obvious in group 1, where Jialu River basin received the same rainfall as Jingle sub-basin. However, the peak flow and runoff was two times higher in Jialu River basin than in Jingle sub-basin.
Compared with 1980–1999, the proportion of overland flow in the two basins decreased in 2000–2013, whereas the runoff components of interflow and baseflow increased to a certain extent (Figure 5 and Figure 6). As the underlying surface conditions in the middle reaches of the Yellow River have substantially improved since 2000, sections of the region with rapid runoff processes have been transformed into regions with slower runoff processes; for example, to delay runoff at a site, where the low permeability of the topsoil causes HOF2, the structure of soil could be improved by tillage combined with plants having a high root density and lush surface cover. This could change HOF2 to SOF2. This phenomenon may explain the reasons for the decrease in water volume in the middle reaches of the Yellow River in recent years.

4. Conclusions

This study analyzes changes in runoff components in the Jialu River basin and the Fen River (Jingle sub-basin) during runoff generation from 1980 to 2013 using the runoff segmentation method. The results showed that floods in the Jialu River basin and Jingle sub-basin were dominated by overland flow components. Compared with 1980–1999, the proportion of overland flow components in 2000–2013 showed a decreasing trend, decreasing by 8.3% and 7.1% of Jingle sub-basin and Jialu River basin, respectively, whereas the interflow and underground runoff contribution had increased.
Based on the decision scheme, the DRP in these basins was determined using GIS. The impact of different runoff process distributions on the change in runoff for the basin was investigated. It was concluded that the DRP of the Jialu River basin and Jingle sub-basin from 2000 to 2013 was HOF, and rapid runoff processes (HOF, SOF1, and SSF1) accounted for 89% and 78% of the basin area, respectively, whereas the slow runoff processes (SOF2, SSF2, and DP) accounted for 11% and 22%, respectively. Under the same rainfall conditions, the runoff in the Jingle sub-basin was markedly lower than that in the Jialu River basin because of the influence of the distribution of different runoff processes.
The GIS-DRP method is also applicable to parts of the middle reaches of the Yellow River, but for these basins, it is more difficult to obtain relevant data of the basins. The DRP map is a powerful tool to visualize the hydrology of a basin and its reactions to intense rainfall events. It may be used to quantify storm runoff directly, improve the simulation accuracy of the hydrological model, understand land-use change, and formulate management practices to reduce flooding in the Yellow River. One of the current limitations of DRP maps is that the map proposed in our study was not combined with the actual hydrological model, and the research of large watersheds was affected by the accuracy of remote sensing data; it is recommended that this is investigated in future research.

Author Contributions

Conceptualization, C.H. and S.J.; methodology, C.H.; software, Q.W. and L.Z.; validation, C.H., Q.W., and G.R.; formal analysis, G.R.; investigation, G.R.; resources, C.H.; data curation, G.R.; writing—original draft preparation, G.R.; writing—review and editing, C.H.; supervision, C.H.; project administration, C.H.; funding acquisition, C.H. All authors contributed to the final version of the manuscript. All authors have read and agreed to the published version of the manuscript.

Funding

This research was funded by National Natural Science Foundation of China grant number 51979250, National Key Research Priorities Program of China grant number 2016YFC04024023, Key projects of National Natural Science Foundation of China grant number 51739009, and National Natural Science Foundation of China grant number 31700370.

Acknowledgments

We would like to thank potential reviewer very much for their valuable comments and suggestions. We also thank my other colleagues’ valuable comments and suggestions that have helped improve the manuscript.

Conflicts of Interest

The authors declare no conflict of interest.

References

  1. Wei, Y.; Jiao, J.; Zhao, G.; Zhao, H.; He, Z.; Mu, X. Spatial-Temporal Variation and Periodic Change in Streamflow and Suspended Sediment Discharge Along the Main-Stream of the Yellow River During 1950–2013. Catena 2016, 140, 105–115. [Google Scholar] [CrossRef] [Green Version]
  2. Wang, G.; Cheng, G. The Characteristics of Water Resources and the Changes of the Hydrological Process and Environment in the Arid Zone of Northwest China. Environ. Geol. 2000, 39, 783–790. [Google Scholar] [CrossRef]
  3. Zhang, Y.; Ma, J.; Chang, X.; Van Wonderen, J.; Yan, L.; Han, J. Water Resources Assessment in the Minqin Basin: An Arid Inland River Basin Under Intensive Irrigation in Northwest China. Environ. Earth Sci. 2011, 65, 1831–1839. [Google Scholar] [CrossRef]
  4. Chen, Y.; Xu, C.; Chen, Y.; Liu, Y.; Li, W. Progress, Challenges and Prospects of Ecohydrological Studies in the Tarim Riverbasin of Xinjiang China. Environ. Manag. 2013, 51, 138–153. [Google Scholar] [CrossRef]
  5. Gao, P.; Zhang, X.; Mu, X.; Wang, F.; Li, R.; Zhang, X. Trend and Change-Point Analyses of Streamflow and Sediment Discharge in the Yellow River During 1950–2005. Hydrol. Sci. J. 2010, 55, 275–285. [Google Scholar] [CrossRef]
  6. Miao, C.; Ni, J.; Borthwick, A.G.L. Recent Changes of Water Discharge and Sediment Load in the Yellow River Basin, China. Prog. Phys. Geogr. 2010, 34, 541–561. [Google Scholar] [CrossRef] [Green Version]
  7. Yang, S.; Kang, T.; Bu, J.; Chen, J.; Gao, Y. Evaluating the Impacts of Climate Change and Vegetation Restoration on the Hydrological Cycle over the Loess Plateau, China. Water 2019, 11, 2241. [Google Scholar] [CrossRef] [Green Version]
  8. Gao, P.; Mu, X.-M.; Wang, F.; Liu, T. Changes in Streamflow and Sediment Discharge and the Response to Human Activities in the Middle Reaches of the Yellow River. Hydrol. Earth Syst. Sci. 2011, 15, 1–10. [Google Scholar] [CrossRef] [Green Version]
  9. Jiang, T.; Fischer, T.; Lu, X. Larger Asian Rivers: Climate Change, River Flow, and Watershed Management. Quat. Int. 2010, 226, 1–3. [Google Scholar] [CrossRef]
  10. Liu, J.; Luo, M.; Liu, T.; Bao, A.; De Maeyer, P.; Feng, X.; Xi, C. Local Climate Change and the Impacts on Hydrological Processes in an Arid Alpine Catchment in Karakoram. Water 2017, 9, 344. [Google Scholar] [CrossRef] [Green Version]
  11. Farsi, N.; Mahjouri, N. Evaluating the Contribution of the Climate Change and Human Activities to Runoff Change Under Uncertainty. J. Hydrol. 2019, 574, 872–891. [Google Scholar] [CrossRef]
  12. Yin, J.; He, F.; Xiong, Y.J.; Qiu, G.Y. Effects of Land Use/Land Cover and Climate Changes on Surface Runoff in a Semi-Humid and Semi-Arid Transition Zone in Northwest China. Hydrol. Earth Syst. Sci. 2017, 21, 183–196. [Google Scholar] [CrossRef] [Green Version]
  13. Zhao, Y.L.; Wang, Y.Q. Distribution Characteristics of Bulk Density and Saturated Hydraulic Conductivity in Intensive Land Restoration Project Areas on the Loess Plateau. Trans. Chin. Soc. Agric. Eng. 2020, 36, 83–90. [Google Scholar]
  14. Chen, X.; Yang, J.; Tang, C.; Zheng, T.; Li, L. Effect Rainfall Intensity and Slope on Surface and Subsurface Runoff in Red Soil Slope Farmland. Trans. Chin. Soc. Agric. Eng. 2017, 33, 141–147. [Google Scholar]
  15. Müller, C.; Hellebrand, H.; Seeger, M.; Schobel, S. Identification and Regionalization of Dominant Runoff Processes–A GIS-Based and a Statistical Approach. Hydrol. Earth Syst. Sci. 2009, 13, 779–792. [Google Scholar] [CrossRef] [Green Version]
  16. Hümann, M.; Muller, C. Improving the GIS-DRP Approach by Means of Delineating Runoff Characteristics with New Discharge Relevant Parameters. ISPRS Int. J. Geo-Inf. 2013, 2, 27–49. [Google Scholar] [CrossRef] [Green Version]
  17. Ferreira, C.; Keizer, J.; Santos, L.; Serpa, D.; Silva, V.; Cerqueira, M.; Ferreira, A.J.D.; Abrantes, N. Runoff, Sediment and Nutrient Exports From a Mediterranean Vineyard Under Integrated Production: An Experiment at Plot Scale. Agric. Ecosyst. Environ. 2018, 256, 184–193. [Google Scholar] [CrossRef]
  18. Naef, F.; Scherrer, S.; Weiler, M. A Process Based Assessment of the Potential to Reduce Flood Runoff by Land Use Change. J. Hydrol. 2002, 267, 74–79. [Google Scholar] [CrossRef]
  19. Scherrer, S.; Naef, F. A Decision Scheme to Indicate Dominant Hydrological Flow Processes on Temperate Grassland. Hydrol. Process. 2003, 17, 391–401. [Google Scholar] [CrossRef]
  20. Antonetti, M.; Buss, R.; Scherrer, S.; Margreth, M.; Zappa, M. Mapping Dominant Runoff Processes: An Evaluation of Different Approaches Using Similarity Measures and Synthetic Runoff Simulations. Hydrol. Earth Syst. Sci. 2016, 20, 2929–2945. [Google Scholar] [CrossRef] [Green Version]
  21. Kong, D.; Miao, C.; Wu, J.; Duan, Q.-Y. Impact Assessment of Climate Change and Human Activities on Net Runoff in the Yellow River Basin from 1951 to 2012. Ecol. Eng. 2016, 91, 566–573. [Google Scholar] [CrossRef]
  22. Zuo, D.; Xu, Z.; Yao, W.; Jin, S.; Xiao, P.; Ran, D. Assessing the Effects of Changes in Land Use and Climate on Runoff and Sediment Yields From a Watershed in the Loess Plateau of China. Sci. Total Environ. 2016, 544, 238–250. [Google Scholar] [CrossRef] [PubMed]
  23. Data of the Yellow River Basin. Available online: http://www.yrcc.gov.cn/ (accessed on 15 September 2020).
  24. Dijkshoorn, J.A.; van Engelen, V.W.P.; Hunting, J.H. Soil and Landform Properties for LADA Partner Countries (Argentina, China, Cuba, Senegal and the Gambia, South Africa and Tunisia). GLADA Report 2. 2008. Available online: http://www.isric.org/isric/Webdocs/Docs/ISRIC_Report (accessed on 29 October 2020).
  25. Xu, L.-L.; Liu, J.-L.; Jin, C.; Wang, A.; Guan, D.; Wu, J.-B.; Yuan, F. Baseflow Separation Methods in Hydrological Process Research: A Review. Chin. J. Appl. Ecol. 2011, 22, 3073–3080. [Google Scholar]
  26. Barthold, F.K.; Woods, R.A. Stormflow Generation: A Meta-Analysis of Field Evidence from Small, Forested Catchments. Water Resour. Res. 2015, 51, 3730–3753. [Google Scholar] [CrossRef]
  27. Chow, V.T. Bibliography: Handbook of Applied Hydrology. Hydrol. Sci. J. 1965, 10, 82–83. [Google Scholar] [CrossRef]
  28. Dunne, T.; Black, R.D. Partial Area Contributions to Storm Runoff in a Small New England Watershed. J. Water Resour. Res. 1970, 6, 1296–1311. [Google Scholar] [CrossRef] [Green Version]
  29. Walhin, J.F.; Paris, J. Recursive Formulae for Some Bivariate Counting Distributions Obtained by the Trivariate Reduction Method. ASTIN Bull. 2000, 30, 141–155. [Google Scholar] [CrossRef] [Green Version]
  30. Schmocker-Fackel, P. A Method to Delineate Runoff Processes in a Catchment and Its Implications for Runoff Simulations. Master’s Thesis, ETH Zurich, Zurich, Switzerland, 2004. [Google Scholar]
  31. Li, G.F.; Zheng, F.L. Effects of Rainfall and Topography on Soil Erosion Processes of Black Soil Hillslope. Trans. Chin. Soc. Agric. Mach. 2015, 46, 147–153. [Google Scholar]
  32. Zheng, Z.C.; Qin, F.; Li, T.X. Changes in Soil Surface Microrelief of Purple Soil Under Different Slope Gradients and Its Effects on Soil Erosion. Trans. Chin. Soc. Agric. Mach. 2015, 31, 168–176. [Google Scholar]
  33. Xin, Z.; Yu, X.-X. Impact of Vegetation Restoration on Hydrological Processes in the Middle Reaches of the Yellow River, China. For. Stud. China 2009, 11, 209–218. [Google Scholar] [CrossRef]
  34. Wen, Y.; Hu, C.; Zhang, G.; Jian, S. Response of the Parameters of Excess Infiltration and Excess Storage Model to Land Use Cover Change. J. Hydrol. Hydromech. 2020, 68, 99–110. [Google Scholar] [CrossRef]
  35. Minea, G.; Ioana-Toroimac, G.; Moroşanu, G. The Dominant Runoff Processes on Grassland Versus Bare Soil Hillslopes in a Temperate Environment—An Experimental Study. J. Hydrol. Hydromech. 2019, 67, 297–304. [Google Scholar] [CrossRef] [Green Version]
  36. Hu, C.H.; Ran, G.; Jian, S.Q. Effect of Forest and Grass Cover Change on Runoff Mechanism in Jialu River Basin. J. Soil Water Conserv. 2020, 34, 36–45. [Google Scholar]
  37. Hu, C.; Zhang, L.; Wu, Q.; Soomro, S.-E.-H.; Jian, S. Response of LUCC on Runoff Generation Process in Middle Yellow River Basin: The Gushanchuan Basin. Water 2020, 12, 1237. [Google Scholar] [CrossRef]
  38. Jiao, Y.; Lei, H.; Yang, D.; Huang, M.; Liu, D.; Yuan, X. Impact of Vegetation Dynamics on Hydrological Processes in a Semi-Arid Basin by Using a Land Surface-Hydrology Coupled Model. J. Hydrol. 2017, 551, 116–131. [Google Scholar] [CrossRef]
  39. Jia, X.X.; Zhao, M.A. Variation and Simulation of Soil Water Content Within Different Soil Depths Along the South-North Transect of the Loess Plateau. Adv. Water Sci. 2016, 27, 520–529. [Google Scholar]
  40. Schmocker-Fackel, P.; Naef, F.; Scherrer, S. Identifying Runoff Processes on the Plot and Catchment Scale. Hydrol. Earth Syst. Sci. 2007, 11, 891–906. [Google Scholar] [CrossRef] [Green Version]
  41. Scherrer, S.; Naef, F.; Faeh, A.O.; Cordery, I. Formation of Runoff at the Hillslope Scale During Intense Precipitation. Hydrol. Earth Syst. Sci. 2007, 11, 907–922. [Google Scholar] [CrossRef] [Green Version]
  42. Jing, L.; Li, J.P. Study on Dry Soil Layers Under Different Land-Use Systems in the Loess Plateau. Pratacultural Sci. 2018, 35, 1829–1835. [Google Scholar]
  43. Yi, X.B.; Jia, X.X. Egional Spatial and Seasonal Characteristics of Soil Desiccation on the Loess Plateau. Adv. Water Sci. 2017, 28, 373–382. [Google Scholar]
  44. Hao, Z.; Zheng, J.; Ge, Q.; Guo, X. Relationship Between Precipitation and the Infiltration Depth Over the Middle and Lower Reaches of the Yellow River and Yangtze-Huaihe River Valley. Prog. Nat. Sci. 2008, 18, 1123–1128. [Google Scholar] [CrossRef]
Figure 1. Study area and gauging stations; (a) description of the location of the watershed on the Yellow River; (b) control catchment of the Jialu River basin; (c) control catchment of the Jingle sub-basin.
Water 12 03055 g001
Figure 2. Soil maps and land-use maps of the study area: (a) and (b) represent the land-use map and soil map for the Jingle sub-basin, respectively; (c) and (d) represent the land-use map and soil map for the Jialu River basin, respectively.
Water 12 03055 g002
Figure 3. Flow process line segmentation results (red dots represent the segmentation nodes of different runoff components).
Water 12 03055 g003
Figure 4. Rules to determine the dominant runoff process with geographic information system, using soil and other maps. For agricultural areas, determination is based on the soil and slope map (a), and for other areas on the land-use map (b), (c) is legend.
Water 12 03055 g004
Figure 5. Rainfall and runoff characteristics for 40 events in the Jialu River basin (July to September): (a) runoff (R) and red dots represent rainfall, P (mm); (b) proportion of different runoff components (overland flow, interflow, and baseflow) in flood events, and the sector chart shows the average proportion of runoff components of all flood events in different periods; (c) antecedent precipitation index (API).
Water 12 03055 g005
Figure 6. Rainfall and runoff plot characteristics for 50 events in the Jingle sub-basin (July to September) and the description of (a) (b) (c) is the same as Figure 5.
Water 12 03055 g006
Figure 7. Maps of dominant runoff processes (DRPs) in the Jialu River basin and Jingle sub-basin produced with set of rules of the DRP.
Water 12 03055 g007
Figure 8. Percentage of total basin area corresponding to each dominant runoff process in the Jialu River basin and Jingle sub-basin.
Water 12 03055 g008
Figure 9. Comparative analysis of different runoff components and dominant runoff processes.
Water 12 03055 g009
Figure 10. Comparison of rainfall-runoff processes in different basins.
Water 12 03055 g010
Table 1. Characteristics and land-use in 2013 in the Jialu River basin and Jingle sub-basin.
CatchmentArea (km2)Elevation Range (m)GeologyLand Use of 2013(%)
FarmlandForestGrassWaterUrban
Jialu River basin1134674–1374Sandstone, limestone, alluvial rock40.520.7338.50.140.13
Jingle sub-basin27991194–2755Sandstone, shale, conglomerate25.315.8558.60.080.17
Table 2. Maps and spatial data used for process determination.
ResolutionCommentsReference or Data Holder
Soil map-Contains information about soil typesWorld Soil Database
(FAO/IIASA/ISRIC2008)
Soil information map-Information about soil depth and soil water characteristicsSoil Science Database of China
Slope map30 m Geospatial Date Cloud
Land use map30 m National Earth System Science Data Center (2013)
Geological map-Stratigraphic unitsWorld Soil Database (2008)
Table 3. The different runoff processes considered in the process decision schemes.
ProcessTypeAbbreviationIntensity of Runoff Process
Overland flow processesHortonianHOF1Immediate Hortonian overland flow due to infiltration hindrance (infiltration excess overland flow)
HOF2Delayed Hortonian overland flow due to infiltration hindrance
SaturationSOF1Immediate saturation overland flow due to soil saturation
SOF2Delayed saturation overland flow due to soil saturation
Subsurface flow processesLateral flowSSF1Subsurface flow
SSF2Delayed subsurface flow
Vertical flowDPDeep percolation
Table 4. Rainfall events with the same rainfall characteristics in different basins.
GroupSessionPrecipitation (mm)Rainfall Intensity (mm/h)Floods Duration (h)Peak Flow (m3/s)Runoff (mm)
12001081625.50.52595826.5
2002072626.930.75632543.29
22005080928.61.30683994.2
2006071326.821.0765236.81.48
32010072745.82.29532757.85
2012070647.841.91551945.22
(The three rainfall events of 20010816, 20050809, and 20100727 occurred in Jialu River basin, and the remaining three rainfall events occurred in the Jingle sub-basin).
Publisher’s Note: MDPI stays neutral with regard to jurisdictional claims in published maps and institutional affiliations.

