Article

The Process of Microbiological Remediation of the Polluted Słoneczko Reservoir in Poland: For Reduction of Water Pollution and Nutrients Management

1
Department of Biosystems Engineering, Poznań University of Life Sciences, Wojska Polskiego 28 St., 60-637 Poznań, Poland
2
Department of Environmental Management and Protection, AGH University of Science and Technology in Kraków, Av. Mickiewicza 30, 30-059 Kraków, Poland
3
Department of Geoinformation Photogrammetry and Remote Sensing of Environment, AGH University of Science and Technology in Kraków, Av. Mickiewicza 30, 30-059 Kraków, Poland
4
Department of Sanitary Engineering and Water Management, University of Agriculture in Kraków, Av. Mickiewicza 21, 31-120 Kraków, Poland
*
Author to whom correspondence should be addressed.
Water 2020, 12(11), 3002; https://doi.org/10.3390/w12113002
Submission received: 17 August 2020 / Revised: 21 October 2020 / Accepted: 23 October 2020 / Published: 26 October 2020

Abstract

:
The article discusses the impact of nutrients from sewage on the state of the sewage receiver. Bioremediation was carried out through the use of effective microorganisms. The potential recovery of valuable mineral and organic substances in the form of fertilizers was also examined. The Słoneczko Reservoir is a bathing area and serves many people in the summertime as a place of water recreation. Water quality deteriorated intensively from 2006 as a result of illegal wastewater discharge and the impact of fecal pollution from bathers. The high concentration of nutrients in the water was the cause of the eutrophication process and blooms of cyanobacteria, which pose a threat to human health in the bathing area. The bathing area was also closed many times by sanitary services as a result of exceeding the number of Escherichia coli and Enterococcus faecalis in the water. At the bottom of the reservoir, there was a layer of sediments with a thickness of 30–70 cm. Thus, the processes of anaerobic decomposition generated odor, causing nuisance in the reservoir area. Water transparency varied from 30 to 50 cm, due to the accumulation of suspensions and biomass of planktonic algae. The reservoir was subjected to microbiological bioremediation in 2017 and 2018 to polluted water treatment and to reduce the organic content of bottom sediments. Already after the first application of biopreparations putrefactive odors and the eutrophication process disappeared at the end of the 2017 summer season. Bioremediation reduced the value of E. coli and E. feacalis to the acceptable level. After the second application in 2018, the organic fraction of the bottom sediments was reduced to a very low level and the water transparency reached the bottom (maximum depth was 2.2 m) throughout the entire bathing area. The effect of the water remediation was maintained until 2019, and the surface water quality remained at a very good level. An important aspect in this case is also the exploitation of bottom sediments, because they are rich in nutrients and organic matter, and therefore it may have some potential as a fertilizer. The recovery of nutrients can be used in plant or pot production. However, they contain compounds that degrade quickly, causing unpleasant odors and threatening the environment. Thus, they should be managed and handled in an environmentally friendly and sustainable way.

1. Introduction

Lakes are valuable resources for various types of human activities. In addition to their natural qualities, lakes also have a social significance reaching back thousands of years. Archaeological data confirm that the shores of lakes have been a place of settlement for centuries [1,2]. The settlement function of lakes remains important, but they are increasingly recognized as key resources for tourism and recreation [1,3]. Unfortunately, lakes fulfilling these types of functions are most exposed to the negative impact of anthropogenic stress [4]. The literature has many studies devoted to the problem of interaction between human activity and the lake environment [1,5]. Conflicts between different stakeholders require integrated planning and management, but ultimately, if the state of a lake is already bad, quite invasive methods to restore a good condition are often needed. Choosing a method for cleaning up this type of water reservoirs is not an easy task [6,7,8].
Surface water pollution in most water reservoirs both in Poland and in the world comes mostly from soluble organic compounds (mainly from municipal or industrial wastewater discharge), nutrients (from surface runoff from fields or point sources), and suspended solids of various origin—mineral and organic fractions [9,10,11,12]. Over time, polluted sediments that accumulated at the bottom of the reservoirs, are an internal source of nutrients released into the reservoir waters, often even more destructively affecting the lake’s ecosystem than external sources [6].
With the example of this country, it is quite clear how such pollutants affect the quality of lake waters. As part of surface water quality monitoring in Poland, as compulsory in 885 lakes described in the 2019 report, approximately 87% (776 lakes) were classified as “poor condition” [13]. A similar poor condition is observed in other countries, e.g., in China over 85% of 138 lakes with an area >10 km2 are eutrophic [14], and in the USA it is 50–60% [7]. Such a low rating in the last report and similarly in several previous ones is mainly due to the application of the “worst indicator decides” principle. According to this rule, it is sufficient that one of the assessed indicators does not meet the standard for good condition and the overall assessment is negative. The assessed indicators were based on chemical, physical, and ecological factors [15,16].
Water facilities that require maintaining a good and very good water quality include bathing zones. These types of public recreation sites are exposed to pollution from various sources [17], and the process of water quality deterioration is observed very quickly. Stagnant sediments can generate a significant odor nuisance at the swimming area and around the lake [7]. Intense blooms of algae and cyanobacteria are very often a threat to the health and life of people bathing there [18]. The water quality control in such facilities is a legally regulated requirement [19]. In the event that the test results indicate exceeded levels in terms of quality and microbiological parameters, appropriate sanitary services are required to close the area for recreational activity [19].
According to reports comparing the condition of bathing areas (including lakes) in 28 European countries the situation in Poland is the worst in all of Europe [20]. Poland has the least bathing areas—only 28% of bathing places—meeting the highest standards, which is half of those in the following country in the list.
In the view of the above data, in Poland, as well as all over the world, there is an urgent and large-scale need to clean up lake reservoirs to improve the quality of their waters [17].
A range of physical, chemical, and biological technologies can be used to clean and revitalize water reservoirs [21].
Chemical methods include those that use chemicals that annihilate algae, etc. However, there are concerns that such treatments may also pose a threat to humans and have a harmful effect on lake and water reservoir ecosystems. A common algicide is, for example, copper sulphate, which causes lysis of a phytoplankton cell. Unfortunately, such action may cause the rapid release of toxins contained in algae, such as cyanotoxins [22]. These types of toxins can harm people who interact with water and can accumulate in sediments and water. They can also harm animals and aquatic vegetation. Some studies also showed that algae become resistant to the use of copper sulphate [7]. Similar doubts arise from the use of chemical flocculants that remove algae and nutrients to clarify the water of lakes [23]. There are reports that these treatments, as well as the use of other chemicals, can be harmful to the ecosystem and ineffective in the long run, and therefore costly [7,24,25].
Physical methods include less invasive techniques, such as destratification. This method involves, for example, pumping water from an oxygen-rich surface zone and appropriate nutrients into the bottom zone of the lake or artificial aeration [26,27]. However, this often gives a short-term effect and is not recommended for deep lakes [8]. There are systems using a wind-driven aerator, which makes them a cheap and quite reliable solution [28]. There are also various modifications and innovative solutions [29], such as the injection of spring waters with a high concentration of nitrates into the anaerobic lake bottom. This method is to increase the redox potential at the sediment-water interface, immobilizing phosphorus at the bottom of the reservoir [6]. These methods, being innovative, still do not have sufficient research documentation.
Other popular, but much more invasive, methods are dredging or refulation (the work consists of transporting sand from the bottom of the reservoir to the beach and parting it by construction machines) involving the physical removal of sediments from the bottom. The idea of this approach is to mechanically remove sediments accumulated at the bottom—it is assumed that their 10 cm top layer contains about 90% of total phosphorus found in the entire lake ecosystem [30]. However, these methods have quite significant disadvantages: They are very expensive and strongly affect the entire lake ecosystem [7,8]. According to some studies, if the lake is fully deepened (both organic fractions with a part of mineral sediments), it may take 2–3 years to restore bottom fauna [31], and finally one can significantly reduce the biodiversity and density of macrofauna [32].
However, the above method can be developed for the recovery of valuable mineral and organic substances in the form of fertilizers [33,34]. This will allow some revenue to be obtained that can offset the cost of extracting the bottom sediments [8]. Sometimes, however, it is a difficult undertaking because storage places often require demanding permits, especially in the lowlands, and require chemical and toxicity tests of the removed material [31]. For environmental reasons, a practical approach to sludge mining should be based on the identification of several critical aspects. The aspects justifying extraction are: The internal source of nutrients is dominant, the sedimentation speed is low, and the depth associated with high concentrations of labile phosphorus is known. Most studies describing failed dredging operations come from the observation that the external load was not simultaneously controlled and there was no additional use of other methods (removal of fish, inactivation by phosphorus, etc.) [8].
Among the biological methods, attention should be paid to biomanipulation and microbiological bioremediation. The first one was treated as supportive, for example, in stocking lakes with fry of predatory species [35]. The latter—microbiological bioremediation—is one of the most promising practices in the renewal of polluted surface waters and other aspects of environmental engineering [30,36,37,38]. Compared to other technologies, bioremediation methods are not invasive and do not violate the trophic relations of the trophic network of aquatic ecosystems [30]. These technologies belong to the environmental biotechnology industry and use the latest achievements of this scientific discipline [39]. Companies that offer water treatment services have different types of biopreparations in solid and liquid form [40]. The selection of microorganisms and composition of substrates in biomass mixtures are very often trade secrets (know how) of a particular company or biotechnology laboratory [41]. Solid forms are, for example, ECOTABS [42] and other types of lyophilized consortia of microorganisms in cryptobiotic form, which, when introduced into water, are activated and propagate in aqueous environment. This type of fixation—tablets—is convenient for transport and application to polluted waters. Unfortunately, the process of adaptation to new conditions is slow and more critical than the introduction of liquid biomass mixtures. Liquid biopreparations are also based on a consortia of microorganisms selected for the specific type of pollutants, but compared to lyophilized forms they are not in a cryptobiotic form [43,44,45]. The main difficulties in the application of this type of preparations include the problems of transport: Most often it is necessary to involve heavy transporting equipment, due to the amount of biomass mix needed (several dozen or hundred m3) introduced into the water of the reservoir. However, the advantages of the discussed solution include a very fast working life of microorganisms and effective biodegradation of pollutants found in waters [43]. In most cases, microbiological bioremediation is able to restore an appropriate quality of water in polluted and eutrophied water reservoirs [30]. EM (effective microorganisms) are also successfully used in the process of mineralization of soft organic fractions lying at the bottom of the reservoir. Microbiological bioremediation is used for both large as well as small and shallow water reservoirs [7,30]. In order to maintain the durability of the bioremediation effect, submerged and emerged macrophytes are planted, in so-called ecotones [46,47]. If the lake’s littoral zone has a natural macrophyte fraction, i.e., reed, (Phragramites australis), broadleaf cattail (Typha latifolia), narrowleaf cattail (Typha angustifolia L.), sweet flag (Acorus calamus), great manna (Glyceria aquatica) and greater pond sedge (Carex riparia), and other helophytes, additional planting treatments are not required.
An alternative to the technology used was dredging and recovery of biogenic raw materials, refulation or chemical methods, which the administration of the facility tried to avoid due to the invasive nature and the possibility of additional deterioration of water quality when moving suspended fractions. The use of microbiological bioremediation in the zonal treatment of reservoirs, including bathing areas, is also successfully used. The example can be the purification of the Słoneczko reservoir in the Bugaj reservoir zone, Piotrków Trybunalski in Poland. The main aim of the article is to analyze the effectiveness of water purification (mainly based on indicators: COD—Chemical Oxygen Demand and BOD5—Biochemical Oxygen Demand) and the reduction of soft organic fractions in sediments. Additional parameters, which were also monitored included selected forms of nutrients and variability of their concentrations, as well as the clarity of the freshwater after the application of biomass mixtures of effective microorganisms. Although the authors, based on the research of [33] and the Organic-PLUS project [48] showed many benefits of using bottom sediments and recovered nutrients in compost material.

2. Materials and Methods

2.1. The Characteristics of the Area

The Słoneczko Reservoir is a municipal swimming area used by a lot of people during summer. The forms of recreation in the area and its surroundings include: Bathing, water sports (kayaks, sailing boats, motorboats), and fishing. Technical facilities and the beach are satisfactorily organized. On the beach there are litter bins, toilets, and showers for bathing guests. The beach is fenced and is periodically cleaned, animals are not allowed on the beach or in the bathing area.
Outside the bathing area, the reservoir is covered with rush vegetation in the coastal and littoral zones. Słoneczko belongs to small and shallow water reservoirs with full water mixing in all periods of the year. The water supply to the Słoneczko bathing water is directly from the Bugaj dam reservoir located on the Wierzejka river (Figure 1).
The quality of the waters of the Bugaj river and reservoir directly affect the quality of the bathing waters. The geological background of the bottom of the reservoir is a sandy and silty substrate. The north-eastern part of the reservoir is characterized by a double mineral and peat bottom, due to its location in the zone of peat complexes up to 2.5 m in thickness near the Bugaj reservoir [49].
The surface runoff from agricultural areas in the Wierzejka drainage basin, i.e., arable land, permanent crops, meadows and pastures, mixed crops, forests, woody and shrub vegetation complexes affect the quality of river waters and bathing areas. Wierzejki waters due to the increased content of nitrate and nitrite nitrogen, as well as a high coliform index belong to waters outside the second quality class. The Bugaj reservoir itself is characterized by variability of water quality from out-of-class to II class [49]. Due to the low flow rate in the area of the Słoneczko area, the water is stagnant, which has a significant impact on the intensification of the eutrophication process. The coefficient of irregular flow—mean multi-year annual flow to the mean of the maximum multi-year annual flow: 0.80 m3·s–1–1.32 m3·s–1.
The main fish living in the waters of the reservoir are: Common carp (Ciprinus carpio L.), grass carp (Ctenopharyngodon idella L.), crucian carp (Carassius carassius), tench (Tinca tinca L.), els catfish (Silurus glanis), pike (Esox lucius L.), roach (Rutilus rutilus L.), bream (Abramis brama L.), perch (Perca fluviatilis L.), asp (Leuciscus aspius), zander (Sander lucioperca), ide (Leuciscus idus). In the waters of the Słoneczko reservoir, dead fish has been repeatedly observed, especially in the early spring and summer periods with intense algae blooms. According to experts, the reservoir water creates difficult conditions for fish management due to morphometric (Table 1) and quality conditions. The reservoir is shallow, silted, and overgrown. Water quality has been deteriorating progressively since 2006 as a result of illegal sewage discharge and the impact of faecal pollution from bathers. High levels of nutrients were the cause of the eutrophication process and the development of cyanobacteria, which pose a threat to human health at the bathing beach. The bathing area was closed many times by sanitary services as a result of exceeding Escherichia coli and Enterococcus faecalis in the water. At the bottom, there was a layer of organic mud with a thickness of 30–70 cm, whose anaerobic conditions generated odor nuisance in the area of the reservoir and significant loads of hydrogen sulfide in the waters of the bathing beach. Water transparency varied from 30 to 50 cm, due to the accumulation of suspensions and biomass of planktonic algae. Immediately before the application of biopreparations in 2016, the local angling association carried out a full catch of fish that were introduced into the neighboring Bugaj reservoir in order to avoid contamination introduced from angling baits into the reservoir waters.

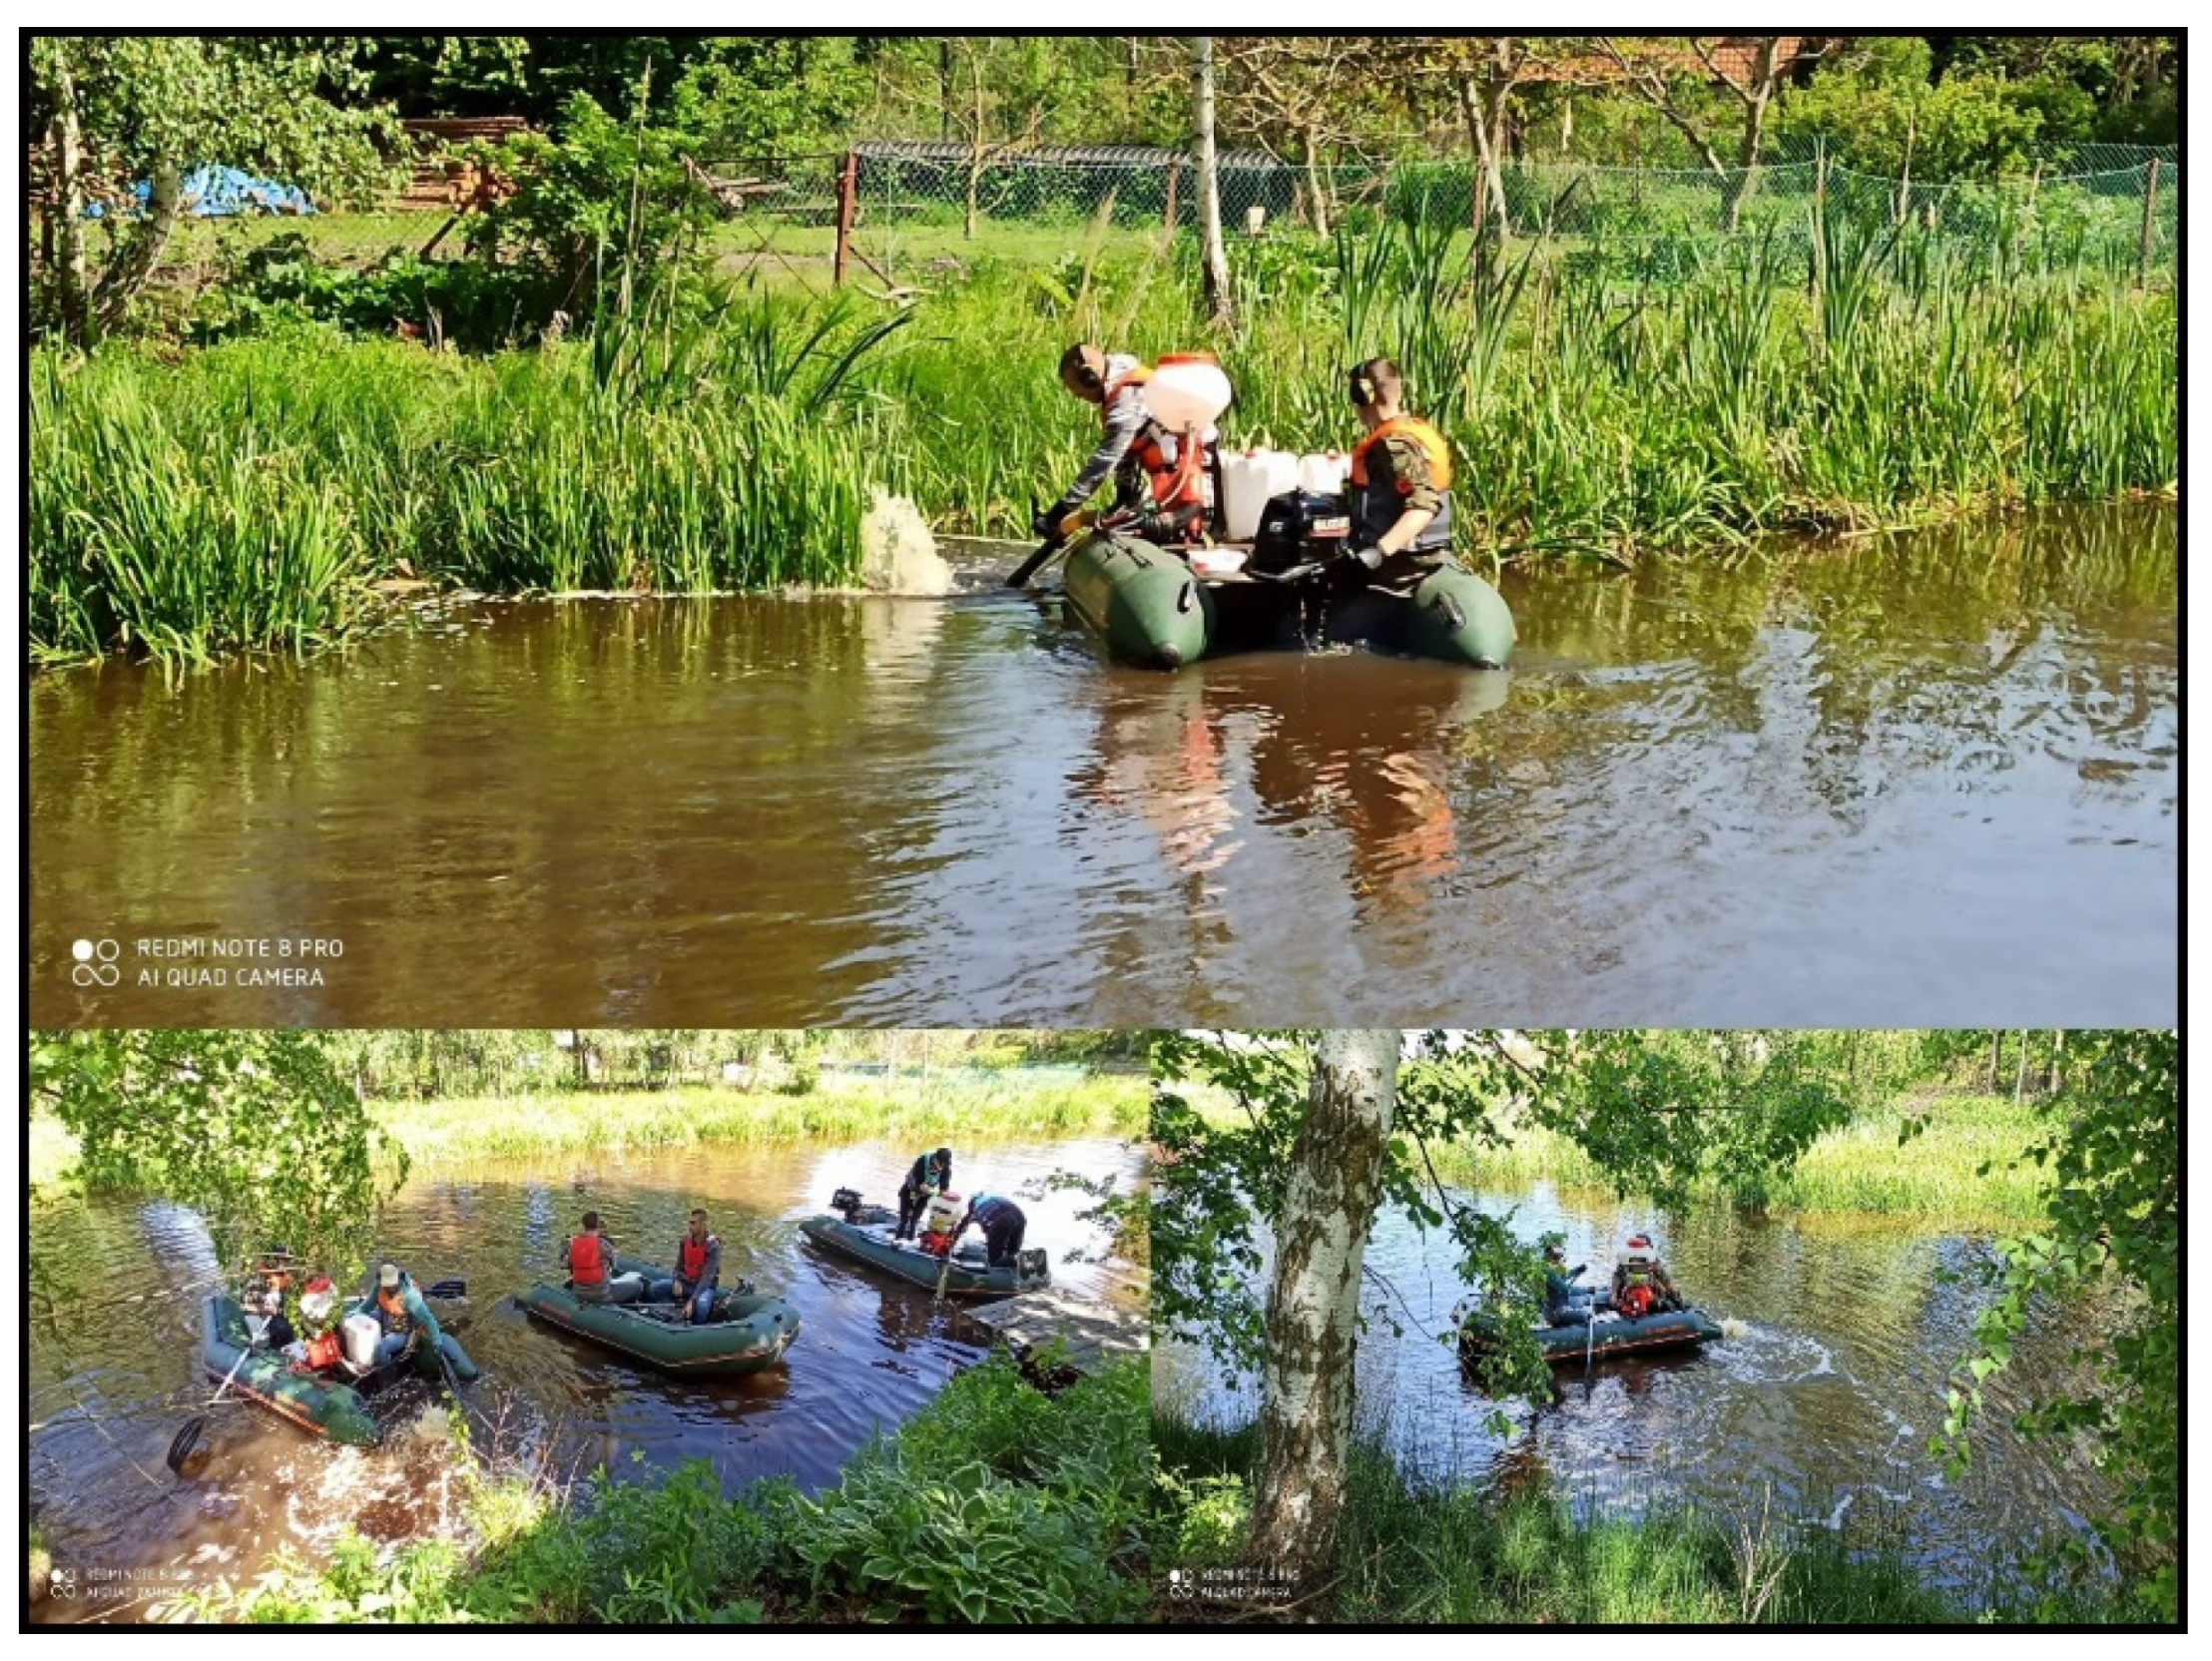
2.2. The Composition and the Application of the Microbiological Biopreparation

The collected samples of polluted water from the Słoneczko reservoir were taken to the laboratory and inoculated by microorganisms from commercial biopreparations. The ACS technologists applied a microbiological collection of strains to laboratory tests of the water and sediment pollution treatment. Two most effective biopreparations for water (ACS ODO—1) and sediment (ACS aqua 2) were selected. They were produced annually based on selected inoculates of ACS ODO (V = 3 m3 mixture) and 1 m3 of ACS aqua 2.
Mother biomass compositions were:
  • ACS ODO—1 biopreparation: Water, a consortium of lactic acid bacteria, phototrophic bacteria, yeast, ecological molasses from sugar cane, fermented wheat bran, minerals. The additional ingredients of biopreparation at the micro-level: Phytosterols (sitosterol, taraxasterol), phytohormones, triterpenes (lupeol, betulin, betulinic acid), flavonoids (hyperoside, quercetin, kaempferol), ellagic acid, pyrocatechic acid, brevofolin (ellagic acid derivative), vitamins (C, PP, P, B3, B5, B8, B11, B1, B2, A, E, F), and tannins.
  • ACS aqua 2 biopreparation: Water, sugar cane molasses, and effective microorganisms including the main strains of effective microorganisms: Lactobacillus casei, Lactobacillus plantarum—5.0 × 10⁶ cfu·mL−1 and Saccharomycces cerevisiae—5.0 × 10³ cfu·mL−1.
These biopreparations were introduced to the water and sediments of the Słoneczko reservoir at the beginning of May 2016, and then in 2017 and 2018. The application of the bio-mixture was carried out with the use of specialized equipment with liquid injectors (Figure 2).
The application of biopreparations was carried out in a zone about 0.5 m from the water surface and the bottom surface in order to effectively colonize both components of the reservoir (water and bottom sediments). Additionally, periodic macrophyte removal was performed, but only from a narrow coastal and littoral zone, which had a positive effect on the improvement of water quality, but these were small-scale treatments.
The mixture was evenly dispersed under the water surface, which ensured the efficient mixing of the biopreparations with water. The ACS ODO—1 biopreparation was introduced at a depth of approx. 0.5–0.8 m (V = 3 m3) under the water surface. The ACS aqua mixture 2 (V = 1 m3) was dosed with a gentle dispersed stream to the sludge layer to minimize the agitation of the sediments. The application process was carried out more evenly over the entire surface area of the Słoneczko reservoir.

2.3. The Area Measurements

The thickness of the bottom sediments was measured by the proprietary method of Mazur and Sitarek [43] with an endoscopic camera. The images from the bottom sediment examination were displayed on the laptop screen in an online mode. In the tested reservoir, the measurement was made in the coastal zone of the lake and the euphotic zone (to a depth of 2.3 m).
The measurements were carried out at selected measuring points P1–P6 (Figure 3) in 2016–2018. The samples were taken five times during May, July, October, and November. Six samples (V = 1 dm3 each) were taken at each point. Laboratory analyses were done from each sample for the selected physicochemical parameters, i.e., COD, BOD5, Ptot. (total phosphorus), Ntot. (total nitrogen), TSS (total suspended solids), in six or four repetitions (Table 2). The in situ measurements, i.e., pH, O2 concentration, sediment depth, and water transparency were carried out during the same research campaign in the number of 2–4 times (Table 2).
Measurements of water transparency were made at the same points simultaneously when measuring the thickness of bottom sediments using the Secchi disk method.
Measurements of pH and O2 concentration were made with the CX-406 (Elmetnron, Zabrze, Poland) device at each point during the same measurement campaign in four replications.
A total of 30 samples (V—1 dm3 each) were collected from each measurement campaign for the laboratory indication of selected physicochemical parameters in the number of repetitions specified in the research plan (Table 2). The methods of physicochemical analyses of the selected water quality parameters were listed in Table 3.

2.4. Statistical Analysis
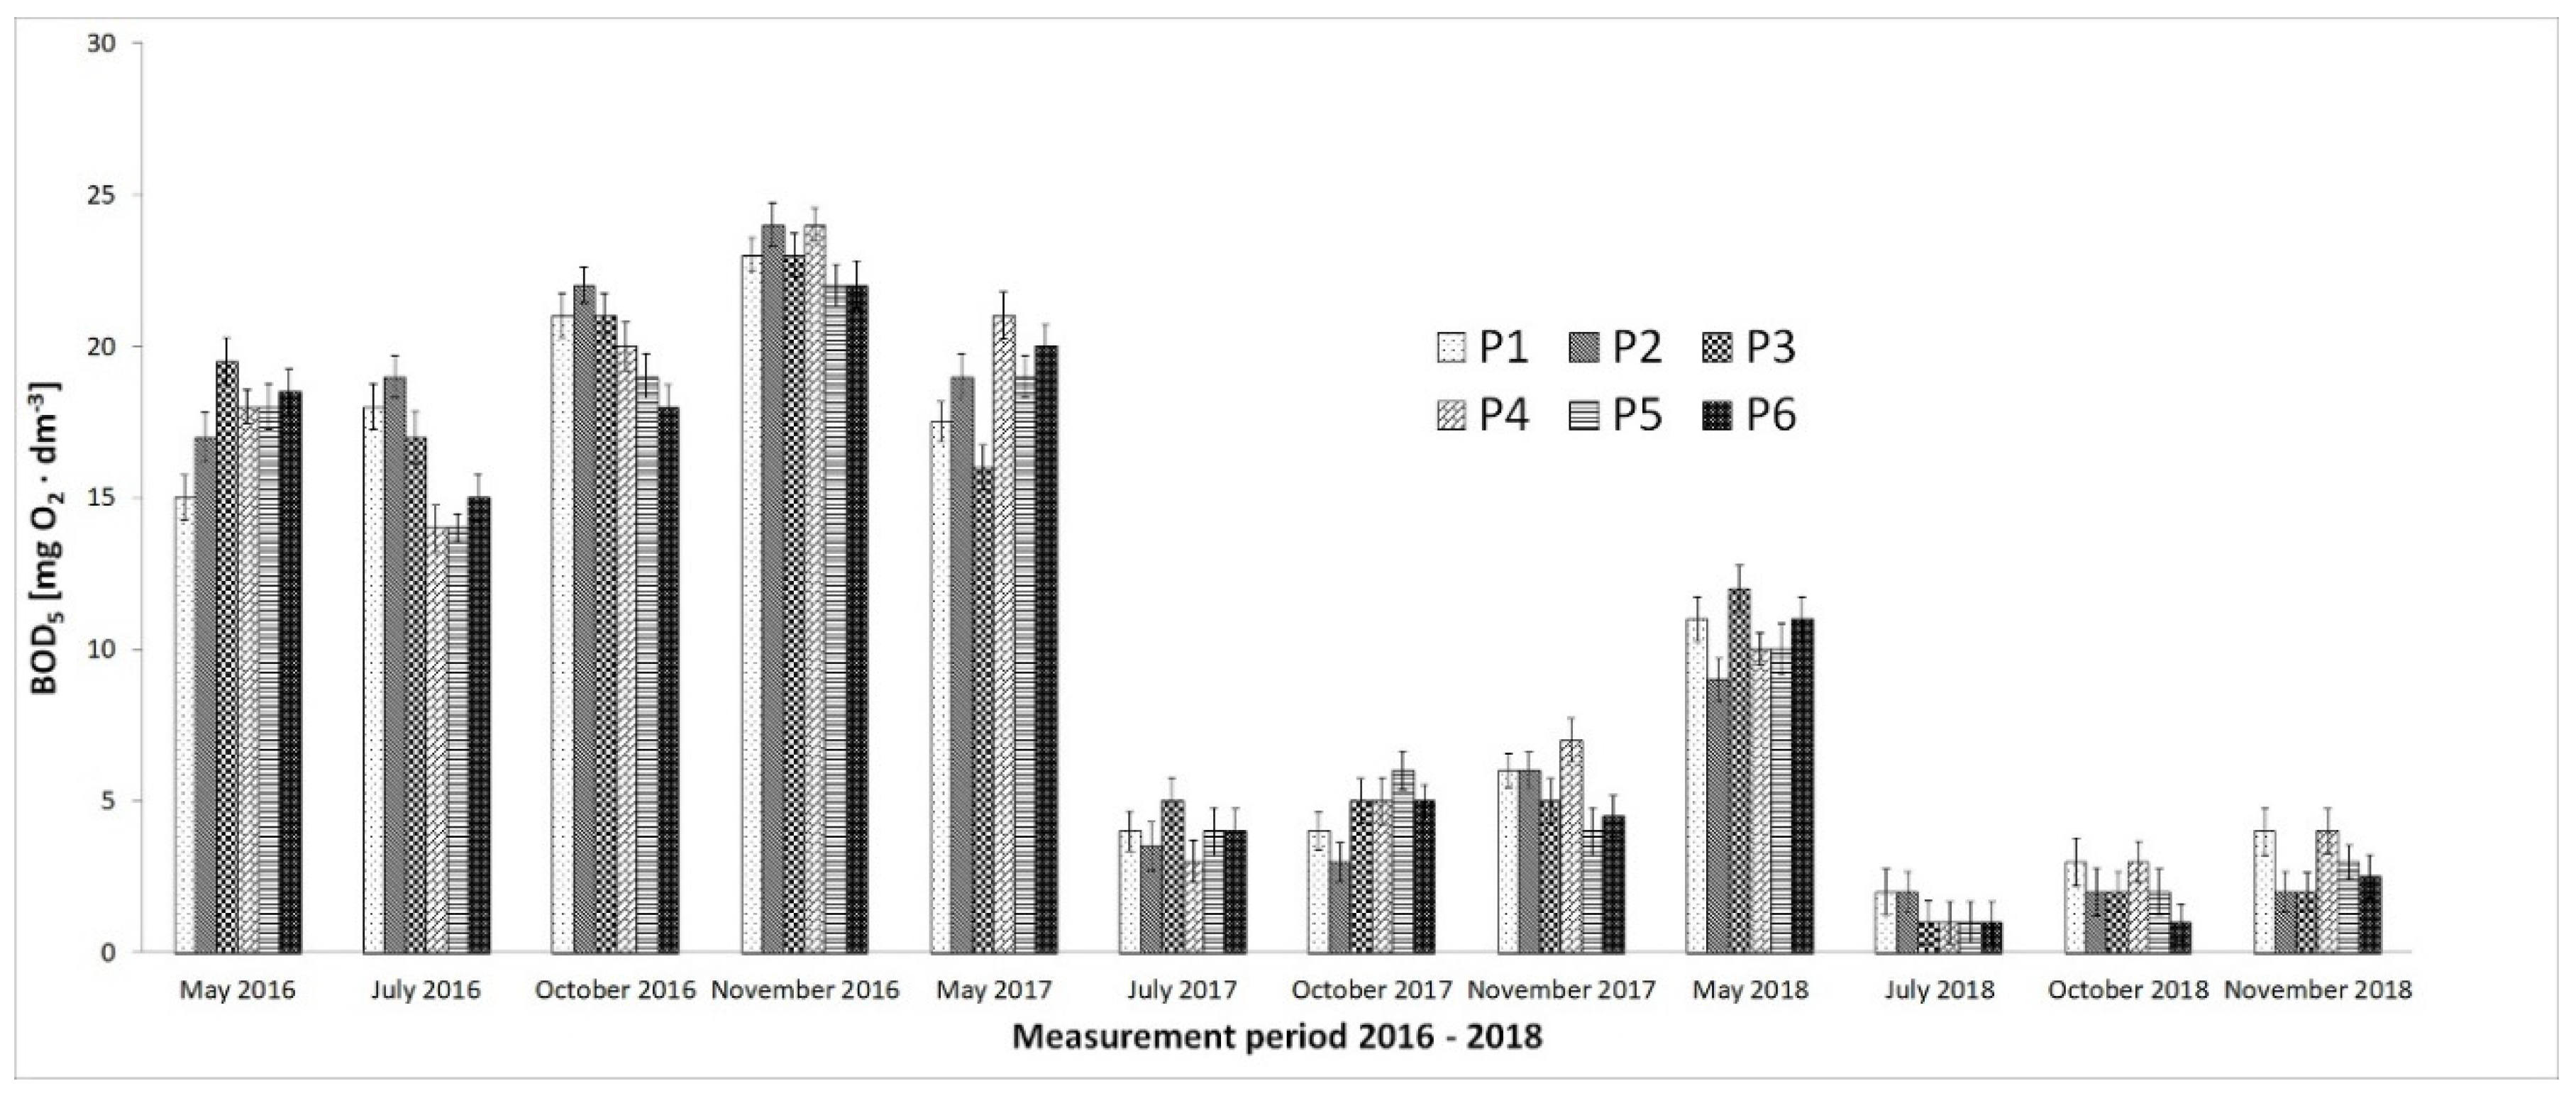
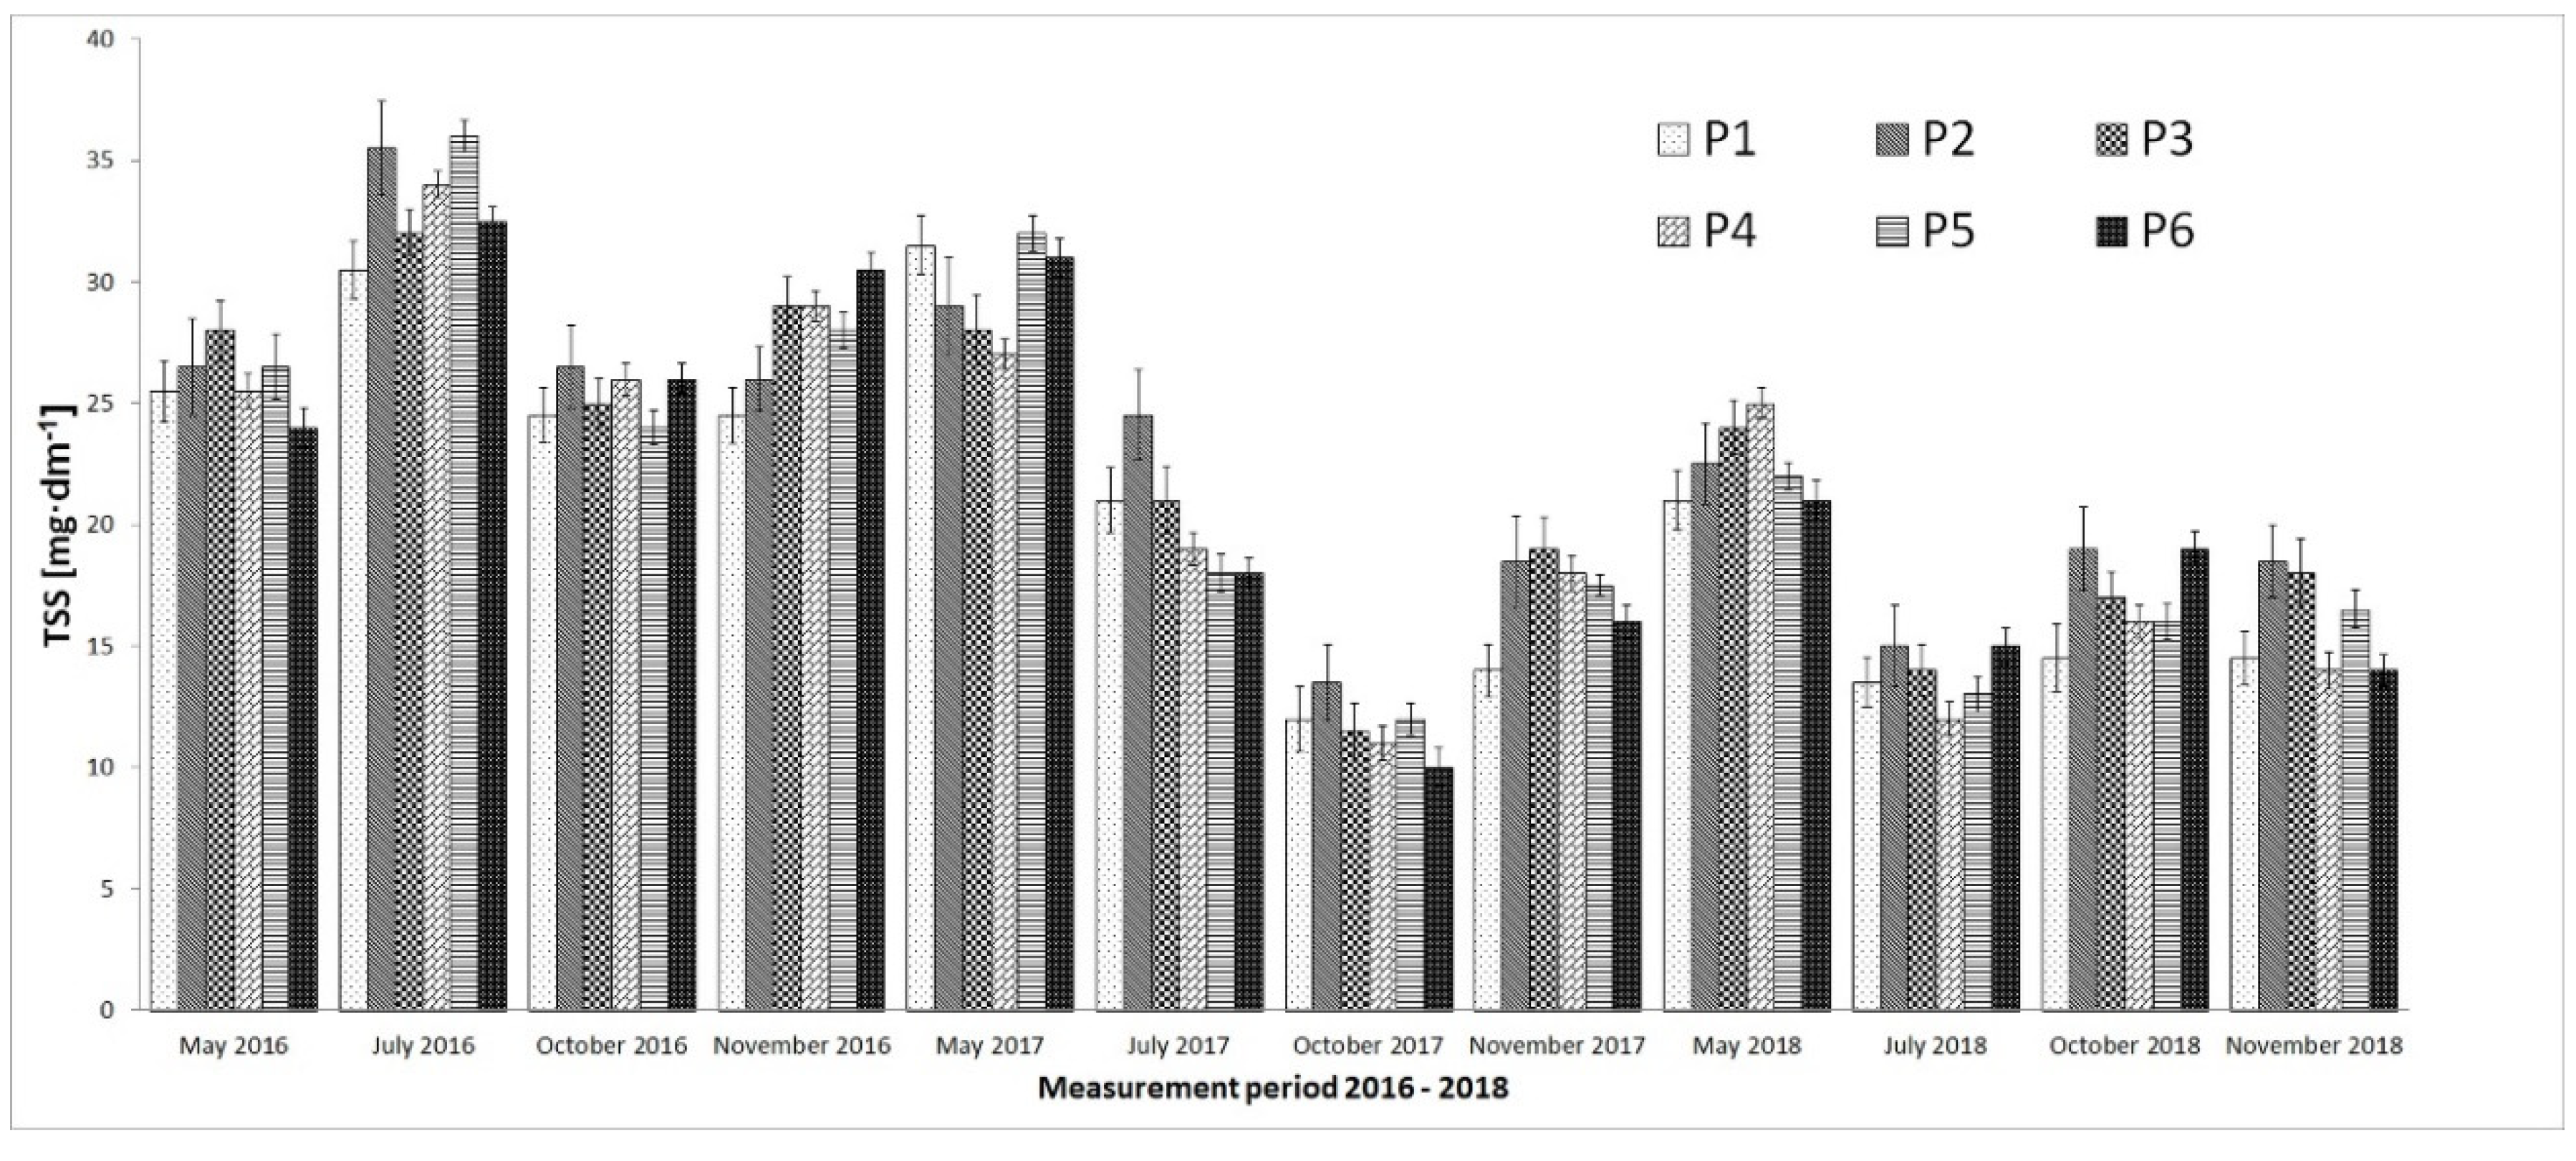
The one-way analysis of variance was applied to check the statistical significance of differences between the results in subsequent years for the studied parameters. The correlation matrices analysis between the studied parameters was also carried out. The analyses were carried out in program Statistica 13.

3. Results

Measurements of the pH value did not show significant changes during the treatment process, slight fluctuations in the range of 7–7.5 (Figure 3) are completely normal in the water environment. Stable pH values positively influenced the adaptation and development of microorganisms introduced from biopreparations. Only in the initial period, local increases in pH to the value of 8 in the period May and July 2016 were observed. However, they are still within the local variability range in the aquatic environment and may result from the increased local algae bloom in the water.
The thickness of the sediments (soft fractions) before the application process in 2016 varied in the range of 20–50 cm at measuring points P1–P6 (Figure 4). Research results indicate that during the two seasons of biopreparations application, an intensive reduction of organic fractions was observed. In the area since 2018, the bottom of the reservoir was sandy with almost complete descent at sedimentation points (Figure 4).
The differences in sludge thickness between measuring points result from the morphometric and hydraulic parameters of the reservoir.
Intensive eutrophication processes took place in the Słoneczko reservoir until 2017, and the suspended solids associated with algal bloom and the presence of additional suspended fractions (mineral and organic) significantly reduced light transmission in the water. In early spring and late autumn, the water transparency naturally improved (Figure 5), while in the late spring and summer months it dropped to 20 cm (Figure 5). After the application of biopreparations, the transparency was maintained even up to 120 cm even in the summer, and in the following season the bottom was visible in virtually all measuring points (Figure 5).
Statistical analyses confirm the significant differences in the thickness of the sediments and the water transparency between consecutive months at all measuring points (Table 4). Post-hoc tests show similarities in given years while between seasons there are differences in all measurement areas (Table S1). Statistical analyses were performed using the one-way variance method at a significance level of 0.05.
Oxygen concentration at measuring points before the application of biopreparations was variable at different times of the year. The summer months due to the intensive eutrophication process was characterized by a decrease in oxygen concentration to the level of about 8 mg·dm−3 (Figure 6), which for ecosystems of stagnant water in the lake may be a problem for sensitive organisms.
After the application of biopreparations and the cessation of intense algae blooms, no significant decreases in dissolved oxygen concentration were observed in 2017 and 2018 either. Statistical analyses confirmed the differences between the test periods for the average of all points (Table 4), while post-hoc tests showed differences before the application of biopreparations and in relation to subsequent research periods (Table S1). The differences in the subsequent months after application are no longer statistically significant, which indicates that the level of oxygen concentration in the lake’s waters has normalized (Figure 7).
Organic pollutants expressed in BOD5 and COD concentration are a mixture of organic fractions derived from the eutrophication process and pollutants from mixed points and surface sources. Concentrations for the BOD5 reservoir water in the range 15–25 mg O2·dm−3, and COD 32–42 mg O2·dm−3 indicate an exceeding value [50]. These values were maintained in the year preceding the application process and until May 2017. After the application of biopreparations, significantly lower BOD5 concentrations below 5 mg O2·dm−3 (for summer and autumn periods) in 2017 were recorded, and up to about 2–3 mg O2·dm−3 in the summer of 2018 and up to 5 mg O2·dm−3 in the autumn of 2018. A similar trend was observed for the concentration of COD values, whose level dropped to the range of 20–25 mg O2·dm−3, in the summer and autumn of 2017, and 16–25 for 2018 (Figure 7 and Figure 8).
Statistical analyses also showed significant differences between the period before the application of biopreparations and in the following seasons 2017 and 2018 (Table 4). Post-hoc tests show similarities between the selected months in a given year, while between years the results show statistically significant differences for all study periods (Table S1).
The laboratory analysis of nutrients showed that in the period before the application of biomixtures, Ntot concentrations ranged from 0.45–0.75 and Ptot 0.062–0.095 mg·dm−3 (Figure 9 and Figure 10). They reached the highest values in the autumn 2016 and early spring 2017 (Figure 9 and Figure 10). However, after application, the levels of both nutrients began to drop significantly, which is quite a surprising trend, given the intensive process of bottom sediment mineralization and the distribution of organic pollutants. These compounds may have been bioaccumulated by the significant macrophyte growth.
Moreover, statistical analyses showed significant differences in the level of both compounds in the reservoir waters in the following months from the application of biomass mixtures (Table 4 and Table S1). This phenomenon can be explained by a significant amount of macrophytes that emerged in the reservoir littoral zone (outside the bathing area). This natural plant formation with dominant species, i.e., reed, (Phragramites australis), broadleaf cattail (Typha latifolia), lesser bulrush (Typha angustifolia, L.) belongs to a natural wetland, having an effective nutrient uptake capacity.
TSS in the case of surface waters depends on many parameters, which is why its interpretation requires expert knowledge of the examined site. The Słoneczko reservoir belongs to transitional, river waters due to its origin. In 2016, TSS values ranged from 24–37 mg·dm−3 (Figure 11) for this water class without additional geological conditions, this level is significantly exceeded [50]. The highest values were observed in July 2016, due to the peak of the eutrophication process and a slight decrease in the remaining months of the year. After the application of biopreparations, a significant reduction of TSS was noted in July 25—19 mg·dm−3, which is a significant difference compared to the current year (Table 4). In the next season of 2018, TSS values remained at a low level of approx. 15 mg·dm−3, with slight fluctuations (Figure 11).
Statistical tests of Pearson’s correlation showed a strong inversely proportional correlation of TSS changes in the examined months with changes in water transparency in the corresponding periods in 2016–2018. Pearson’s correlation coefficient was—0.766 with a p-value = 3.874 × 10−140 (for the condition p < 0.05, the assumption was met). The interpretation of this result is intuitive, because suspended solids are a key factor affecting the transparency of water, so reducing the content of suspended solids has a positive effect on increasing the transparency of water and light transmission in the water column.

4. Discussion

The reduction of organic fractions in sediments in the process of their mineralization and the light penetration increase in water were the main criteria whose fulfilment determined the achievement of the goal of the microbiological bioremediation process. Both goals have been achieved, and the observed changes testify to the elimination of the process of eutrophication of water with the bloom of algae [7]. Many authors examining the effectiveness of the process of water reservoir revitalization have chosen water transparency and TSS concentration as the main criteria [51,52,53]. Water transparency at all measuring points of the examined lake was below 0.7 m, i.e., below the threshold value according to [54], according to other sources, 1 m is reported as the limit value [34]. In the presented research, the visibility of the Secchi disk increased during the research period from below 0.5 to 1.5 m for all research sections, slightly lower, but also satisfactory results were obtained by other researchers. For example, Dondajewska et al. [6] obtained a similar increase in transparency, e.g., from 0.6 to 1.2 m (Maltese Lake) after using chemical compounds (including magnesium chloride). Unfortunately, in the case of another lake—Konin Lake, the use of EM as the only method did not significantly improve the transparency of the water. However, this was related to the characteristics of this lake, its significant pollution and lack of macrophytes. In turn, Chróst [55] indicates that the use of this type of microorganism in the purification of lakes gives very good results, especially in relation to phosphorus and nitrogen, however, they suggest that phosphorus binding agents should be added supportively. In other studies on a Polish lake [56], it was shown that the lowest water transparency occurs in autumn and does not exceed 120 cm. In the case of the presented research, after applying bioremediation in both summer and autumn, much better results were obtained, and the differences between the summer and autumn periods were negligible.
The Słoneczko reservoir was revitalized using only the biotechnological method without any other methods (mechanical or chemical). Compared to others, this method does not generate additional side effects [8,31,32]. Many reservoirs in Poland and in the world were cleaned using chemical and mechanical methods, but it is difficult to clearly determine whether the selection of these methods was correct [41,57]. Despite the achieved effects, none of the analogous methods guaranteed long-term effects after the procedures [58]. Microbiological bioremediation allows eliminating bottom sediments in the process of microbiological biodegradation, and its effectiveness as shown by the results of research for the Słoneczko reservoir is very high (Figure 4). Mechanical methods are also able to eliminate bottom sediments, but the treatments used interfere with the structure of aquatic ecosystems and disturb it [32]. Suction dredging or dredging are cost-intensive methods and require the use of heavy equipment [7,8]. During the course of the works, the TSS level increases as a result of moving sediments, which causes an additional decrease in water transparency. Microbiological bioremediation does not cause this type of negative momentary effects, therefore, it no longer strains disturbed trophic relations in degraded reservoirs [43]. Often, prior to selecting bottom sediments in small reservoirs, emptying is required [59].
The microbiological method works very well in the biodegradation of organic pollutants in surface waters [30,55] but does not require emptying the reservoir. A significant reduction in the concentration of organic pollutants expressed as BOD5 and COD was recorded at the cleaned bathing facility (Figure 7 and Figure 8). Organic compounds are a source of carbon for microorganisms [60]. Their concentrations compared to wastewater in wastewater treatment plants are significantly smaller, so the selection of microorganisms is based on the selection of forms with high affinity for the substrate [61]. It is assumed that uncontaminated lakes have a BOD5 value < 3 mg·dm−3, this indicator also strongly positively correlates with water turbidity, as in this work and others [34,62].
In many treatments, together with an intensive process of biodegradation of organic pollutants in water and organic fractions in bottom sediments, the release of nitrogen and phosphorus mineral compounds to water is recorded [63]. It is a natural process characteristic of nitrification processes under aerobic conditions [64]. In order to reduce the oversupply of nutrients in the purification process, additional chemical treatments are used, i.e., precipitation of nitrogen and phosphorus with various flocculants or adsorbers [31,65]. These compounds are re-stored in bottom sediments, and during intensive mixing of waters they may be released [66]. The use of ecotones (artificial plantings of submerged and emerged macrophytes) that capture the nutrients released by microorganisms and build them into the plant structure works very favorably with microbiological methods [67]. In the event of excessive growth, one could use biomass obtained from plants for energy purposes [68] or as a structure for composting processes. In the Słoneczko reservoir, a rather unusual trend was noted indicating a reduction of nutrients after the application of biomixtures with a decrease in the concentration of organic pollutants. The high phosphorus concentration is particularly worrying because it is considered that values above 0.03 mg P dm−3 indicate strong eutrophication [69]. According to OECD [52], however, even concentrations > 0.1 mg P dm−3 are already defined as hypertrophic. This is also referred to in newer sources [34]. In the present study, Ntot and Ptot concentrations decreased of about 50% in the following season after application (Figure 9 and Figure 10). The observed phenomenon was caused by the activity of macrophyte plants in the reservoir littoral zone. The sun reservoir has a natural well-developed rush plant formation in the coastal zone and the littoral zone (apart from the beach of the bathing beach). These plants probably allowed (not collecting sufficient data to prove) for efficient uptake of nutrients intensively released in nitrification processes in both water and bottom sediments, which is also indicated by other researchers [30]. Similar plant species are used in hydrophyte treatment plants in our conditions, which work very well in the treatment of domestic and municipal wastewater [70,71,72,73]. A similar reduction of approx. 50% can be achieved with dosing chemicals, such as magnesium chloride in Uzarzewskie Lake—where a decrease from 0.152 to 0.074 mg·dm−3 [6]. In turn, the removal of cyprinid fish enabled a decrease of several percentages (from 0.050 to 0.036 mg·dm−3) in the case of the Tallinn water reservoir in Estonia [7].
Along with the improvement of water quality parameters in the Słoneczko reservoir, the oxygen profile of the water significantly improved, in the studied years a significant increase in O2 concentration in water was noted in the summer season in 2017 and 2018 compared to 2016 before application (Figure 6). Eliminating the eutrophication process has a positive effect on the oxygen parameters of the waters in the lakes (Figure 6). Earlier, there were periods of strong oxygen surge in the Słoneczko reservoir and the accompanying effects of fish dreaming. The revitalization process will have a positive effect on the recovery of the biological and trophic balance of the reservoir. After eliminating excess pollution, self-purification processes of water have been launched, which also condition the maintenance of the long-term bioremediation effect. An increase in species biodiversity in purified waters can be expected [74]. In polluted waters, sensitive species are retreating because they are unable to tolerate exceeding of selected water quality parameters [75].

5. Conclusions

  • The microbiological revitalization process showed a positive effect on improving the quality parameters of the Słoneczko reservoir waters.
  • Bottom sediments (soft organic fractions) have been virtually eliminated to result in a sandy bottom.
  • Water clarity has improved significantly, and in 2018 the bottom of the reservoir was visible at all measuring points.
  • Microorganisms from biomass mixtures introduced into the reservoir water also reduced the level of organic pollution to a safe state for aquatic ecosystems.
  • The eutrophication process was eliminated, which had a positive effect on the oxygen concentration in the reservoir water in summer.
  • Natural plant formation (emerging and submerged macrophytes) in the coastal zone and littoral allowed for effective nutrient uptake, therefore, their level despite intensive nitrification processes was also reduced.
During lake renovation, a long-term monitoring program for physico-chemical and biological parameters (phytoplankton, zooplankton, fish, and bottom fauna) is recommended. The lake’s response to reducing the internal load is noticeable in the long run and will only be effective if the external load is also controlled.

Supplementary Materials

The following are available online at https://www.mdpi.com/2073-4441/12/11/3002/s1. Table S1: Tukey post hoc tests—for ANOVA analysis results.

Author Contributions

Conceptualization, A.M., R.M. and K.C.; methodology, A.M. and R.M.; software, A.M., R.M. and K.C.; validation, J.M., A.M., R.M., K.C., W.C. and D.J.; formal analysis, J.M., A.M., R.M. and K.C.; investigation, A.M., R.M. and K.C.; resources, A.M., R.M. and K.C.; data curation, J.M., A.M. and R.M.; writing—original draft preparation, J.M., A.M., R.M., K.C. and W.C.; writing—review and editing, J.M., A.M., R.M., K.C. and W.C.; visualization, A.M. and R.M.; supervision, J.M., A.M. and R.M. All authors have read and agreed to the published version of the manuscript.

Funding

This research received no external funding.

Conflicts of Interest

The authors declare no conflict of interest. The funders had no role in the design of the study; in the collection, analyses, or interpretation of data; in the writing of the manuscript, or in the decision to publish the results.

References

  1. Furgała-Selezniow, G.; Jankun-Woźnicka, M.; Mika, M. Lake regions under human pressure in the context of socio-economic transition in Central-Eastern Europe: The case study of Olsztyn Lakeland, Poland. Land Use Policy 2020, 90. [Google Scholar] [CrossRef]
  2. Wacnik, A.; Kupryjanowicz, M.; Mueller-Bieniek, A.; Karczewski, M.; Cywa, K. The environmental and cultural contexts of the late Iron age and medieval settlement in the Mazurian Lake District, NE Poland: Combined palaeobotanical and archaeological data. Veg. Hist. Archaeobotany 2014, 23, 439–459. [Google Scholar] [CrossRef] [Green Version]
  3. Tuohino, A. In Search of the Sense of Finnish Lakes. A Geographical Approach to Lake Tourism Marketing. Nord. Geogr. Publ. 2019, 44, 139. [Google Scholar]
  4. Dynowski, P.; Senetra, A.; Źróbek-Sokolnik, A.; Kozłowski, J. The impact of recreational activities on aquatic vegetation in Alpine Lakes. Water 2019, 11, 173. [Google Scholar] [CrossRef] [Green Version]
  5. Dustin, D.L.; Jacobson, P.C. Predicting the extent of lakeshore development using GIS datasets. Lake Reserv. Manag. 2015, 31, 169–179. [Google Scholar] [CrossRef]
  6. Dondajewska, R.; Gołdyn, R.; Kowalczewska-Madura, K.; Kozak, A.; Romanowicz-Brzozowska, W.; Rosińska, J.; Budzyńska, A.; Podsiadłowski, S. Hypertrophic Lakes and the Results of Their Restoration in Western Poland. In Polish River Basins and Lakes—Part II. The Handbook of Environmental Chemistry; Korzeniewska, E., Harnisz, M., Eds.; Springer: Cham, Switzerland, 2019; Volume 87. [Google Scholar] [CrossRef]
  7. Wagner, T.; Erickson, L. Sustainable Management of Eutrophic Lakes and Reservoirs. J. Environ. Prot. 2017, 8, 436–463. [Google Scholar] [CrossRef] [Green Version]
  8. Bormans, M.; Maršálek, B.; Jančula, D. Controlling internal phosphorus loading in lakes by physical methods to reduce cyanobacterial blooms: A review. Aquat. Ecol. 2016, 50, 407–422. [Google Scholar] [CrossRef]
  9. Xu, R.; Cai, Y.; Wang, X.; Li, C.; Liu, Q.; Yang, Z. Agricultural nitrogen flow in a reservoir watershed and its implications for water pollution mitigation. J. Clean. Prod. 2020, 267. [Google Scholar] [CrossRef]
  10. Matysik, M.; Absalon, D.; Habel, M.; Maerker, M. Surface Water Quality Analysis Using CORINE Data: An Application to Assess Reservoirs in Poland. Remote Sens. 2020, 12, 979. [Google Scholar] [CrossRef] [Green Version]
  11. Osuch, E.; Osuch, A.; Podsiadłowski, S.; Piechnik, L.; Chwirot, D. Project of coagulant dispenser in pulverization aerator with wind drive. J. Ecol. Eng. 2017, 18, 192–198. [Google Scholar] [CrossRef]
  12. Szarek-Gwiazda, E.; Mazurkiewicz-Boroń, G. A comparison between the water quality of the main tributaries to three submontane dam reservoirs and the sediment quality in those reservoirs. Oceanol. Hydrobiol. Stud. 2010, 39. [Google Scholar] [CrossRef]
  13. Statistics Poland. Environment 2019. Available online: https://stat.gov.pl/obszary-tematyczne/srodowisko-energia/srodowisko/ochrona-srodowiska-2019,1,20.html (accessed on 27 June 2020).
  14. Chen, S.; Little, J.C.; Carey, C.C.; McClure, R.P.; Lofton, M.E.; Lei, C. Three-dimensional effects of artificial mixing in a shallow drinkingwater reservoir. Water Resour. Res. 2018, 54, 425–441. [Google Scholar] [CrossRef]
  15. Wiech, A.K.; Marciniewicz-Mykieta, M.; i Toczko, B. Stan Środowiska w Polsce. Raport 2018. Warszawa: Główny Inspektorat Ochrony Środowiska/The State of the Environment in Poland; 2018 Report; Chief Inspectorate of Environmental Protection: Warsaw, Poland, 2018. [Google Scholar]
  16. Panek, P.; Ciećko, P. Zanieczyszczenia wód w Polsce—Stan śródlądowych wód powierzchniowych i podziemnych. Monografie Komitetu Inżynierii Środowiska. In Zanieczyszczenia Wód w Polsce. Stan, Przyczyny, Skutki; Monografie Nr 164; Gromiec, M., Pawłowski, L., Polskiej Akademii Nauk, Komitet Inżynierii Środowiska PAN, Eds.; Wydawnictwo Polskiej Akademii Nauk: Lublin, Poland, 2019; p. 107. ISBN 578-83-63714-63-5. [Google Scholar]
  17. Mendiondo, E.M. Limnologia by J G Tundisi and T Matsumura Tundisi. Braz. J. Biol. 2009, 69, 229. [Google Scholar] [CrossRef] [Green Version]
  18. Song, H.; Li, X.; Lu, X.; Inamori, Y. Investigation of microcystin removal from eutrophic surface water by aquatic vegetable bed. Ecol. Eng. 2009, 35, 1589–1598. [Google Scholar] [CrossRef]
  19. Chief Inspectorate of Environmental Protection. Available online: http://www.gios.gov.pl/pl/ (accessed on 27 June 2020).
  20. Environment 2019—The European Environment Agency and the European Commission. The Report on European Bathing Water Quality in 2018. Available online: https://ec.europa.eu/environment/water/water-bathing/index_en.html (accessed on 27 June 2020).
  21. Mazur, R. Lakes Restoration: Analysis of terminology incorrectly used in the scientific literature. Acta Sci. Pol. Form. Circumiectus 2019, 18, 135–146. [Google Scholar] [CrossRef]
  22. Touchette, B.W.; Edwards, C.T.; Alexander, J. A Comparison of Cyanotoxin Release Following Bloom Treatment with Copper Sulfate or Sodium Carbonate Peroxyhdrate. In Cyanobacterial Harmful Algal Blooms: State of the Science and Research Needs; Hudnell, H.K., Ed.; Springer: New York, NY, USA, 2008; pp. 314–315. [Google Scholar]
  23. Kuster, A.C.; Kuster, A.T.; Huser, B.J. A comparison of aluminum dosing methods for reducing sediment phosphorus release in lakes. J. Environ. Manag. 2020, 261, 110195. [Google Scholar] [CrossRef]
  24. EPA—United States Environmental Protection Agency. 2018 Final Aquatic Life Criteria for Aluminum in Freshwater. Available online: https://www.epa.gov/wqc/2018-final-aquatic-life-criteria-aluminum-freshwater (accessed on 27 June 2020).
  25. Huser, B.J. Aluminum application to restore water quality in eutrophic lakes: Maximizing binding efficiency between aluminum and phosphorus. Lake Reserv. Manag. 2017, 33, 143–151. [Google Scholar] [CrossRef]
  26. Chen, X.; Yang, X.; Dong, X.; Liu, E. Environmental changes in Chaohu Lake (southeast, China) since the mid 20th century: The interactive impacts of nutrients, hydrology and climate. Limnol. Ecol. Manag. Inland Waters 2013, 43, 10–17. [Google Scholar] [CrossRef]
  27. Visser, P.M.; Ibelings, B.W.; Bormans, M.; Hfuisman, J. Artificial mixing to control cyanobacterial blooms: A review. Aquat. Ecol. 2016, 50, 423–441. [Google Scholar] [CrossRef] [Green Version]
  28. Podsiadłowski, S.; Osuch, E.; Przybył, J.; Osuch, A.; Buchwald, T. Pulverizing aerator in the process of lake restotation. Ecol. Eng. 2018, 121, 99–103. [Google Scholar] [CrossRef]
  29. Osuch, E.; Osuch, A.; Rybacki, P.; Przybylak, A. Analysis of the Theoretical Performance of the Wind-Driven Pulverizing Aerator in the Conditions of Góreckie Lake—MaximumWind Speed Method. Energies 2020, 13, 502. [Google Scholar] [CrossRef] [Green Version]
  30. Łopata, M.; Augustyniak, R.; Grochowska, J.; Parszuto, K.; Tandyrak, R. Selected Aspects of Lake Restorations in Poland. In Polish River Basins and Lakes—Part II. The Handbook of Environmental Chemistry; Korzeniewska, E., Harnisz, M., Eds.; Springer: Cham, Switzerland, 2020; Volume 87. [Google Scholar] [CrossRef]
  31. Cooke, G.D.; Welch, E.B.; Peterson, S.A.; Nichols, S.A. Restoration and Management of Lakes and Reservoirs, 3rd ed.; Cooke, G.D., Ed.; Taylor and Francis: Boca Raton, FL, USA, 2005. [Google Scholar] [CrossRef]
  32. Lewis, M.A.; Weber, D.E.; Stanley, R.S.; Moore, J.C. Dredging impact on an urbanized Florida bayou: Effects on benthos and algal-periphyton. Environ. Pollut. 2001, 115, 161–171. [Google Scholar] [CrossRef]
  33. Dróżdż, D.; Malińska, K.; Mazurkiewicz, J.; Kacprzak, M.; Mrowiec, M.; Szczypiór, A.; Postawa, P.; Stachowiak, T. Fish pond sediments from aquaculture production—Current practices and potentials for nutrient recovery. Int. Agrophys. 2020, 34, 33–41. [Google Scholar] [CrossRef]
  34. Bhateria, R.; Jain, D. Water quality assessment of lake water: A review. Sustain. Water Resour. Manag. 2016, 2, 161–173. [Google Scholar] [CrossRef] [Green Version]
  35. Kozák, P.; Duris, Z.; Petrusek, A.; Buřič, M.; Horká, I.; Kouba, A.; Kozubíková-Balcarová, E.; Policar, T. Crayfish Biology and Culture; University of South Bohemia in České Budějovice, Faculty of Fisheries and Protection of Waters: Vodňany, Czech Republic, 2015. [Google Scholar]
  36. Nazir, R.; Rehman, S.; Nisa, N.; ali Baba, U. Chapter 7—Exploring Bacterial Diversity: From Cell to Sequence; Bandh, S.A., Shafi, S., Shameem, N., Eds.; Freshwater Microbiology, Academic Press: London, UK, 2019; pp. 263–306. [Google Scholar] [CrossRef]
  37. Ni, Z.; Wu, X.; Li, L.; Lv, Z.; Zhang, Z.; Hao, A.; Iseri, Y.; Kuba, T.; Zhang, X.; Wu, W.; et al. Pollution control and in situ bioremediation for lake aquaculture using an ecological dam. J. Clean. Prod. 2017, 172, 2256–2265. [Google Scholar] [CrossRef]
  38. Shan, M.; Wang, Y.; Xue, S. Study on bioremediation of eutrophic lake. J. Environ. Sci. 2009, 21, S16–S18. [Google Scholar] [CrossRef]
  39. Pandey, A.; Negi, S.; Soccol, C. Current Developments in Biotechnology and Bioengineering: Production, Isolation and Purification of Industrial Products; Elsevier Science: Amsterdam, The Netherlands, 2016. [Google Scholar]
  40. Hamilton, D.P.; Salmaso, N.; Paerl, H.W. Mitigating harmful cyanobacterial blooms: Strategies for control of nitrogen and phosphorus loads. Aquat. Ecol. 2016, 50, 351–366. [Google Scholar] [CrossRef]
  41. Dondajewska, R.; Kozak, A.; Rosińska, J.; Gołdyn, R. Water quality and phytoplankton structure changes under the influence of effective microorganisms (EM) and barley straw–Lake restoration case study. Sci. Total Environ. 2019, 660, 1355–1366. [Google Scholar] [CrossRef]
  42. Wolna-Maruwka, A.; Jakubus, M.; Jordanowska, J. ECO TABS™ preparation action in stabilization of sewage sludge part ii: Assessment of microbiological properties of sludge. Proc. Ecopole 2016, 10, 367–378. [Google Scholar] [CrossRef]
  43. Sitarek, M.; Napiórkowska-Krzebietke, A.; Mazur, R.; Czarnecki, B.; Pyka, J.P.; Stawecki, K.; Olech, M.; Sołtysik, S.; Kapusta, A. Application of Effective Microorganisms Technology as a lake restoration tool-A case study of Muchawka Reservoir. J. Elem. 2017, 22, 529–543. [Google Scholar] [CrossRef]
  44. Mazur, R. The Application of Microbiological Biopreparations in the Process of Water. Remediation of the Dam Reservoir in Głuchów. Acta Scientiarum Polonorum. Form. Circumiectus 2020, 19, 81–95. [Google Scholar] [CrossRef]
  45. Mazur, R.; Siatarek, M. Microbiological bioremediation of the Kamienna Gora dam reservoir. Acta Sci. Polonorum. Form. Circumiectus 2020, 19, 47–59. [Google Scholar] [CrossRef]
  46. Yin, C.; Lan, Z. The nutrient retention by ecotone wetlands and their modification for Baiyangdian Lake restoration. Water Sci. Technol. 1995, 32, 159–167. [Google Scholar] [CrossRef]
  47. Holland, M. (Ed.) Ecotones: The Role of Landscape Boundaries in the Management and Restoration of Changing Environments; Springer Science & Business Media: Berlin/Heidelberg, Germany, 2012. [Google Scholar] [CrossRef] [Green Version]
  48. European Horizon 2020 Project. Available online: https://organic-plus.net/ (accessed on 27 June 2020).
  49. Trzepla, M.; Heliasz, Z.; Chybiorz, R.; Lewandowski, J.; Bojakowska, I.; Lis, J.; Pasieczna, A.; Wołkowicz, S.; Bujakowska, K.; Hrybowicz, G.; et al. Objaśnienia do Mapy Geośrodowiskowej Polski 1:50 000, Arkusz Żarki; PIG: Warszawa, Poland, 2004; p. 879. [Google Scholar]
  50. Regulation of the Minister of Marine Economy and Inland Navigation: Journal of Laws 2019 Pos. 2149. Regulation on the Classification of Ecological Status, Ecological Potential, Chemical Status and the Method of Classifying the Status of Surface Water Bodies as well as Environmental Quality Standards for Priority Substances. Available online: http://www.fao.org/faolex/results/details/en/c/LEX-FAOC192330/ (accessed on 27 June 2020).
  51. Araújo, F.; Becker, V.; Attayde, J.L. Shallow lake restoration and water quality management by the combined effects of polyaluminium chloride addition and benthivorous fish removal: A field mesocosm experiment. Hydrobiologia 2016, 778, 243–252. [Google Scholar] [CrossRef]
  52. Jeppesen, E.; Søndergaard, M.; Liu, Z. Lake restoration and management in a climate change perspective: An introduction. Water 2017, 9, 122. [Google Scholar] [CrossRef] [Green Version]
  53. Liu, Z.; Hu, J.; Zhong, P.; Zhang, X.; Ning, J.; Larsen, S.E.; Chen, D.; Yiming, G.; He, H.; Jeppesen, E. Successful restoration of a tropical shallow eutrophic lake: Strong bottom-up but weak top-down effects recorded. Water Res. 2018, 146, 88–97. [Google Scholar] [CrossRef]
  54. OECD. Eutrophication of Waters: Monitoring, Assessments and Control; Organisation for Economic Co-Operation and Development: Paris, France, 1984. [Google Scholar] [CrossRef]
  55. Chróst, R. Bioremediation of microbial contaminated and eutrophicated water reservoirs: Myths and facts, for and against. Hydromicro 2017: Drobnoustroje—Osiągnięcia i Wyzwania, Proceedings of the IX Scientific Conference, Olsztyn, Poland, 4 April 2017. Available online: https://www.microbiology.pl/ix-ogolnopolska-konferencja-hydromikrobiologiczna-hydromicro-2017-drobnoustroje-osiagniecia-i-wyzwania/ (accessed on 27 June 2020).
  56. Osuch, E.; Osuch, A.; Podsiadłowski, S.; Rybacki, P.; Adamski, M.; Ratajczak, J. Assessment of the condition of samołęskie lake waters. J. Ecol. Eng. 2016, 17, 108–112. [Google Scholar] [CrossRef]
  57. Gołdyn, R.; Podsiadłowski, S.; Dondajewska-Pielka, R.; Kozak, A. The sustainable restoration of lakes—towards the challenges of the Water Framework Directive. Ecohydrol. Hydrobiol. 2014, 14. [Google Scholar] [CrossRef]
  58. Grochowska, J.; Augustyniak, R.; Łopata, M. How durable is the improvement of environmental conditions in a lake after the termination of restoration treatments. Ecol. Eng. 2017, 104, 23–29. [Google Scholar] [CrossRef]
  59. Palmieri, A.; Shah, F.; Annandale, G.W.; Dinar, A. Reservoir Conservation, Economic and Engineering Evaluation of Alternative Strategies for Managing Sedimentation in Storage Reservoirs: RESCON Approach; The RESCON Approach, World Bank: Washington, DC, USA, 2003; Volume I. [Google Scholar]
  60. De Oliveira, A.J.F.C.; De França, P.T.R.; Pinto, A.B. Antimicrobial resistance of heterotrophic marine bacteria isolated from seawater and sands of recreational beaches with different organic pollution levels in southeastern Brazil: Evidences of resistance dissemination. Environ. Monit. Assess. 2010, 169, 375–384. [Google Scholar] [CrossRef]
  61. Fiałkowska, E.; Fyda, J.; Pajdak-Stós, A.; Więckowski, K. Osad Czynny. Biologia i Analiza Mikroskopowa/Activated Sludge. Biology and Microscopic Analysis; Wydawnictwo Seidel-Przywecki: Piaseczno, Poland, 2010. [Google Scholar]
  62. Alobaidy, A.H.M.J.; Abid, H.S.; Maulood, B.K. Application of water quality index for assessment of Dokan lake ecosystem, Kurdistan region, Iraq. J. Water Resour. Prot. 2010, 792–798. [Google Scholar] [CrossRef] [Green Version]
  63. Watts, C.J. The effect of organic matter on sedimentary phosphorus release in an Australian reservoir. Hydrobiologia 2000, 431, 13–25. [Google Scholar] [CrossRef]
  64. Zhang, W.; Jin, X.; Meng, X.; Tang, W.; Shan, B. Phosphorus transformations at the sediment–water interface in shallow freshwater ecosystems caused by decomposition of plant debris. Chemosphere 2018, 201, 328–334. [Google Scholar] [CrossRef] [PubMed]
  65. Ross, G.; Haghseresht, F.; Cloete, T.E. The efect of pH and anoxia on the performance of Phoslock®, a phosphorus binding clay. Harmful Algae 2008, 7, 545–550. [Google Scholar] [CrossRef]
  66. Liu, C.; Du, Y.; Yin, H.; Fan, C.; Chen, K.; Zhong, J.; Gu, X. Exchanges of nitrogen and phosphorus across the sediment-water interface influenced by the external suspended particulate matter and the residual matter after dredging. Environ. Pollut. 2019, 246, 207–216. [Google Scholar] [CrossRef]
  67. Neidhardt, H.; Achten, F.; Kern, S.; Schwientek, M.; Oelmann, Y. Phosphorus pool composition in soils and sediments of transitional ecotones under the influence of agriculture. J. Environ. Qual. 2019, 48, 1325–1335. [Google Scholar] [CrossRef] [Green Version]
  68. Gizińska-Górna, M.; Czekała, W.; Jóźwiakowski, K.; Lewicki, A.; Dach, J.; Marzec, M.; Pytka, A.; Janczak, D.; Kowalczyk-Juśko, A.; Listosz, A. The possibility of using plants from hybrid constructed wetland wastewater treatment plant for energy purposes. Ecol. Eng. 2016, 95, 534–541. [Google Scholar] [CrossRef]
  69. De Backer, S.; Teissier, S.; Triest, L. Identification of Total Phosphate, Submerged Vegetation Cover and Zooplankton Size Thresholds for Success of Biomanipulation in Peri-Urban Eutrophic Ponds. Hydrobiologia 2014, 737, 281–296. [Google Scholar] [CrossRef]
  70. Marzec, M.; Gizińska-Górna, M.; Jóźwiakowski, K.; Pytka-Woszczyło, A.; Kowalczyk-Juśko, A.; Gajewska, M. The efficiency and reliability of pollutant removal in a hybrid constructed wetland with giant miscanthus and Jerusalem artichoke in Poland. Ecol. Eng. 2019, 127, 23–35. [Google Scholar] [CrossRef]
  71. Marzec, M.; Jóźwiakowski, K.; Dębska, A.; Gizińska-Górna, M.; Pytka-Woszczyło, A.; Kowalczyk-Juśko, A.; Listosz, A. The efficiency and reliability of pollutant removal in a hybrid constructed wetland with common reed, manna grass, and Virginia mallow. Water 2018, 10, 1445. [Google Scholar] [CrossRef] [Green Version]
  72. Gajewska, M.; Jóźwiakowski, K.; Ghrabi, A.; Masi, F. Impact of influent wastewater quality on nitrogen removal rates in multistage treatment wetlands. Environ. Sci. Pollut. Res. 2015, 22, 12840–12848. [Google Scholar] [CrossRef] [PubMed] [Green Version]
  73. Mazur, R.; Głodkowska, A.; Kujawiak, S.; Mazurkiewicz, J.; Górski, K.; Czekała, W. Reed bed system as alternative solution for badly operating lagoon in wastewater treatment plant. Ośrodek Informacji “Technika instalacyjna w budownictwie”. Instal 2013, 4, 49–57. [Google Scholar]
  74. Angeler, D.G.; Allen, C.R.; Birgé, H.E.; Drakare, S.; McKie, B.G.; Johnson, R.K. Assessing and managing freshwater ecosystems vulnerable to environmental change. Ambio 2014, 43, 113–125. [Google Scholar] [CrossRef] [Green Version]
  75. Sánchez-Bayo, F.; Wyckhuys, K.A.G. Worldwide decline of the entomofauna: A review of its drivers. Biol. Conserv. 2019, 232, 8–27. [Google Scholar] [CrossRef]
Figure 1. Map of the measurements points at Słoneczko Reservoir.
Water 12 03002 g001
Figure 2. Biopreparation application into the water and bottom sediments by liquid injectors (tailored for these purposes).
Water 12 03002 g002
Figure 3. In the pH value at points P1–P6 in the reservoir. Measurement campaigns 2016–2018.
Water 12 03002 g003
Figure 4. Changes in the thickness of bottom sediments in 2016–2018 at points P1–P6. Measurement campaigns 2016–2018.
Water 12 03002 g004
Figure 5. Changes in water transparency in the years 2016–2018, measured with a Secchi disk.
Water 12 03002 g005
Figure 6. Changes in oxygen concentration in reservoir water in the years 2016–2018.
Water 12 03002 g006
Figure 7. Changes in the BOD5 (Biochemical Oxygen Demand) value at points P1–P6 in the reservoir. Measurement campaigns 2016–2018.
Water 12 03002 g007
Figure 8. Changes in COD (Chemical Oxygen Demand) value at points P1–P6 in the reservoir. Measurement campaigns 2016–2018.
Water 12 03002 g008
Figure 9. Changes in Ntot value at points P1–P6 in the reservoir. Measurement campaigns 2016–2018.
Water 12 03002 g009
Figure 10. Changes in Ptot value at points P1–P6 in the reservoir. Measurement campaigns 2016–2018.
Water 12 03002 g010
Figure 11. Changes in TSS (Total Suspended Solids) value at points P1–P6 in the reservoir. Measurement campaigns 2016–2018.
Water 12 03002 g011
Table 1. Morphometric characteristics of the reservoir.
Name of Water ReservoirSurface Area (ha)Volume (m3)Depth (m)
(average–max)
Lake Types
Słoneczko Reservoir6.568,6851.3–2.2polymictic
Table 2. The schedule of laboratory indication and in situ measurement during measurement campaigns.
The Measurement Campaigns in Years: 2016–2018
ParametersMeasurement PointsMayJulyOctoberNovember
Ntot, Ptot.
(mg·dm−3)
P15 samp. × 6 rep.5 samp. × 6 rep.5 samp. × 6 rep.5 samp. × 6 rep.
P25 samp. × 6 rep.5 samp. × 6 rep.5 samp. × 6 rep.5 samp. × 6 rep.
P35 samp. × 6 rep.5 samp. × 6 rep.5 samp. × 6 rep.5 samp. × 6 rep.
P45 samp. × 6 rep.5 samp. × 6 rep.5 samp. × 6 rep.5 samp. × 6 rep.
P55 samp. × 6 rep.5 samp. × 6 rep.5 samp. × 6 rep.5 samp. × 6 rep.
P65 samp. × 6 rep.5 samp. × 6 rep.5 samp. × 6 rep.5 samp. × 6 rep.
COD, BOD5
(mg O2·dm−3)
TSS
(mg·dm−3)
P15 samp. × 4 rep.5 samp. × 4 rep.5 samp. × 4 rep.5 samp. × 4 rep.
P25 samp. × 4 rep.5 samp. × 4 rep.5 samp. × 4 rep.5 samp. × 4 rep.
P35 samp. × 4 rep.5 samp. × 4 rep.5 samp. × 4 rep.5 samp. × 4 rep.
P45 samp. × 4 rep.5 samp. × 4 rep.5 samp. × 4 rep.5 samp. × 4 rep.
P55 samp. × 4 rep.5 samp. × 4 rep.5 samp. × 4 rep.5 samp. × 4 rep.
P65 samp. × 4 rep.5 samp. × 4 rep.5 samp. × 4 rep.5 samp. × 4 rep.
Sediment depth, transparency
(cm)
P15 meas. × 2 rep.5 meas. × 2 rep.5 meas. × 2 rep.5 meas. × 2 rep.
P25 meas. × 2 rep.5 meas. × 2 rep.5 meas. × 2 rep.5 meas. × 2 rep.
P35 meas. × 2 rep.5 meas. × 2 rep.5 meas. × 2 rep.5 meas. × 2 rep.
P45 meas. × 2 rep.5 meas. × 2 rep.5 meas. × 2 rep.5 meas. × 2 rep.
P55 meas. × 2 rep.5 meas. × 2 rep.5 meas. × 2 rep.5 meas. × 2 rep.
P65 meas. × 2 rep.5 meas. × 2 rep.5 meas. × 2 rep.5 meas. × 2 rep.
pH,
(-)
O2
(mg·dm−3)
P15 meas. × 4 rep.5 meas. × 4 rep.5 meas. × 4 rep.5 meas. × 4 rep.
P25 meas. × 4 rep.5 meas. × 4 rep.5 meas. × 4 rep.5 meas. × 4 rep.
P35 meas. × 4 rep.5 meas. × 4 rep.5 meas. × 4 rep.5 meas. × 4 rep.
P45 meas. × 4 rep.5 meas. × 4 rep.5 meas. × 4 rep.5 meas. × 4 rep.
P55 meas. × 4 rep.5 meas. × 4 rep.5 meas. × 4 rep.5 meas. × 4 rep.
P65 meas. × 4 rep.5 meas. × 4 rep.5 meas. × 4 rep.5 meas. × 4 rep.
5 samp.—5 sampling in the month, 5 meas.—5 measurements in the month; rep.—number of repetitions (collected samples or measurements at each point during 1 measurement campaign).
Table 3. Physicochemical analyses of selected water quality parameters—list of methods used.
IndicationUnitResearch MethodThe Limit of QuantificationUncertainty Expressed as Precision
BOD5mgO2·dm−3PN-EN ISO 5815-1:2019-12
PN-EN ISO 934-2+A1:2012
±4.511%
COD–CrmgO2·dm−3ISO 15705±8.59%
Total nitrogenmgN·dm−3EN-ISO 11905/1
ISO 7890-1
±0.51.3%
Total phosphorusmgP·dm−3EN-ISO 6878±0.51.2%
Total suspended solidsmg·dm−3ISO 11923: 1997(R2019)±1.52%
The results were presented on the plots as the average value of analyzed parameters (COD, BOD5, TSS, Ntot, Ptot, pH, O2) with standard deviations (Figure 3, Figure 4, Figure 5, Figure 6, Figure 7, Figure 8, Figure 9 and Figure 10).
Table 4. Analysis of variance of selected parameters value in the period 2016–2018 (between months).
ANOVA
Df Sum SqMean SqF ValuePr (>F)
SedimentsMonths11114,811.110,437.4167.70.00
Residuals44,064.970862.2
BOD5Groups1185,784.77798.64420.810.00
Residuals2519.114281.8
CODGroups11112,29010,2081443.80.00
Residuals10,09714287
Water transparenceGroups112,477,432225,2211118.570.00
Residuals142554708201
O2Groups11850.377.3388.10.00
Residuals284.414280.2
TNGroups1153.62754.8752252200.60.00
Residuals4.7587721480.002215
TPGroups110.9483100.086213039.90.00
Residuals0.06091721482.84 ×10−5
TSSGroups1161,692.65608.41418.70.00
Residuals564514284
TN—total nitrogen; TP—total phosphorus; TSS—total suspended solids; Df—degrees of freedom; Sum Sq—square of the sum; Mean Sq—square of the average value; F value—the value of the F statistic from the Df—degrees of freedom; Sum Sq—square of the sum; Mean Sq—square of the average value; F value—the value of the F statistic from the Fisher-Snedecor distribution for ANOVA tests; Pr (>F)—p value for ANOVA.
Publisher’s Note: MDPI stays neutral with regard to jurisdictional claims in published maps and institutional affiliations.

