1. Introduction
Quantifying aquifers’ active recharge, i.e., the mean annual volume of groundwater resources potentially available for water use, is a relevant factor for water resources planning and management in a groundwater-fed river basin.
The assessment of active recharge of an aquifer cannot disregard the complexity of the processes involved when water, mainly from rain and snowmelt, moves downward from the vadose zone below plant roots to the saturated zone, as wells as the amount of data required for an accurate estimation of the hydrogeological balance [
1,
2]. This must take into account not only natural inflows and outflows but also water exchanges between surface and groundwater, artificial recharges (irrigation, urbanization, re-infiltration), and related withdrawals.
For groundwater resource estimation, software like MODFLOW represents a reliable and very used modeling tool [
3]. However, common models for simulating and predicting groundwater conditions and groundwater/surface-water interactions need some parameters to be carefully calibrated for running properly [
4].
Parameter identification is an essential step in constructing a groundwater model. The process of recognizing model parameter values by conditioning on observed data of the state variable is referred to as inverse modeling [
5] and references therein]. A series of inverse methods have been proposed to solve the inverse problem, ranging from trial-and-error manual calibration to the current complex automatic data assimilation algorithms [
6,
7,
8], from direct solutions to indirect methods, and from single estimate to stochastic Monte Carlo simulation [
9].
When, for a given groundwater system, it is not possible to properly quantify all the elements which contribute to the inflows and outflows defining the hydrogeological water balance, as an alternative, inverse evaluation techniques can be adopted [
2]. These techniques allow estimating the mean annual water resources of a given hydrogeological structure enough reliably even with limited input data.
In the present study, the applied methodology for groundwater assessment capitalizes on such techniques through a numerical model that can be implemented into a Geographical Information System (GIS) environment [
10,
11,
12], once a digital elevation model (DEM) for the investigated area is available.
A DEM can be derived from several sources, for example, the most commonly used data sources in the past were topographic contour line maps, while modern techniques include remote sensing (reflection radiometer and radar), light detection and ranging (LiDAR) technology, photogrammetric restitution, and most recently structure-from-motion (SfM) [
13,
14]. These DEMs are characterized by different degrees of accuracy, mainly related to spatial resolution.
DEM resolution is known to affect topographic and hydrologic parameters such as stream networks, watershed boundaries and sizes, flow accumulation threshold values, network morphology, and slope [
15,
16], with implications for the predictions derived from hydraulic models, such as floodwater levels and inundation maps [
13], as well as for water balance simulation results [
17,
18].
As a consequence, using DEMs at different resolutions can have relevant implications for predictions derived from hydrological models [
13]. This issue is usually addressed by a sensitivity analysis of the models’ results concerning the DEM resolution [
19,
20,
21].
Higher DEM resolution provides a more accurate representation of topographic characteristics [
22] which makes data information on a small scale more accurate and representative. When larger-scale information is converted to small-scale information, there are some critical issues to be considered, such as the heterogeneity and the non-linear response [
23]. Beven believes that only one hydrological model could not solve the scales problem and that the scale dependence of distributed hydrological models must be introduced linking parameters across scales [
24,
25]. On the other hand, Blöschl [
26] indicates that there is a gradual process of solving the scales problem. The controlling equations of the model are established based on a point scale, which is deemed effective for different catchment scales, without taking into consideration how the model parameters are related to various scales.
Therefore, the accuracy of hydrological model results depends on the source and resolution of DEM data [
3,
27,
28,
29,
30].
Given the above, this study aims to quantify the influence of the spatial resolution of the digital elevation model (DEM) on the evaluation of the groundwater resources of the Alcantara river basin at Moio cross-section in Sicily region (Italy), which comprises a large part of a volcanic aquifer, i.e., the hydrogeological basin of the northern side of the Etna Mountain. Due to its peculiar hydrological and geological characteristics, and to its environmental relevance as a fluvial park, that makes it very different from the other Sicilian river basins, the Alcantara river basin was previously analyzed for climate change impact investigation [
31] and through a simulation study of the interaction between groundwater and surface water [
32].
None of the previous studies, however, investigated the role of DEM resolution on the accuracy of the modeling results, as they apply conceptual lumped models, that consider input variables and parameters to be uniformly distributed throughout the watershed. In particular, Aronica and Bonaccorso [
31] combined stochastic generators of daily rainfall and temperature with the IHACRES (Identification of unit Hydrographs and Component flows from Rainfall, Evapotranspiration and Streamflow) model to qualitative investigate modifications in the hydropower potential of the Alcantara River basin under different climatic scenarios. Borzì et al. [
32] proposed a modified IHACRES lumped model to simulate the complex connection between the Northern Etna groundwater system and the Alcantara river basin.
Conversely, an appropriate DEM resolution is fundamental for distributed models, that require spatial data, including climatic data, physical characteristics of the basin (topography and hydrography), as well as soil and land-use data.
Moreover, the effect of implementing different methods for estimating evapotranspiration needs to be investigated. Nowadays, evapotranspiration formulas exist in abundance, reflecting the difficulty of conceptualizing this process into a simple expression [
33]. This issue has also been investigated in relation to uncertainty in hydrological modeling [
34].
The diversity of mathematical formulations for actual evapotranspiration assessment, the data information needed, and the level of required expertise make it difficult to select the most appropriate formula for a given situation. Consequently, different approaches are often analyzed and compared for specific areas, as illustrated by Verstraeten et al. [
35]. Numerous scientists took a similar path, for example, Brutsaert [
36], Singh [
37], Jensen et al. [
38], Morton [
39], Singh and Xu [
40], Xu and Singh [
41,
42,
43], Fisher et al. [
44], Oudin et al. [
45,
46] and Donohue et al. [
47].
A proper evapotranspiration assessment has never been done before for the case study considered herein and, therefore, this work aims to add a piece of knowledge in this respect too. In particular, three different methods are applied: the method proposed by Turc [
48], the modified Turc method for Sicilian basins [
49], and the method based on Budyko curves [
50,
51,
52,
53].
The study is structured as follows. The case study characteristics are described in
Section 2, as well as each step of the applied methodology. In
Section 3, some preliminary analyses of the available data of rainfall, temperature, and streamflow for the area under investigation are presented. In
Section 4, the procedure for validating the proposed methodology against observed streamflow data is illustrated. In
Section 5 results of the study are discussed and conclusions are drawn in
Section 6.
2. Materials and Methods
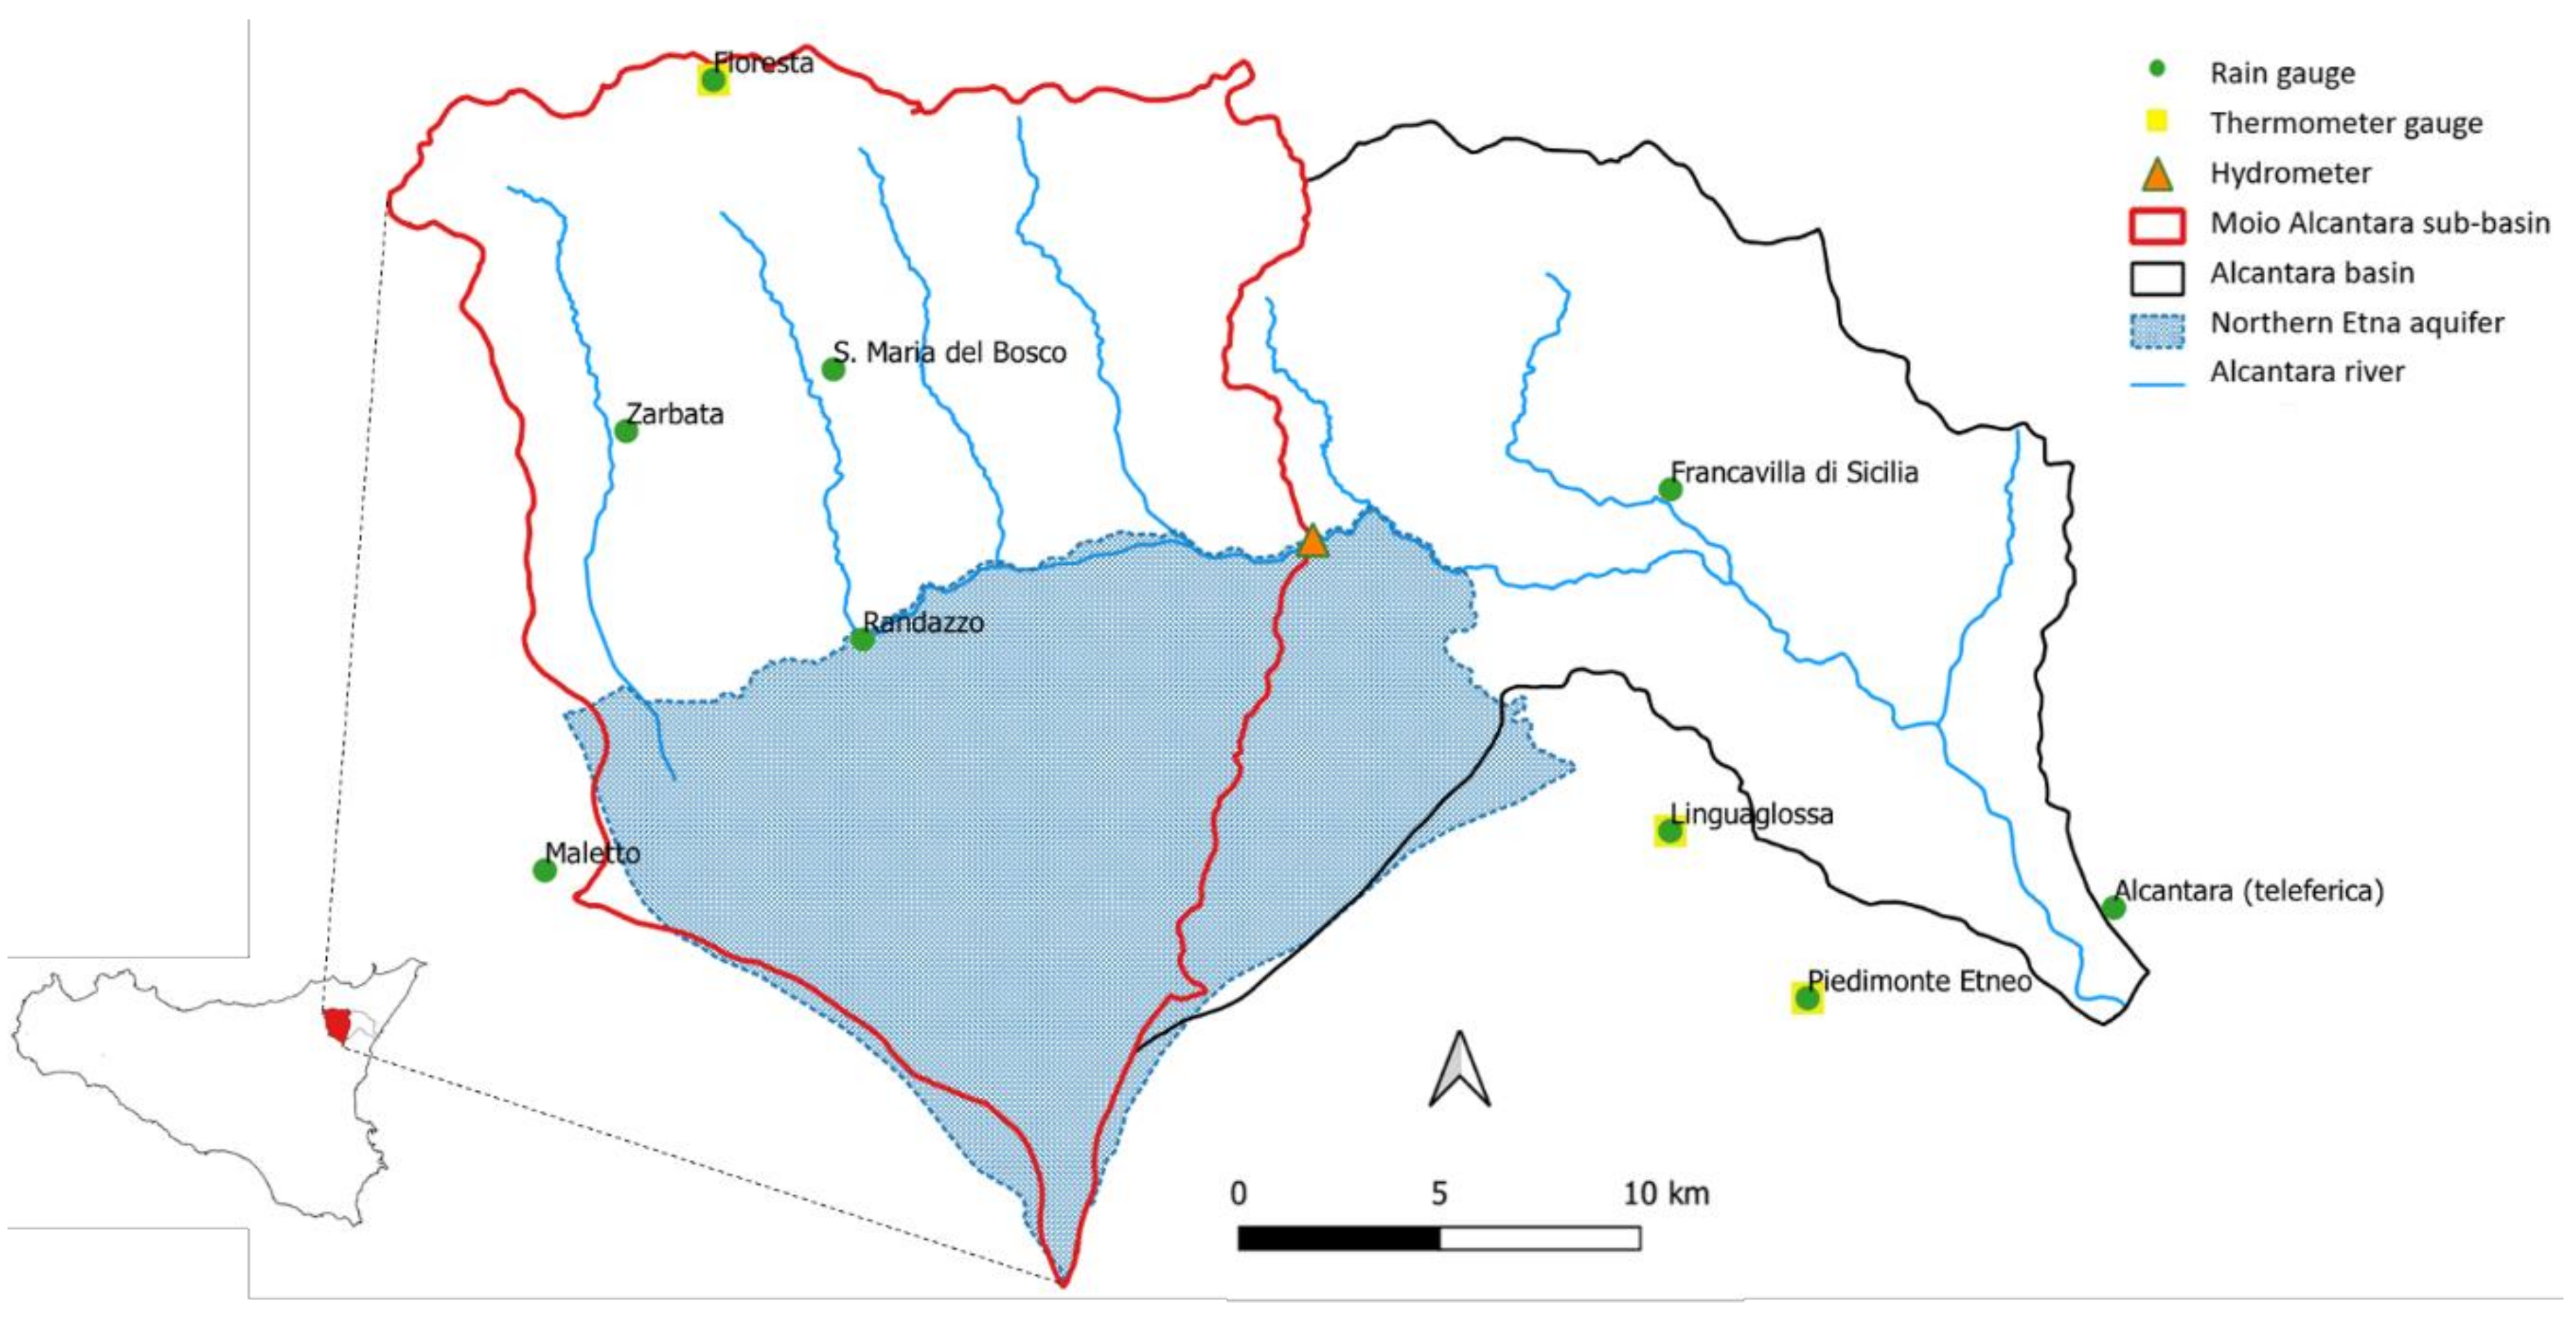
In this study, the upstream part of the Alcantara river basin, namely the Alcantara at Moio cross-section, including the most of the northern side of the hydro-geological basin of Etna Mountain, is considered as a case study (see
Figure 1). This sub-basin area has an extension of about 342 km
2 with a mean elevation of 1142 m a.s.l. The maximal elevation of this basin is 3274 m a.s.l. and the minimum one is around 510 m a.s.l. The main river length of the Alcantara river at Moio cross-section is 34.66 km and the medium river slope of this area is about 8%.
The aquifer is supplied by rainfall and snow melting through the volcanic rocks with a very high infiltration capacity characterizing the mountain area on the right-hand side of the Alcantara river. The groundwater resources of this aquifer serve municipal, agricultural, and industrial uses, as well as environmental use by feeding the middle-valley stretch of the Alcantara river through springs mixing with surface water.
The left side of the basin is characterized by sedimentary soils (heterogeneous marly clays complex with poor power water-bearing horizons in the rocky levels) where a dense hydrographic network was formed, and gives a seasonal contribution to the river flow, as it follows the rainfall annual variability typical of the Mediterranean climate.
The method proposed for the assessment of groundwater recharge is a simple parsimonious methodology based on the topography of the territory and the water balance equation. In particular, through the inverse hydrogeological balance technique, the mean annual active recharge, or effective infiltration, I of small and medium groundwater systems can be calculated from the effective rainfall Pe (i.e., gross rainfall P minus evapotranspiration ET) and the hydrogeological conditions. The latter are incorporated into the infiltration index (X), determined based on the shallow lithological characteristics, in the case of surface rocks or bare soil, or on the hydraulic characteristics of the soil. The method involves a series of steps in which the values of effective rainfall Pe, corrected temperatures Tc, actual evapotranspiration ET, surface runoff R, and effective infiltration I are calculated cell by cell in the grid. Then, a computation is carried out at the river basin scale by adding up the contributions relative to the various cells multiplied by their own area. The methodology strictly depends on the spatial resolution of the DEM grid with respect to which the territory is discretized.
The main steps of the aforementioned methodology are the following:
- 1.
Selection of pluviometric and thermometric stations within or nearby the area of interest;
- 2.
Reconstruction and homogenization of historical data series for isochronous and sufficiently long periods (e.g., 10–20 years);
- 3.
Calculation of monthly and annual mean values of rainfall and mean temperature data , for i = 1, 2, …12, collected at each station;
- 4.
Calculation of a corrected (in relation to elevation H) annual mean temperature as a function of rainfall;
- 5.
Assessment of annual mean rainfall and evapotranspiration data in each grid cell;
- 6.
Calculation of annual mean effective rainfall in each grid cell;
- 7.
Identification of the potential infiltration coefficient (X) based on the lithology of the territory;
- 8.
Calculation of active recharge I and runoff R in each grid cell;
- 9.
Calculation of the recharge I and of the runoff R for the entire area of interest.
Regarding point 5, it is known that in an equal rainfall and thermometric regime, a very important factor is represented by elevation, as the temperature decreases with increasing elevation, while rainfall tends to increase. The study of the relationships between elevation and climatic variations, carried out in numerous hydrological basins of the Mediterranean basin, suggests adopting relationships based on linear regressions between climatic variables and elevation. Once these relationships are known, it is possible to evaluate temperature and rainfall values in each cell of the grid based on the mean elevation of the cell itself provided by the available DEM.
Then, the actual evapotranspiration must be assessed. In the inverse hydrogeological balance method, the latter is traditionally calculated by using the Turc model [
48], a function of rainfall, and the evapotranspiration power of the atmosphere. More specifically, to take into account the fact that the evapotranspiration rate, with the same pedological and climatic conditions, depends on humidity rate on the ground, that is attributable to rainfall, the Turc formulation refers to the mean temperature of the air corrected for rainfall. In particular, the calculation of the correct temperature is performed for each weather station through the following expression:
where
is the mean monthly rainfall (mm) and
is the mean monthly temperature (°C) at month
i. The linear regression between correct temperature and elevation allows extending this information to all the cells in the grid. At this point, the actual evapotranspiration of each cell is calculated with the Turc formulation as:
where
L represents the atmospheric evapotranspiration power, that in the original formulation is:
Santoro (1970) proposed a specific formulation of the Turc model for Sicilian basins, hereinafter defined as the modified Turc method, where
L is calculated as:
On the other hand, recent studies [
28,
50,
51,
52,
53,
54,
55] refer to the Budyko curves, which provide an estimation of evapotranspiration as a function of rainfall and the Aridity Index, defined as the ratio between mean annual rainfall
and potential evapotranspiration
. The methodology for evapotranspiration estimation based on Budyko curves describes the theoretical energy and water limits on the catchment water balance. Catchment evapotranspiration is a complex process affected by rainfall, net radiation, leaf area, and plant available water. In the Budyko approach, it is assumed that evapotranspiration from land surfaces is controlled by water availability and atmospheric demand. The water availability can be approximated by rainfall, the atmospheric demand represents the maximum possible evapotranspiration and it is often considered as potential evapotranspiration. Under very dry conditions, potential evapotranspiration exceeds rainfall, and actual evapotranspiration equals rainfall. Under very wet conditions, water availability exceeds potential evapotranspiration, and actual evapotranspiration will asymptotically approach the potential evapotranspiration.
Several formulas have been developed under the Budyko framework. In this work, the annual mean evapotranspiration was evaluated by the following formulation [
56]:
Once the mean rainfall and the actual evapotranspiration of each cell are known, the effective rainfall is determined, such as:
The potential infiltration coefficient
X (that can assume values between 0 and 1) is estimated on the basis of the surface lithology of the hydrogeological complex, the steepness of the topographical surface, the fracture index, the karst index, the presence or absence of soil and other corrective parameters that depend on the subjection, the use of the soil, etc.
Table 1 and
Table 2 respectively indicate the potential infiltration coefficients,
XR, for bare rocks or with soil cover of less than 1 m and the infiltration coefficients,
XS, for thick soils.
Once the corresponding potential infiltration coefficient is assigned to each cell, based on the information derived by the hydrogeological map of the area in question, the mean effective infiltration (active medium recharge) is calculated at each cell such as:
in the case of bare rock, or,
in the case of soil.
The specific runoff,
R, can finally be calculated by the difference between effective rainfall and infiltration, namely:
Finally, the calculation of the annual mean active recharge and the runoff of the entire area of interest is obtained by summing the above parameters relating to each cell.
3. Preliminary Data Analysis
A total of 10 stations were identified within and nearby the Alcantara at Moio river basin (see
Table 3). These stations belong to the hydrometeorological network operated by the Sicilian Water Observatory, whose data are available at the following link:
http://www.osservatorioacque.it/.
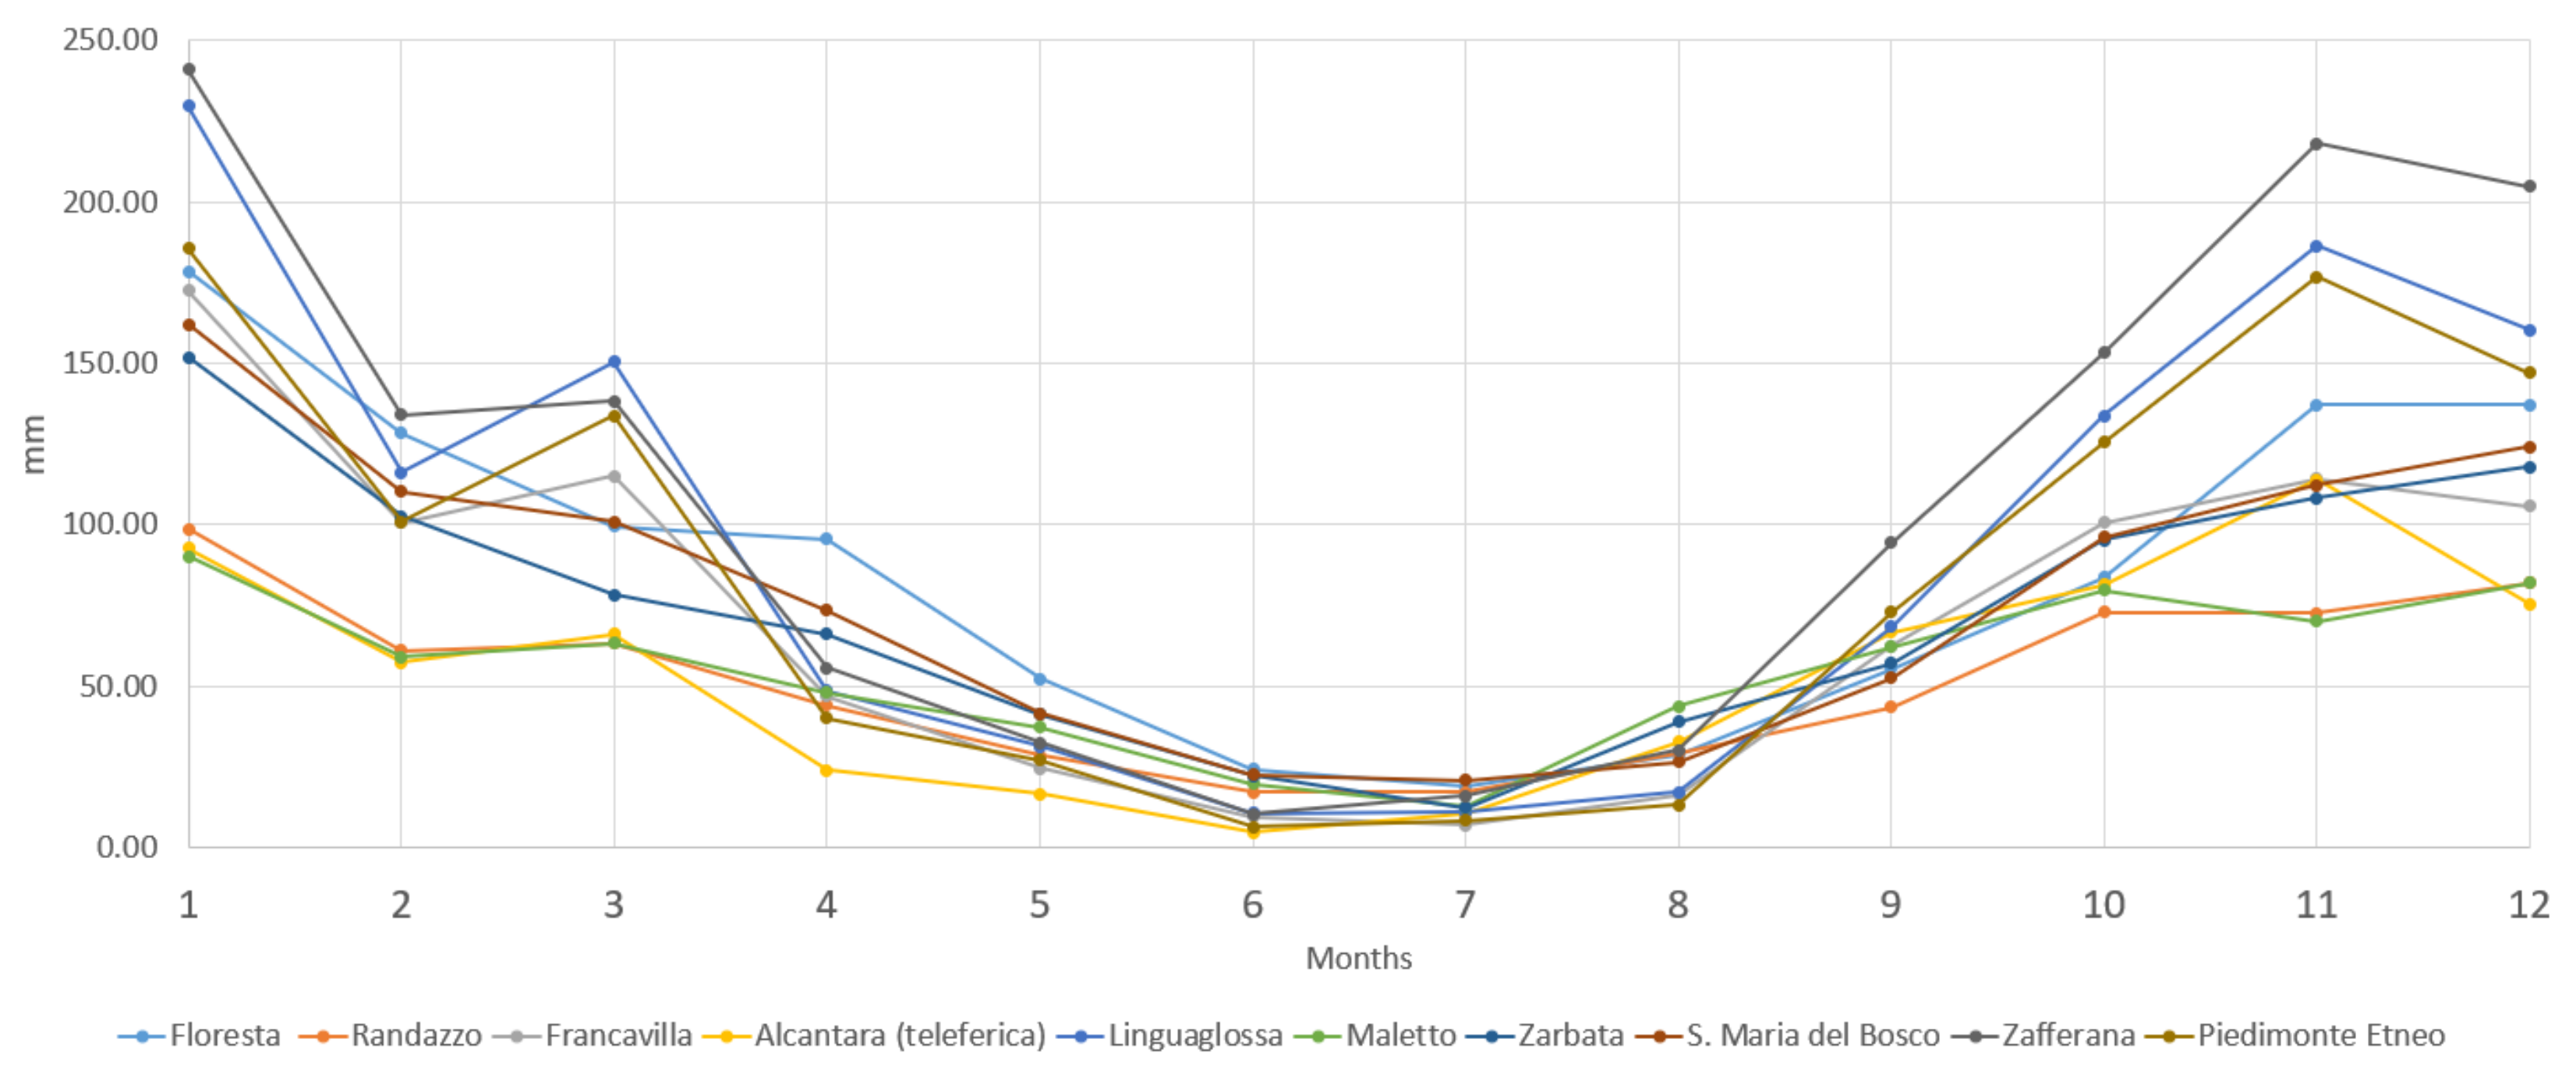
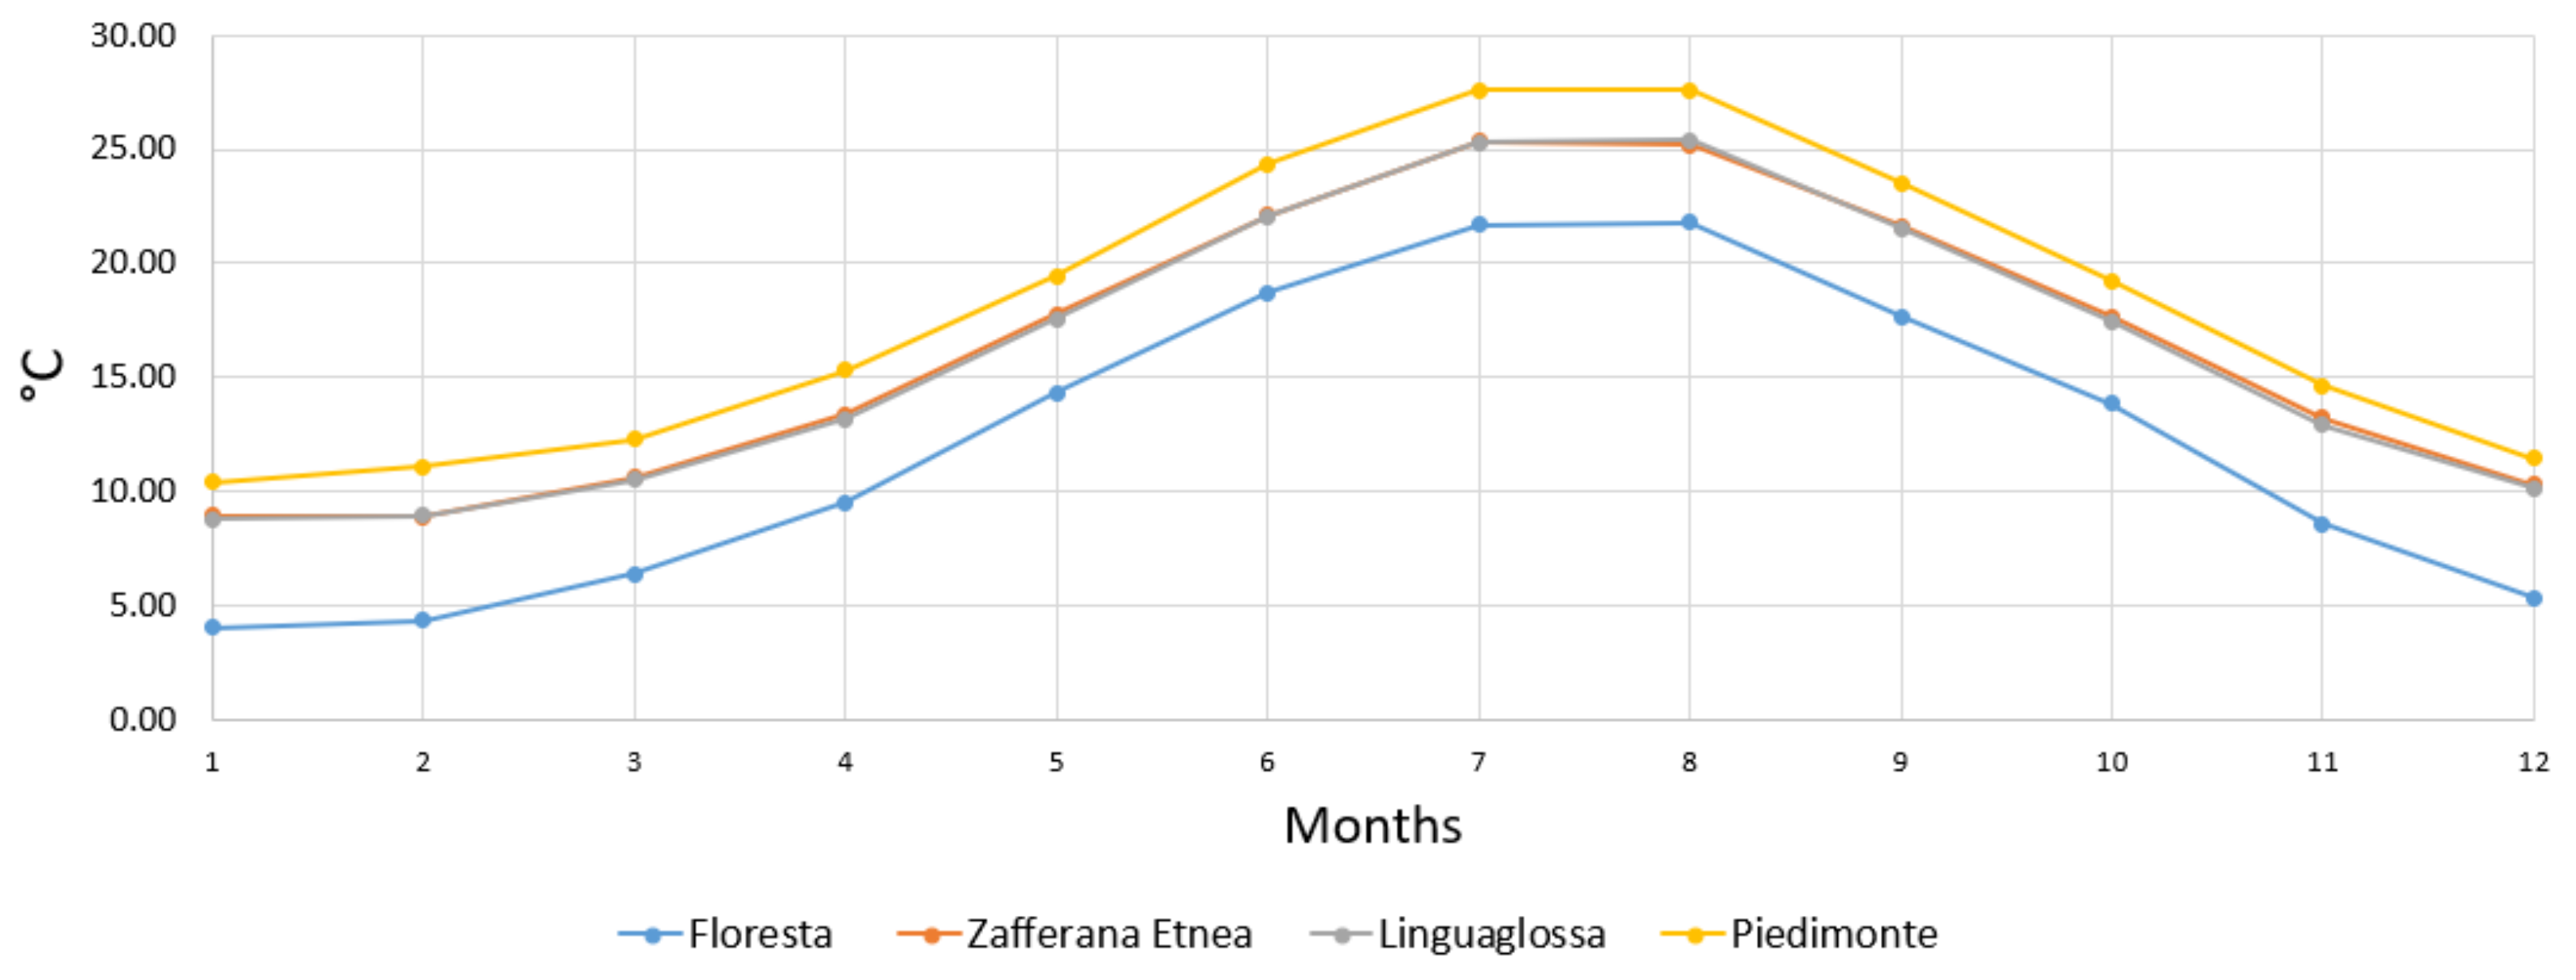
The application of the method involves the use of isochronous rainfall and temperature, and possibly flow rate, measurements for about 10–20 years. In this study, the period between 1981 and 2000 was chosen as the reference period. For each of these stations, the monthly and inter-annual mean values of the rainfall (
Table 4) and mean temperature (
Table 5) data were, therefore, calculated. Monthly means are reported in
Figure 2 and
Figure 3.
As described in
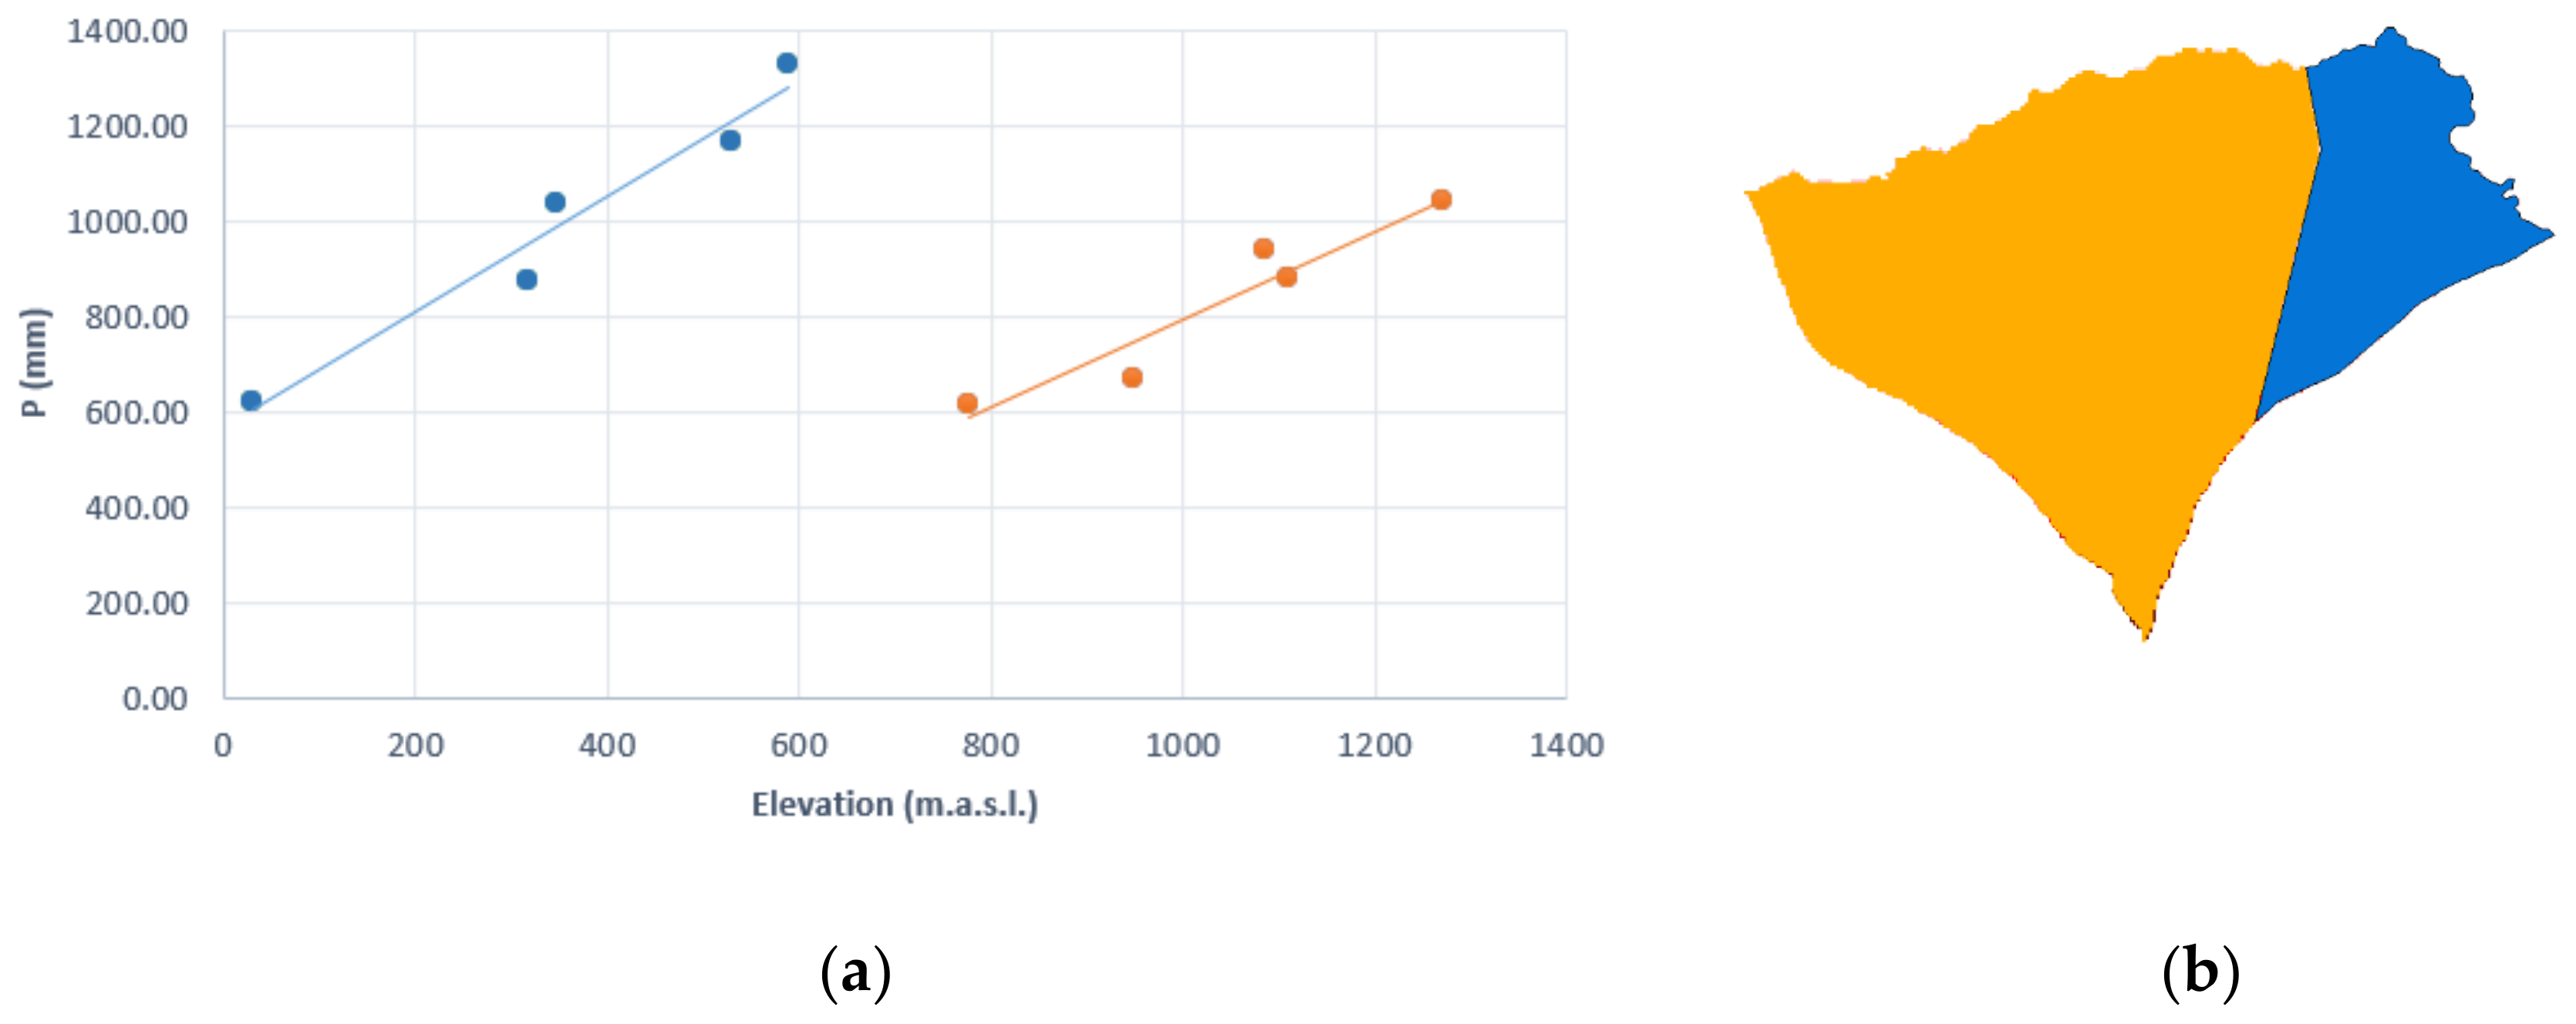
Section 2, following the main steps of the inverse hydrogeological balance method, the relationship between rainfall and elevation was investigated, finding two main sub-areas that follow different patterns in the relationship between rainfall and elevation. These relationships can be described from the two linear regressions in
Figure 4a respectively from Equations (10) (for the sub-area A, in orange in
Figure 4a,b) and (11) (for the sub-area B, in blue in
Figure 4a,b) where
P represents rainfall and H elevation.
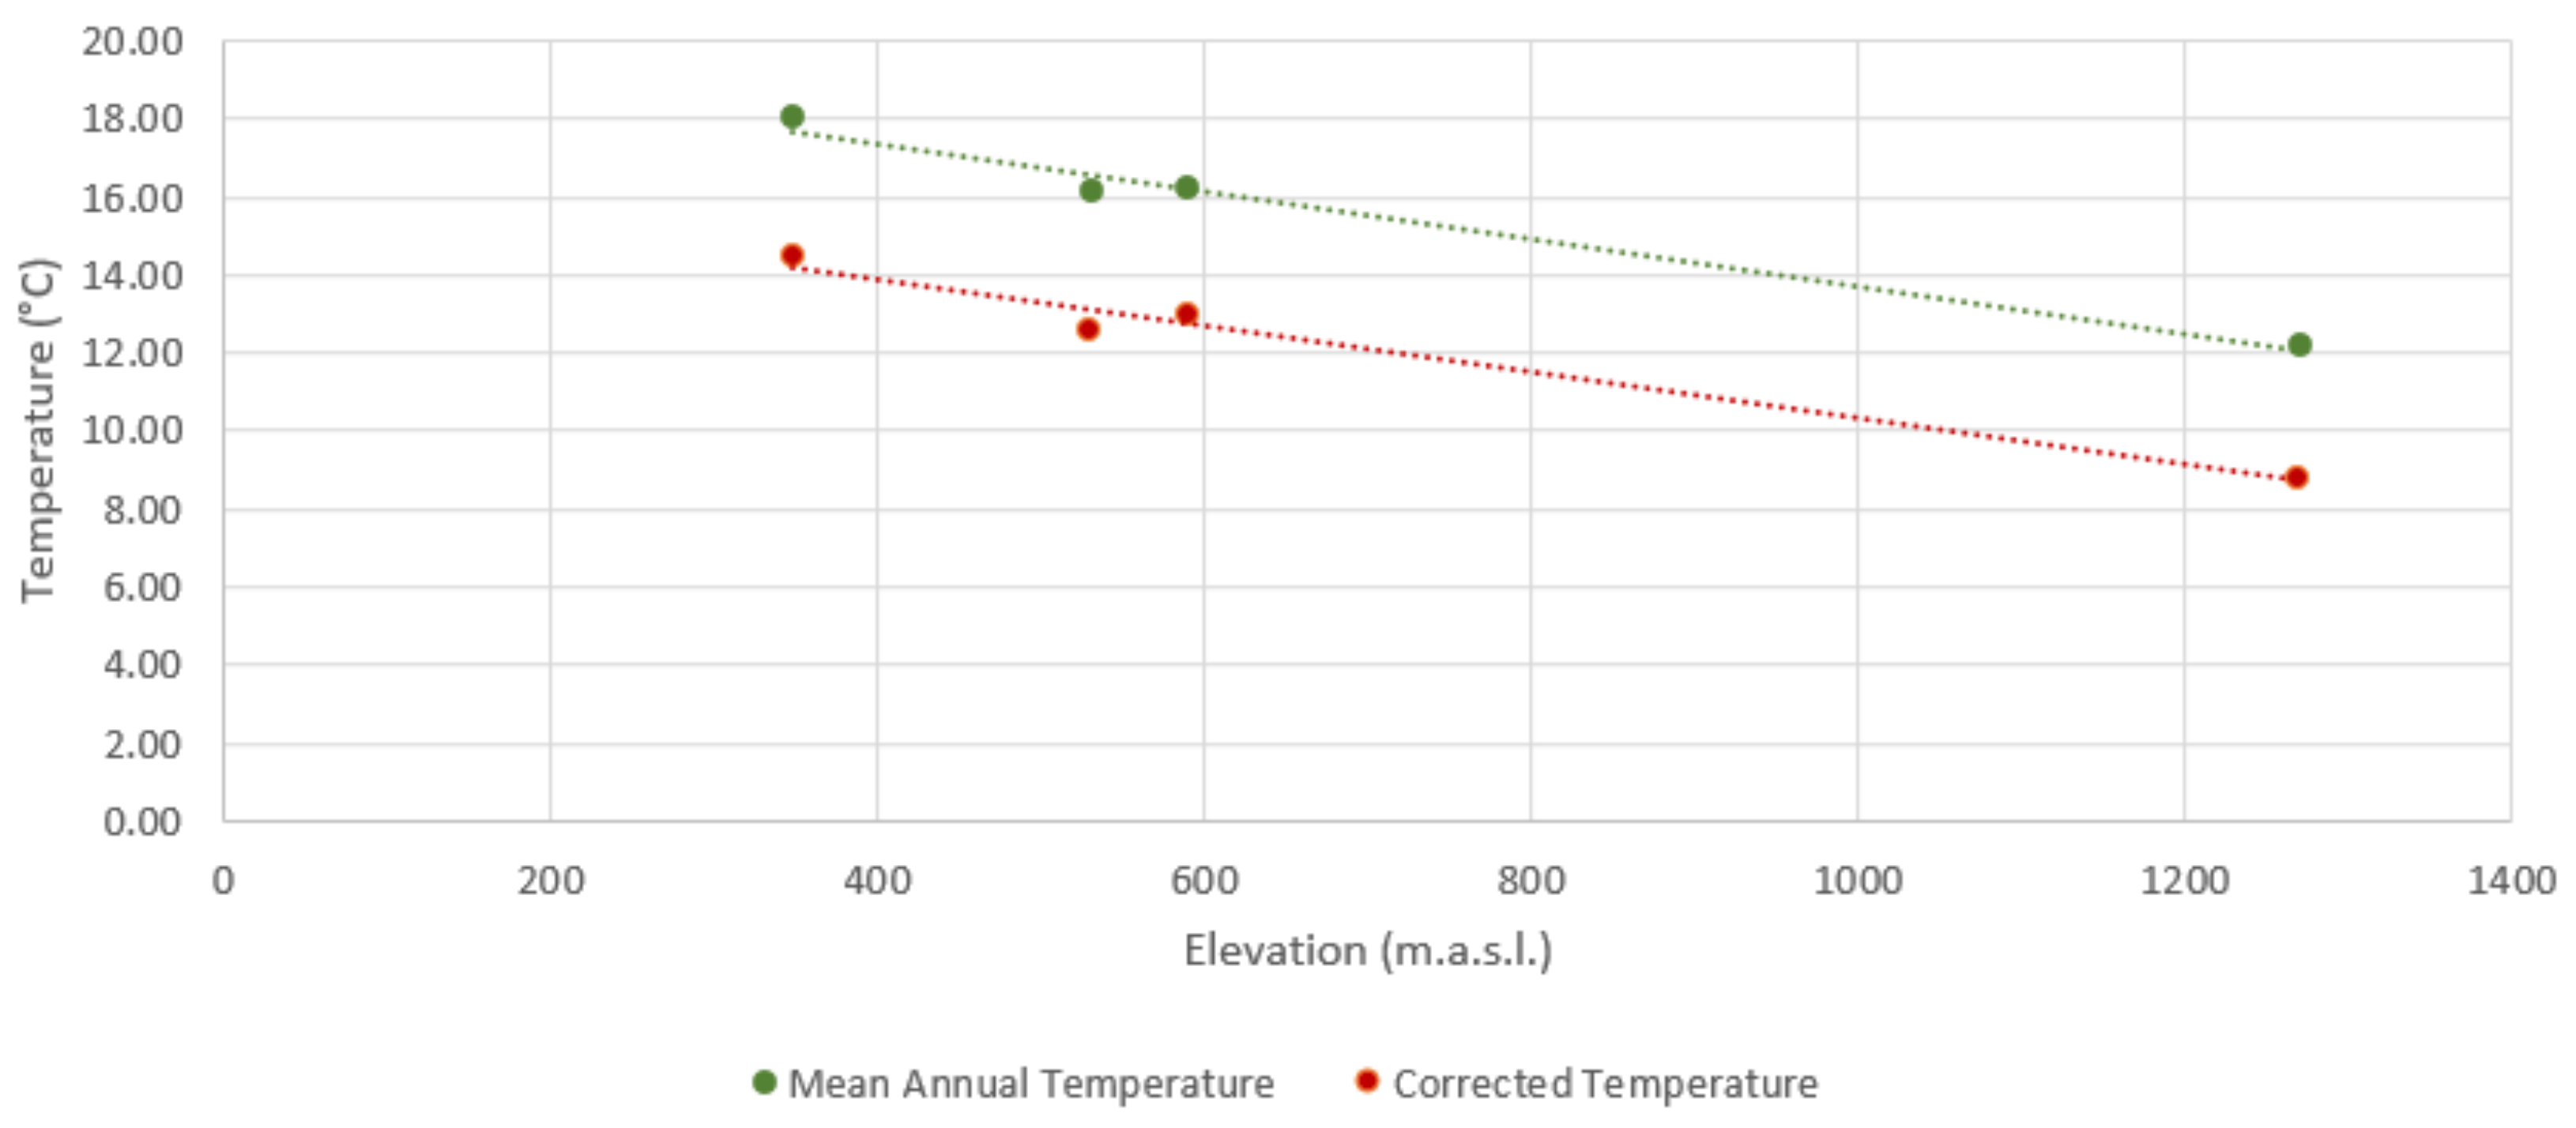
Similarly, after calculating the corrected temperature with Equation (1) for each thermometric station (see
Table 6), two linear regressions were detected respectively between mean annual temperature and elevation (Equation (12) and
Figure 5 in green) and between corrected temperature and elevation (Equation (13) and
Figure 5 in red). The latter has been used in the main steps of the methodology.
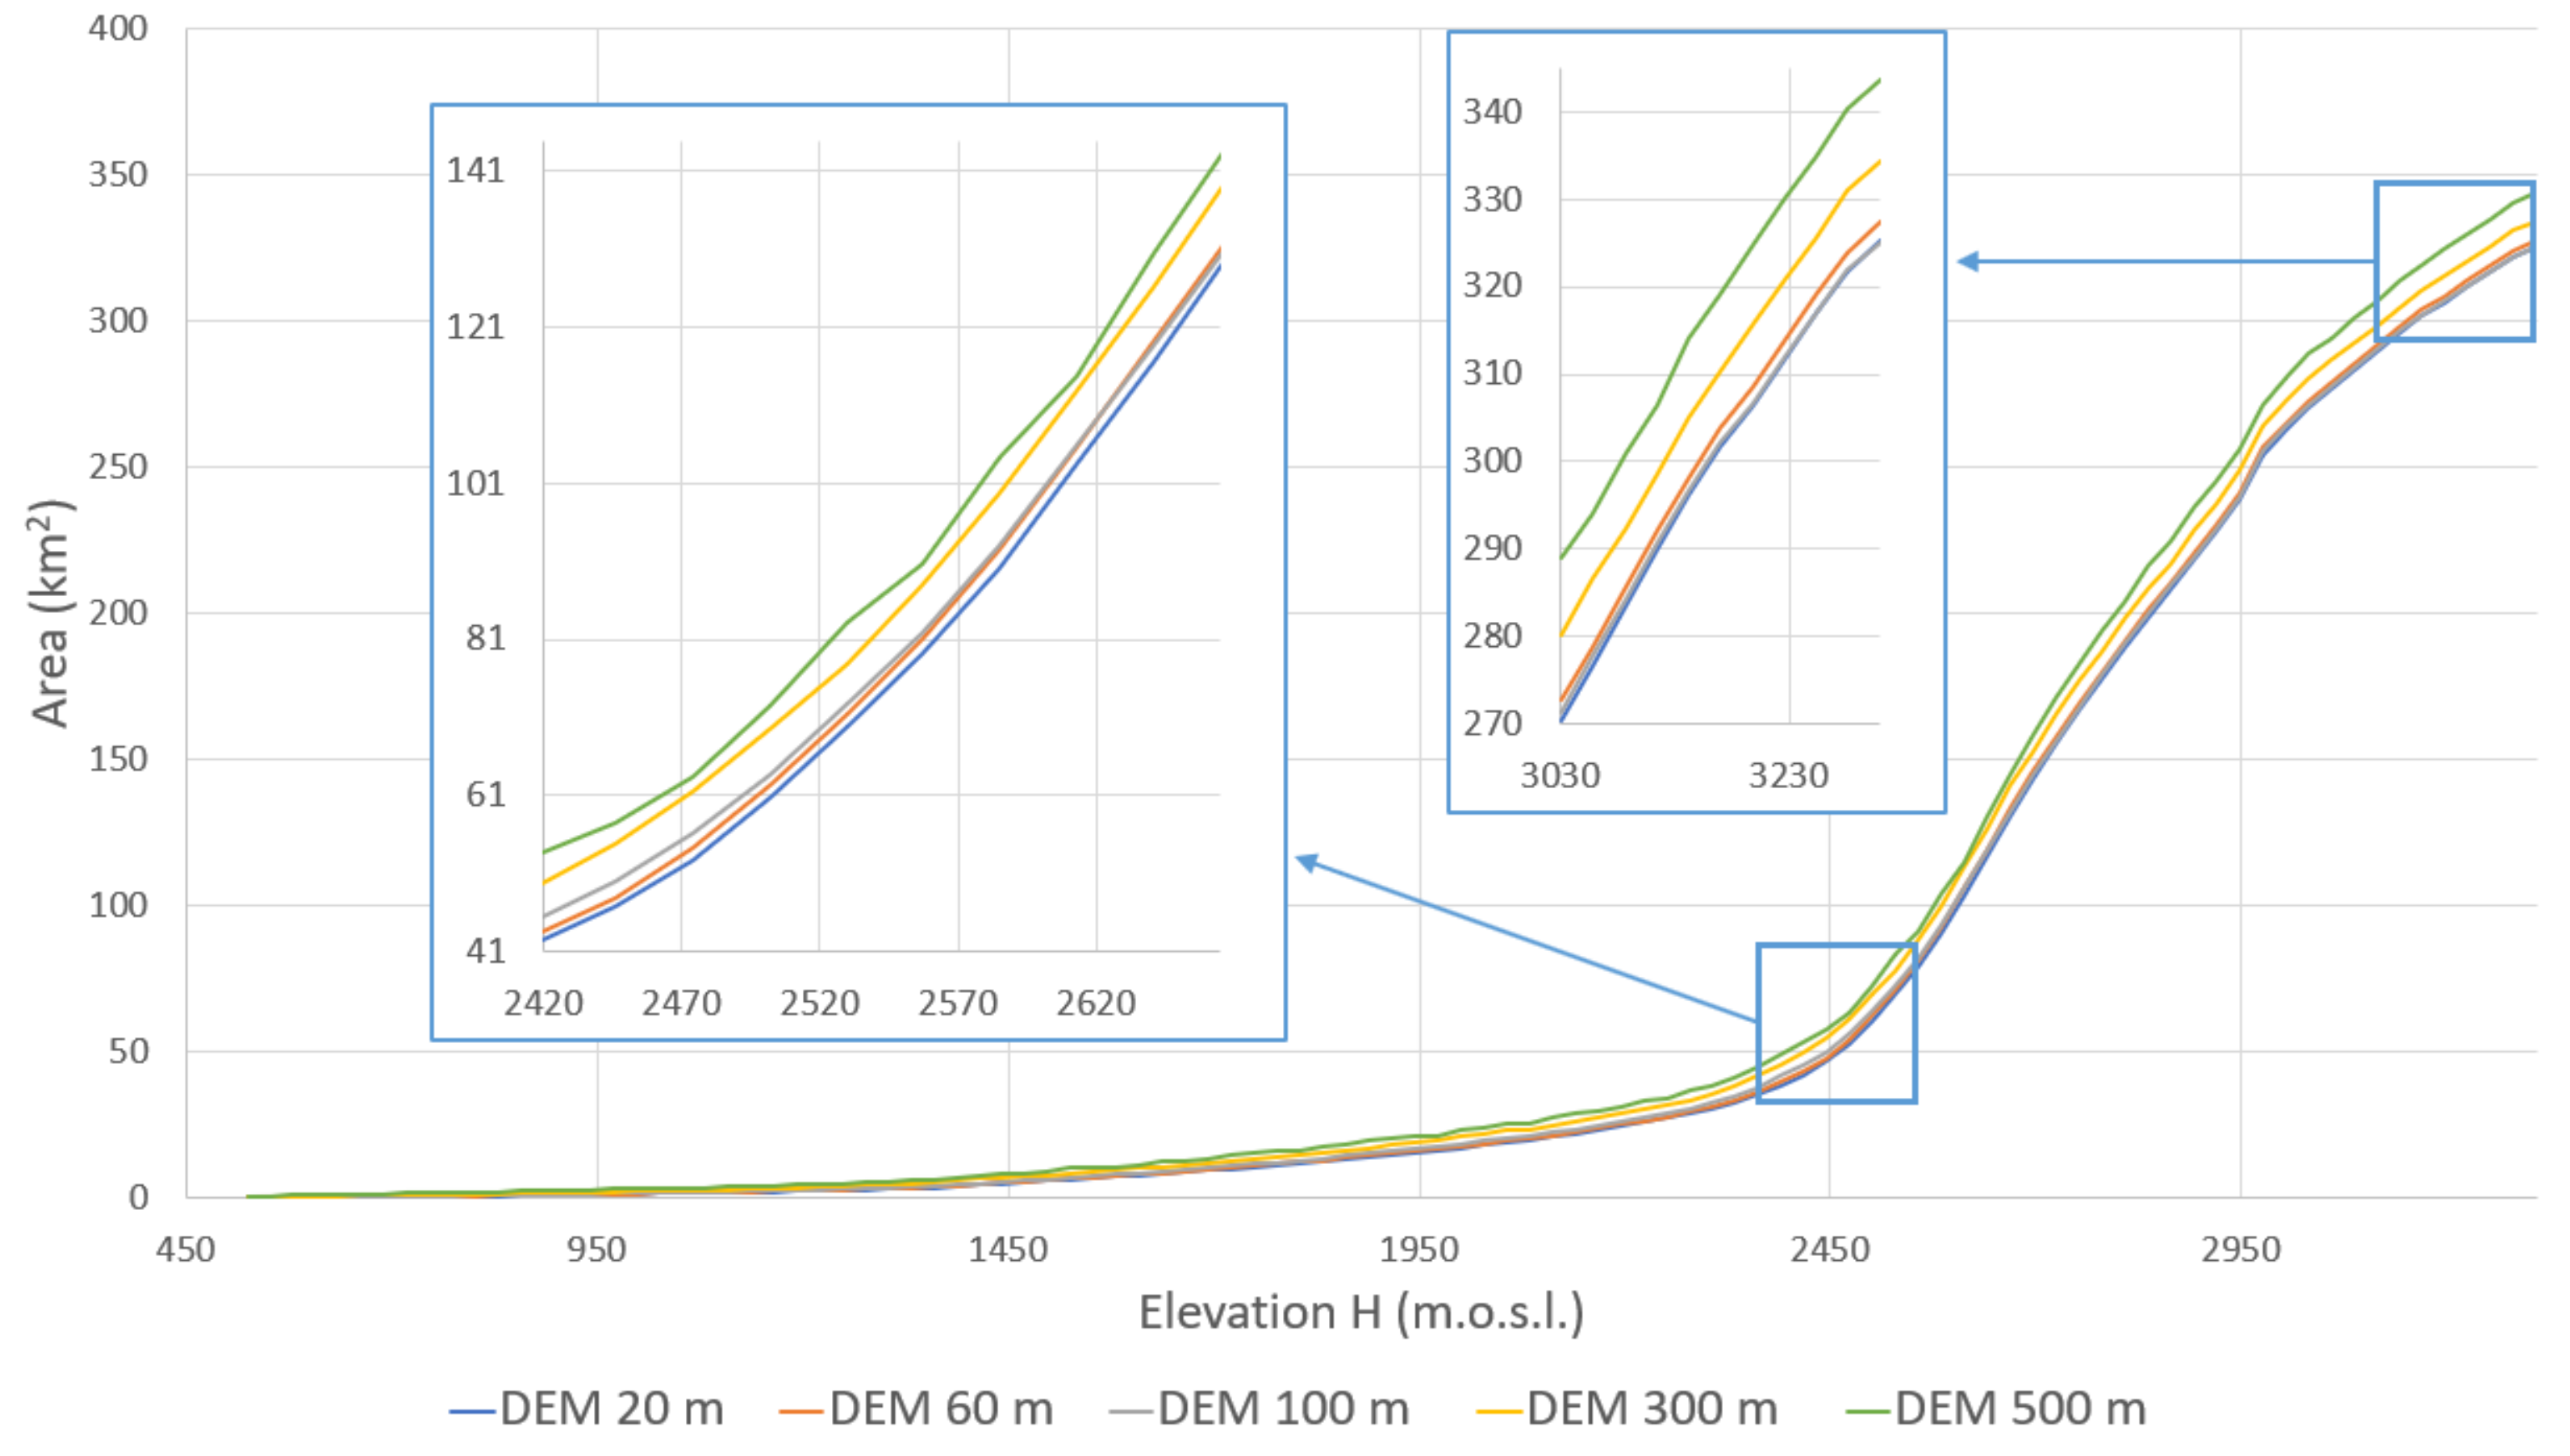
Once again, since the proposed method relies on numerical computations carried out in a GIS environment, its results are strongly related to the underlying DEM representing the topography of the area under examination. In the present study, DEM resolutions at 20, 60, 100, 300 and 500 m are considered in the application of the inverse hydrogeological balance for the estimation of the groundwater resources. In
Figure 6 the hypsometric curves derived from the considered DEM at different resolutions are shown. As expected, differences among the different DEMs become more evident for the steepest slope part of the river basin. For this reason, the need arises to define the optimal spatial resolution for the correct evaluation of the available water resources. In what follows, the calculation of groundwater recharge was, therefore, carried out for different DEM spatial resolution and the evapotranspiration models mentioned above.
4. Model Validation
In general, the proposed method is validated by comparing modeled versus observed data of spring discharges [
58]. For this study area, observed data from the groundwater system (i.e., spring discharges, water withdrawals, or other kinds of leakage) are not currently available for comparison with the estimated values obtained by the inverse hydrogeological balance method. Thus, to verify the reliability of the model outputs, an alternative method was adopted, based on the comparison of the surface runoff rates estimated by the different applications of the model and those observed in a specific river section equipped with a hydrometer. In particular, the streamflow series observed at the hydrometric station at Moio Alcantara cross-section were used for this purpose.
The Alcantara River is a perennial river in its middle-valley part, where it is fed by groundwater springs from the hydrogeological basin. In the upstream part, on the other hand, the Alcantara river is subject to a strong seasonal variability in its flow, being fed in large part by surface water.
Flow measurements at the Alcantara at Moio station were taken as the reference point, as it is particularly representative of the area under study. It is located upstream of the natural springs (resurgences), consequently, it is mainly interested by surface flow. Furthermore, as reported in the Water Protection Plan (PTA) [
59], the basin above the Moio-Alcantara cross-section is not affected by derivations from the watercourse.
For a reliable verification, it is essential that the hydrometric series are isochronous to the rainfall and temperature data, collected for the period 1981–2000. Unfortunately, the record at Moio station over the considered time period is not continuous, as the data are available for only 13 years out of 20. The aforementioned Water Protection Plan (PTA) reports estimated data for the missing years.
The mean daily flow rate from historical series (13 years out of 20) at this station was equal to 2.013 m
3/s, and the mean daily flow rate including the estimated data was instead equal to 2.305 m
3/s. Therefore, it was decided to compare the latter value to the surface runoff
R assessed by the different runs of the inverse hydrogeological balance method. In
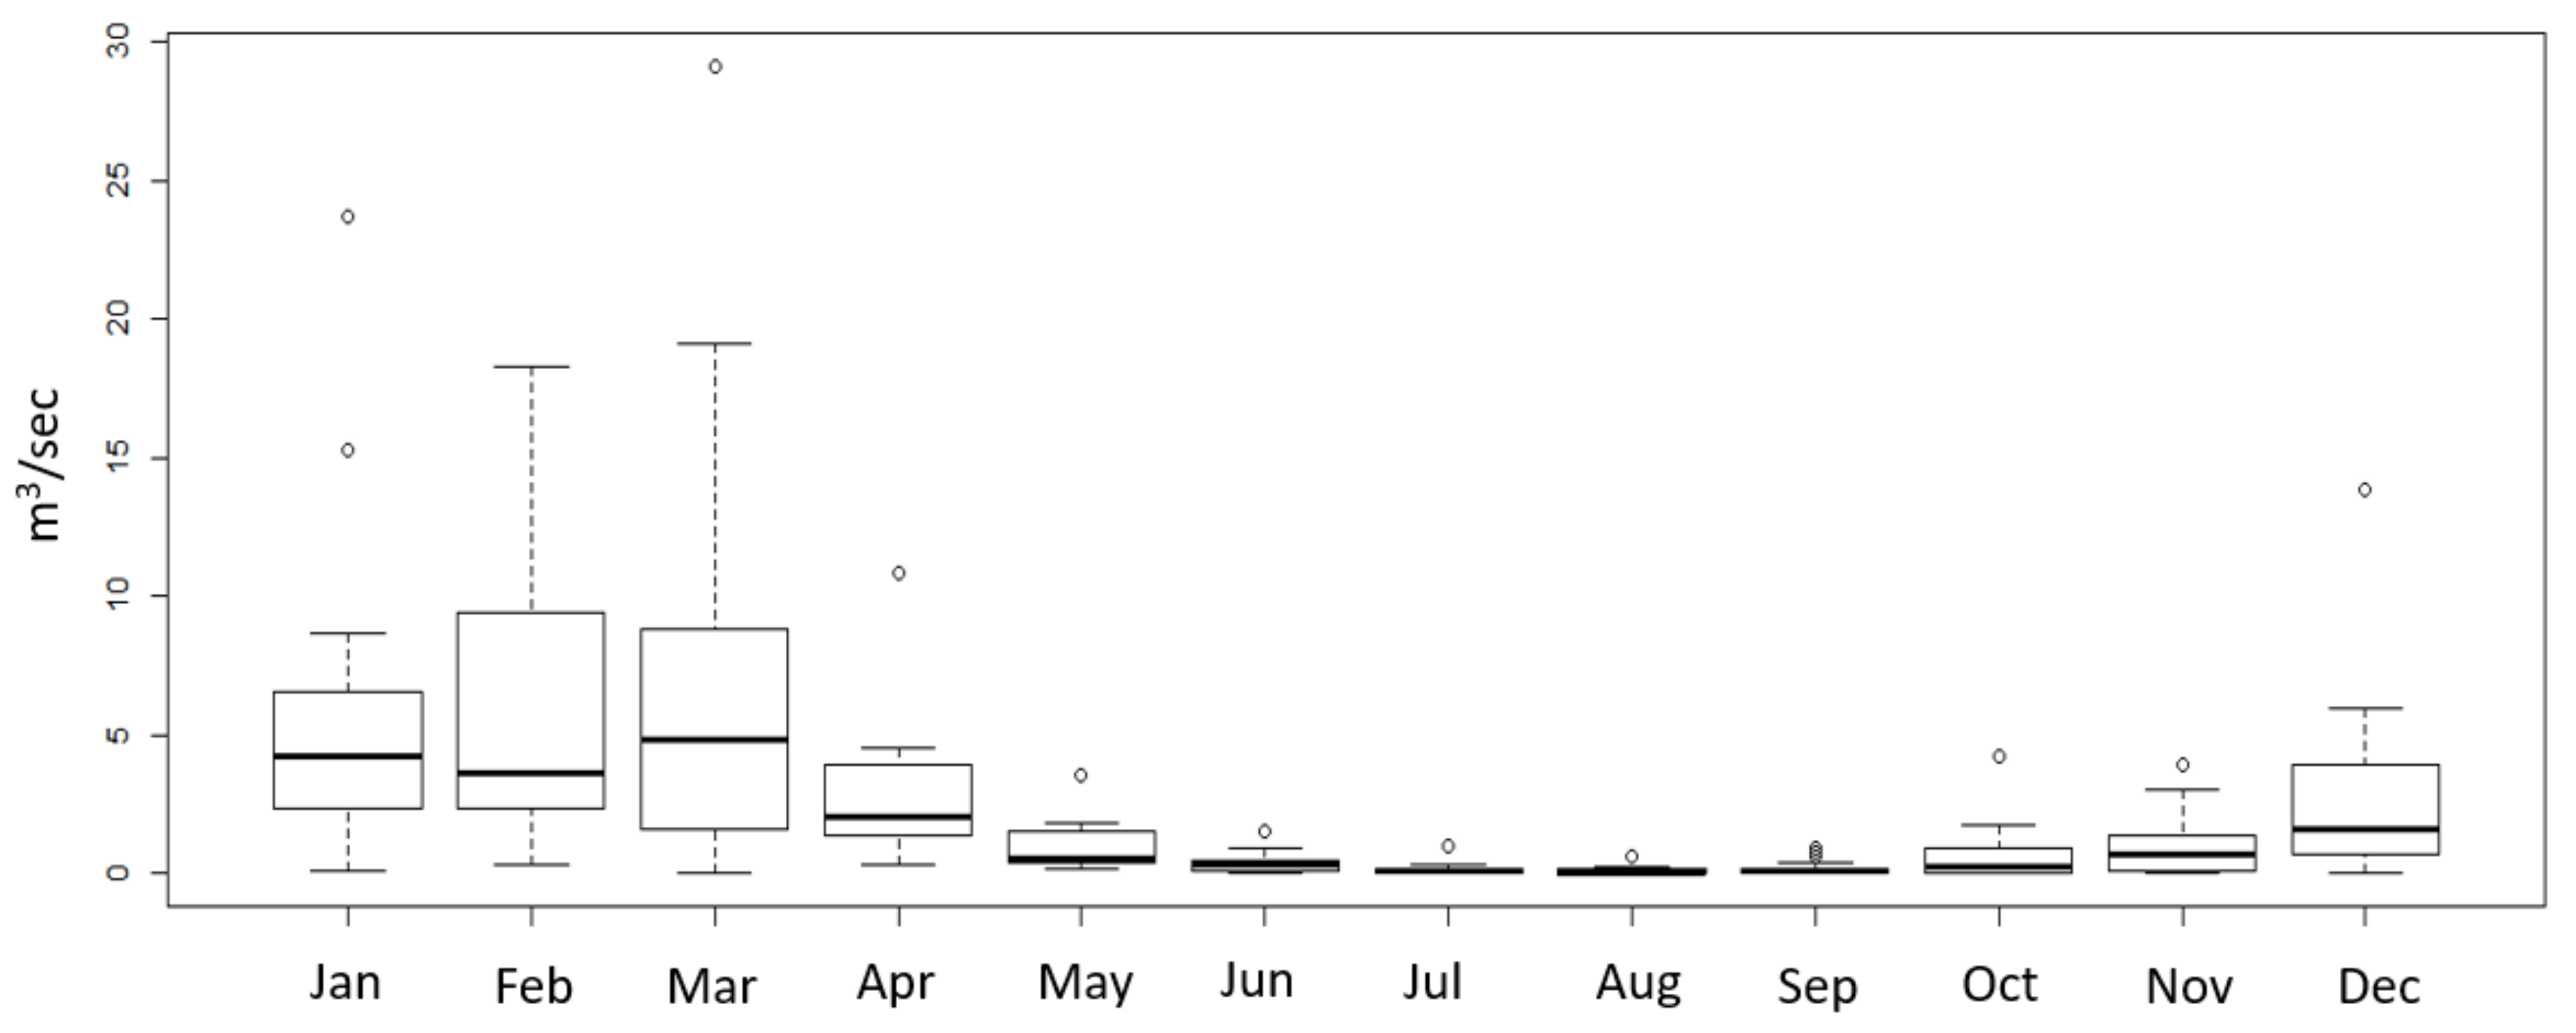
Table 7 some statistics of the streamflow data are listed, while
Figure 7 illustrates the variability of monthly streamflow data using box-plots.
In particular, the inverse hydrogeological balance method was applied separately to the right and left-hand-side of the Alcantara at Moio river basin. The sum of the surface runoff coming from both the left and right-hand-side was compared to streamflow data at Moio Alcantara gauged hydrometric station and a relative error was estimated to simply identify the DEM resolution providing the most reliable results in terms of long-term water balance estimation.
5. Results and Discussion
The results of the inverse hydrogeological balance technique are illustrated in
Table 8,
Table 9 and
Table 10, where the evapotranspiration was estimated with the original Turc formula, the modified Turc formula, and by applying the Budyko equation, respectively. The relative error (in percentage) with respect to the streamflow data recorded at Moio cross-section is also reported. In addition,
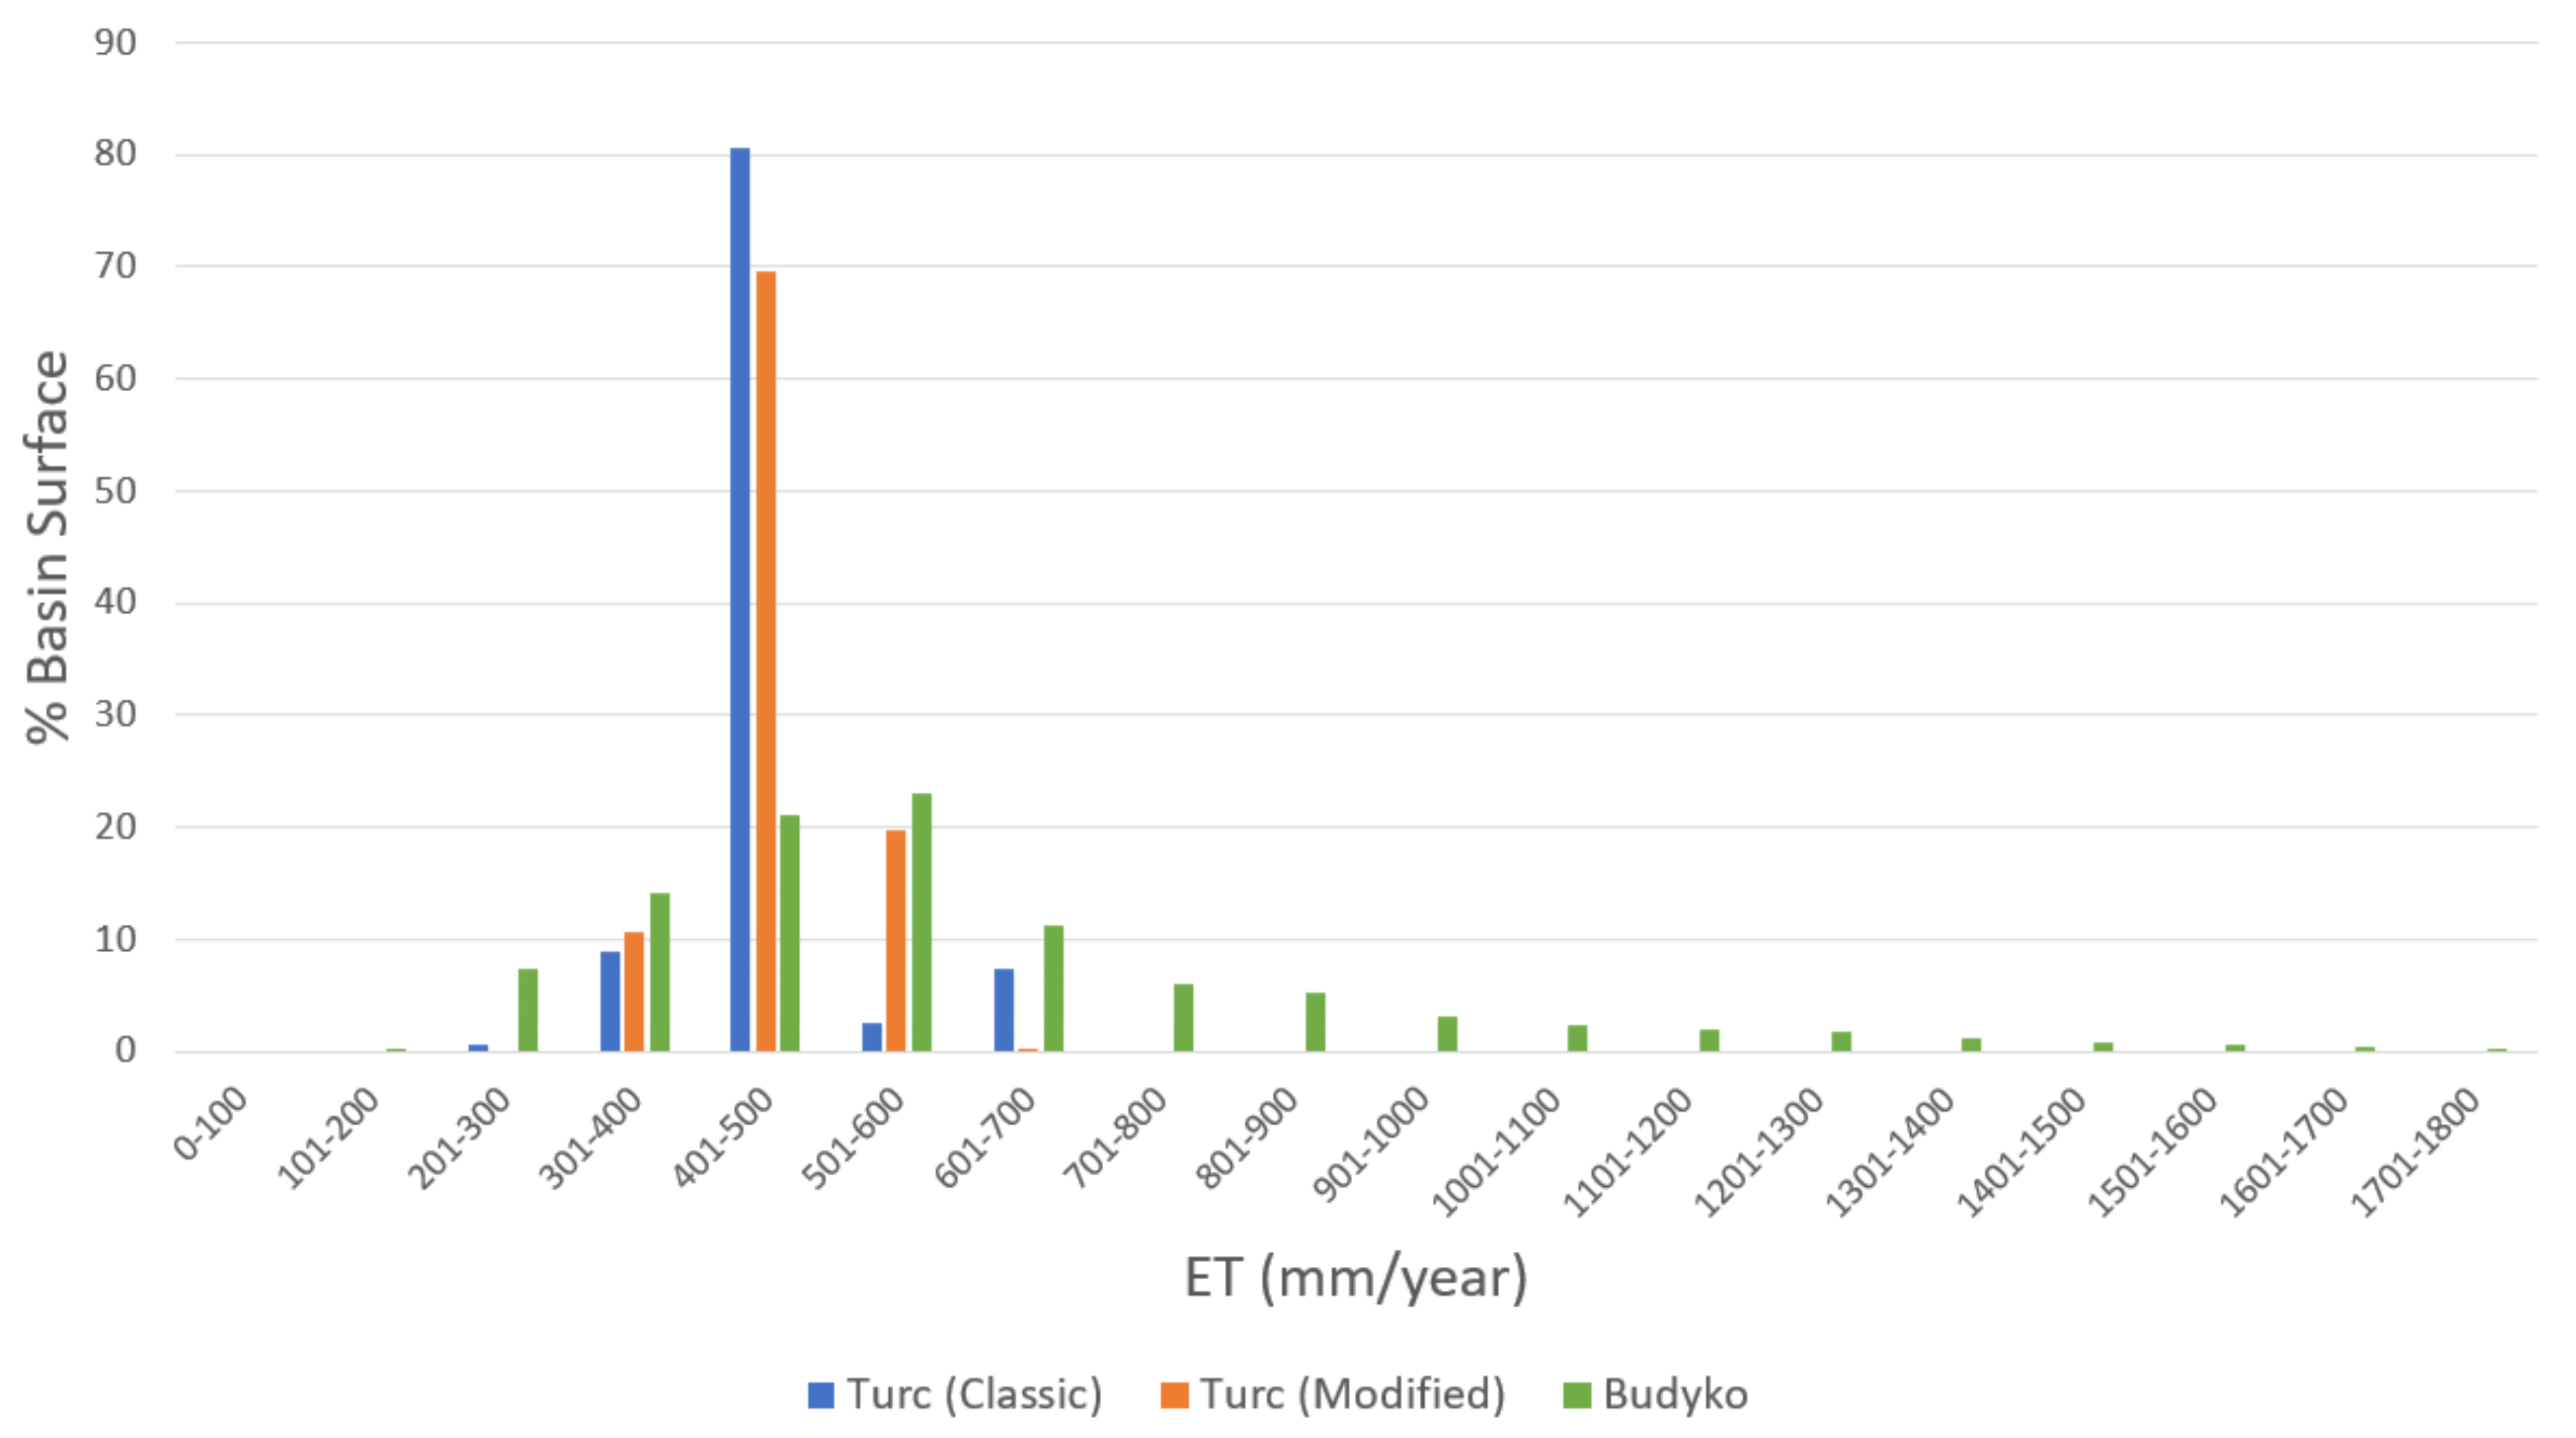
Figure 8 shows the spatial distribution of evapotranspiration values ET evaluated with the three approaches previously described.
As regards the influence of the resolution of the DEM on the estimation of the groundwater resources, the use of the DEM at 60 m led to the lowest value of the relative error.
As every single grid cell of the DEM takes the mean value of the whole square discretized area as elevation value, in principle, finer resolutions lead to a higher level of accuracy in water balance estimation. This is confirmed by the fact that moving from the coarser DEM resolution of 500 m, to the higher resolutions (300, 100 and 60 m), the relative error tends to reduce. However, unexpectedly, increasing the grid resolution up to 20 m leads to an increasing relative error. Similar results have been detected also by Lopez-Vicente et al. [
60], who studied the influence of DEM on hydrological simulations in crop areas. In their study they proposed an optimal DEM resolution to improve their hydrological modeling in woody crops areas, finding out that higher DEM resolutions introduced bias in the input data and the computations. This bias can be explained by the fact that when very high DEM resolution is considered, other factors, neglected before, come into play, introducing further uncertainty in the model results.
Concerning the influence of the calculation method of the actual evapotranspiration on the model, the model implementing the Budyko formulation turns out to be the most reliable. Conversely, it can be observed that the modified Turc formulation, specific for Sicilian basins, does not fit this case study more than the original Turc formulation. This is explained by the fact that the original Turc formulation is mostly applied to catchments with humid climates, as in the considered case study, while the modified formulation finds application mostly on catchments with arid and semi-arid climates. Furthermore, it can be observed that the Budyko formulation gives to ET a larger spectrum of values than the other formulations. The other ones, in fact, provide a narrow range of values, losing this way precious information on the elevation that can make differences in water balance assessment, especially in areas characterized by a complex topography.
6. Conclusions
In this work, a simple inverse hydrogeological balance model was applied to the case study of Moio-Alcantara sub-basin, including the Northern Etna groundwater aquifer. This methodology was chosen, in line with the hydrological parsimony philosophy, because of its simplicity and requires few input data. In addition, recent research comparing parsimonious and complex models indicates that the former can facilitate insight and comprehension, improve accuracy and predictive capacity, and increase efficiency [
61].
The sensitivity of the proposed methodology to DEM resolution and evapotranspiration assessment methods was investigated in depth. Results were validated against isochronous recorded data of river discharge at Moio Alcantara cross-section, showing that the inverse hydrogeological balance method performs better when a DEM with grid cell size of 60 m and the Budyko model for estimating evapotranspiration are applied, leading to the lowest value of the relative error between observed and simulated streamflow values (i.e., less than 0.6%).
Concerning the evapotranspiration assessment, it was observed that both the classical and modified Turc formulations provided rather homogeneous results in terms of evapotranspiration values over the basin. In particular, yearly evapotranspiration values between 401 and 500 mm were attributed to the 80% and the 70% of the basin, respectively, for the classical and modified Turc formulation. On the other hand, Budyko’s results reflect a wider range of values.
We can conclude that the two aforementioned Turc formulations lead to a lack of spatial details with respect to the Budyko model that, in turn, seems more suitable for spatial distributed hydrological modeling.
This outcome adds a useful piece of information to the state-of-the-art knowledge about the hydrologic response of the analyzed river basin, supporting future studies on this water resources system.
Last but not least, the presented methodology represents a straightforward technique that allows water managers to understand the status of the water resources in the system and to regulate withdrawals accordingly. Further investigations are underway also to apply the inverse hydrogeological methodology at the monthly time scale, in order to include the influence of seasonality on the model performance and to extend the application of the methodology to other basins.
