AIN-Based MEMS (Micro-Electro-Mechanical System) Hydrophone Sensors for IoT Water Leakage Detection System


Abstract
1. Introduction
2. MEMS Hydrophone Device Structure and Fabrication
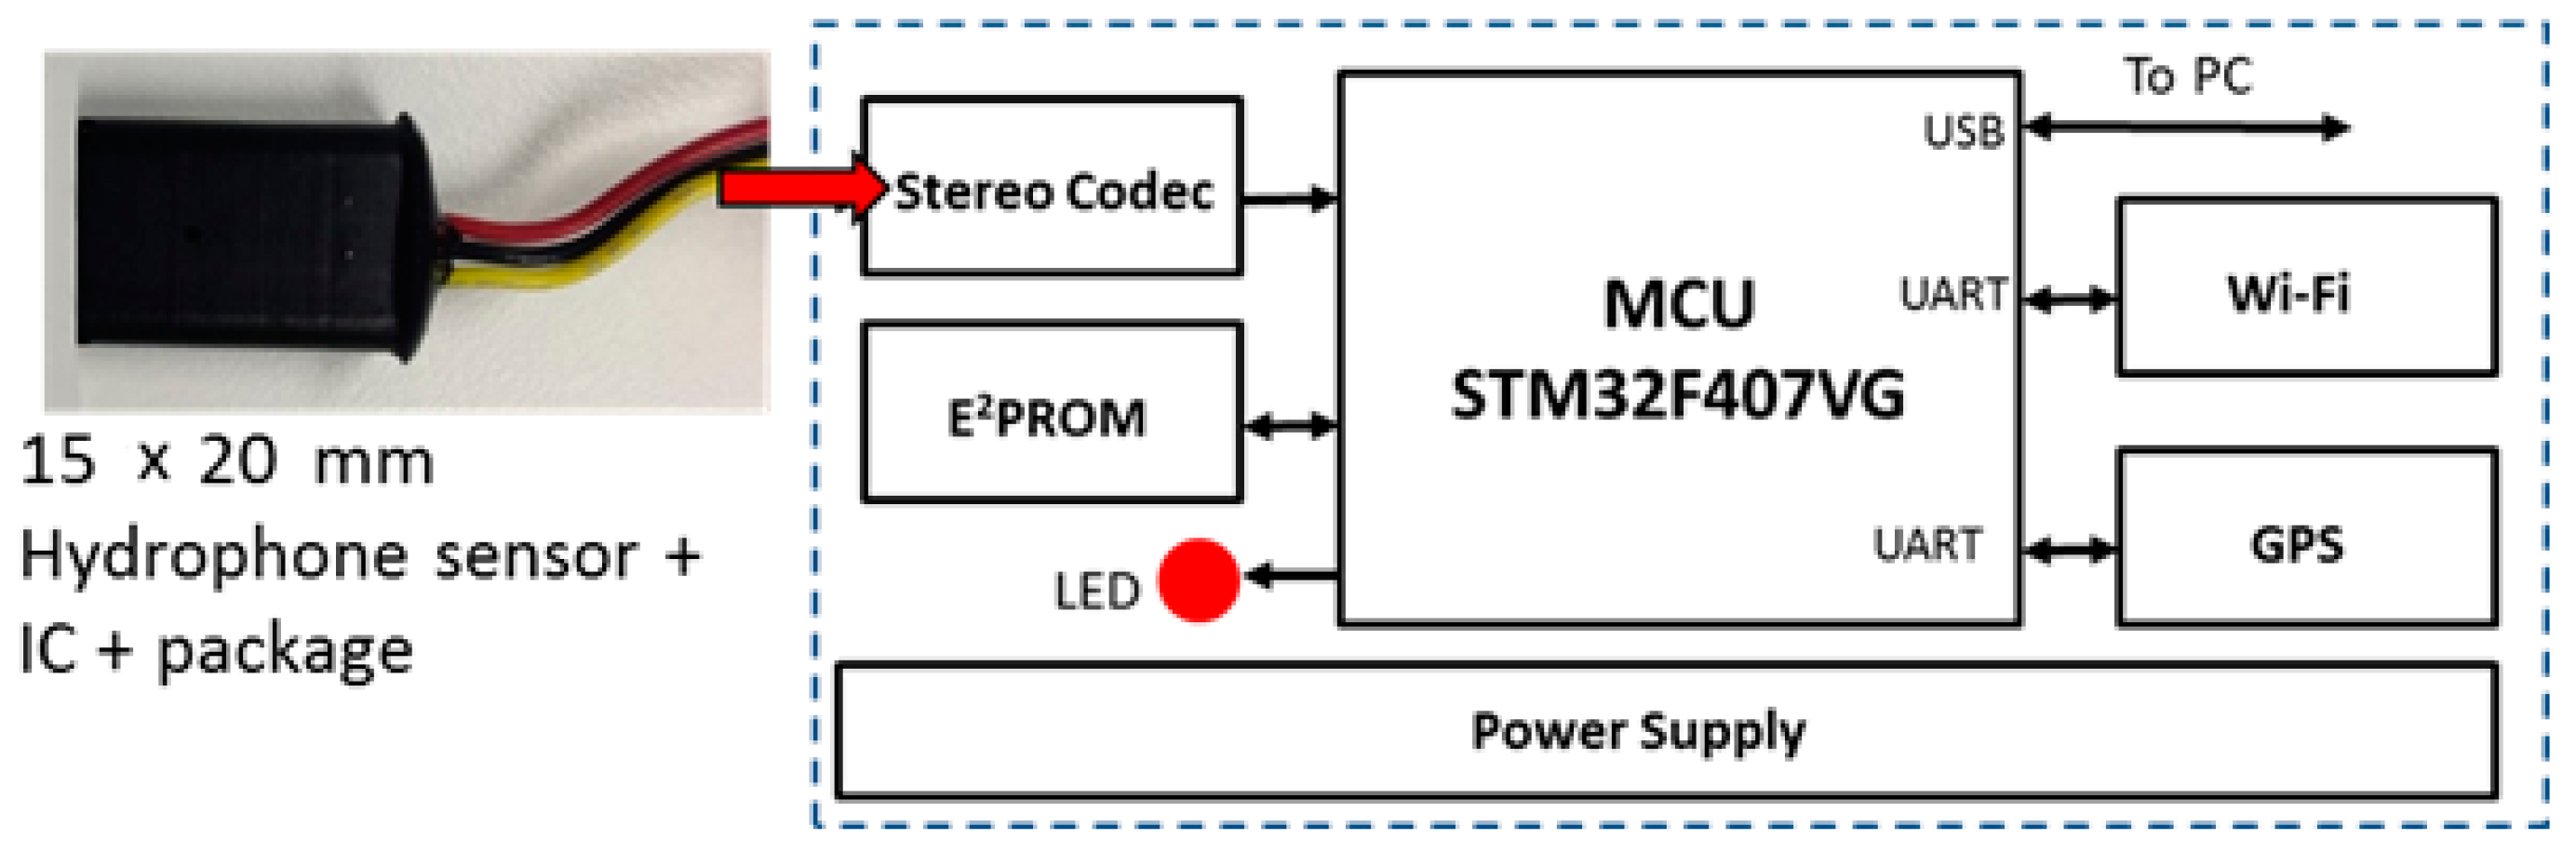
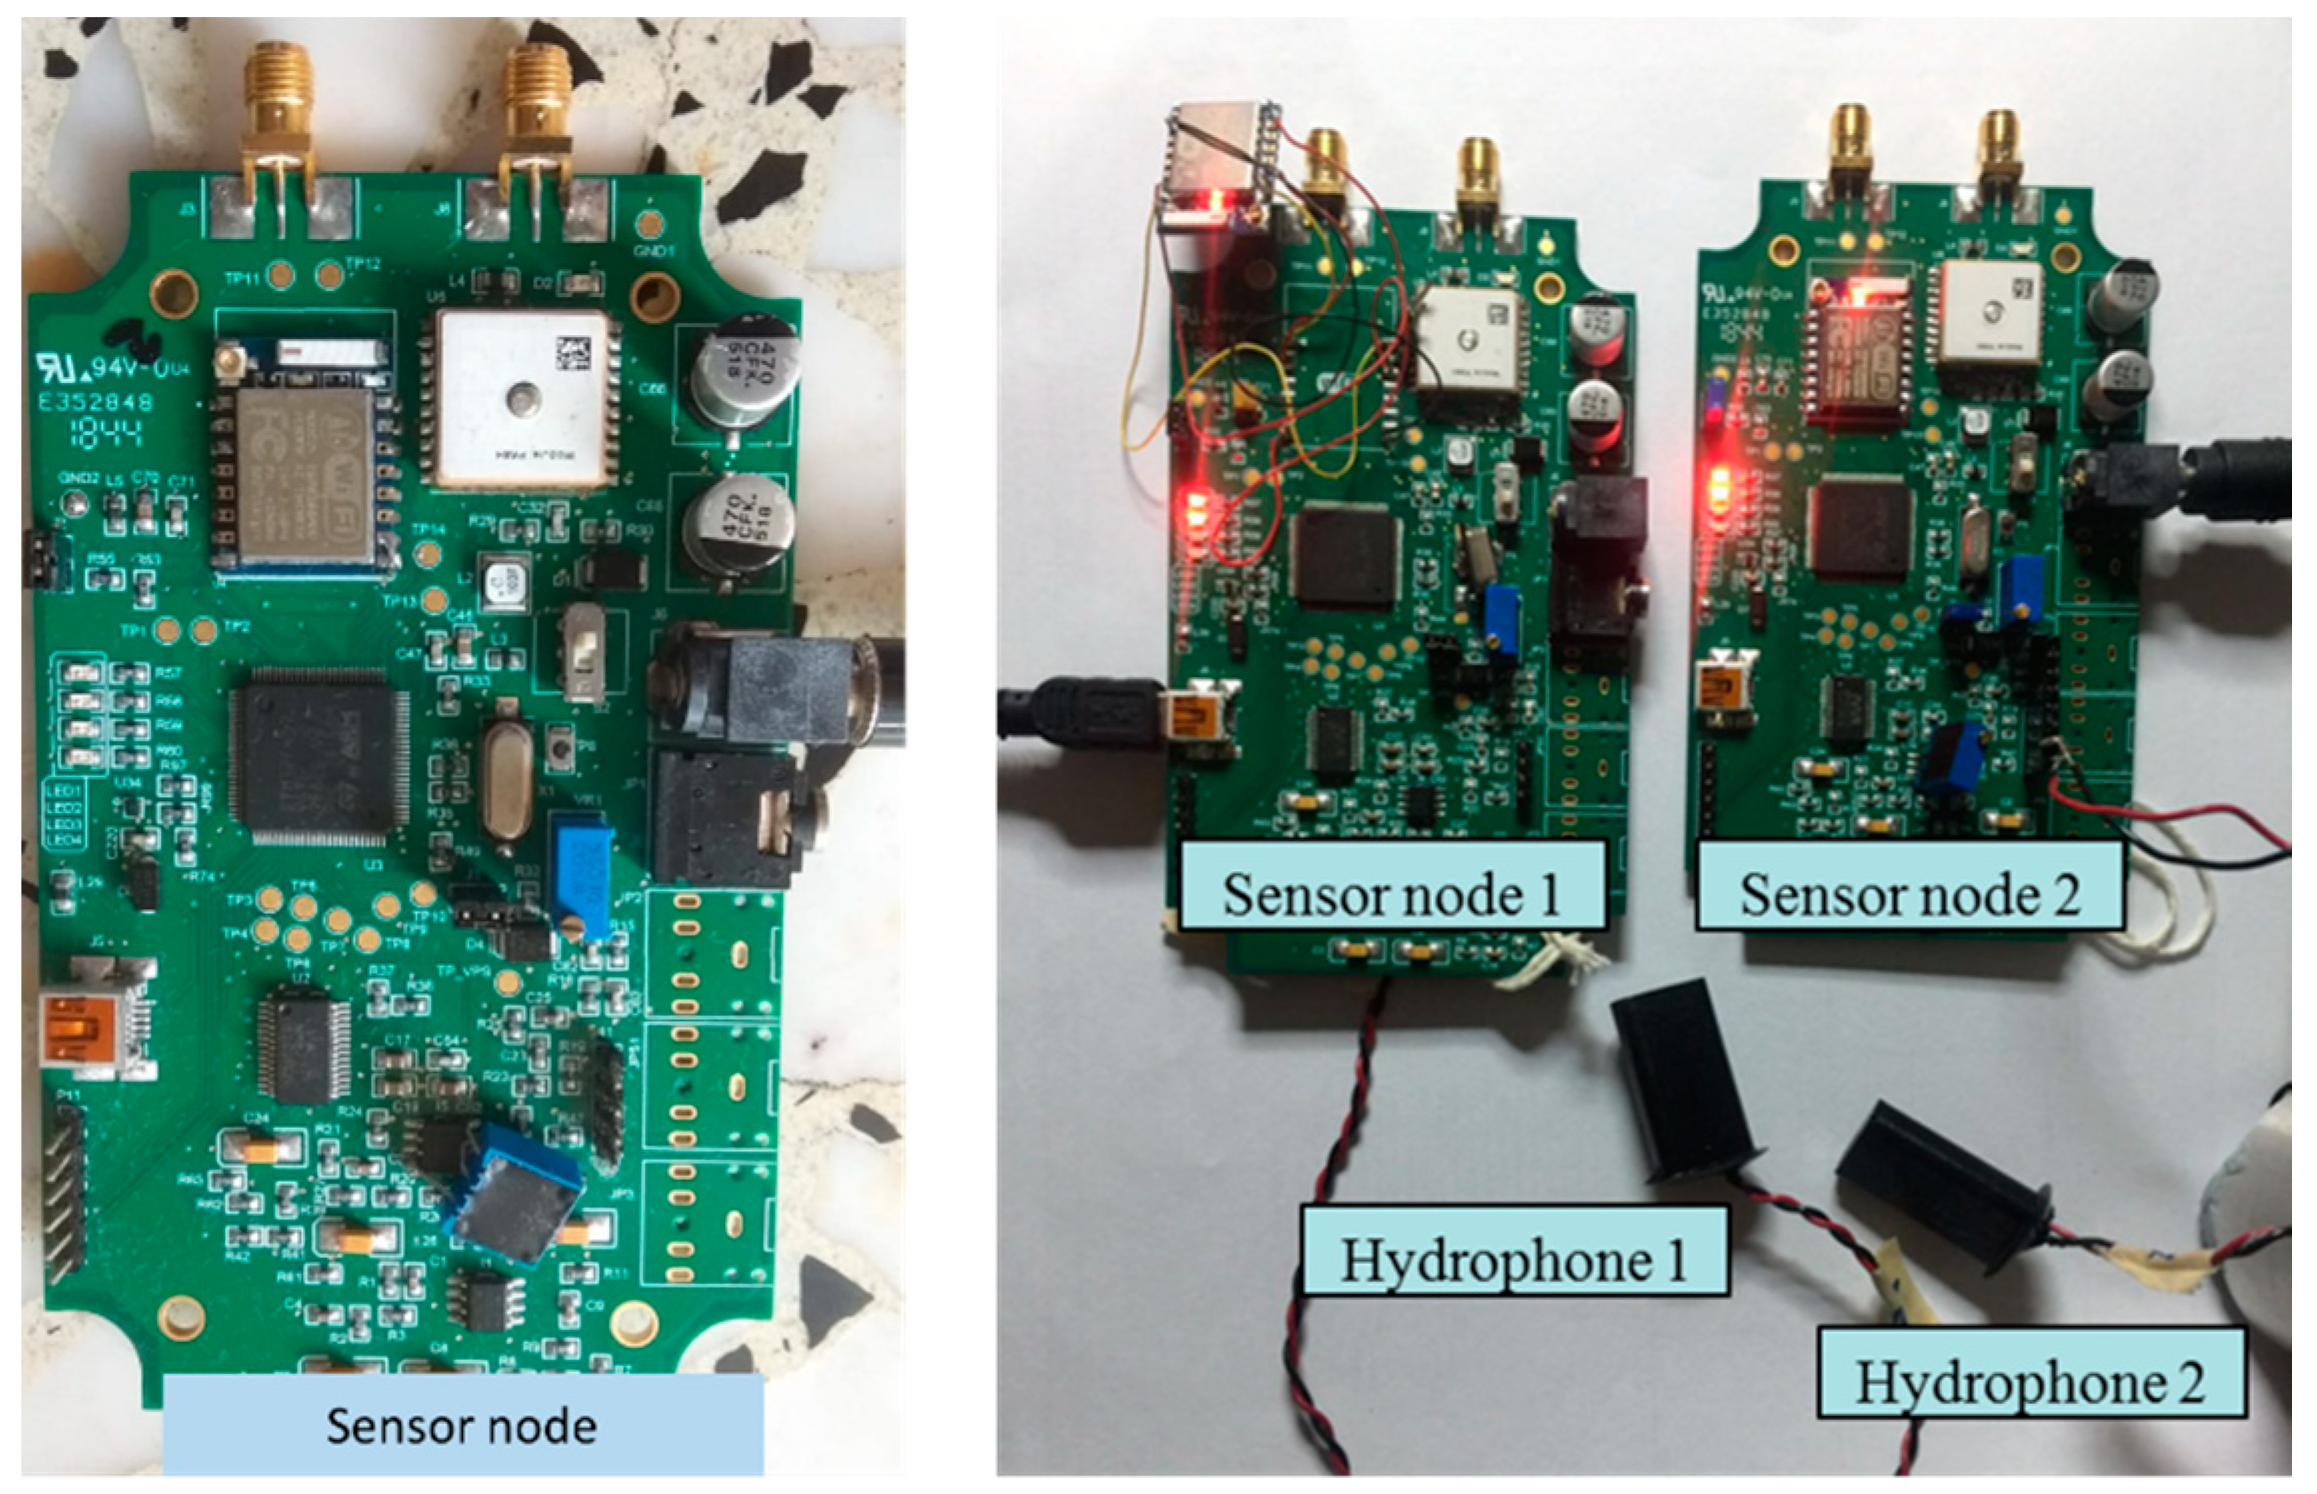
3. IoT Sensor Node Platform for Water Leakage Detection
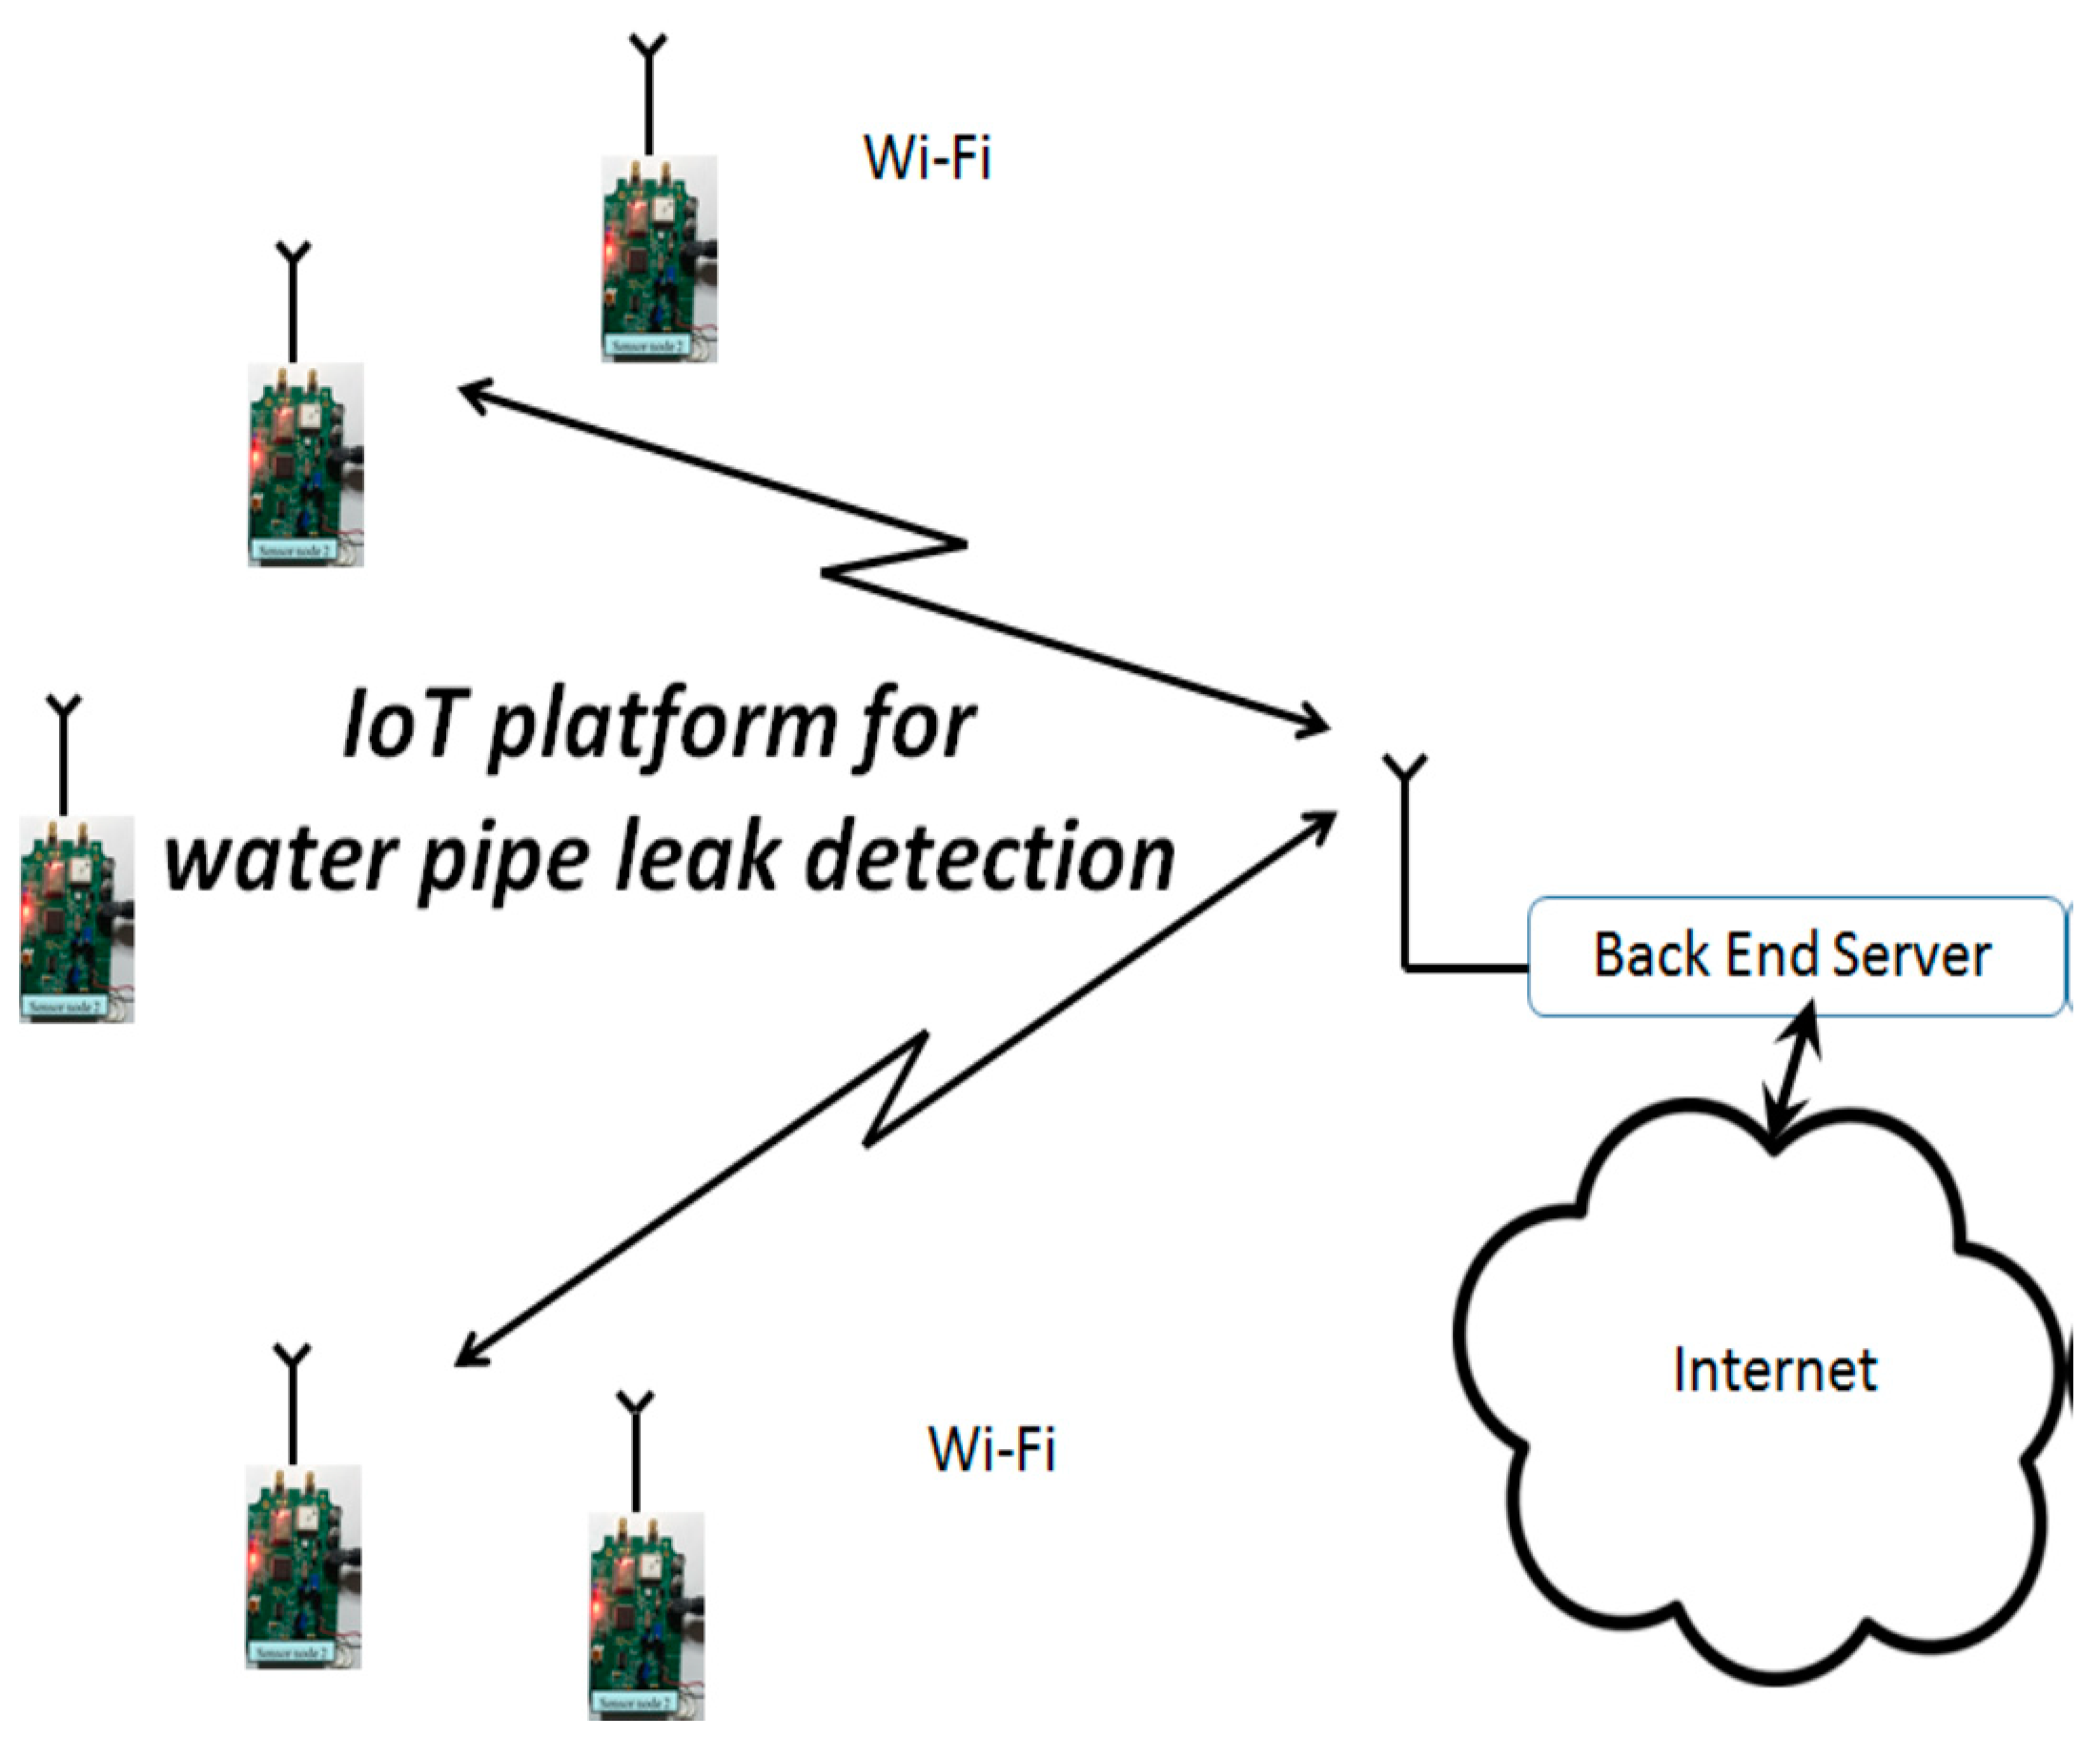
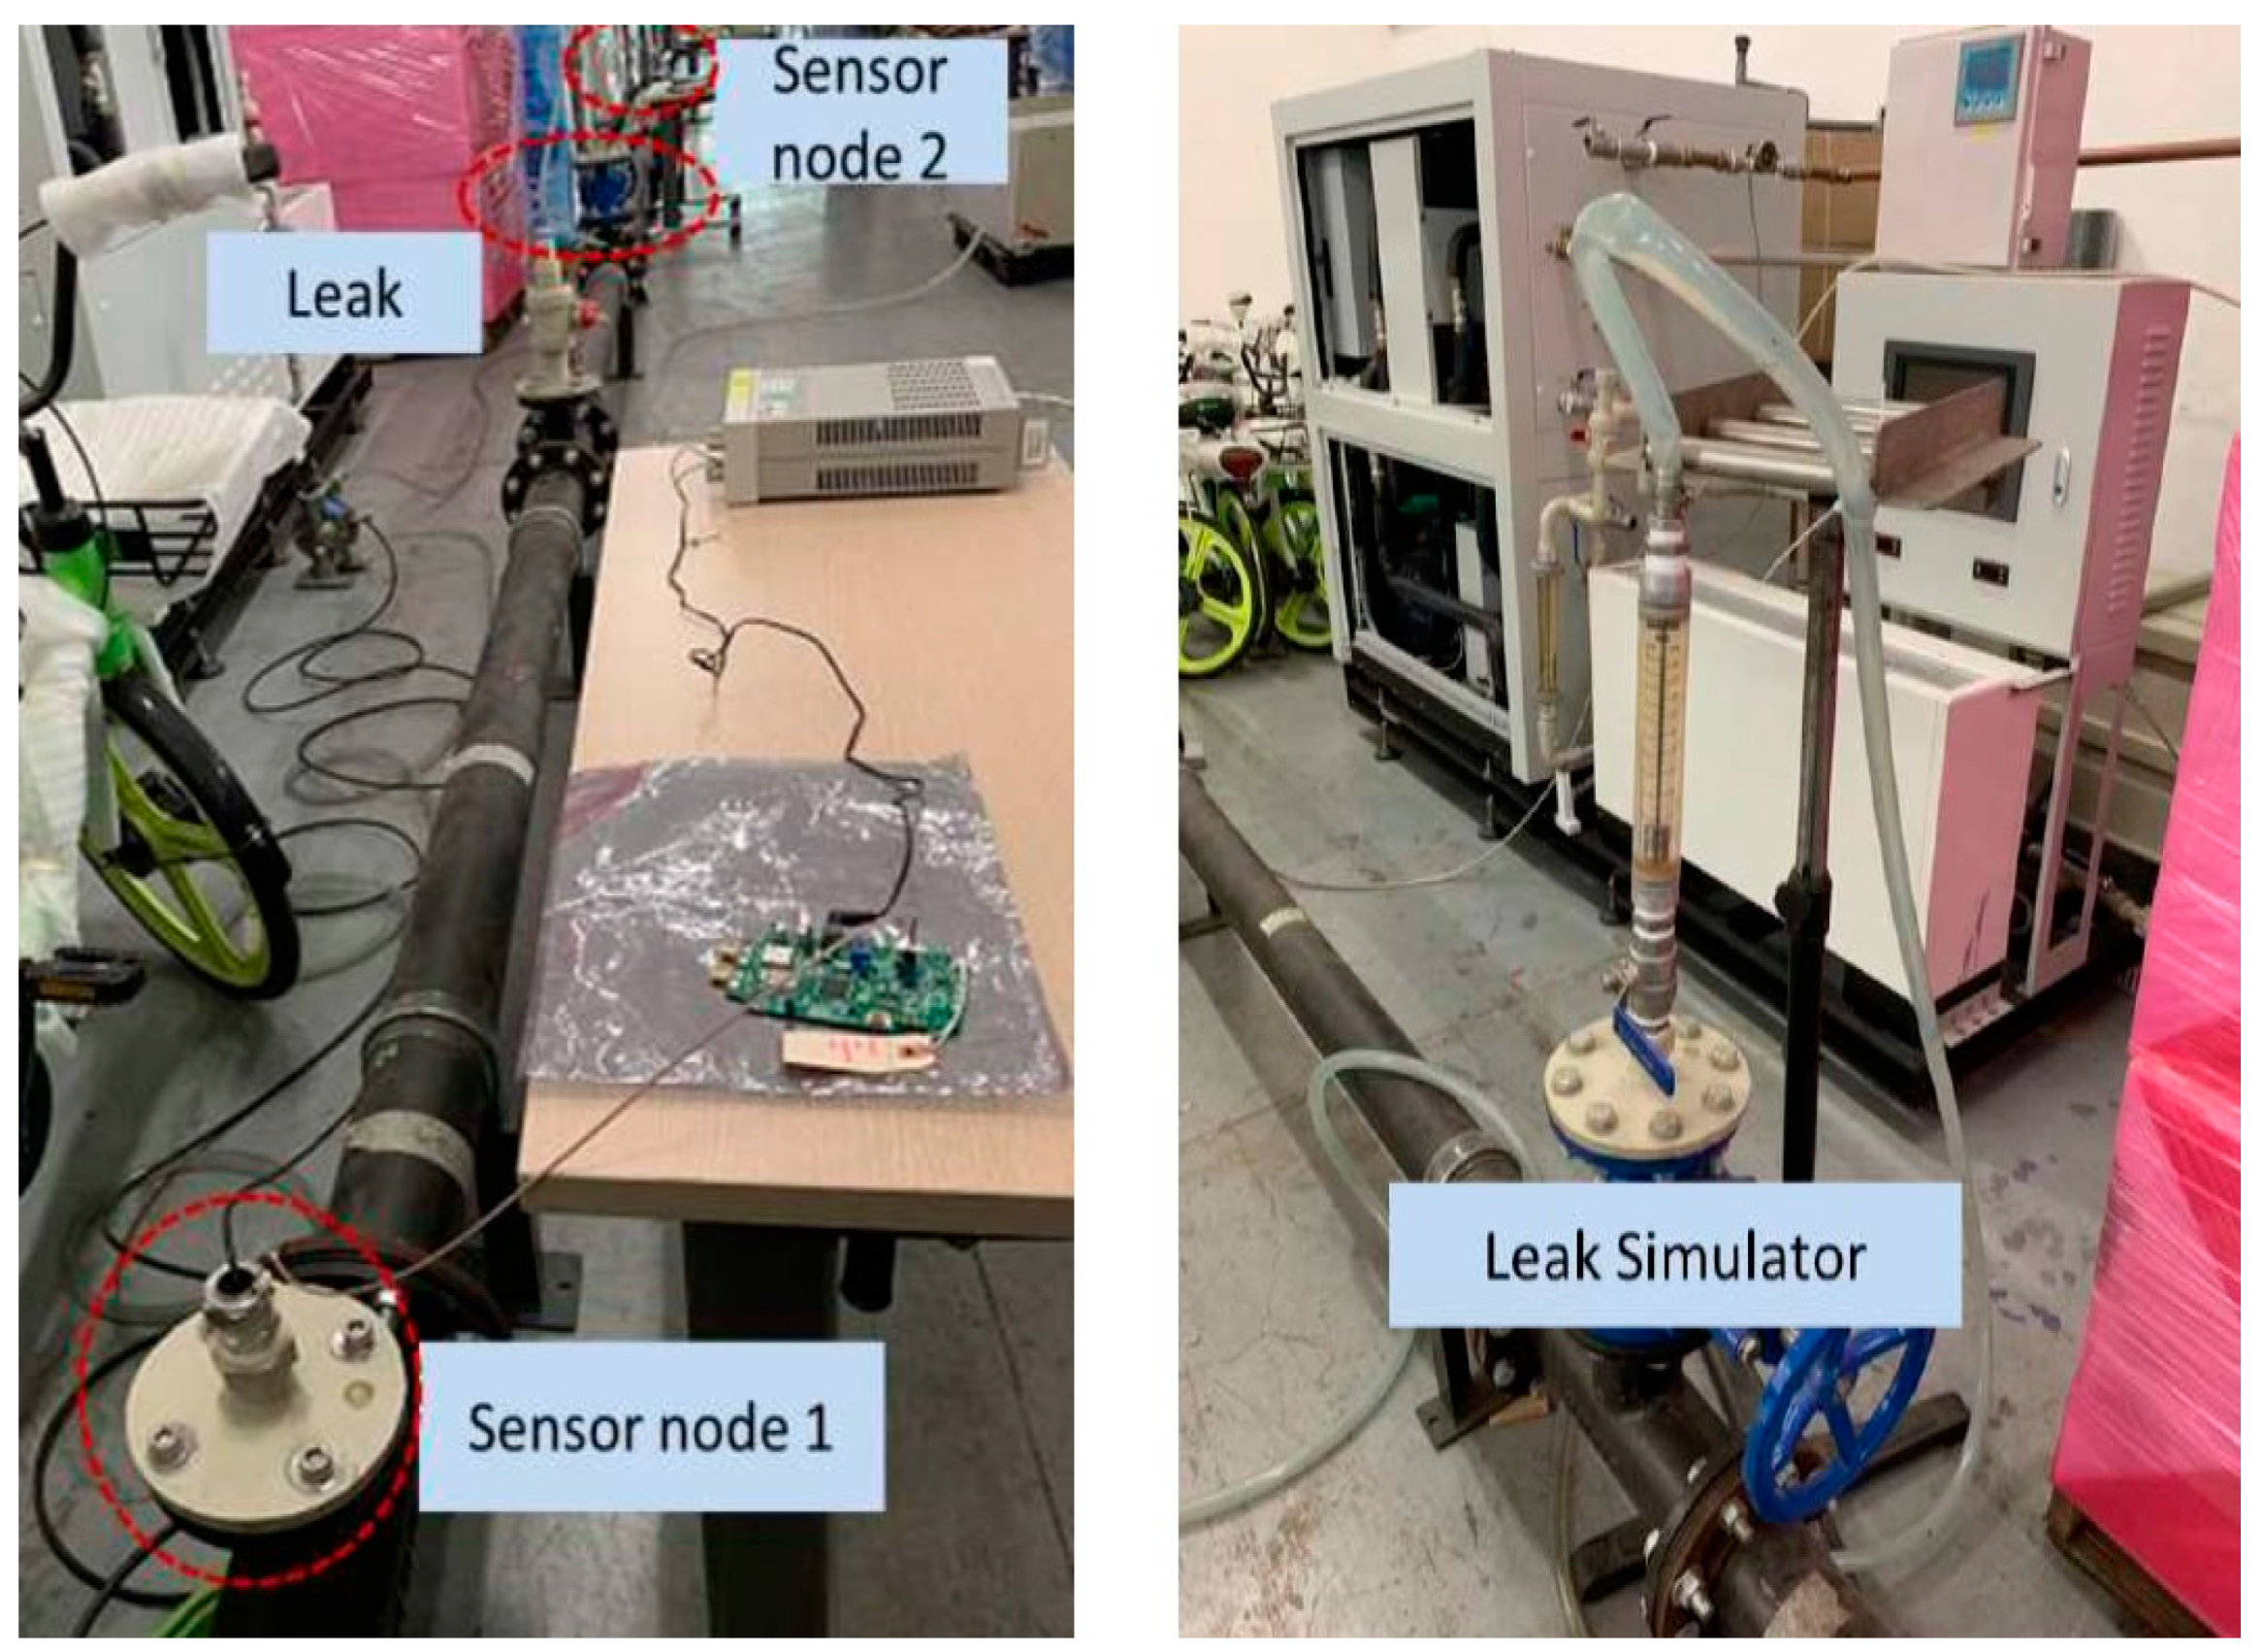
4. Deployment of Water Leakage Detection System
5. Conclusions
Author Contributions
Funding
Conflicts of Interest
References
- Frauendorfer, R.; Liemberger, R. The Issues and Challenges of Reducing Non-Revenue Water; Asian Development Bank: Mandaluyong, Philippines, 2010. [Google Scholar]
- Ress, E.; Roberson, J.A. The Financial and Policy Implications of Water Loss. J. Water Works Assoc. 2016, 108, E77–E86. [Google Scholar] [CrossRef]
- BenSaleh, M.S.; Qasim, S.M.; Obeid, A.M. A Review on Wireless Sensor Network for Water Pipeline Monitoring Applications. In Proceedings of the 2013 International Conference on Collaboration Technologies and Systems, San Diego, CA, USA, 20–24 May 2013; pp. 128–131. [Google Scholar]
- Shama, A.M.; Bady, A.; El-Shaib, M.; Kotb, A.M. Review of leakage detection methods for subsea pipeline. In Proceedings of the 17th International Congress of the International Maritime Association of the Mediterranean, Lisbon, Portugal, 9–11 October 2017. [Google Scholar]
- Adegboye, M.A.; Fung, W.K.; Karnik, A. Recent Advances in Pipeline Monitoring and Oil Leakage Detection Technologies: Principles and Approaches. Sensors 2019, 19, 2548. [Google Scholar] [CrossRef]
- Adedeji, K.B.; Hamam, Y.; Abe, B.T.; Abu-Mahfouz, A.M. Towards Achieving a Reliable Leakage Detection and Localization Algorithm for Application in Water Piping Networks: An Overview. IEEE Access 2017, 5, 20272–20285. [Google Scholar] [CrossRef]
- Murvay, P.S.; Silea, I. A survey on gas leak detection and localization techniques. J. Loss Prev. Process. Ind. 2012, 25, 966–973. [Google Scholar] [CrossRef]
- Elaoud, S.; Haji-Taieb, L.; Haji-Taieb, E. Leak detection of hydrogen-natural gas mixtures in pipes using the characteristics method of specified time intervals. J. Loss Prev. Process. Ind. 2010, 23, 637–645. [Google Scholar] [CrossRef]
- Golshan, M.; Ghavamian, A.; Abulshaheed, A.M.A. Pipeline Monitoring System by Using Wireless Sensor Network. IOSR J. Mech. Civ. Eng. 2016, 13, 43–53. [Google Scholar]
- Zhang, J. Designing a Cost Effective and Reliable Pipeline Leak Detection System. In Proceedings of the Pipeline Reliability Conference, Houston, TX, USA, 19–22 November 1996. [Google Scholar]
- Meribout, M.; Khezzar, L. Leak detection systems in oil and gas fields: Present trends and future prospects. Flow Meas. Instrum. 2020, 75, 101772. [Google Scholar] [CrossRef]
- Shukla, H.; Piratla, K. Leak detection in water pipelines using supervised classification of acceleration signals. Autom. Constr. 2020, 117, 103256. [Google Scholar] [CrossRef]
- Zimpfer, V.; Hamery, P.; Blanck, G.; Foz, T.; Andeol, G. Measurement of the acoustic leak for the de-termination of the optimal earplug type. In Proceedings of the 26th International Congress of Sound and Vibration, Montréal, QC, Canada, 7–11 July 2019. [Google Scholar]
- Bruel & Kjær. Hydrophones—Types 8103, 8104, 8105 and 8106; Bruel & Kjær: Nærum, Denmark, 2017. [Google Scholar]
- DolphinEar Hydrophones, Product Datasheet. Available online: http://www.dolphinear.com/de200.html (accessed on 2 October 2020).
- Aquarian Audio. H2a Hydrophone User’s Guide. Available online: https://www.aquarianaudio.com/AqAudDocs/H2a_manual.pdf (accessed on 2 October 2020).
- Hurrell, A. Piezoelectric and fibre-optic hydrophones. In Ultrasonic Tranducers; Woodhead Publishing: Cambridge, UK, 2012; pp. 619–676. [Google Scholar]
- Xu, J.; Chai, K.T.; Han, B.; Wai, E.L.-C.; Li, W.; Yeo, J.; Njihof, E.; Gu, Y. Low-Cost, Tiny-Sized MEMS hydrophone Sensor for Water Pipeline Leak Detection. IEEE Trans. Ind. Electron. 2019, 66, 6374. [Google Scholar] [CrossRef]
- Mujtaba, S.M.; Lemma, T.A.; Taqvi, S.A.A.; Ofei, T.N.; Vandrangi, S.K. Leak Detection in Gas Mixture Pipelines under Transient Conditions Using Hammerstein Model and Adaptive Thresholds. Processes 2020, 8, 474. [Google Scholar] [CrossRef]
- Xie, J.; Xu, X.; Dubljevic, S. Long range pipeline leak detection and localization using discrete observer and support vector machine. AIChE J. 2019, 65, e16532. [Google Scholar] [CrossRef]
- Zadkarami, M.; Shahbazian, M.; Salahshoor, K. Pipeline leak diagnosis based on wavelet and statistical features using Dempster–Shafer classifier fusion technique. Process Saf. Environ. Prot. 2017, 105, 156–163. [Google Scholar] [CrossRef]
- Santos-Ruiz, I.; Lopez-Estrada, F.R.; Puig, V.; Perez-Perez, E.J.; Mina-Antonio, J.D.; Valencia-Palomo, G. Diagnosis of Fluid Leaks in Pipelines Using Dynamic PCA. IFAC-Pap. 2018, 51, 373–380. [Google Scholar] [CrossRef]
- Wang, X.; Lin, J.; Ghidaoui, M.S. Usage and Effect of Multiple Transient Tests for Pipeline Leak Detection. J. Water Resour. Plann. Manag. 2020, 146, 06020011. [Google Scholar] [CrossRef]
- Xu, J.; Zhang, X.; Fernando, S.N.; Chai, K.T.; Gu, Y. AIN-on-SOI platform-based micro-machined hydrophone. Appl. Phys. Lett. 2016, 109, 032902. [Google Scholar] [CrossRef]
- Wang, N.; Xu, J.; Zhang, X.; Wu, G.; Zhu, Y.; Li, W.; Gu, Y. Methods for precisely controlling the residual stress and temperatiure coefficient of the frequency of a MEMS resonator based on an AIN cavity silicon-on-insulator platform. J. Micromech. Microeng. 2016, 26, 074003. [Google Scholar] [CrossRef]
- Sun, C.; Soon, B.W.; Zhu, Y.; Wang, N.; Loke, S.P.H.; Mu, X.; Tao, J.; Gu, A.Y. Methods for improving electromechanical coupling coefficient in two dimensional electric field excited AIN Lamb wave resonators. Appl. Phys. Lett. 2015, 106, 253502. [Google Scholar] [CrossRef]
- Rabeek, S.M.; Han, B.; Chai, K.T.C. Design of Wireless IoT Sensor Node & Platform for Water Pipeline Leak Detection. In Proceedings of the 2019 IEEE Asia-Pacific Microwave Conference, Singapore, 10–13 December 2019; pp. 1328–1330. [Google Scholar]
- Maser, M.L.; Fickus, M.; Bryan, E.; Petkie, D.T.; Terzuoli, A.J., Jr. Fast Computation of spectral centroids. Adv. Comput. Math. 2011, 35, 83–97. [Google Scholar] [CrossRef]
- Hosseini, M.S.; Rezaie, A.H.; Zanjireh, Y. Time difference if arrival estimation of sound source using cross correlation and modified maximum likelihood weighting function. Sci. Iran. D 2017, 24, 3268–3279. [Google Scholar] [CrossRef][Green Version]


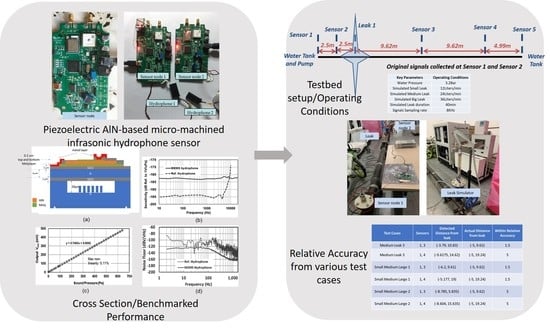
| Test Cases | Sensors | Detected Distance from Leak | Actual Distance from Leak | Within Relative Accuracy |
|---|---|---|---|---|
| Medium Leak 3 | 1, 3 | (−3.79, 10.83) | (−5, 9.62) | 1.5 |
| Medium Leak 3 | 1, 4 | (−9.6175, 14.62) | (−5, 19.24) | 5 |
| Small Medium Large 1 | 1, 3 | (−6.2, 9.61) | (−5, 9.62) | 1.5 |
| Small Medium Large 1 | 1, 4 | (−5.177, 19) | (−5, 19.24) | 1.5 |
| Small Medium Large 2 | 1, 3 | (−8.785, 5.835) | (−5, 9.62) | 5 |
| Small Medium Large 2 | 1, 4 | (−8.604, 15.635) | (−5, 19.24) | 5 |
Publisher’s Note: MDPI stays neutral with regard to jurisdictional claims in published maps and institutional affiliations. |
© 2020 by the authors. Licensee MDPI, Basel, Switzerland. This article is an open access article distributed under the terms and conditions of the Creative Commons Attribution (CC BY) license (http://creativecommons.org/licenses/by/4.0/).
Share and Cite
Phua, W.K.; Rabeek, S.M.; Han, B.; Njihof, E.; Huang, T.T.; Chai, K.T.C.; Yeo, J.H.H.; Lim, S.T. AIN-Based MEMS (Micro-Electro-Mechanical System) Hydrophone Sensors for IoT Water Leakage Detection System. Water 2020, 12, 2966. https://doi.org/10.3390/w12112966
Phua WK, Rabeek SM, Han B, Njihof E, Huang TT, Chai KTC, Yeo JHH, Lim ST. AIN-Based MEMS (Micro-Electro-Mechanical System) Hydrophone Sensors for IoT Water Leakage Detection System. Water. 2020; 12(11):2966. https://doi.org/10.3390/w12112966
Chicago/Turabian StylePhua, Wee Kee, Sarbudeen Mohamed Rabeek, Beibei Han, Edwin Njihof, Tyler Tianlu Huang, Kevin Tshun Chuan Chai, Jason Hock Huat Yeo, and Soon Thor Lim. 2020. "AIN-Based MEMS (Micro-Electro-Mechanical System) Hydrophone Sensors for IoT Water Leakage Detection System" Water 12, no. 11: 2966. https://doi.org/10.3390/w12112966
APA StylePhua, W. K., Rabeek, S. M., Han, B., Njihof, E., Huang, T. T., Chai, K. T. C., Yeo, J. H. H., & Lim, S. T. (2020). AIN-Based MEMS (Micro-Electro-Mechanical System) Hydrophone Sensors for IoT Water Leakage Detection System. Water, 12(11), 2966. https://doi.org/10.3390/w12112966