Abstract
Population growth, global warming, and increased demand for water have caused global concern about increasing water scarcity. Chile has an unequal geographical distribution of water resources. The north-central area where more than half of the country’s population lives has an availability of less than 1000 m3/hab/year. Particularly, the Coquimbo Region has been one of the most affected by drought due to the great agricultural activity in the area. In this study, surveys were carried out in rural schools and households to determine water consumption habits. The results in the schools showed that between 42% and 72% of the wastewater generated comes from the washbasin, which represents light greywater, that is, with low organic matter content. According to the data obtained, the amount of greywater generated on average reached 12 L per capita per day. These waters have the potential to be treated and reused effectively for the flow of toilets or garden irrigation. In the case of households, the generation of greywater was 84% of the total water consumed, of which, more than 86% correspond to light greywater from the shower and washbasin. On average, the light greywater generated daily reached 204 L per person per day. Due to the heterogeneity of drinking water sources in rural areas of the Coquimbo Region, the high rate of greywater generation in both schools and homes indicates the great potential for water treatment and reuse in this area. These results contribute to a better understanding of water consumption habits in rural areas affected by water scarcity and the potential of implementing greywater treatment systems to generate a decrease in demand for drinking water.
1. Introduction
Water scarcity is a problem of great concern in the world. This scarcity can be classified into two types: shortage and stress [1]. The water shortage refers to the low availability of water per capita. This refers mainly to population growth, which has quadrupled in the last century [1]. However, the relationship is not linear since the rate demand for water has doubled the rate of population growth [2]. On the other hand, stress refers mainly to the demand for water per capita that is related to people’s lifestyles, consumption habits, food, and energy security policies, changing diets, and economic development [1,2,3,4]. Today around 30% of people live in areas of severe water scarcity [5,6]. Although in South America the water shortage is less evident than in other parts of the world [6], in Chile the effects of the drought are becoming increasingly worrying. Chile has a water availability close to 54,000 m3/hab/year, but the geographical distribution is highly unequal [7,8]. Most of Chile’s population is found in arid and semi-arid climates, located in north-central Chile, where water availability is less than 1000 m3/hab/year [8].
Furthermore, rural areas have less access to water and sanitation than urban areas in most cases, except for countries with universal coverage [9]. Therefore, the rural context presents greater challenges in terms of water coverage, mainly due to the lack of infrastructure and services [2]. In Chile, in 1960 only 6% of the rural population had access to an adequate water supply [10]. After the implementation of the Rural Potable Water (APR) program, the rural coverage reached 53% in 2014, and in concentrated and semi-concentrated rural areas, access reached 88% [10]. However, water resource management remains a complicated issue. The laws that regulate the use and management of water resources function like a system of allocation of water rights to private users, in perpetuity and at no cost [8,11]. Public regulatory mechanisms are quite limited so that it does not allow, assign, or prioritize different uses of water, which has increased inequality in access to water [8,11].
Due to water scarcity, water reclamation, recycle and reuse for demand mitigation is gaining importance in the world [6,12]. In this context, the reuse of greywater emerges as a new source of water [13]. Greywater is defined as wastewater generated by domestic uses that includes the shower, washbasin, washing machine, dishwasher, and kitchen sink water [14,15]. These waters are distinguished from black waters coming from toilets [14]. Some authors make a subdivision into greywater: light greywater from sewage from showers and washbasin; and dark greywater, which include waters with higher organic matter content from laundry and kitchen facilities [16]. Even though the proportions in water use vary geographically, greywater constitutes a large part of household wastewater, between 40–90% [14].
In Chile, wastewater as water sources is an underdeveloped topic. There are some projects for the reuse of water, mainly in the manufacturing and mining industrial sector [17,18]. However, water reuse projects in households and public buildings are lacking. Due to the growing concern about the lack of water resources, and the absence of regulations that allow and promote the reuse of greywater, in February of 2018, the law 21.075 was enacted, which regulates the collection, reuse, and disposal of greywater [19].
This work aims to present a study of water consumption in the Coquimbo Region, located in north-central Chile. This region is characterized by having a semi-arid climate and being at a high risk of climate change due to the decrease in precipitation and the increase in temperatures [7,20]. Our work presents the results of surveys conducted in rural public schools and households in the Coquimbo Region whose objective was to estimate the characteristics of water consumption in these two sections. The importance of this study lies in providing information about consumption habits in public buildings (schools) and households in rural sectors located in areas with increasing water scarcity.
2. Materials and Methods
2.1. Study Site and General Context
The study was conducted in the Coquimbo Region located in north-central Chile (29–32° S, 70–71° W). This region is characterized by being a transition zone between the desert and Mediterranean climate [21]. The extreme north is characterized by greater aridity, while towards the south an increase in precipitation is observed according to meteorological data from the area [22]. Besides, the Coquimbo Region has a water availability of 1020 m3/hab/year, while the threshold for sustainable development is 2000 m3/hab/year [23,24]. Based on meteorological data and studies on the availability and consumption of water [22,24,25], a characterization of the area was carried out based on precipitation and water availability.
Figure 1 shows the geographical location of Coquimbo and a map of isohyets obtained from the average precipitation of the last 20 years, determined using Thiessen polygons [26]. The map of Chile shows the availability of water by each administrative region represented by the subtraction between the availability of water and its demand [24,25]. It is possible to observe that the north-central zone is strongly marked by a water shortage since the available water does not manage to satisfy the needs of the region. On the contrary, the southern zone greatly exceeds its water demand. In particular, the Coquimbo Region has a deficit of 7.84 m3/s. It should be noted that the legend of this graph does not present linear sections, ranging from −18 m3/s to 10,000 m3/s. The isohyets map shows the average precipitation measured by the monitoring stations in the last 20 years. Precipitation exceeds 200 mm in the southern area of Coquimbo, with a more Mediterranean-type climate [21], and in the eastern zone, with high Andean mountains predominance, in which precipitation increases with elevation [27].
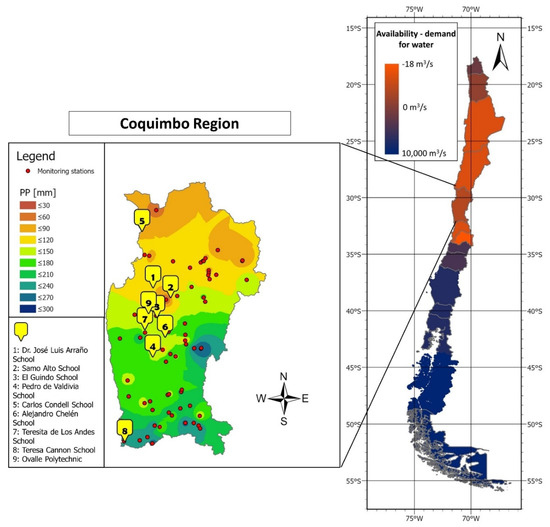
Figure 1.
Water availability by administrative regions of Chile and a map of isohyets for the Coquimbo Region with average data from the last 20 years obtained from 69 monitoring stations. The color scale on the map of Chile does not present a linear scale and is intended to visually show if the region has water scarcity. The map also shows the location of the rural public schools in this study. Source: Prepared by the authors based on meteorological data from the Climate Explorer that uses compiled databases of the weather observations available for Chile [22].
The annual average of precipitation in the last 20 years has a large annual variation (Appendix A), which was also reported by other studies [21,28]. The average annual precipitation between 2000 and 2019 was 138.6 mm. Besides, the coefficient of variability of annual precipitation was 51.5% [29,30]. Although there are several aridity indices focused on quantifying the relationship between water availability and demand in a region, one of the simplest indicators is based on precipitation [31]. In general, it is considered an arid region when the annual precipitation is less than 250 mm [31,32]. On the other hand, the linear regression shows a tendency to decrease rainfall in recent years, at a rate of −4.9 mm/year in the last 20 years. According to the Mann-Kendall test, precipitation has a statistically significant decrease trend (p < 0.5). In summary, Coquimbo presents problems of water scarcity due to climatological causes, specifically due to the semi-arid climate, the decrease in precipitation and the increase in water consumption mainly due to agricultural and mining activity which represents the 83% and the 7.5% of the total water demand in the region, respectively [7,24,33,34], which produces a very high demand for water, which is not covered by the availability of water in the area. Therefore, the incorporation of new water sources, as well as the implementation of technologies for better use of existing resources is very relevant in this study area.
2.2. Data Collection in Schools
The data collection was carried out through surveys of students, teachers, and employees from nine public schools located in the Coquimbo Region (Figure 1). Eight primary public schools located in rural sectors were chosen for the study, and one secondary school located in an urban area (Ovalle Polytechnic), which was used as a control case because it belongs to an urban area and has a more advanced water reuse culture than the other schools. In addition, this school is certified with an environmental seal, which is also reflected in its curriculum plan (Appendix B). A total of 1288 surveys were conducted, located in 8 districts within the Coquimbo Region. According to data from 2017 [35], the rural population of all the comunas (districts) involved in this study is 64,101 people, so the total surveyed population represents 2.01%. The surveys included questions to characterize the studied population, such as gender and role within the school. Members of the schools were questioned about the number of times per day that they used the toilet and washbasin. To estimate the consumption of water for cleaning, the cleaning staff of the schools were asked about the times per day that the different areas of the schools are cleaned and the amount of water used in each case. The collected data were processed graphically in the results section.
To estimate water consumption in the toilet, the water storage capacity of a standard toilet tank, corresponding to 9 L, was considered [36,37]. In the case of the washbasin, water consumption was estimated at an average of 1 L of water every 10 s according to the estimates made by the Superintendency of Sanitary Services of Chile [38].
Additionally, the relationship between individual water consumption and the size of the establishments was studied to determine if the number of members of an establishment is related to individual consumption practices. Additionally, the correlation between total consumption by school and the number of people belonging to it was studied. In each case, the determination coefficient R2 was calculated to study the level of dependency between the data.
2.3. Data Collection in Households
Data was collected from 148 families in the Coquimbo Region, members of the educational establishments in the previous section. These 148 families correspond to 599 people, which represents 0.93% of the total rural population in the comunas (districts) studied within the Coquimbo Region. The data was obtained through surveys answered by a representative family member. A part of the survey included questions about the age, gender, and educational level of the person who answered the survey. Besides, water consumption was investigated in different categories: bathroom (shower and washbasin), toilet, kitchen (dishwashing, food preparation, drinking), laundry, and gardening. The questions referred to the frequency with which certain activities are carried out (e.g., number of times in used the toilet per day, number of times in use the shower during the week, number of times to wash dishes per day, etc.). In the case of the use of water faucets, it was asked about the time in which the tap is left open for each activity. The total water consumption for each activity was estimated from the responses of the surveys (Appendix C) and the indications of practical guides on water consumption according to the time of use were taken as a reference [36,37,38]. Particularly, the consumption data for the toilet (9 L per flush), shower (20 L per minute), and faucet (6 L per minute) were used. The greywater generation in homes was estimated from the water consumption in the bathroom, kitchen and laundry. In addition, questions about the source of drinking water for each family were included since the coverage of drinking water is not the same and of the same type for all communities in rural areas. Additionally, it was asked about current water reuse habits which provide an overview of the situation of water use and reuse in one of the areas most affected by water scarcity in Chile [34].
Finally, the relationship between the size of the surveyed families and their individual and group consumption habits was studied. These data were plotted to determine if there was any proportional relationship between the variables.
2.4. Preliminary Economic Analysis
For the economic analysis associated with the potential treatment systems, a bibliographic search was carried out about technologies applicable to different situations, based on the volume of greywater generated by both schools and households. Costs are presented in dollars and were updated to present value in 2020.
3. Results and Discussion
3.1. Consumption Habits in Schools
A study of water consumption habits was carried out in rural public schools located in the Coquimbo Region. Most of the schools are in the central part of the region, near the city of Ovalle. Except for the Ovalle Polytechnic, the other establishments are for primary education and generally constitute a small number of students and employees. Table 1 presents the profile of the respondents. The percentage of respondents per establishment was close to or greater than 50%, except in the Ovalle Polytechnic, whose enrollment is over 1000 students, so in this case, the percentage of participation was lower. The gender of the respondents was fairly equal, except, again, in the Ovalle Polytechnic where 75% of the respondents were male.

Table 1.
Profile of schools respondents.
The survey conducted in the 9 schools revealed that the bathroom (washbasin) and toilet represented the highest water consumption within the establishments (Figure 2). Cleaning represented usually less than 1% of the total water consumed. In particular, toilets demanded between 26% and 57% of the total water consumption. Cheng and Hong [39] studied the water consumption in primary schools in Taiwan. Their results showed that the flush of the toilets represented around 70% of the total water consumed. They also identified considerable gender differences between the consumption of water for this purpose, with the consumption of women being between two and three times greater than that of men. In this study, the total water consumption estimate ranged between 27 and 70 L per capita per day (lpcd), a value higher than that reported by other studies where daily consumption per person in educational establishments was estimated between 16 and 35 lpcd [39,40]. In this study, the washbasin represents the major water consumption, being over 50% of total consumption in most cases. This water presents good parameters of water quality, compared to other greywater sources as the kitchen or laundry [41]. According to Birks et al. [42], the waters coming from the washbasin have a BOD less than 150 mg/L, suspended solids up to 100 mg/L and total coliforms between 2.3 × 10³–106 CFU/100 mL. Due to these characteristics, the washbasin water is considered a good source of greywater to be collected and treated by simple treatments, such as filtration, constructed wetlands, or treatment systems based on coagulation/flocculation processes [43].
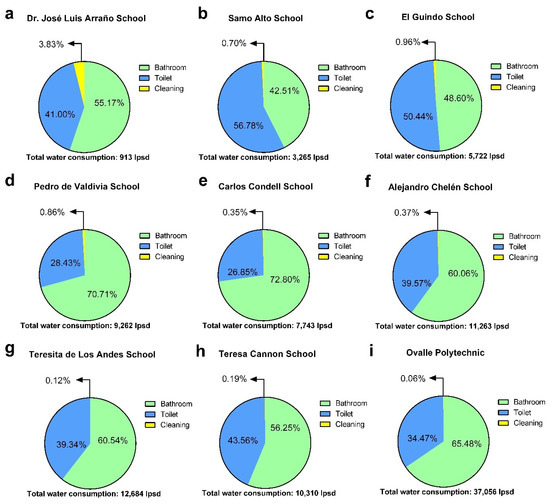
Figure 2.
Water consumption in 9 schools in the Coquimbo Region. Data are presented as total consumption in liters of water per school per day (lpsd).
Table 2 summarizes the amount of greywater produced by each school based on water consumption in the washbasin. Figure 3 illustrates the fraction of greywater generated based on total water consumption. These graphs show that the generation of greywater in many cases is greater than 50% of the total water consumption. Besides, the solid area of black color (Figure 3) represents the effective consumption, corresponding to the difference between the total consumption and the greywater generation, which corresponds mainly to the water consumed by toilets. According to the data presented in Figure 2; Figure 3, it is possible to see that if the treated greywater were reused for flushing toilets, it could cover between 75% and 100% of the toilet water demand. The use of greywater for flushing toilets has already been tested in various projects [44,45,46,47,48]. Additionally, treated water can be used for garden irrigation within schools. A successful project for the reuse of greywater in schools was carried out in India, where more than 300 schools implemented greywater treatment systems for flushing toilets and irrigating food crops [49,50].
Table 2.
Greywater generation in schools.
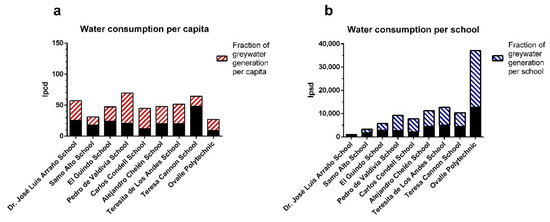
Figure 3.
Total water consumed daily (a) per capita and (b) per school. The columns represent the total water consumption and the hatched area corresponds to the fraction of the total water consumption that becomes greywater.
Water consumption and greywater generation were studied according to the number of members of each establishment. A trend line was added for the data obtained with and without including the Ovalle Polytechnic, the urban area school used as a control case and characterized by being different from the other schools in terms of the number of members in the establishment (Figure 4). From the coefficient of determination R2 it was possible to confirm that the water consumption and the greywater generation per school are directly proportional to the number of members in the establishments, which was expected.
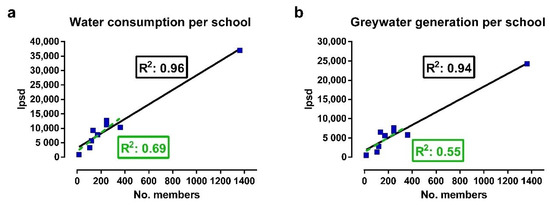
Figure 4.
Relationship between the number of members in each school and (a) the water consumption and (b) the greywater generation per school. The trend lines are presented in black and continuous lines (9 schools) and green and dashed lines (excluding Ovalle Polytechnic).
The individual data on water consumption and greywater generation are represented by histograms in Figure 5. In both cases, the Gaussian function has a right-skewed distribution. Besides, it is possible to observe that the average delivered by the adjustment of the Gaussian model is 37.98 lpcd for the water consumption and 12.09 lpcd for the greywater generated. In both cases, the averages provided are lower than the simple average of the data, corresponding to 44.91 lpcd and 25.32 lpcd, respectively. Particularly, it is observed that some values for water consumption are very high, which may be due to a personal overestimation of people regarding their water consumption. This highlights, on the one hand, the little awareness or attention that some people may pay about their daily water consumption habits and, on the other hand, explains why these data may be higher than those reported in other studies. It should also be noted that even though this area has water scarcity, awareness about the use of water is not a widespread practice in the country.
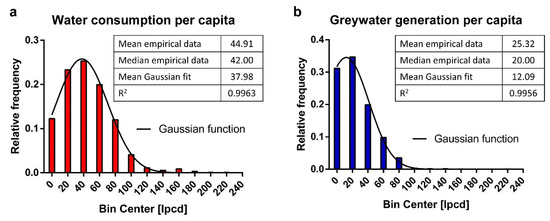
Figure 5.
Histogram and Gaussian function for the individual data of (a) water consumption per capita and (b) greywater generation per capita per day. In each graph, a table is presented with the mean and the median of the empirical data, the median given by the fit of the Gaussian model, and the value of R2 of the Gaussian fit.
3.2. Consumption Habits in Households
The consumption habits of 148 families in the Coquimbo Region were studied. Table 3 summarizes the profile of the surveyed households. The surveys were answered by a representative family member. Most of the surveys were answered by a female family representative (81%), in an age range of 8 to 79 years, with an average of 41 years of age. The educational level of the family representative showed great variability, with complete secondary education being the most common level.
Table 3.
Profile of the household respondents.
Figure 6 summarizes the data obtained from the surveyed households. The family size varied between 1 and 10 members (Figure 6a). However, the most common families had a size between 3 and 5 members (74%). This size is greater than the statistics at the national level, where people per household in Chile in 2017 was 3.1 [51]. The average household water consumption was 324.7 lpcd. Of this water, more than 72% is used in the bathroom, which includes the use of shower and washbasin. This activity is followed by the toilet (11.36%), the kitchen (9.52%), gardening (4.16%), and the laundry (2.59%). In this study, the water consumption destined to shower was the main determinant of total household consumption. Even though the proportions in the use of water vary geographically, according to cultural and socioeconomic factors, the water consumption attributable to the bathroom is higher than other activities in the home, and it represents more than 30% in most households in different parts of the world [52,53,54,55,56,57]. In total, greywater from the bathroom, kitchen, and laundry constitutes about 84% of the total water consumed in households in Coquimbo. Additionally, the water from the bathroom (shower and washbasin), which has better quality, represents more than 86% of the total greywater generated. Other studies in countries like Jordan or South Africa have also reported high greywater generation rates, with values between 70–77% of the total water consumed [43].
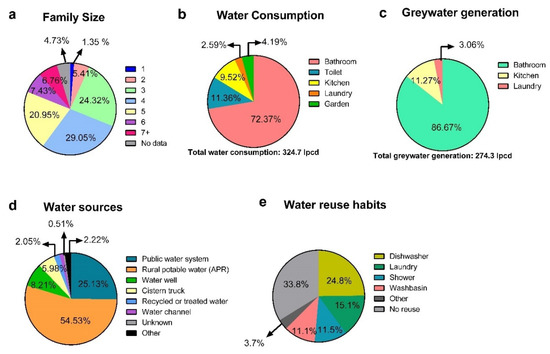
Figure 6.
Results of household surveys: (a) family size; (b) average water consumption per activity in households; (c) average greywater generation per activity in households; (d) water sources; and (e) water reuse in surveyed households.
The main source of drinking water for the families in this study corresponds to the Rural Potable Water (APR), program created to provide clean water to rural communities. The other most common water sources in this area are the public water system and water well. Lower percentages obtain water from sources such as cistern trucks, recycled water, or water channels (Figure 6d). This heterogeneity can greatly affect people’s consumption habits due to the availability of water per family. Regarding the question about the reuse of greywater, more than 66% reported reusing water from some domestic activities. The main sources from which greywater is reused were the dishwasher and the laundry. Although many studies indicate that these waters have poorer quality than the waters obtained from the shower and washbasin due to the greater presence of organic matter, in practice it was more used as a source of greywater because its collection is much easier than collecting water from a bathroom since in many cases it does not require an expense in plumbing work for the adaptation of drains [58]. In Chile, the concept of greywater reuse is relatively new when compared to other countries, due to the lack of adequate legislation [59]. However, it is expected that the scenario will change with the Law 21,075 that regulates this matter.
Figure 7 shows the relationship between family size with individual water consumption (lpcd) and liters of water consumed per household per day (lphd). Despite the great variability in the data obtained, it is possible to observe that the consumption of water per person is inversely proportional to the size of the family, which can be explained by the limitation of water available to households, especially in those they must be supplied with water by cistern trucks, water channel or water well. Another relevant factor is the economic one, which may explain why a larger family should restrict individual water consumption. On the other hand, household consumption is directly proportional to family size (Figure 7b), because although individual consumption may be less for large families, the sum showed an increase in consumption with increasing family size, the same way that water consumption was directly proportional to the size of schools (Figure 4a).
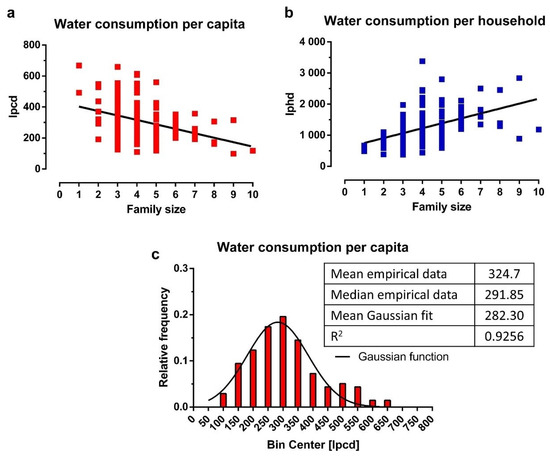
Figure 7.
Relationship between family size and (a) the water consumption per capita and (b) the water consumption per household. The trend line is also presented in each graph. Histogram and Gaussian function for the individual data of (c) water consumption per capita per day. The table shows the mean and the median of the empirical data, the median given by the adjustment of the Gaussian model, and the value of R2 of the adjustment.
Finally, Figure 7c presents individual consumption data through histograms. The distribution has a slightly right-skewed shape, which means that some data is excessively high, probably due to an overestimation of consumption habits. The figure also presents the average of the data according to the Gaussian best-fit values, corresponding to 282.30 lpcd, which is lower than the simple average of the data corresponding to 324.7 lpcd.
3.3. Preliminary Economic Analysis
Table 4 summarizes the range of greywater generated in schools and households and the potential economic savings associated with the price of the water saved. This range is related to the school’s and family’s size. Greywater has the potential to be treated and reused, so it could become water savings. Some previous studies on greywater treatment systems present cost analyzes. In the case of schools, a study carried out in India in a school with 300 students was taken as a reference [50]. The system used in this study consists of primary, secondary, and tertiary treatment and had capital costs of approximately US $1450 and operation and maintenance costs of US $165/year. On the other hand, preliminary data from pilot treatment systems used in Chile were taken as a reference, which have reported capital costs between US $2000–4450. In the case of households, treatment systems implemented for domestic use were taken as a reference. Some more sophisticated systems, which include biological treatment, have capital costs of around US $2600 and maintenance costs of US $47/year [14]. However, simpler treatment systems, such as intermittent sand filtration systems, can be much cheaper, with capital costs of US $700 [14,60]. The appropriate treatment system in each case will depend on the regulations of each country and the uses that will be given to the treated greywater.
Table 4.
Summary of a cost analysis of different treatment technologies applicable to schools and households.
4. Conclusions
The study of consumption habits in rural public schools in Coquimbo revealed that more than 50% of the total water is consumed in the bathroom, mainly the washbasin, whose waste is transformed into greywater. These waters have a great potential for reuse due to the low organic content it possesses, which could cover a large part of the water demanded for toilets, as well as the possibility of using them for the irrigation of ornamental gardens.
Household surveys showed that more than 80% of wastewater corresponds to greywater, of which more than 85% corresponds to water from the shower and washbasin that have good parameters of water quality, which can be safely reused following simple treatment. Currently, 66% of the surveyed households stated that they carry out water reuse practices. In general, these waters are reused for watering gardens and plants, fruit trees, orchards, and cleaning areas outside the house. These waters are used without any type of treatment and outside of any regulatory framework. The main sources of reused water were dishwashing and laundry, even though they have worse water quality parameters than those from the bathroom (shower and washbasin). This preference is because the collection of water from dishwashing and laundry in most cases does not require additional investment in plumbing services. Lastly, an inversely proportional relationship was found between per capita water consumption and family size, mainly due to the limited availability of water that some households have.
Consequently, both schools and households have great potential greywater reuse which would save drinking water for families in general and regions suffering from water scarcity in Chile in particular. The costs associated with the greywater treatment systems will depend on the quality of the water to be treated and the quality of the water required for different regulated uses in each country.
The main limitations in data processing and analysis were some extremely high data collected in the surveys, probably produced by little self-knowledge about water consumption habits. Additionally, the population presents a high heterogeneity regarding the source of drinking water, which is also closely related to people’s consumption habits, since, for some, access to water is more limited for sanitary infrastructure. On the other hand, the percentage of coverage of the number of surveys in relation to the total population of the studied area was also a limiting factor for the extrapolation of the results. However, this coverage reaches 9.5% of all schools with an environmental seal in the Coquimbo Region and corresponds to 17% of municipal schools with an environmental seal.
Author Contributions
The manuscript was written by C.R., but all the authors contributed to its preparation and review. Conceptualization and data analyses were carried out by C.R. in discussion with E.L. Surveys were prepared, systematized and analyzed by J.L.-P. and R.S. The application of the surveys was carried out by N.R. and N.S. The manuscript was edited by C.R., R.S., J.S. and E.L. All authors have read and agreed to the published version of the manuscript.
Funding
This research was funded by FIC-R Fondo de Innovación para la Competitividad Gore Coquimbo BIP nos. 30485965-0, CORFO-L2 L2 ISV93456 and FONDECYT 11191154 (2019–2022)
Acknowledgments
Thanks to the schools and educational communities that collaborated in this study, and to the teachers, administrators, students and families who answered the surveys. Thanks are also extended to the reviewers for their corrections and suggestions, who contributed significantly to improving the quality of this manuscript.
Conflicts of Interest
The authors declare no conflict of interest.
Appendix A

Figure A1.
Average precipitation in Coquimbo Region in the last 20 years using the Thiessen polygon method. The mean annual precipitation in the range of years studied and the linear regression are also presented. Source: Prepared by the authors based on meteorological data from the Climate Explorer that uses compiled databases of the weather observations available for Chile [22].
Appendix B. Survey Applied to Schools (Translation from Spanish to English)
To be completed by the school principal or person with the requested information:
Name of school:
| Male | Female | Total | |
| Number of teachers | |||
| Number of education assistants | |||
| Number of students | |||
| Number of non-teaching staff | |||
| Administration | |||
| Maintenance | |||
| Cleaning staff | |||
| Kitchen | |||
| Gardening | |||
| Others | |||
| Total |
Origin and uses of water: (mark with an X)
| Bathroom | Kitchen | Cleaning | Gardening | Others | |
| Public water system | |||||
| Rural potable water | |||||
| Water well | |||||
| Cistern truck | |||||
| Recycled or treated water | |||||
| Water channel | |||||
| Other | |||||
| Unknown |
To answer individually
| Age: | ___ years | |
| Gender: | ☐ Male | ☐ Female |
- How many times a day do you use the washbasin at the establishment?_________________
- How long do you leave the faucet open each time you use it?________________
- How many times a day do you use the toilet in the establishment?______________
- How many times a day do you use the urinal at the establishment?_______________
- How many times a week do you shower in the establishment?____________
- How long does a shower take approximately?_____________
To be answered by the cleaning staff:
| What Areas Do You Clean? | How Many Times a Week Do You Clean This Area? | How Many Liters of Water Do You Use for Cleaning? |
| ☐ Bathrooms | ||
| ☐ Hallways | ||
| ☐ Classrooms | ||
| ☐ Common areas | ||
| ☐ Teachers room | ||
| ☐ Casino | ||
| ☐ Kitchen | ||
| ☐ Others:________________ |
Appendix C. Survey Applied to Households (Translation from Spanish to English)
Characterization of the respondent
| Age: | ___ years | |
| Gender: | ☐ Male | ☐ Female |
| Educational level: | ☐ Complete higher education | ☐ Incomplete higher education |
| ☐ Complete secondary education | ☐ Incomplete secondary education | |
| ☐ Complete basic education | ☐ Incomplete basic education | |
| ☐ None |
- Consumption habits
- Number of people in your household: ________________
- Origin and uses of water: (mark with an X)
| Bathroom | Kitchen | Cleaning | Gardening | Others | |
| Public water system | |||||
| Rural potable water | |||||
| Water well | |||||
| Cistern truck | |||||
| Recycled or treated water | |||||
| Water channel | |||||
| Other | |||||
| Unknown |
Individual water consumptions (The following questions refer to a family average)
Bathroom:
| How many times a week do you shower? _________________ |
| How many minutes does a shower take approximately? __________________________ |
| How many times a day do you wash your face? ________________ |
| How many minutes do you leave the sink open? _________________________________ |
| How many times a day do you wash your hands? ______________ |
| How many minutes do you leave the sink open?_________________________ |
| How many times do you brush your teeth a day? ____________ |
| How many minutes do you leave the sink open?__________________________________ |
| How many times a day do you use the toilet (WC)? ___________ |
Family water consumption
Kitchen:
| Do you consume bottled water or tap water? ☐Bottle ☐ Tap water |
| If you consume tap water, how many liters a day do you use to drink at home?__________________ |
| If you consume bottled water, how many liters is your container (siphon, bottle, jerrycan)?________ |
| How many packages do they consume per month?___________________________________________ |
| How many times a day do you wash food?__________________________________________________ |
| How long do you leave the faucet open each time you wash the food? __________________________ |
| How many liters a day do you consume at home to cook? _____________________________________ |
| How many times a day do you wash the dishes?_____________________________________________ |
| How long do you leave the faucet open each time you wash the dishes?_________________________ |
Laundry:
| How do you wash clothes? ☐ Washing machine ☐ Manual |
| If you wash the clothes by hand, how many liters do you use in each wash?_______________________________ |
| How many times a week do you wash clothes by hand ___________________________ |
| If you wash clothes with a washing machine, how many times does the washing machine run a week?________ |
Gardening:
| Does your home have land, orchard, crop, or garden? ☐Yes ☐No |
| How many times a week do you water the field, orchard, crop, or garden?__________________________ |
| How long does the hose use to water?_________________________________ |
| If you don’t use the hose, how do you water? ☐Channel ☐Other: |
References
- Kummu, M.; Guillaume, J.H.A.; De Moel, H.; Eisner, S.; Flörke, M.; Porkka, M.; Siebert, S.; Veldkamp, T.I.E.; Ward, P.J. The world’s road to water scarcity: Shortage and stress in the 20th century and pathways towards sustainability. Sci. Rep. 2016, 6, 38495. [Google Scholar] [CrossRef] [PubMed]
- Connor, R. The United Nations World Water Development Report 2015: Water for a Sustainable World; UNESCO Publishing: Paris, France, 2015; Volume 1, ISBN 9231000713. [Google Scholar]
- Liu, J.; Yang, H.; Gosling, S.N.; Kummu, M.; Flörke, M.; Pfister, S.; Hanasaki, N.; Wada, Y.; Zhang, X.; Zheng, C.; et al. Water scarcity assessments in the past, present, and future. Earth’s Futur. 2017, 5, 545–559. [Google Scholar] [CrossRef] [PubMed]
- Molinos-Senante, M.; Donoso, G. Water scarcity and affordability in urban water pricing: A case study of Chile. Util. Policy 2016, 43, 107–116. [Google Scholar] [CrossRef]
- Van Vliet, M.T.H.; Florke, M.; Wada, Y. Quality matters for water scarcity. Nat. Geosci. 2017, 10, 800–802. [Google Scholar] [CrossRef]
- Gude, V.G. Desalination and water reuse to address global water scarcity. Rev. Environ. Sci. Biotechnol. 2017, 16, 591–609. [Google Scholar] [CrossRef]
- Aitken, D.; Rivera, D.; Godoy-Faúndez, A.; Holzapfel, E.; Aitken, D.; Rivera, D.; Godoy-Faúndez, A.; Holzapfel, E. Water Scarcity and the Impact of the Mining and Agricultural Sectors in Chile. Sustainability 2016, 8, 128. [Google Scholar] [CrossRef]
- Valdés-Pineda, R.; Pizarro, R.; García-Chevesich, P.; Valdés, J.B.; Olivares, C.; Vera, M.; Balocchi, F.; Pérez, F.; Vallejos, C.; Fuentes, R.; et al. Water governance in Chile: Availability, management and climate change. J. Hydrol. 2014, 519, 2538–2567. [Google Scholar] [CrossRef]
- WHO/UNICEF. Progress on Drinking Water and Sanitation: 2014 Update; World Health Organization: New York, NY, USA, 2014; ISBN 9241507241. [Google Scholar]
- Fuster, R.; Donoso, G. Rural Water Management. In Global Issues in Water Policy; Springer: Berlin, Germany, 2018; Volume 21, pp. 151–163. [Google Scholar]
- Muñoz, A.A.; Klock-Barría, K.; Alvarez-Garreton, C.; Aguilera-Betti, I.; González-Reyes, Á.; Lastra, J.A.; Chávez, R.O.; Barría, P.; Christie, D.; Rojas-Badilla, M.; et al. Water Crisis in Petorca Basin, Chile: The Combined Effects of a Mega-Drought and Water Management. Water 2020, 12, 648. [Google Scholar] [CrossRef]
- Lavrnić, S.; Zapater-Pereyra, M.; Mancini, M.L. Water Scarcity and Wastewater Reuse Standards in Southern Europe: Focus on Agriculture. Water. Air. Soil Pollut. 2017, 228, 1–12. [Google Scholar] [CrossRef]
- Maimon, A.; Gross, A. Greywater: Limitations and perspective. Curr. Opin. Environ. Sci. Health 2018, 2, 1–6. [Google Scholar] [CrossRef]
- Boyjoo, Y.; Pareek, V.K.; Ang, M. A review of greywater characteristics and treatment processes. Water Sci. Technol. 2013, 67, 1403–1424. [Google Scholar] [CrossRef] [PubMed]
- Allen, L.; Christian-Smith, J.; Palaniappan, M. Overview of greywater reuse: The potential of greywater systems to aid sustainable water management. Pac. Inst. 2010, 654, 19–21. [Google Scholar]
- Albalawneh, A.; Chang, T.-K. Review of the greywater and proposed greywater recycling scheme for agricultural irrigation reuses. Int. J. Res. 2015, 3, 16–35. [Google Scholar]
- Broschek, U.; Galleguillos, C.; Díaz, G.; Volker, K.; Vidal, C.; Jofré, S.; Papi, S.; Dourojeanni, A.; Mohando, A.; Sanchéz, F.; et al. Aguas Residuales como Nueva Fuente de Agua, Diagnóstico del Potencial Reúso de Aguas Residuales en la Región de Valparaíso; FCH: Valparaíso, Chile, 2016. [Google Scholar]
- Viera, O.; Malekpour, S. An analysis of adaptive planning capacity: The case of chilean water utilities. Util. Policy 2020, 65, 101064. [Google Scholar] [CrossRef]
- Diario Oficial de la República de Chile. Ley N° 21.075: Regula la Recolección, Reutilización y Disposición de Aguas Grises; FCH: Valparaiso, Chile, 2018. [Google Scholar]
- Oyarzún, R.; Oyarzún, J.; Fairley, J.P.; Núñez, J.; Gómez, N.; Arumí, J.L.; Maturana, H. A simple approach for the analysis of the structural-geologic control of groundwater in an arid rural, mid-mountain, granitic and volcanic-sedimentary terrain: The case of the Coquimbo Region, North-Central Chile. J. Arid Environ. 2017, 142, 31–35. [Google Scholar] [CrossRef]
- Montecinos, S.; Gutiérrez, J.R.; López-Cortés, F.; López, D. Climatic characteristics of the semi-arid Coquimbo Region in Chile. J. Arid Environ. 2016, 126, 7–11. [Google Scholar] [CrossRef]
- Explorador Climático (CR)2. Centro de Ciencias del Clima y la Resilencia. Available online: http://explorador.cr2.cl/ (accessed on 20 June 2020).
- Lajaunie, M.-L.; Scheierling, S.; Zuleta, J.; Chinarro, L.; Vazquez, V. Chile-Diagnóstico de la Gestión de los Recursos Hídricos; The World Bank: Washington, DC, WA, USA, 2011. [Google Scholar]
- MOP Estimación de la Demanda Actual, Proyecciones Futuras y Caracterización de la Calidad de los Recursos Hídricos en Chile; FCH: Santiago, Chile, 2017.
- Santibáñez Quezada, F. El cambio climático y los recursos hídricos de Chile. In Agricultura Chilena Reflexiones y Desafíos al 2030; Ministerio de Agricultura, Oficina de Estudios y Políticas Agrarias: Santiago, Chile, 2017; pp. 147–178. ISBN 978-956-7244-30-0. [Google Scholar]
- Şen, Z. Average Areal Precipitation by Percentage Weighted Polygon Method. J. Hydrol. Eng. 1998, 3, 69–72. [Google Scholar] [CrossRef]
- Marquínez, J.; Lastra, J.; García, P. Estimation models for precipitation in mountainous regions: The use of GIS and multivariate analysis. J. Hydrol. 2003, 270, 1–11. [Google Scholar] [CrossRef]
- Oyarzun, R.; Oyarzún, J.; Lillo, J.; Maturana, H.; Higueras, P. Mineral deposits and Cu-Zn-As dispersion-contamination in stream sediments from the semiarid Coquimbo Region, Chile. Environ. Geol. 2007, 53, 283–294. [Google Scholar] [CrossRef]
- Naheed, G.; Rasul, G. Investigation of rainfall variability for Pakistan. Pak. J. Meteorol 2011, 7, 25–32. [Google Scholar]
- Patil, V.V.; Toradmal, A.B. Assessment of Rainfall Variability trend in Solapur District of Maharashtra. Aegaeum J. 2020, 8, 234–241. [Google Scholar]
- Al-Ajmi, D.N. Climate aridity: The Sultanate of Oman as a case study. Int. J. Earth Sci. Geol. 2018, 1, 1–3. [Google Scholar] [CrossRef]
- Adnan, S.; Ullah, K.; Gao, S.; Khosa, A.H.; Wang, Z. Shifting of agro-climatic zones, their drought vulnerability, and precipitation and temperature trends in Pakistan. Int. J. Climatol. 2017, 37, 529–543. [Google Scholar] [CrossRef]
- Salinas, C.X.; Gironás, J.; Pinto, M. Water security as a challenge for the sustainability of La Serena-Coquimbo conurbation in northern Chile: Global perspectives and adaptation. Mitig. Adapt. Strateg. Glob. Chang. 2016, 21, 1235–1246. [Google Scholar] [CrossRef]
- Hurlbert, M.A. Case Study Coquimbo, Chile. In Adaptive Governance of Disaster; Springer: Berlin, Germany, 2018; pp. 143–167. [Google Scholar]
- Instituto Nacional de Estadísticas (INE). Análisis del Censo de Población y Vivienda 2017 Región de Coquimbo; INE: Santiago, Chile, 2019.
- Campisano, A.; Lupia, F. A dimensionless approach for the urban-scale evaluation of domestic rainwater harvesting systems for toilet flushing and garden irrigation. Urban. Water J. 2017, 14, 883–891. [Google Scholar] [CrossRef]
- Liu, S.; Butler, D.; Memon, F.; Makropoulos, C.; Wang, Q. Impact of system factors on the water saving efficiency of household grey water recycling. Desalin. Water Treat. 2010, 24, 226–235. [Google Scholar] [CrossRef]
- Superintendencia de Servicios Sanitarios Manual del Cliente. Available online: http://www.siss.gob.cl/577/articles-8797_manual_cliente.pdf (accessed on 20 July 2020).
- Cheng, C.L.; Hong, Y.T. Evaluating water utilization in primary schools. Build. Environ. 2004, 39, 837–845. [Google Scholar] [CrossRef]
- Farina, M.; Maglionico, M.; Pollastri, M.; Stojkov, I. Water consumptions in public schools. Procedia Eng. 2011, 21, 929–938. [Google Scholar] [CrossRef]
- Birks, R.; Hills, S. Characterisation of indicator organisms and pathogens in domestic greywater for Recyclin. Environ. Monit. Assess. 2007, 129, 61–69. [Google Scholar] [CrossRef]
- Birks, R.; Colbourne, J.; Hills, S.; Hobson, R. Microbiological water quality in a large in-building, water recycling facility. Water Sci. Technol. 2004, 50, 165–172. [Google Scholar] [CrossRef]
- Ghaitidak, D.M.; Yadav, K.D. Characteristics and treatment of greywater—A review. Environ. Sci. Pollut. Res. 2013, 20, 2795–2809. [Google Scholar] [CrossRef] [PubMed]
- Nolde, E. Greywater recycling systems in Germany—Results, experiences and guidelines. Water Sci. Technol. 2005, 51, 203–210. [Google Scholar] [CrossRef] [PubMed]
- March, J.G.; Gual, M.; Orozco, F. Experiences on greywater re-use for toilet flushing in a hotel (Mallorca, Island, Spain). Desalination 2004, 164, 241–247. [Google Scholar] [CrossRef]
- Mourad, K.A.; Berndtsson, J.C.; Berndtsson, R. Potential fresh water saving using greywater in toilet flushing in Syria. J. Environ. Manag. 2011, 92, 2447–2453. [Google Scholar] [CrossRef]
- Friedler, E.; Gilboa, Y. Performance of UV disinfection and the microbial quality of greywater effluent along a reuse system for toilet flushing. Sci. Total Environ. 2010, 408, 2109–2117. [Google Scholar] [CrossRef] [PubMed]
- Fountoulakis, M.S.; Markakis, N.; Petousi, I.; Manios, T. Single house on-site grey water treatment using a submerged membrane bioreactor for toilet flushing. Sci. Total Environ. 2016, 551–552, 706–711. [Google Scholar] [CrossRef]
- Godfrey, S.; Labhasetwar, P.; Wate, S.; Jimenez, B. Safe greywater reuse to augment water supply and provide sanitation in semi-arid areas of rural India. Water Sci. Technol. 2010, 62, 1296–1303. [Google Scholar] [CrossRef][Green Version]
- Godfrey, S.; Labhasetwar, P.; Wate, S. Greywater reuse in residential schools in Madhya Pradesh, India-A case study of cost-benefit analysis. Resour. Conserv. Recycl. 2009, 53, 287–293. [Google Scholar] [CrossRef]
- INE. Síntesis de Resultados CENSO 2017; INE: Santiago, Chile, 2018.
- Christova-Boal, D.; Eden, R.E.; McFarlane, S. An investigation into greywater reuse for urban residential properties. Desalination 1996, 106, 391–397. [Google Scholar] [CrossRef]
- Prathapar, S.A.; Jamrah, A.; Ahmed, M.; Al Adawi, S.; Al Sidairi, S.; Al Harassi, A. Overcoming constraints in treated greywater reuse in Oman. Desalination 2005, 186, 177–186. [Google Scholar] [CrossRef]
- Mandal, D.; Labhasetwar, P.; Dhone, S.; Dubey, A.S.; Shinde, G.; Wate, S. Water conservation due to greywater treatment and reuse in urban setting with specific context to developing countries. Resour. Conserv. Recycl. 2011, 55, 356–361. [Google Scholar] [CrossRef]
- Li, Z.; Boyle, F.; Reynolds, A. Rainwater harvesting and greywater treatment systems for domestic application in Ireland. Desalination 2010, 260, 1–8. [Google Scholar] [CrossRef]
- Krozer, Y.; Hophmayer-Tokich, S.; van Meerendonk, H.; Tijsma, S.; Vos, E. Innovations in the water chain—experiences in The Netherlands. J. Clean. Prod. 2010, 18, 439–446. [Google Scholar] [CrossRef]
- Revitt, D.M.; Eriksson, E.; Donner, E. The implications of household greywater treatment and reuse for municipal wastewater flows and micropollutant loads. Water Res. 2011, 45, 1549–1560. [Google Scholar] [CrossRef]
- Yerri, S.; Piratla, K.R. Decentralized water reuse planning: Evaluation of life cycle costs and benefits. Resour. Conserv. Recycl. 2019, 141, 339–346. [Google Scholar] [CrossRef]
- Bravo, M.B. Contexto legal: Reutilización de aguas grises. SustentaBiT 2011, 11, 34–38. [Google Scholar]
- Dalahmeh, S.S.; Assayed, M.; Suleiman, W.T. Themes of stakeholder participation in greywater management in rural communities in Jordan. Desalination 2009, 243, 159–169. [Google Scholar] [CrossRef][Green Version]
Publisher’s Note: MDPI stays neutral with regard to jurisdictional claims in published maps and institutional affiliations. |
© 2020 by the authors. Licensee MDPI, Basel, Switzerland. This article is an open access article distributed under the terms and conditions of the Creative Commons Attribution (CC BY) license (http://creativecommons.org/licenses/by/4.0/).