Article

Removal of Diclofenac in Effluent of Sewage Treatment Plant by Photocatalytic Oxidation

1
School of Energy and Environmental Engineering, University of Science and Technology Beijing, 30 Xueyuan Road, Beijing 100083, China
2
Water Reclamation Plant at Future Sci-Tech City, Beijing Changping District Water Authority, Beijing 102209, China
*
Authors to whom correspondence should be addressed.
Water 2020, 12(10), 2902; https://doi.org/10.3390/w12102902
Submission received: 24 August 2020 / Revised: 11 October 2020 / Accepted: 15 October 2020 / Published: 17 October 2020
(This article belongs to the Section Wastewater Treatment and Reuse)

Abstract

:
Diclofenac (DCF) has been widely found in sewage treatment plants and environmental water bodies, and has attracted worldwide attention. In this paper, the photocatalytic degradation of DCF was investigated using a laboratory-scale simulated solar experimental device. This study focused on exploring the effects of the actual secondary effluent from sewage treatment plants (SE-A and SE-B) on the photocatalytic degradation of DCF and the changes of dissolved organic matter (DOM) during the photocatalytic degradation process. The results showed when SE-A and SE-B were used as the background water of the DCF solution, they displayed a significant inhibitory effect on the degradation of DCF, and the values of k were 0.039 and 0.0113 min−1, respectively. Among them, DOM played a major inhibitory role in photocatalytic degradation of DCF in sewage. In the photocatalytic process, the biological toxicity of the DCF solution was the least after 30 min of reaction, and then gradually increased. Furthermore, the organic matters in the sewage were greatly degraded after the photocatalytic reaction, including 254 and 365 nm ultraviolet (UV254, UV365) and chemical oxygen demand (COD). Moreover, titanium dioxide (TiO2) first catalyzed the degradation of macromolecular organic matters, and then degraded the small molecular organic matters.

1. Introduction

Pharmaceuticals and personal care products (PPCPs) have been regarded as one of the most serious environmental problems in recent years, due to their potential negative impact on aquatic ecosystems and human health [1,2]. PPCPs include a series of organic compounds, such as non-steroidal anti-inflammatory drugs, antibiotics, hormones, fragrances, and cosmetics. Diclofenac (DCF) is a typical PPCP with anti-inflammatory, analgesic, and antipyretic effects. DCF has been widely detected in the effluent of sewage treatment plants, rivers, lakes, and other environmental water bodies and has attracted attention around the world [3,4]. Currently, DCF is widely used in the pharmaceutical industry, which consumes approximately 940 tons globally each year. DCF is difficult to degrade completely through conventional water treatment processes, such as the activated sludge or anaerobic fermentation process [5,6]. Most of the removal rates of DCF in wastewater from sewage treatment plants were below 40% [7], which led to the cumulative concentration of DCF in the effluent and receiving waters of some sewage plants reaching g/L. DCF could have a negative effect on the growth of terrestrial animals, and aquatic organisms, and bring potential harm to human health. Reportedly, an increase in the amount of DCF will change the activity of biological mitochondria and the DNA, especially for aquatic organisms [8]. For example, 1 μg/L of DCF can cause the kidney failure of Indian vultures or change the gills of rainbow trout [9], affect the early embryonic development of marine bivalve mussels [10], and cause tissue damage in fish.
In the past few years, advanced oxidation processes (AOPs) have attracted broad attention because of their high efficiency in degrading various refractory organics. Ozonation, ultraviolet oxidation, and photocatalysis are the most researched AOPs [11,12,13,14]. Among them, photocatalytic technology has a great potential in treating organic monomers due to its indicators, and environmental protection and sustainability advantages [15,16,17]. Photocatalytic technology destroys organic pollutants in drinking water or sewage by oxidizing free radicals and reducing hydration electrons (eaq) [18]. Titanium dioxide (TiO2) is considered an excellent photocatalytic material because of its biological properties, chemical inertness, high efficiency, low cost, and non-toxicity [19]. TiO2 can promote the photocatalytic degradation of various organic micro-pollutants in the aqueous solution through oxidation processes (for example, the formation of hydroxyl radicals [OH] and superoxide radicals [O2−]) at the appropriate wavelength (λ < 380 nm) [20,21,22,23]. In addition, the two-phase TiO2 composed of anatase and rutile, which exhibits a higher photocatalytic activity than the single-phase TiO2 anatase. The enhanced photocatalytic activity of this two-phase TiO2 was ascribed to the interfacial charge transfer from the anatase conduction band to the rutile, which promotes the photo-induced charge separation [24,25]. P25 is a highly dispersed gas phase nanometer TiO2 composed of anatase and rutile, which has been widely used in industry to degrade DCF. Achilleo et al. [26] studied the factors affecting the decomposition of DCF in water by UV-A/TiO2 photocatalysis, using six different commercially available TiO2 samples, and found that the Degussa P25 is the most effective for degrading DCF.
Inorganic ions and dissolved organic matter (DOM) are significant factors affecting the photocatalytic degradation ability for various PPCPs [27] depending on their properties, and concentration and the acidity of the solution. DOMs could scavenge OH to inhibit degradation, compete for adsorption on the surface of the catalyst [28] and quench AOPs [29]. However, few studies have systematically discussed the impact of actual sewage on the photocatalytic degradation of DCF. Many inorganic ions and DOM are present in actual sewage, affecting the photocatalytic degradation of organic pollutants. Thus, the effect of DOM on the degradation of DCF in actual sewage must be investigated.
In this study, the photocatalytic degradation of DCF by adding TiO2 in the secondary effluent from two sewage treatment plants was studied. The effects of the actual effluent sewage on the photocatalytic degradation of DCF were investigated through the analysis of the degradation efficiency of DCF, the influence of dissolved substance, and the change in biological toxicity. Furthermore, various indicators, including chemical oxygen demand (COD), total organic carbon (TOC), three-dimensional fluorescence, ultraviolet-visible light spectrum analysis, and molecular weight, were used to analyze the organic matter in the sewage during the photocatalysis process.

2. Material and Methods

2.1. Material and Reagents

TiO2 (Aeroxide® P25, Degussa-Evonik, Germany) was used as the photocatalyst without any pretreatment. DCF (C14H11Cl2NO2, CAS: 15307-86-5, analytical grade, purity ≥ 99.0%) was purchased from American Sigma-Aldrich Company. HPLC-grade water was obtained from Watsons Water. In the HPLC analyses, formic acid (HCOOH, p.a.) and acetonitrile (CH−3CN, HPLC-grade), which obtained from Sinopharm Chemical Reagent Co., Ltd. Shanghai, China, were used as components of the mobile phases. Sodium-type 732 cation exchange resin and chlorinated 717 anion exchange resin (Soleibao Technology Co., Ltd., Beijing, China, >95%) were used to exchange and remove cations and anions in actual sewage, respectively.
In this study, two different secondary effluents from two sewage treatment plants were selected to explore the changes in organic matters and their impact on the degradation of DCF in the photocatalytic process. The secondary effluents from sewage treatment plants A and B are referred to as SE-A and SE-B, respectively. The water quality indicators of SE-A and SE-B are respectively shown in Table 1 and Table 2, and meet the level A standard of discharge standard for pollutants form municipal sewage treatment plants in China (GB 18918-2002). The comparison of various water quality indicators, shows that the pH, COD, total nitrogen (TN), total phosphorus (TP), and ammonia nitrogen (NH3−N) values of SE-A are higher than those of SE-B. This may because the sewage quality of plant A is more complicated than that of plant B, since plant A contains a certain proportion of industrial water. The main anion ions in both effluents are Cl-, NO3-, and SO42-, and the chromatography contents of these three anion ions are roughly similar.

2.2. Photocatalytic Degradation Experiment

In the photodegradation experiment, the initial concentration of DCF was set to 10 mg/L, and a BL-GHX-V multifunctional photochemical reactor (a xenon lamp with power of 1000 W), which has a similar solar radiation spectrum energy distribution, was used as the light source (Figure 1). An air-cooling system and a circulating condensate water device were used to control the temperature of the reaction environment during the experiment (25 ± 0.5 °C). A dark reaction was carried out first for a period until the adsorption equilibrium was established to eliminate the influence of TiO2 adsorption on the degradation of DCF. During the degradation process, 1000-μL samples were taken at a fixed time.
During the entire experimental procedure, samples were taken at fixed times, filtered through a 0.22-μm filter (Durapore-PVDF-Millipore), and stored at room temperature. Subsequently, the suspensions were analyzed consecutively by HPLC to measure the DCF concentration. In addition, the suspensions were used to analyze other indicators, including the DOM, the biological toxicity, the absorbance of UV254 and UV365, the three-dimensional fluorescence, and the apparent molecular weight (AMW).
After each experiment, TiO2 was recovered from the solution and washed with ethanol and deionized water to remove impurities on the surface. The TiO2 was separated by a centrifuge and dried in an oven at 50 °C. The experiment was repeated five times to ensure the repeatability of TiO2.
Analysis was performed with three parallel samples throughout the procedure. The data are expressed as the average value.

2.3. Analytical Methods

The concentration of DCF was determined by HPLC (Shimadzu, Kyoto City, Japan) using a C18 RP trace Extrasil OD52-5 Micromet 25 × 0.46 Teknockloma column, and a Waters 996 photodiode array detector, and the Empower Pro software 2002 (Water Co). The DCF samples (20 μL) were injected into the C18 column. The determination conditions of HPLC were adopted at an absorbance of 276 nm, and the retention time for the DCF samples was 7.8 min. Furthermore, acetonitrile and 0.1% glacial acetic acid (75:25 v/v) were used as the constituents of the mobile phases at 0.8 mL/min. The DCF concentration was quantified by the external standard peak area method.
The conventional indicators in sewage, including COD, TN, TP, and NH3-N were measured by the dichromate, alkaline potassium persulfate digestion UV spectrophotometer, ammonium molybdate spectrophotometer, and Nessler’s reagent colorimeter methods, respectively.
Three-dimensional fluorescence was used to determine the changes in the organic matters of the secondary effluent during the photocatalytic process. The reaction was measured at a 1 cm four-way quartz fluorescence cuvette scanning speed of 12,000 nm/min, a date interval of 2.0 nm, an excitation light bandwidth of 3.0 nm and emission light bandwidth of 3.0 nm. The excitation wavelength (Ex) was 200–500 nm, and the emission wavelength (Em) was 300–600 nm.
The AMW of DOM in the sewage was measured at 260 nm using a Shimadzu high performance size exclu-sion chromatography (HPSEC) UV detector. The 100-μL solution was added into a Shodex kw 802.5 size exclusion chromatography column (effective separation range of 50–50,000 Da) and measured using a 0.1 mol/L phosphate solution as the mobile phase with a flow rate of 1 mL/min.
Microtox biological toxicity test technology (Modern Water M500, Modern Wate, UK) may quickly test the toxicity of the sample solution through Vibrio fischeri freeze, which is a kind of luminous bacteria. EC50 is the concentration of a half effective inhibitory, indicating the concentration of the sample solution when the light intensity of Vibrio fischeri is reduced by half. The smaller the EC50 is, the more toxic the solution is.

3. Results and Discussion

3.1. Photocatalytic Oxidation of DCF in Secondary Effluent

First of all, the photolysis experiment was carried out to determine the effect of photocatalytic degradation on DCF removal. Figure 2 shows the removal effect of photocatalytic and photocatalysis on DCF. In the photolysis process without photocatalyst, the removal effect of DCF was low, indicating that the addition of photocatalyst was necessary [30,31].

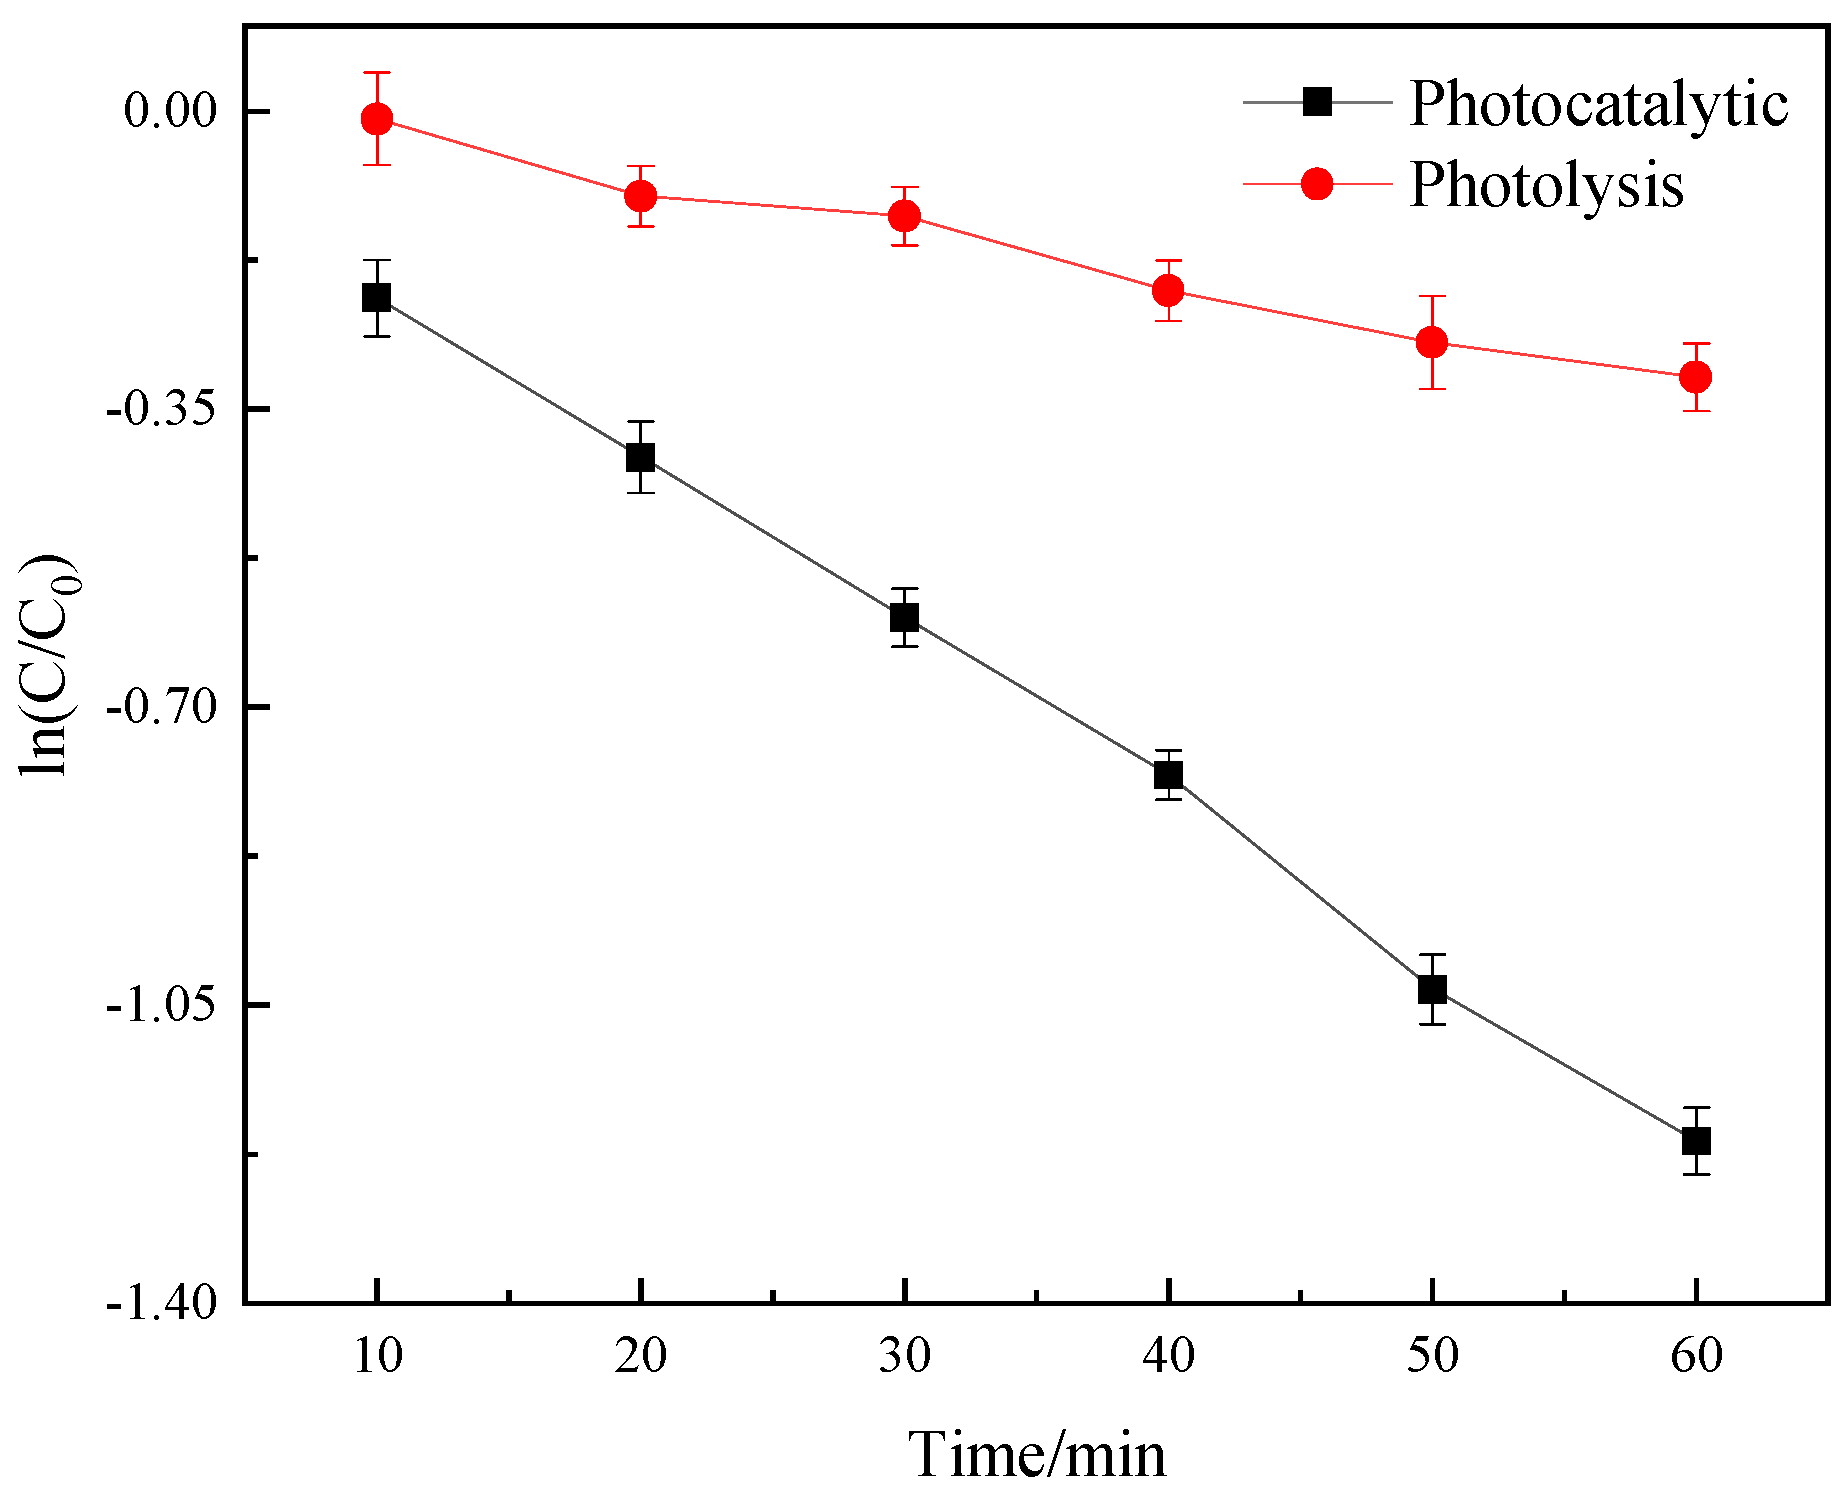
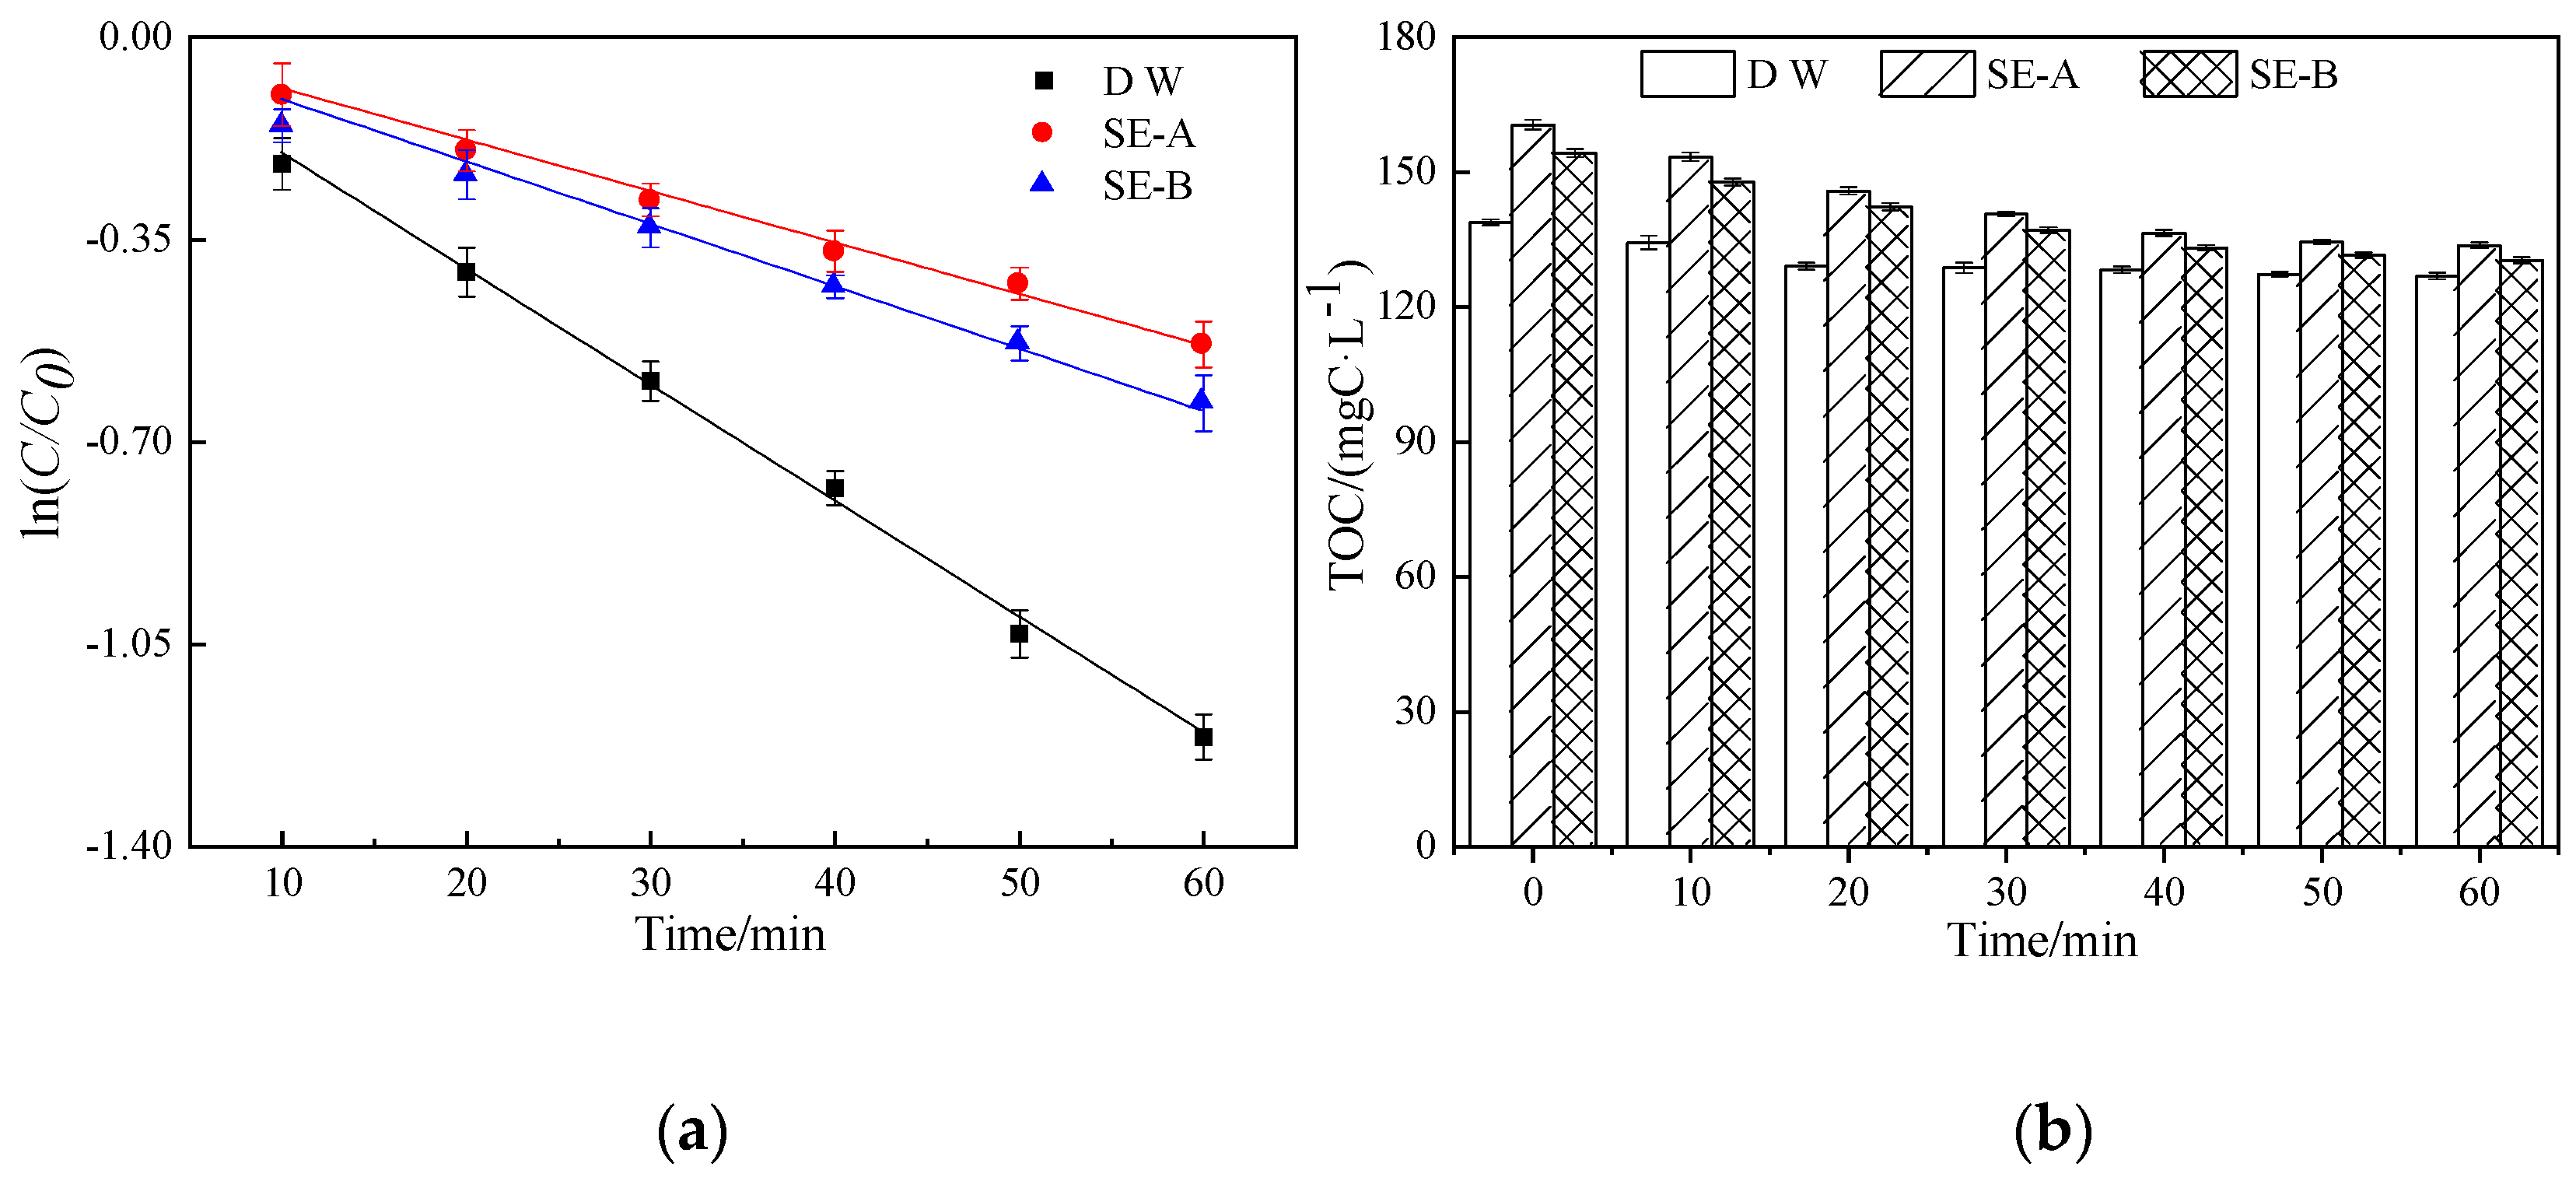
3.1.1. Degradation of DCF in SE-A and SE-B

To explore the effect of actual water on the photocatalytic degradation of DCF, the filtered SE-A and SE-B were used as background water to prepare the DCF solution.
The degradation of DCF is shown in Figure 3a. Photocatalysis has an obvious removal effect on DCF, especially in the solution with deionized water as the background water, and this finding is consistent with those of other scholars [32,33].Compared with the DCF solution with deionized water as the background water, the DCF solution with SE-A and SE-B as the background water had a significant inhibitory effect on the degradation of DCF, and the values of k were 0.039 and 0.0113 min−1, respectively. These results indicate that the composite components have a significant inhibitory effect on the degradation of DCF in the actual sewage [34]. Figure 3b shows the change in the value of TOC in different DCF solutions. The results show that the initial TOC of the DCF solution with the actual sewage as the background water was 160.5 mgC/L on average, and the concentration of TOC decreased to 133.7 mgC/L after 1 h of photocatalytic degradation, indicating that the degradation rate of TOC was 16.7%, which was higher than that of the DCF solution with deionized water as the background water (8.59%). These results indicate that DOM has a strong light absorption ability and can compete with the target compound for photoelectrons and active sites, thereby reducing the removal rate of the target pollutant in the actual sewage [35].

3.1.2. Effects of DOM, Anion, and Cation

The secondary effluent may have a complex impact on photocatalytic degradation when used as the background water, because it contains various anions, cations, and DOM [36,37]. Thus, the effect of anions, cation, and DOM on the photocatalytic degradation of DCF was investigated. First, the organics in the sewage were removed by H2O2, and then the sewage was passed through an anion and cation exchange resin to obtain anion and cation removal water samples. The anion was of Cl type and the cation was of Na type, because these two ions were verified in the preliminary experiment to have no effect on the degradation of DCF [38]. Therefore, a water sample (containing anions and cations without organic, called W-A), de-anion water samples (anions only was Cl, called W-B), and de-cation water sample (the cation was only Na+, called W-C). Above three water samples were used as the background water of the DCF solution, and deionized water was used as the control, to explore the effect of these three water samples on the photocatalytic degradation of DCF. The results are shown in Figure 4.
The DCF in all solutions was nearly completely degraded after 150 min of photocatalytic reaction. When the degradation was 60 min, the removal rates of DCF in SE-A as background water was 70.4%, and the removal rate of W-A, W-B, W-C, and deionized water were 91.6, 94.2, 94.3, and 98.5%, respectively. The removal rate of DCF in W-A was 21.2% higher than that under the SE-A water condition. Additionally, the removal rates of W-B and W-C were very close and near the removal rate of deionized water condition. Thus, DOM had the main inhibitory effect on the photocatalytic degradation of DCF in sewage, which is consistent with the finding above. Furthermore, the inhibitory effects of anions and cations in the sewage on degradation were nearly the same.
The above data indicate that although the DOM in the SE-A showed an inhibitory effect on the removal of DCF during the photocatalytic process, the DCF in all background water solutions was basically removed after 150 min of photocatalytic reaction [39]. Therefore, photocatalytic technology can be applied to the tertiary treatment of secondary effluent in sewage treatment plants, and can achieve a good removal effect on DCF.

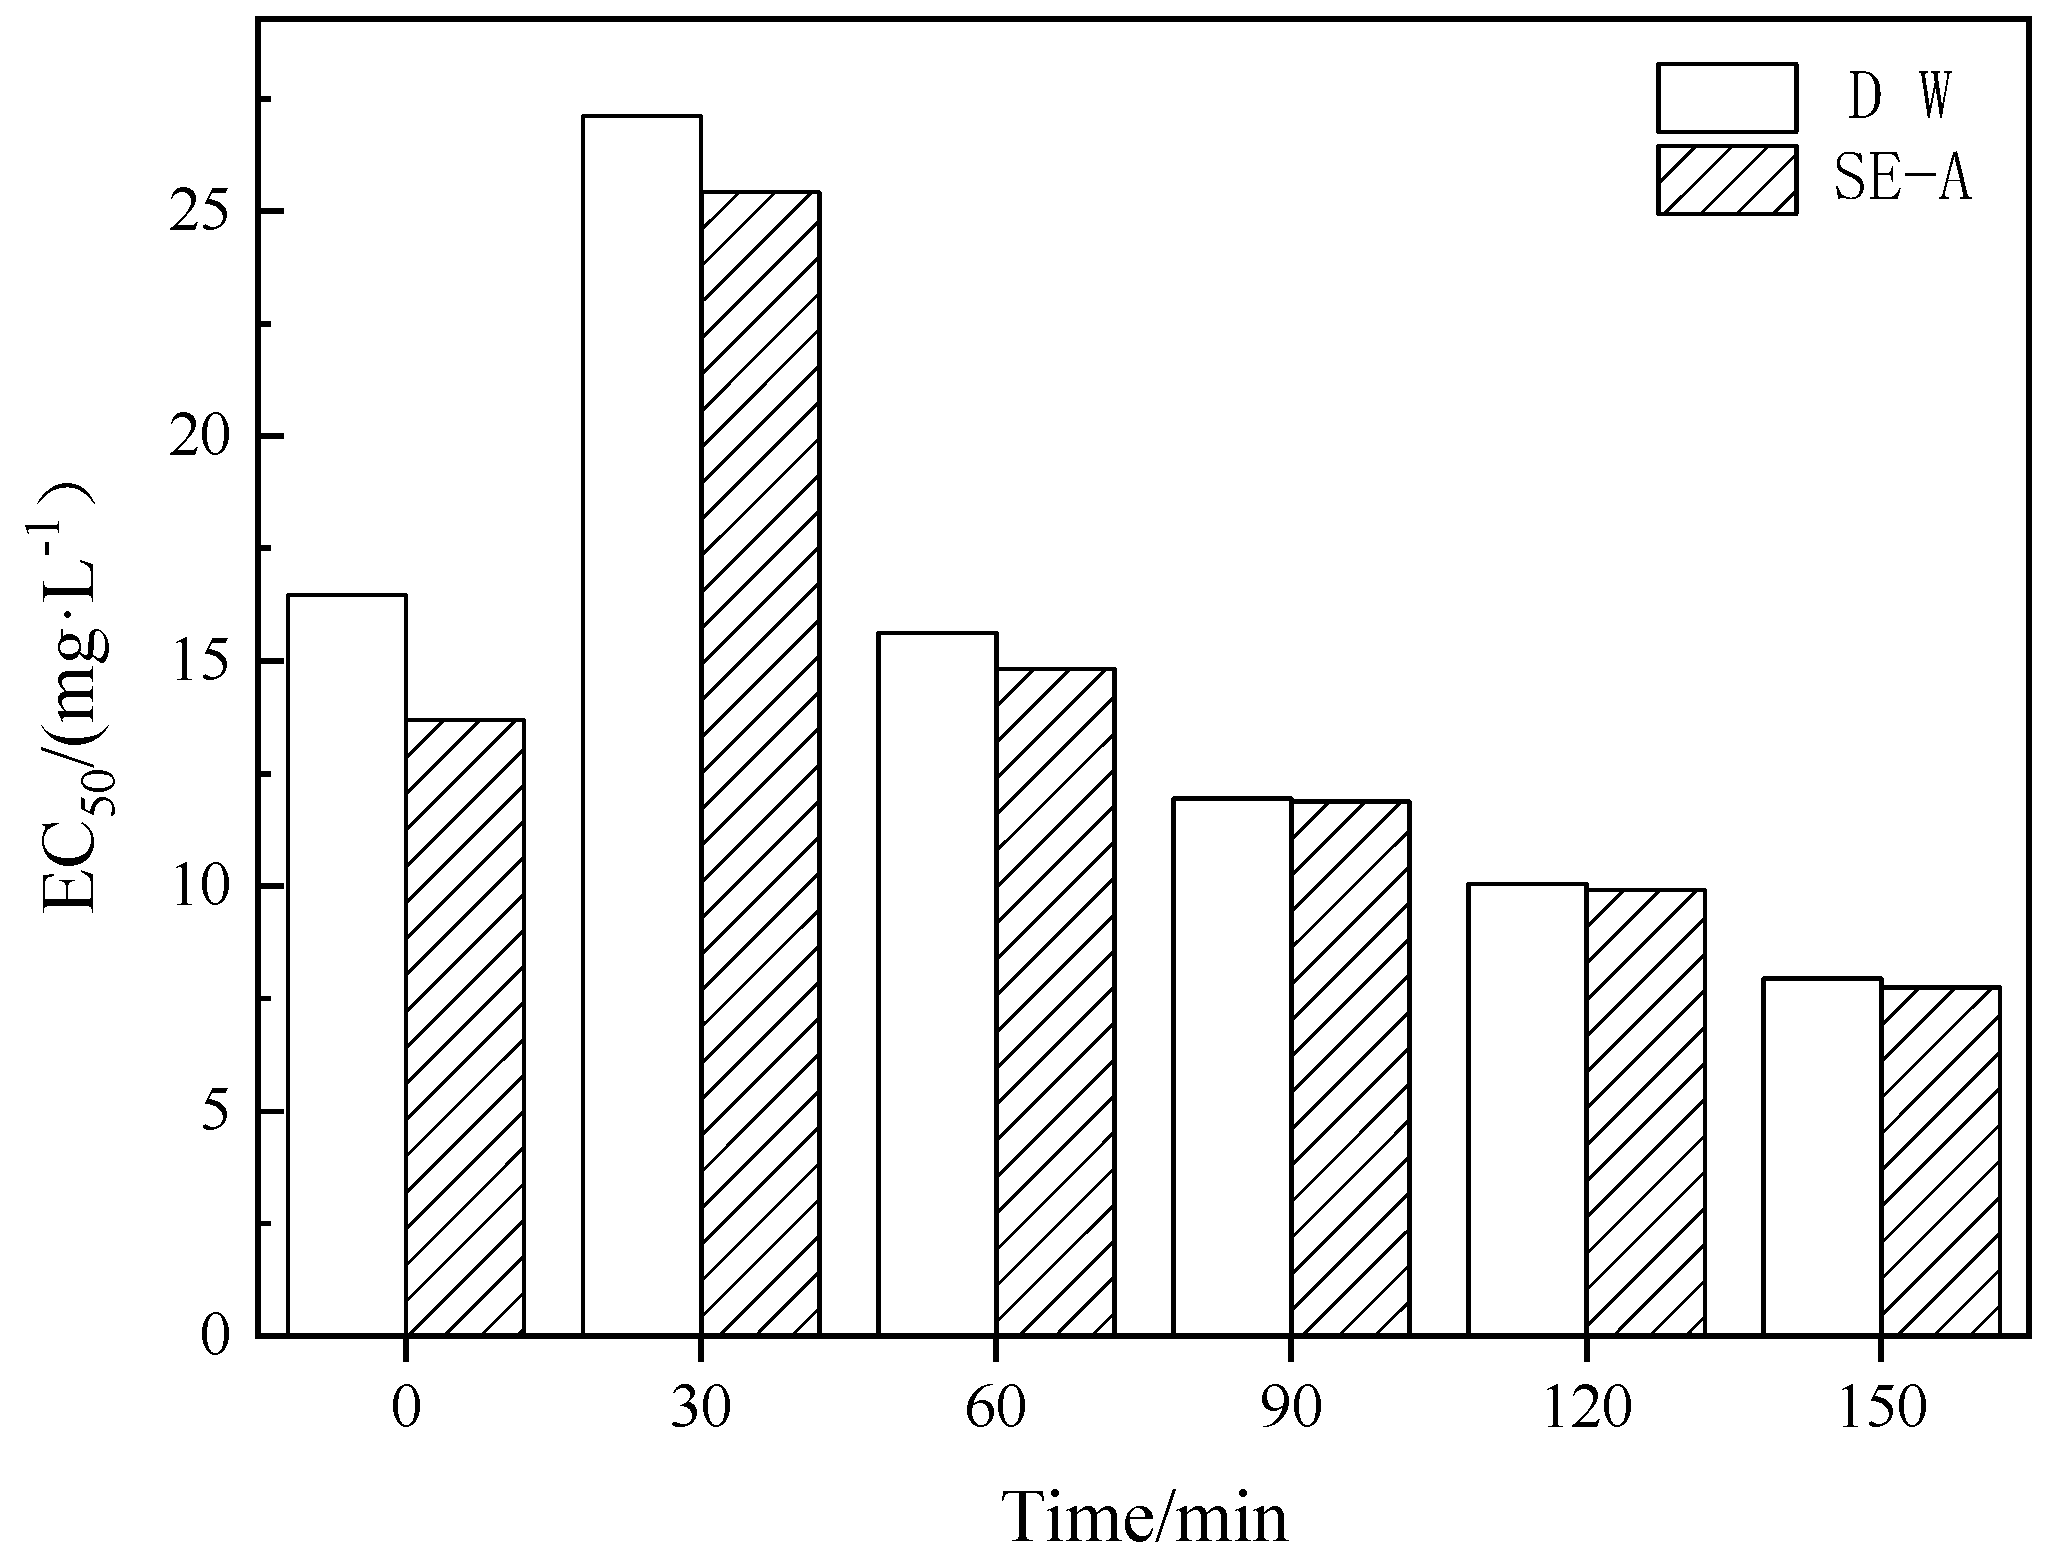
3.1.3. Biological Toxicities of DCF

The intermediate products were very complicated in the process of photocatalytic degradation, requiring the further detection of the toxicity of luminescent bacteria to explore the toxicity changes of DCF in the process of photocatalysis under the influence of actual sewage. Given that SE-A had a more significant impact on the photocatalytic degradation of DCF, it was used as the background water of DCF for investigation in the succeeding experiments. As shown in Figure 5, the EC50 of the DCF solution under deionized water as the background was 16.48 mg/L, and the EC50 under SE-A as the background was 13.69 mg/L before degradation, indicating that SE-A has a certain biological toxicity. The trends of the changes in toxicity in both background waters were roughly the same, and the toxicity of the solution reached the lowest value after 30 min of photocatalysis. Then, the toxicity of the sample began to increase, and the EC50 continued to decrease. Generally, the increase of toxicity in the DCF solution can be attributed to the possible photodissolution of the photocatalyst [40], the possible generation of more toxic by-products than parental compounds [41], or the synergetic toxic effects from the presence of many individual contaminants in the sewage. However, the toxicity of both DCF solutions gradually approached as the degradation reaction progressed, indicating that the more complex inorganic and organic substances in the sewage had fewer toxic effects on the DCF solution with the photocatalytic process.

3.2. Characteristics of DOM During Photocatalytic Degradation

The characteristics of the secondary effluent will change during the photocatalytic degradation process, especially the DOM [42,43]. Therefore, the investigation of the changes of DOM in the secondary effluent during photocatalytic degradation is important to obtain a better understanding of the regularity of DOM degradation.

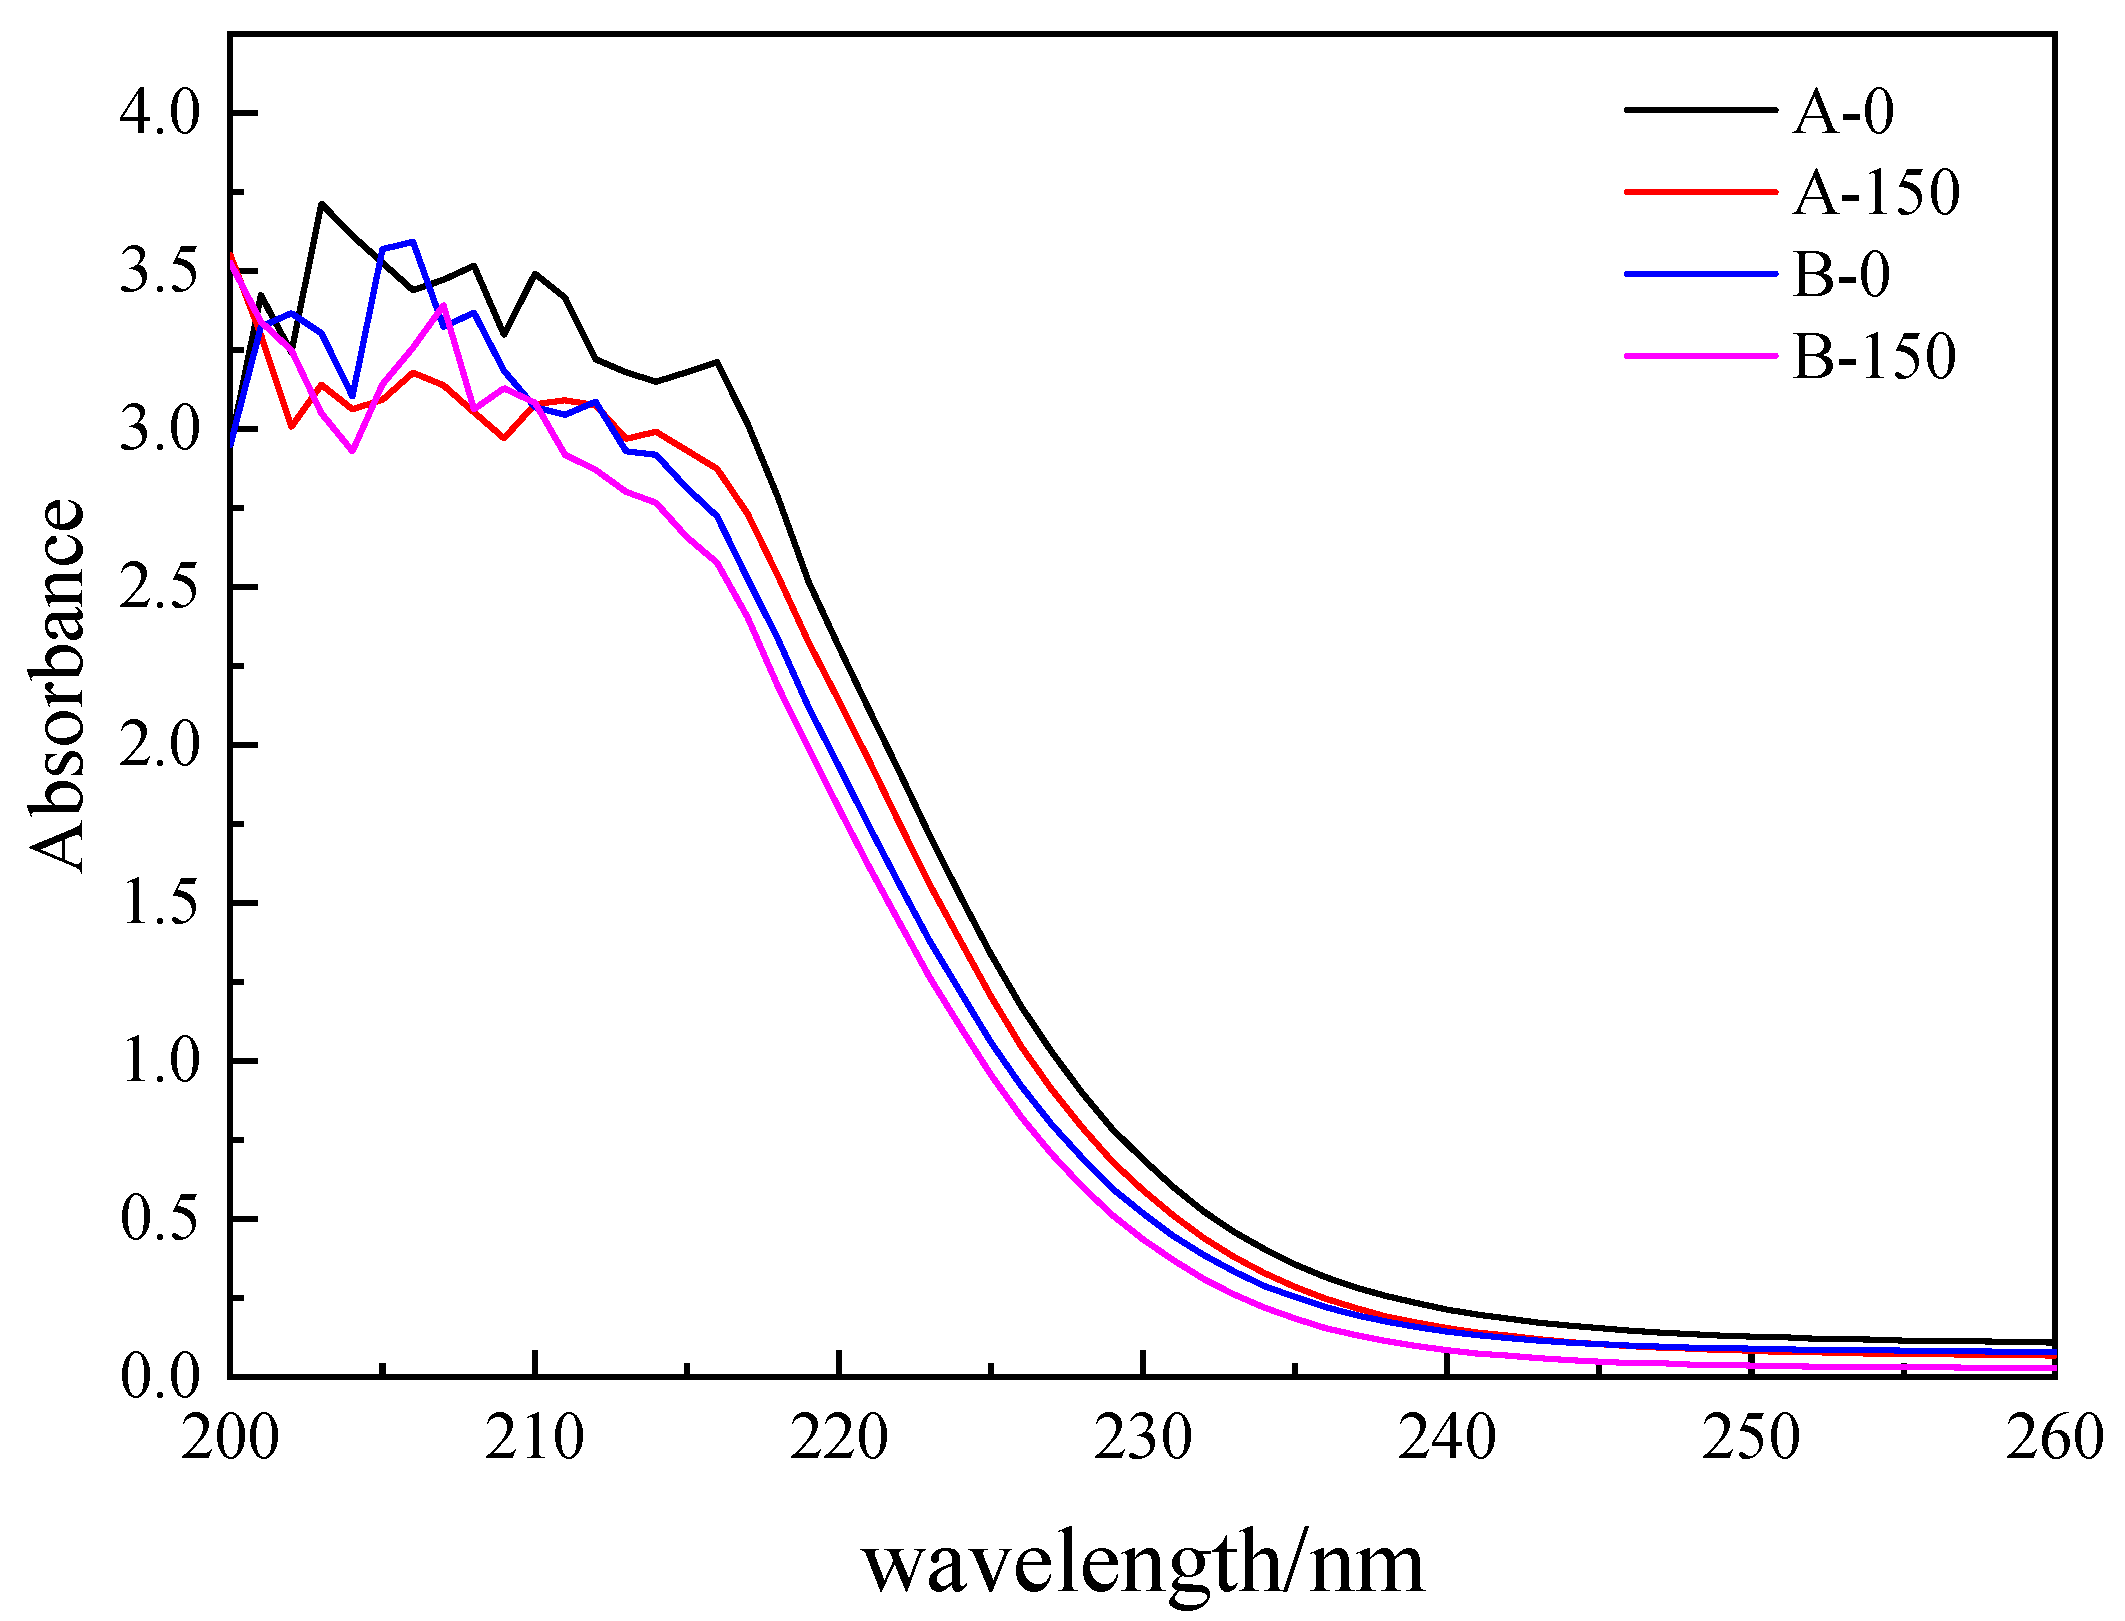
3.2.1. COD, UV254 and UV365

COD and TOC are common indicators for evaluating DOMs in sewage, but their detection requires a significant amount of time and is expensive. UV254 and UV365 were the absorbance at 254 and 365 nm by the ultraviolet-visible light spectrum. Studies have shown that UV254 and UV365 have a certain correlation with the COD in sewage and can indirectly reflect the degree of organic matters pollution [44].
Figure 6 shows the changes in UV254, UV365, COD, and correlation analysis after the photocatalytic degradation in SE-A and SE-B. UV254 and UV365 refer to the determination of DOM in water at ultraviolet wavelengths of 254 and 365, respectively, and their extinction values could indirectly reflect the degree of organic pollution in the water. The degradation rates of UV254 and UV365 are respectively shown in Figure 6a,b. The absorbance values of UV254 and UV365 decreased to a certain extent under photocatalytic conditions, especially the UV365 in SE-B, whose absorbance of UV365 was reduced by approximately 83% when the reaction time was 150 min. The initial COD values of SE-A and SE-B were 36.24 and 21.84 mg/L, respectively. Moreover, the final total degradation rates of COD were 33.74% and 58.8% after 150 min of photocatalysis in SE-A and SE-B, respectively (Figure 6c,d). These results all show that DOM was reduced during the photocatalytic degradation of DCF in the sewage. Furthermore, Figure 6e,f reveal the correlation between COD and UV254 and UV365. The correlation coefficients of UV254 and UV365 with the COD value were 0.5057 and 0.7441 in SE-A, respectively, displaying a poor correlation. Moreover, the variation trends of UV254 and COD were highly consistent in SE-B, and the correlation coefficient reached 0.95089, indicating the significant correlation of UV254 with COD [45]. Hence, UV254 could be used as an indicator to predict the effect of COD degradation, which would greatly save in detection time and reduce costs in the industry, and provide data support and technical preparations for future automated online inspections.
Figure 7 shows the UV-Vis absorption spectra during the photocatalytic reaction of SE-A and SE-B. The absorption spectra of the two effluents after the photocatalytic reaction were significantly lower than those before the reaction. According to related research [46], the relative position of the absorption spectrum curve of different waters with a wavelength exceeding 226 nm could basically reflect the DOM content. In this study, the spectra of both effluents decreased significantly after the photocatalytic reaction, which meant that the DOM of SE-A and SE-B decreased after 150 min of photocatalytic reaction.

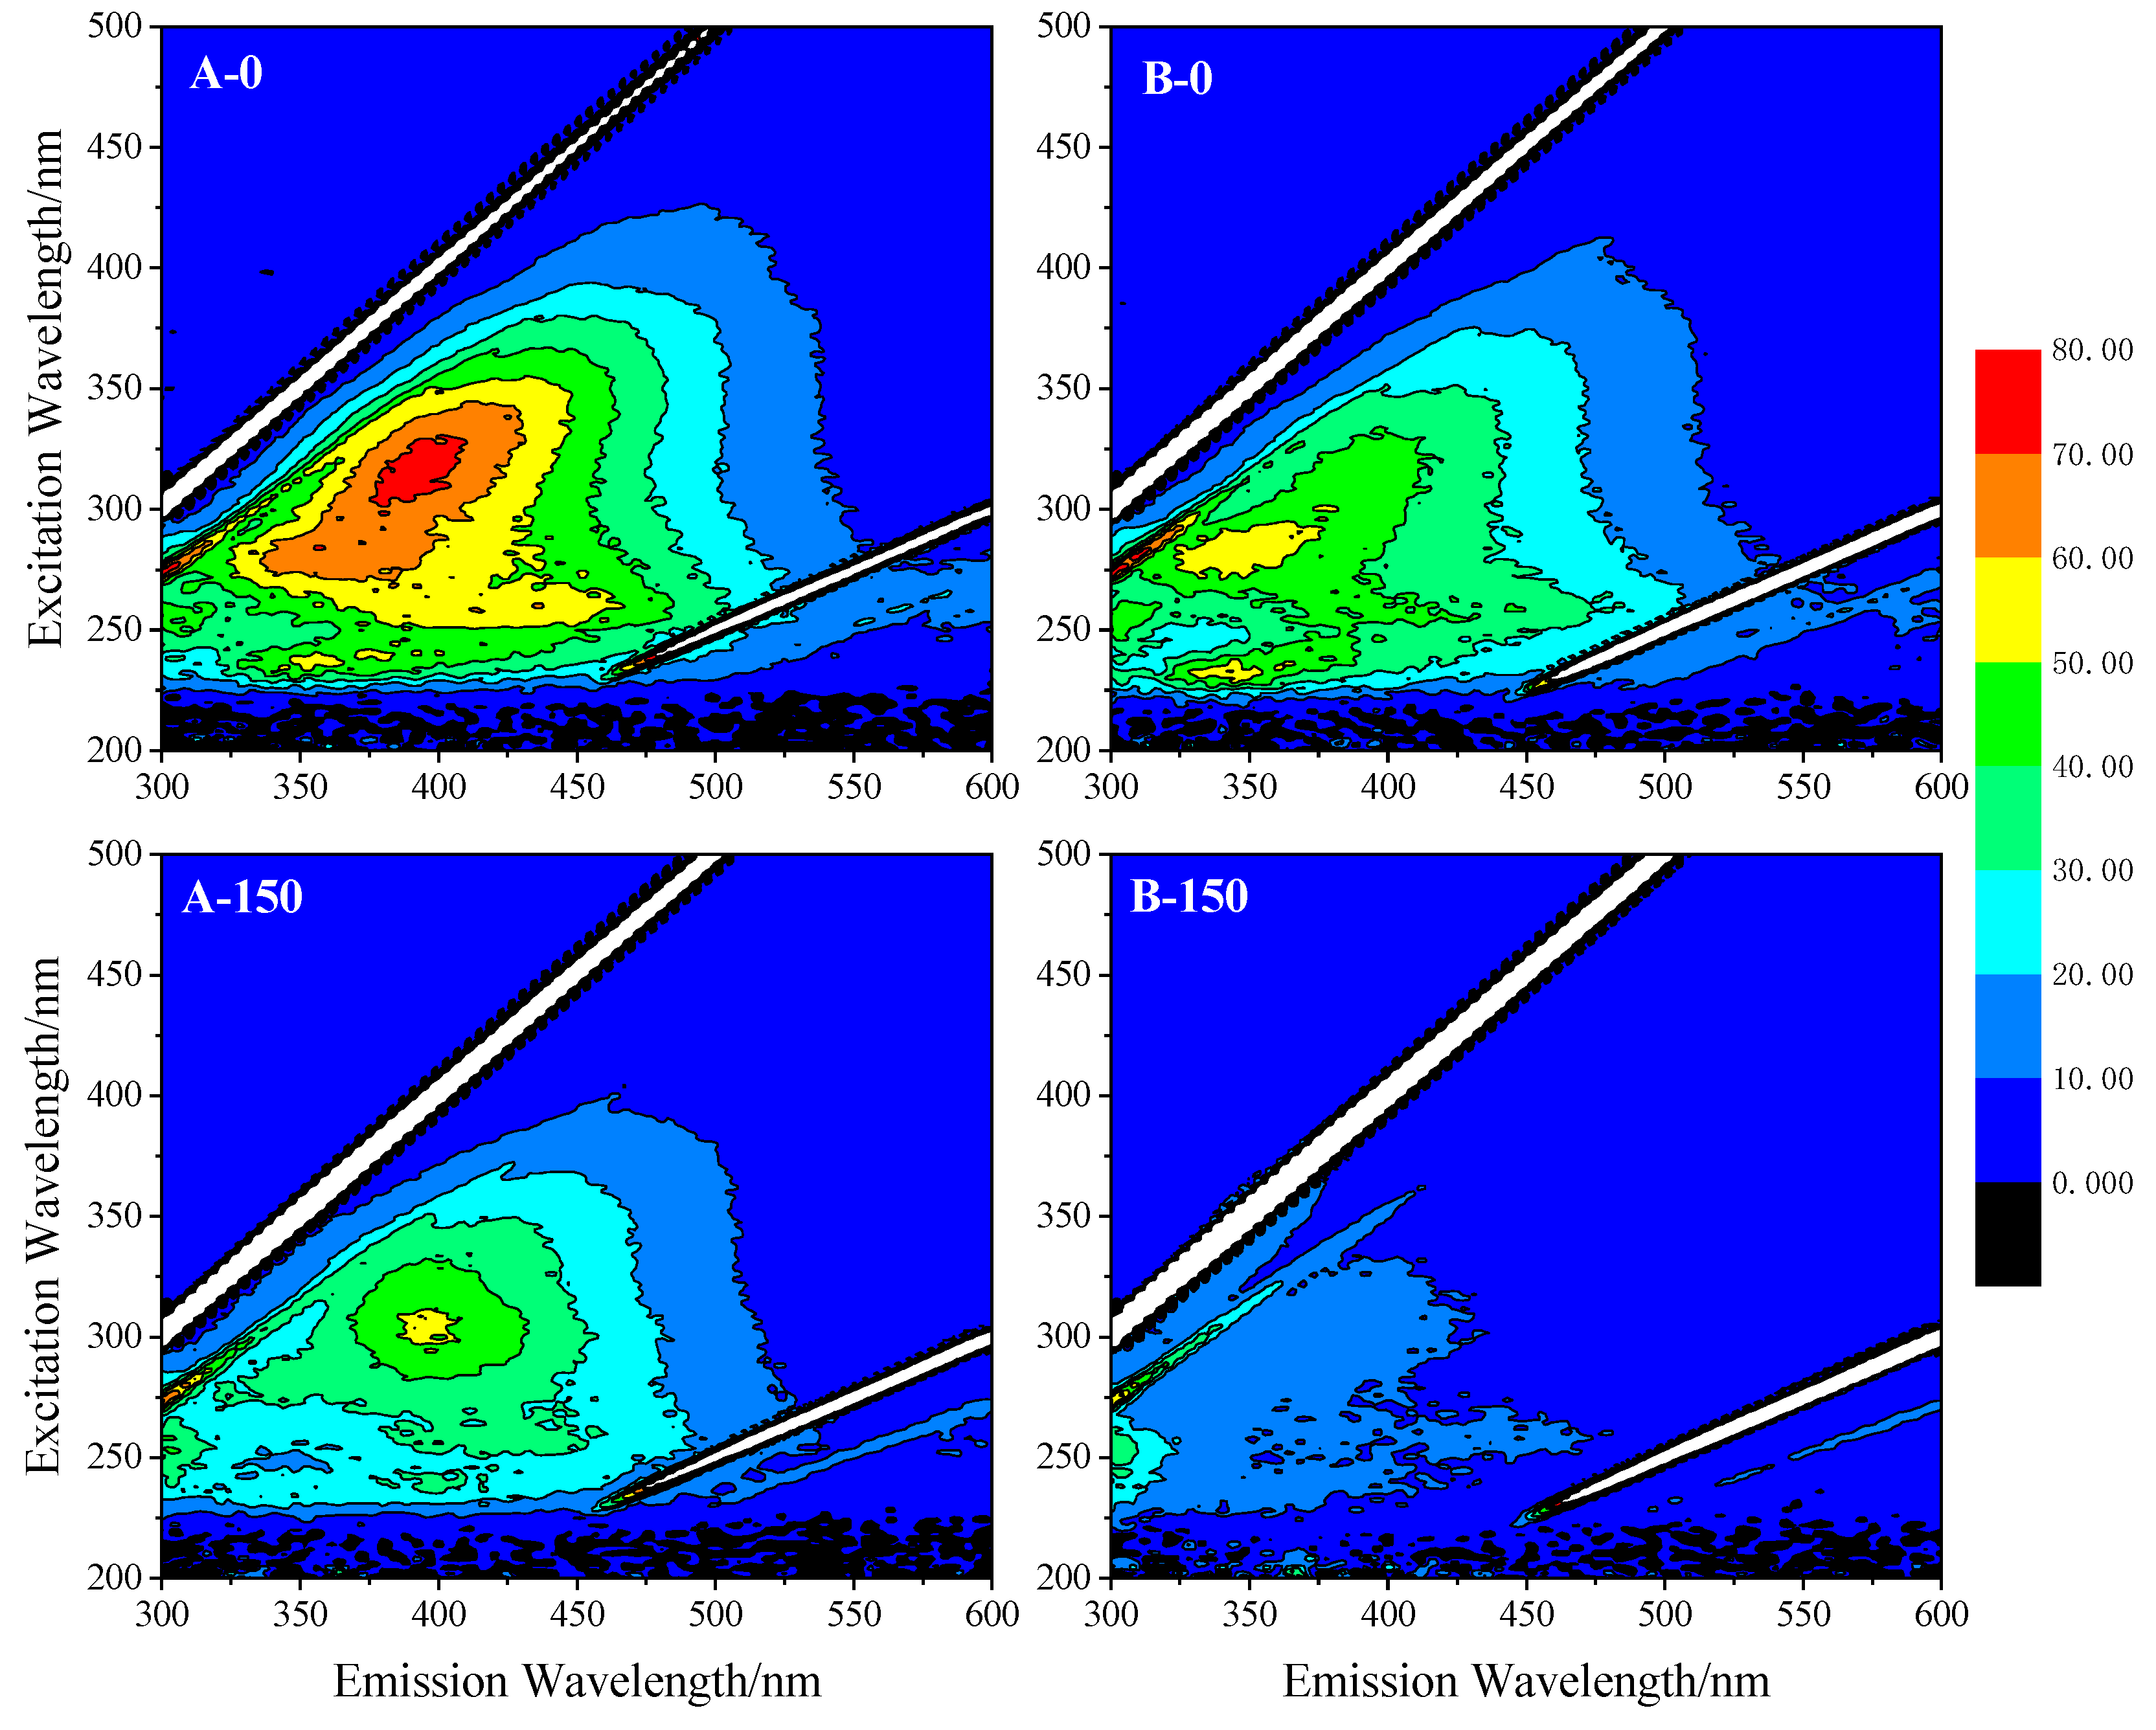
3.2.2. Three-Dimensional Fluorescence of DOM
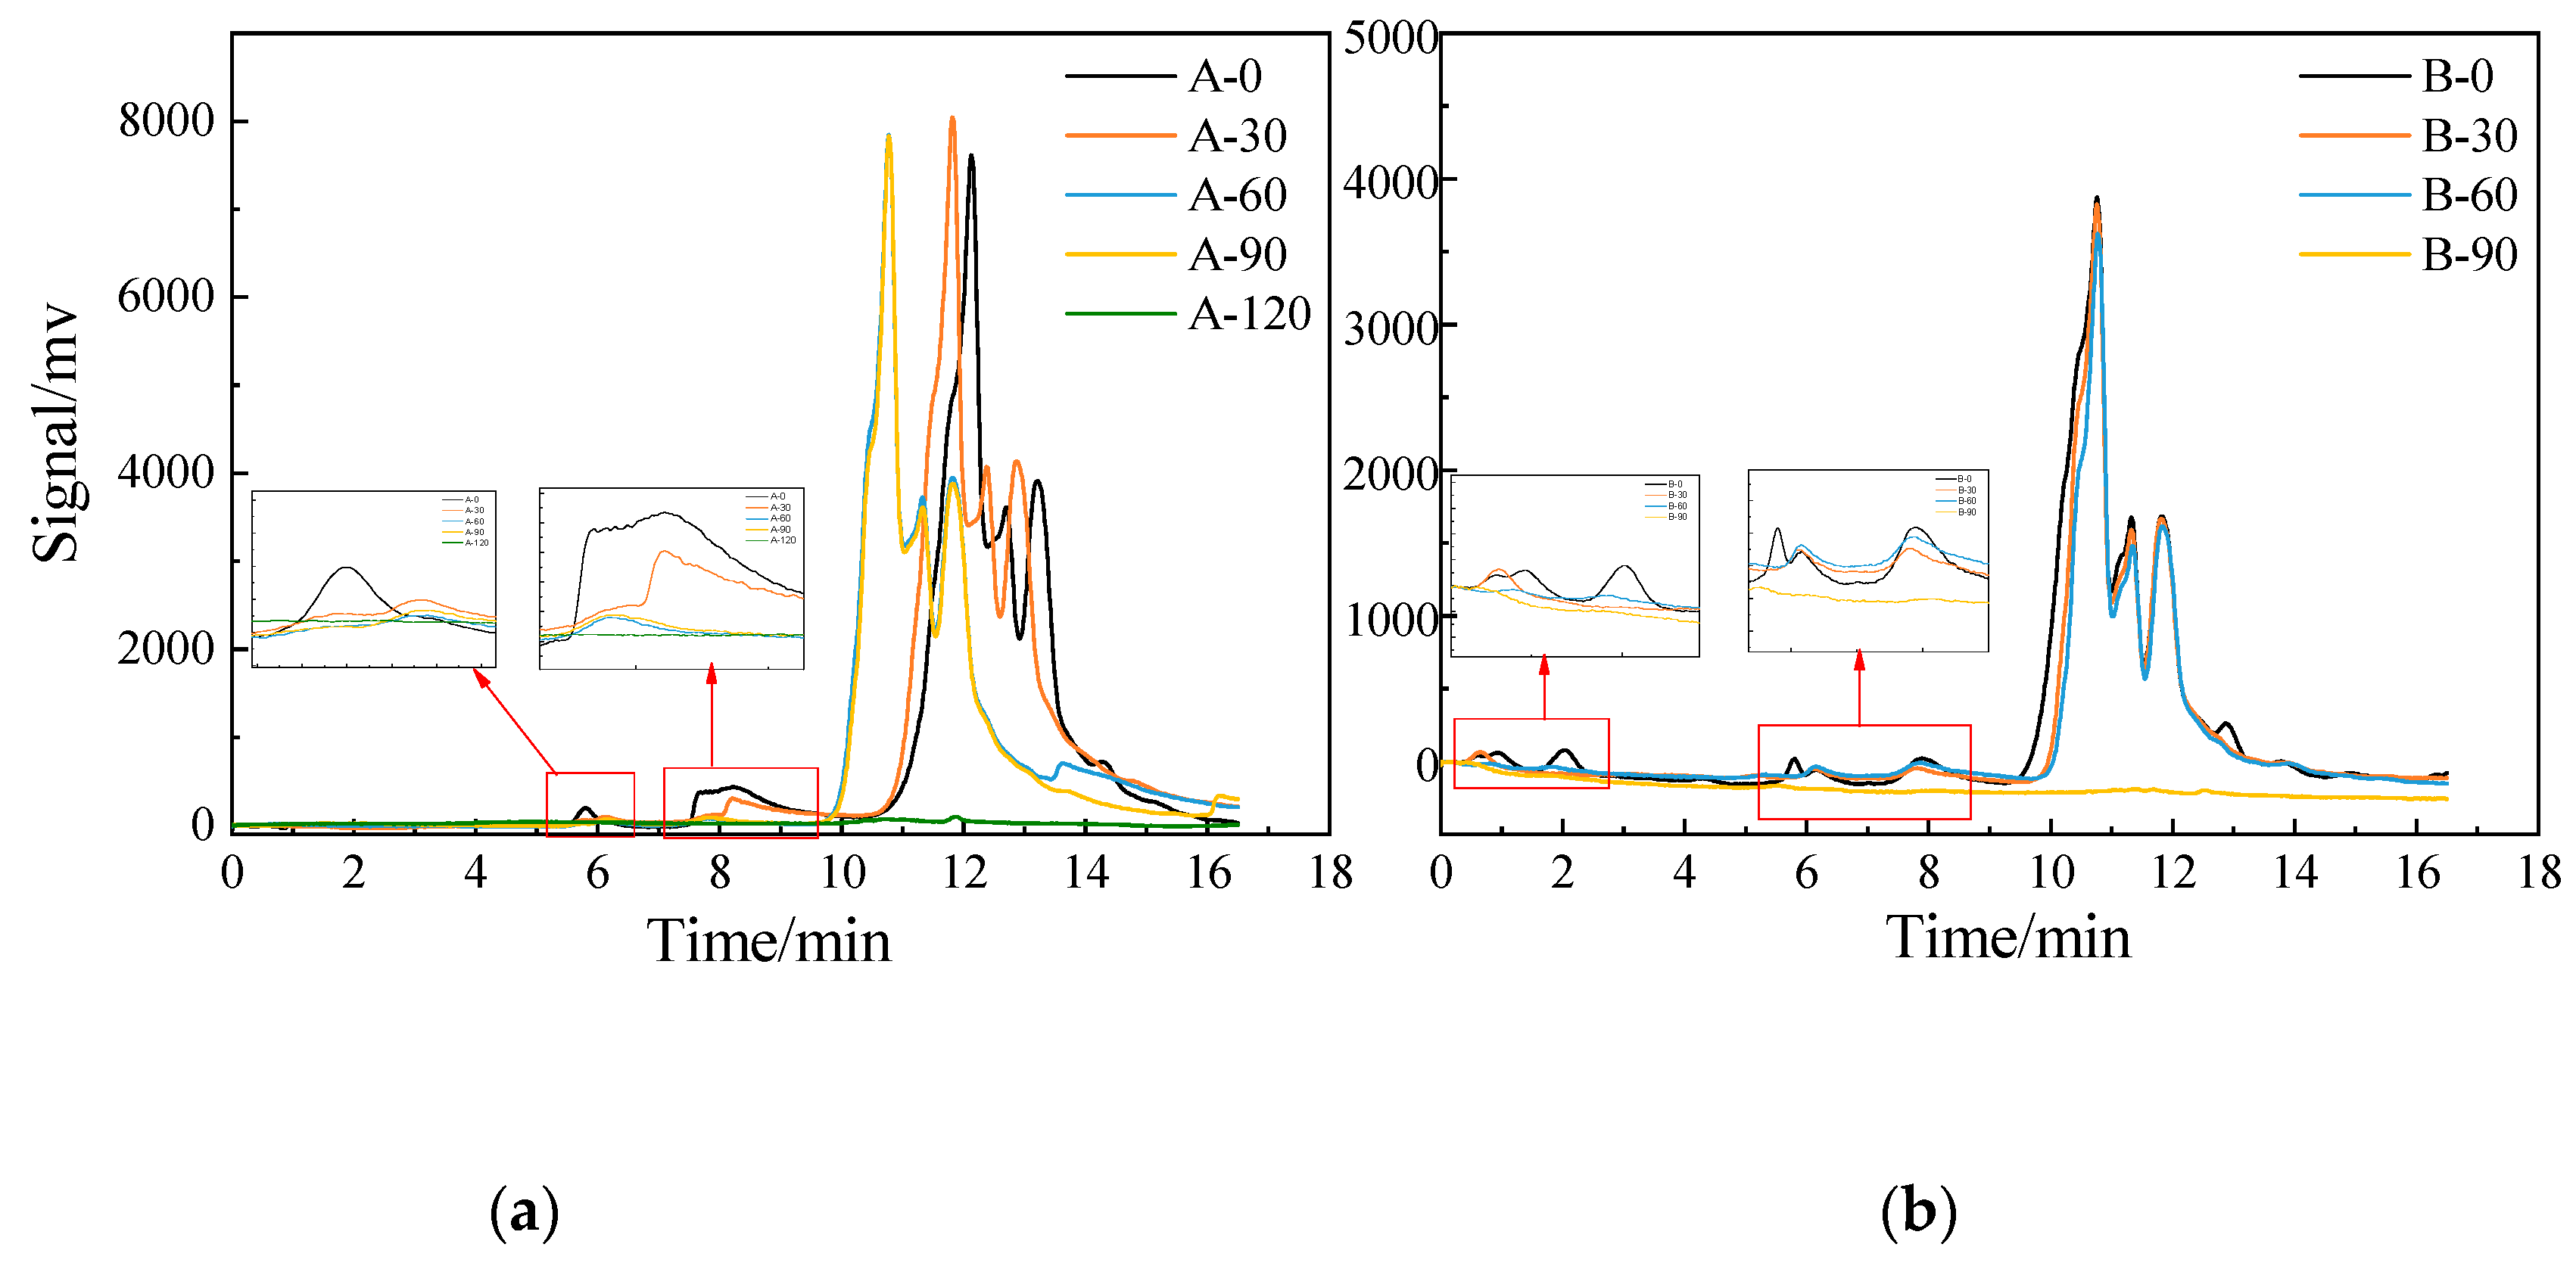
Three-dimensional fluorescence was used to further analyze and study the changes in DOM after the photocatalytic degradation of TiO2 in SE-A and SE-B because of its fast response and high sensitivity [47], and the results are displayed in Figure 8. When Ex > 300 nm, the fluorescence was humic acid-like, and fulvic acid-like fluorescence when Ex < 300 nm [48]. According to the results, the initial fluorescence peak position of SE-A was Ex/Em: 312/396 nm, which belongs to the fulvic acid-like fluorescence peak, while the initial fluorescence peak position of SE- B was Ex/Em: 278/354 nm, which belongs to the protein-like fluorescence peak. After 150 min of photocatalytic reaction, the position of SE-A did not change much and still belongs to the fulvic acid-like fluorescence peak, but its fluorescence intensity dropped greatly. Meanwhile, the fluorescence intensity of SE-B drastically decreased, and the obvious fluorescence peak cannot be displayed under the same intensity measurement standard. Fluorescence intensity is directly proportional to the concentration of luminescent substances [49]. Therefore, the DOMs in SE-A and SE-B were mainly fulvic acid-like substances and protein-like substances, respectively, and both decreased substantially after the photocatalytic reaction.

3.2.3. AMW of DOM

The AMW results of DOM in SE-A and SE-B during the photocatalytic reaction by HPSEC [50] are shown in Figure 9. The molecular weight marker is drawn according to Lewis’ method [51], and the marking equation is lg(MW) = −0.343 t + 6.828. The relationship between peak time and molecular weight is shown in Table 3. The earlier the peak time is the larger the molecular weight is. The molecular weights of both effluents were mainly small molecules, the peak time was concentrated in 10.5–14.0 min, and the corresponding molecular weight range was 106–1684 Da, which is consistent with the conclusion drawn in the literature [52].
SE-A had two obvious peaks at approximately 5.8 and 8.0 min before photocatalytic degradation, with corresponding molecular weights around 69,000 and 12,000 Da, respectively. After 30 min of photocatalytic degradation, the signal peaks decreased significantly around 6 and 8 min. Afterward, the signal peaks around 6 and 8 min nearly disappeared after 60 min of photocatalytic reaction. The result of detection indicates that nearly all the signal peaks were undetected when the reaction proceeded for 120 min, illustrating that the small molecular organics were markedly degraded during the 90–120 min period.
Four mainly signals peaked before the degradation of SE-B, appearing at approximately 1, 2, 6, and 8, and about 10.5–14 min, and the corresponding molecular weights were approximately 300,000, 138,000, 60,000, and 12,000, and 106–1685 Da. After 30 min of photocatalytic degradation, the signal peaks at 1, 6, and 8 min were significantly reduced, the signal peak at 2 min basically disappeared, and the peak at 10–14 min did not decrease significantly. After 60 min of reaction, the signal peaks in a 1 min nearly disappeared. Finally, nearly all the signal peaks were undetectable after 90 min of reaction, indicating that the small molecular organics were greatly degraded during the 60–90 min reaction period.
Overall, the DOMs of SE-A and SE-B were mainly small molecules with molecular weights of approximately 106–1684 Da. The macromolecular organics were first degraded, followed by the small molecular organics in the process of photocatalytic degradation. The DOMs of SE-A and SE-B were greatly degraded in the 90–120 and 60–90-min periods, respectively. The change pattern of molecular weight is consistent with the above results (Figure 6a,b).

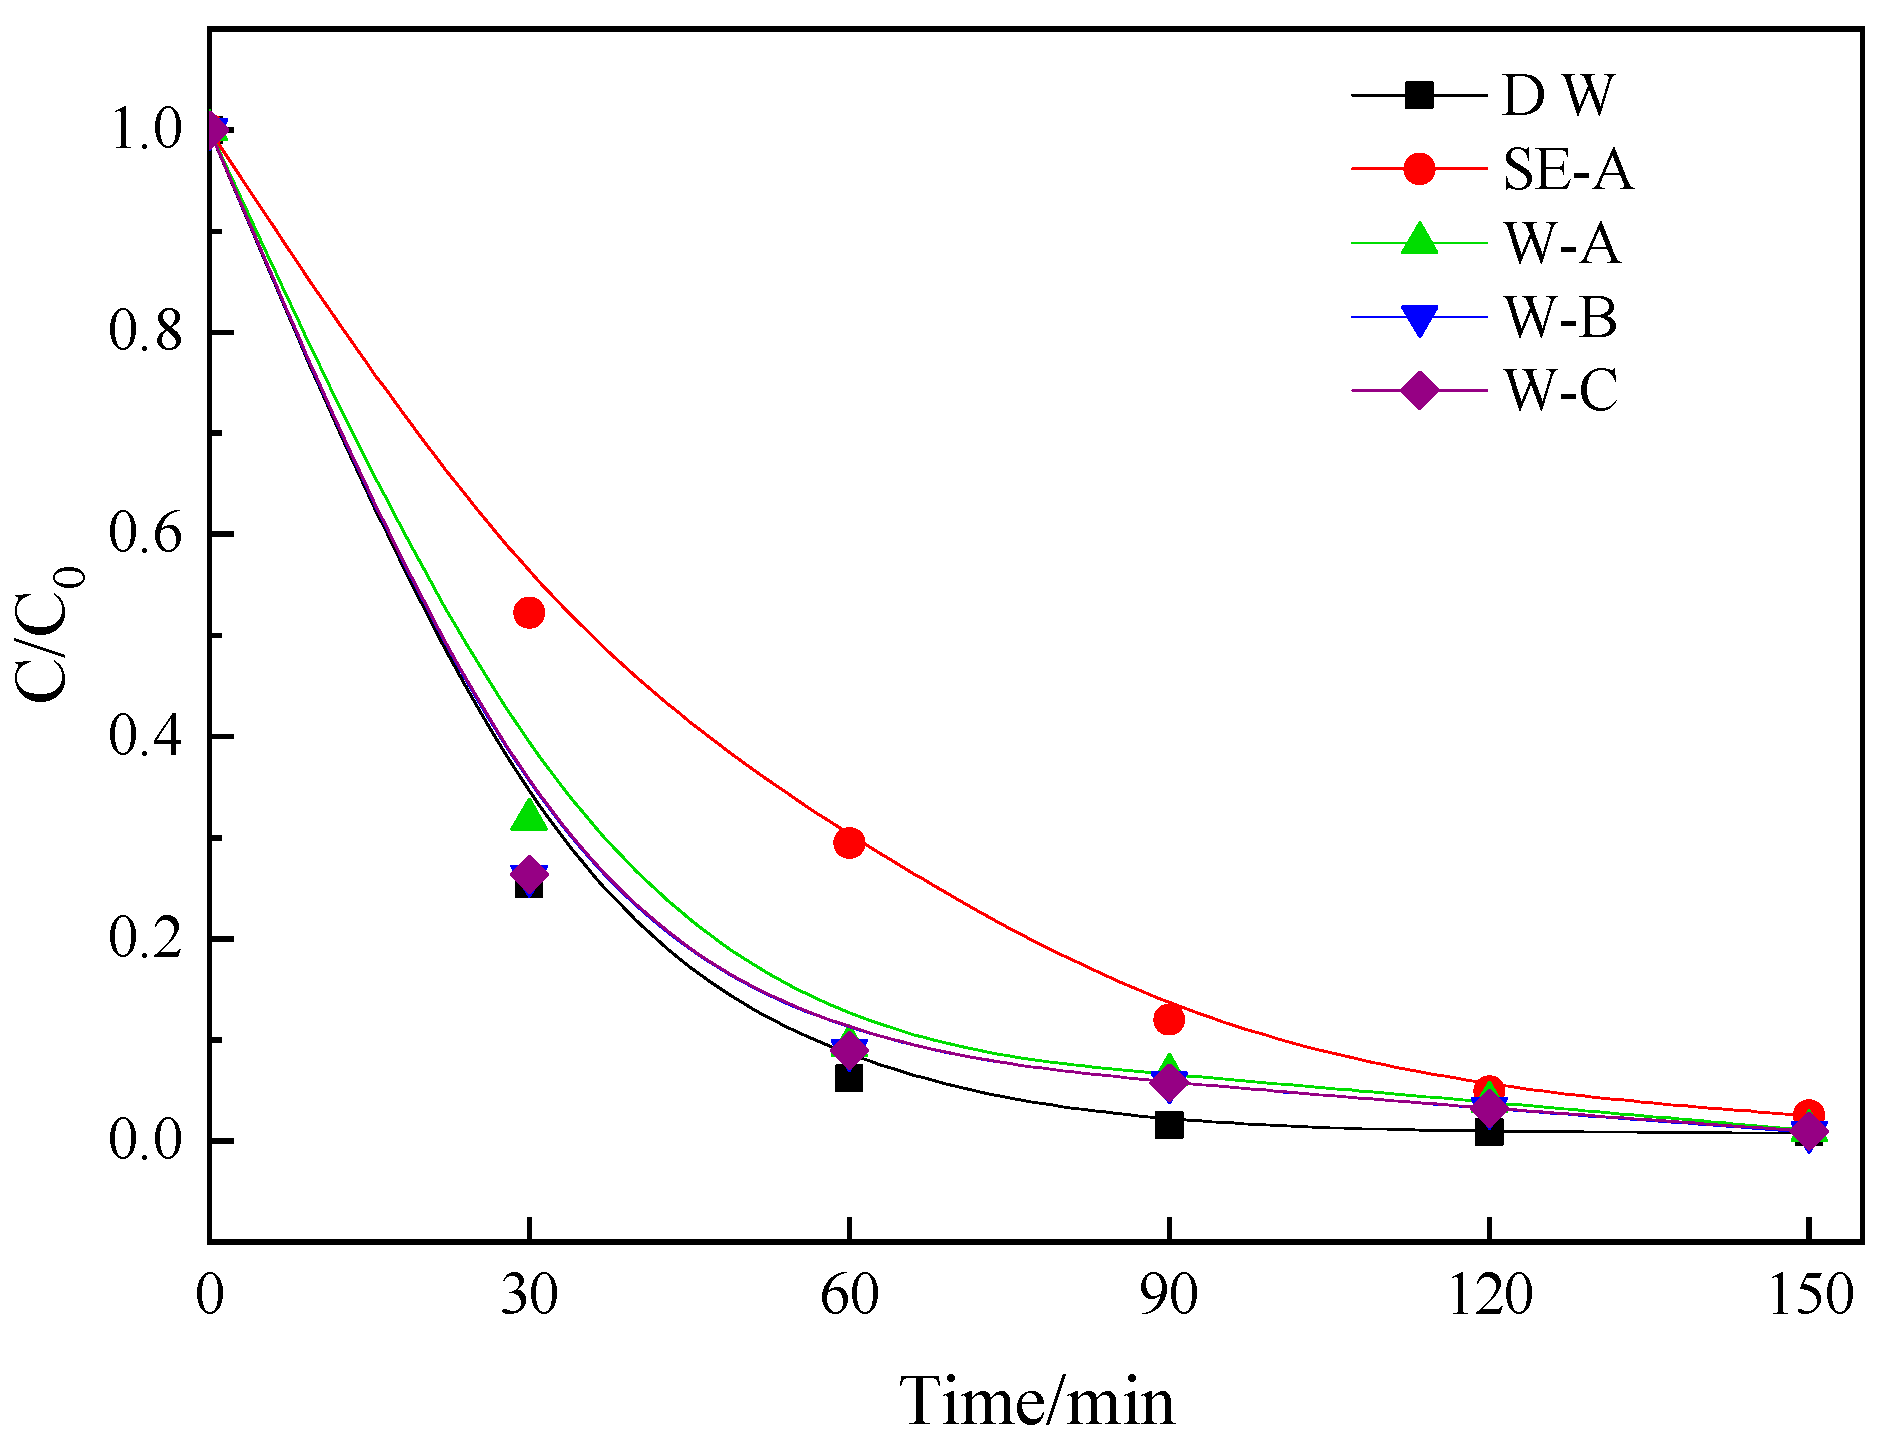
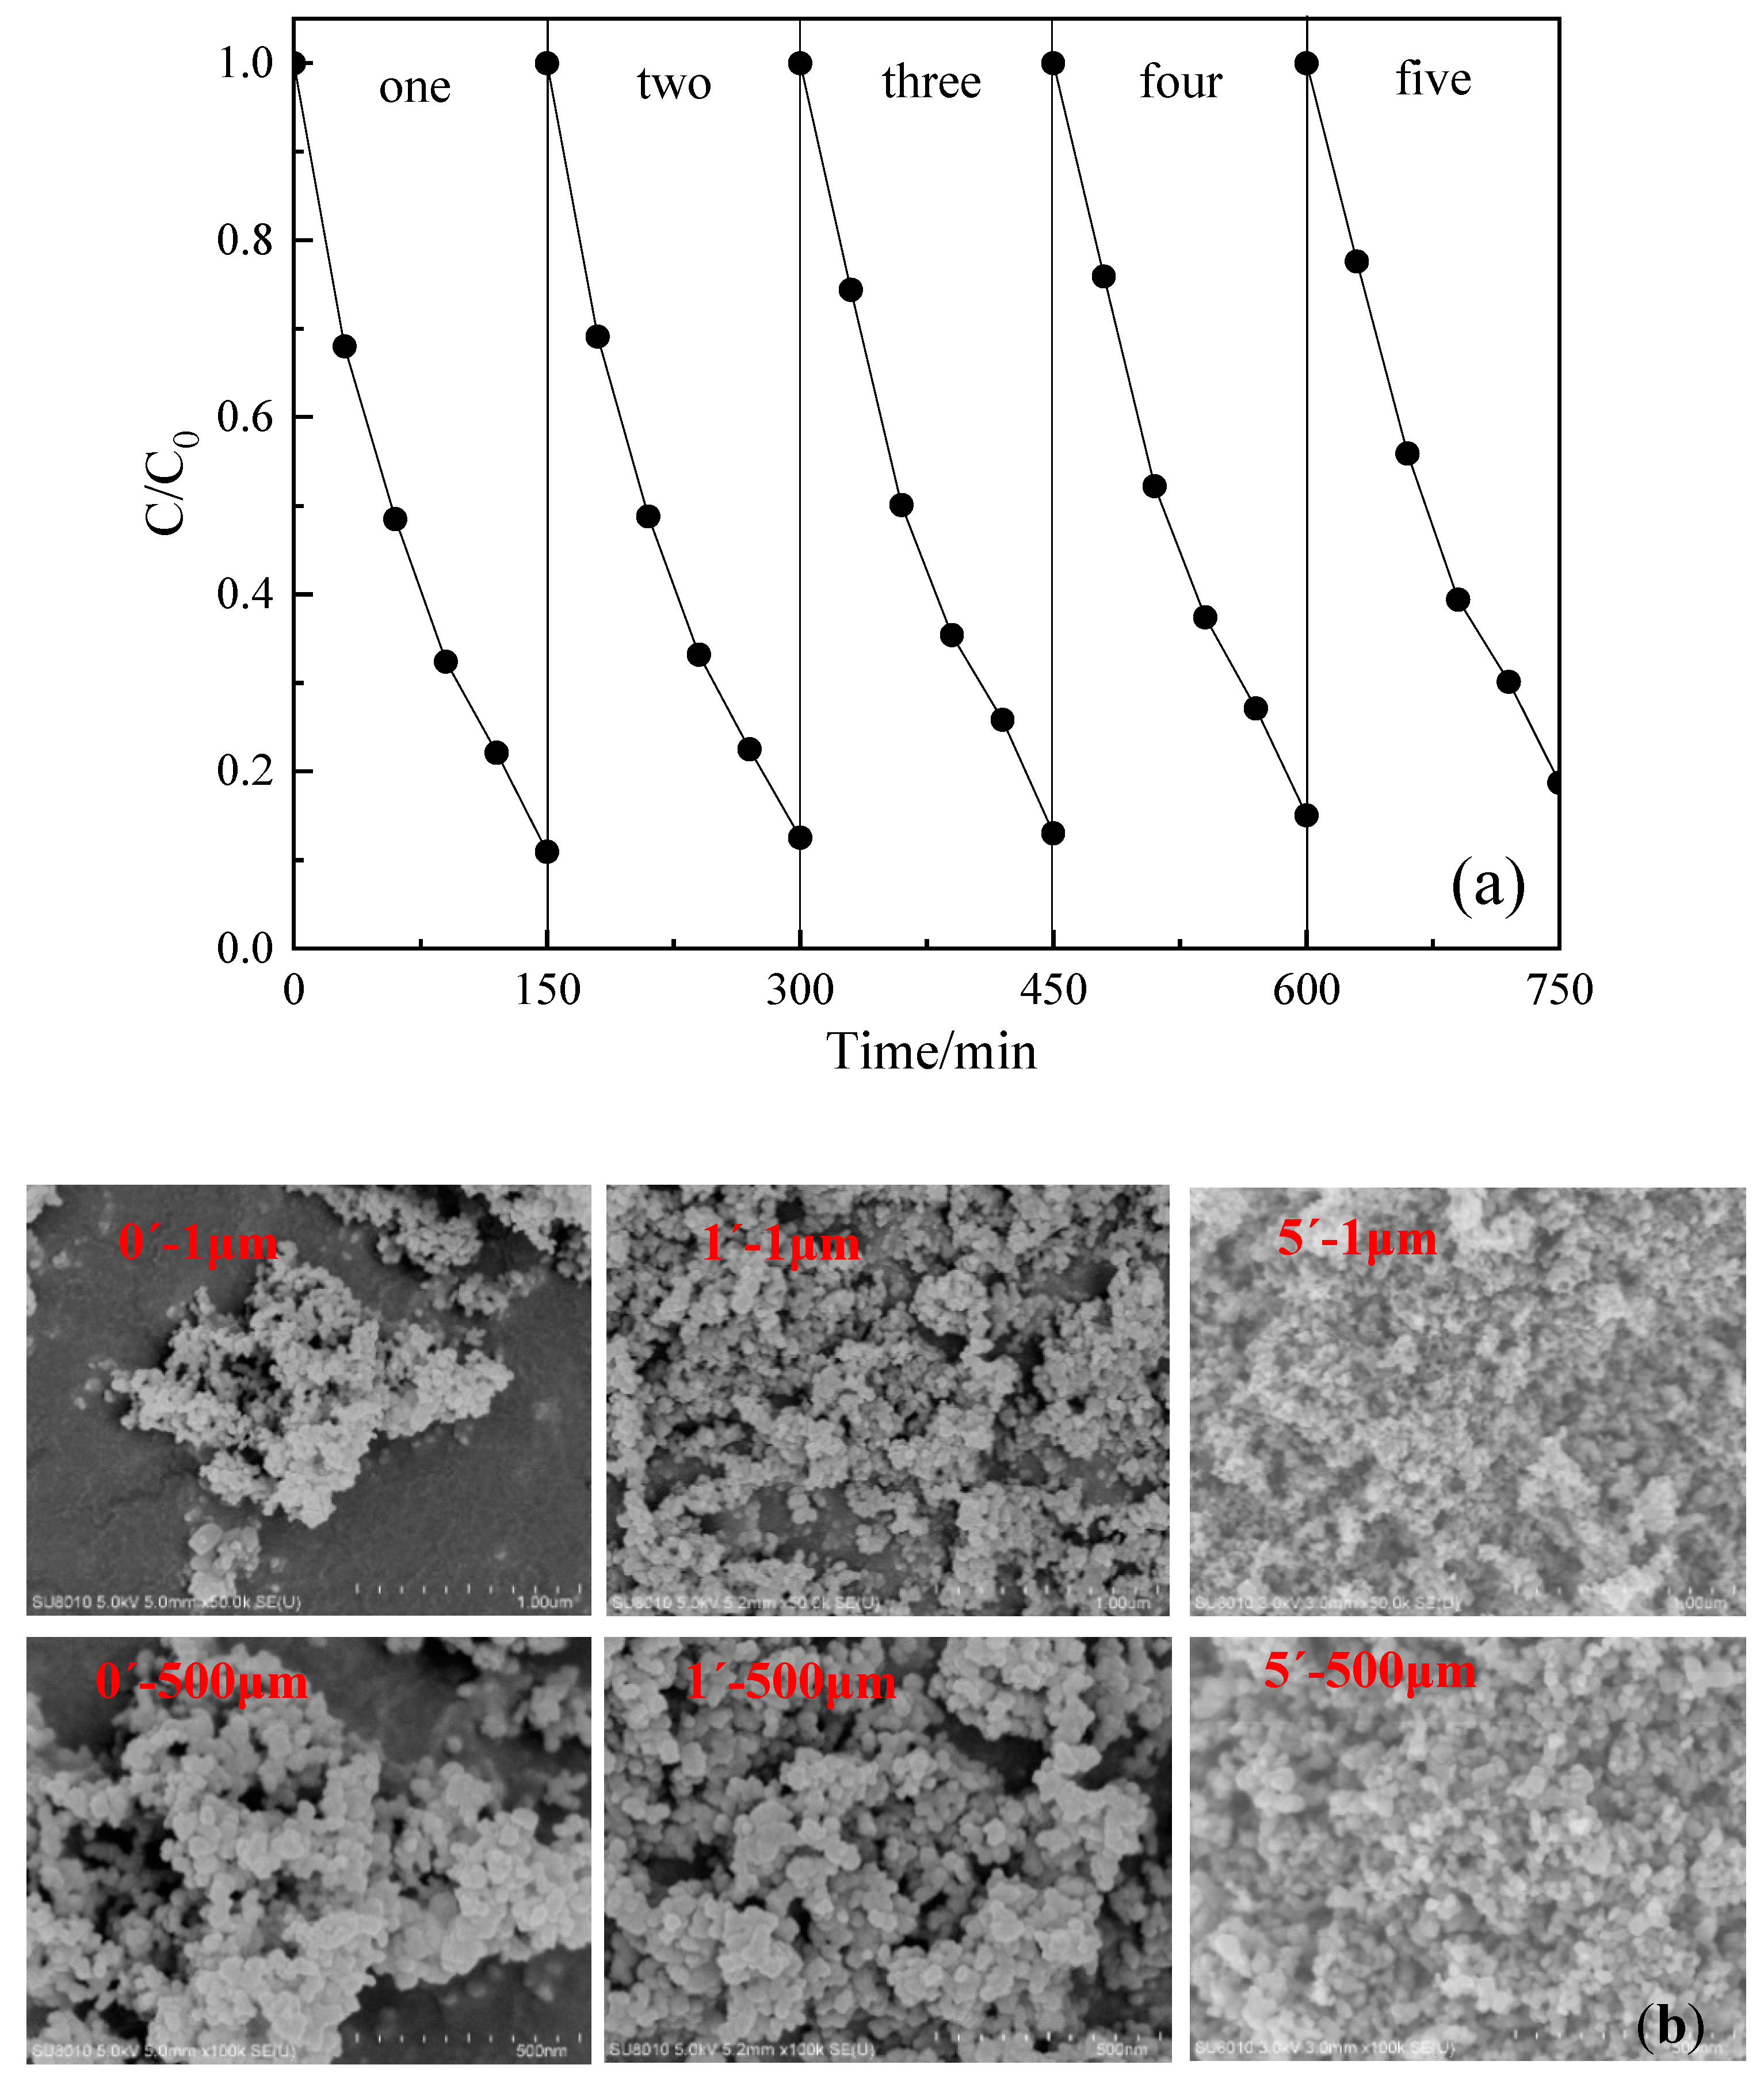
3.3. Repeatability of Photocatalyst

The reusability and stability of the photocatalyst (TiO2, P25) in actual sewage must be considered in industrial decontamination, due to economic costs and the environmental issues of materials. The above results indicate that DCF could be completely degraded after 150 min of photocatalytic reaction. The SE-A was used as the background water of DCF to carry out the photocatalyst repeatability test because SE-A exhibited a strong inhibitory effect of DCF degradation during the photocatalytic process. Figure 10a shows the removal rate of DCF in each cycle demonstrating that DCF maintained a super photocatalytic degradation rate even after five cycles, which only decreased by 9.8%. Figure 10b displays the SEM images of TiO2 before reaction, and after reacting once, and five times with scales of 1 and 500 μm respectively. The figure shows that the distance between TiO2 particles decreased significantly after five cycles of experiments. Therefore, the reduction of the removal rate can be attributed to the following reasons: (i) the agglomeration of TiO2 powder through washing and drying steps reduces the contact area of DCF and TiO2; (ii) the pores and active sites were blocked by DCF molecules, DOM, and the anions and cations in the sewage; and (iii) contaminants were difficult to remove from the catalyst surface during the washing process.

4. Conclusions

In this study, a photocatalysis experiment was conducted using a laboratory-scale simulated solar experimental device to investigate the degradation of DCF. This study focused on exploring the effects of actual secondary effluent on the photocatalytic degradation of DCF and the changes in DOM during the photocatalytic degradation process.
When SE-A and SE-B were used as the background water of the DCF solution, they had a significant inhibitory effect on the degradation of DCF, and the inhibitory effect of SE-A was stronger than that of SE-B due to its higher COD, TN, and TP contents. Among them, DOMs exerted the main inhibitory effect on the photocatalytic degradation of DCF in sewage, and the anions and cations had relatively small inhibitory effects on degradation. In addition, sewage as the DCF background water contributed a certain biological toxicity to the solution, but the complex inorganic and organic substances in the sewage had fewer toxic effects on the DCF mixed solution as the degradation reaction proceeded.
UV254 can be used as an indicator to predict the removal effect of COD for SE-B. The molecular weights of the DOMs in the two kinds of sewage were mainly small molecules. After the photocatalytic reaction, the organic matters in the sewage were greatly degraded. Among them, TiO2 first catalyzed the degradation of macromolecular organic matters and then degraded the small molecular organic matters.

Author Contributions

N.M., F.W., and R.Y. conceived the main idea of the paper. N.M., N.Z., L.G., H.C., and B.Z. designed the experiment. N.M., L.G., J.H., and X.H. performed the experiment. N.M. wrote the manuscript and all authors contributed in improving the paper. All authors have read and agreed to the published version of the manuscript.

Funding

This work was financially supported by Guangxi Major Projects of Science and Technology (Grant No. GXMPST AA17202032); the National Natural Science Foundation of China (41822706); the Beijing Natural Science Foundation (8182034); Fundamental Research Funds for the Central Universities (FRF-TP-19-001C1).

Acknowledgments

The authors appreciate the support of National Environmental and Energy Base for International Science & Technology Cooperation.

Conflicts of Interest

The authors declare no conflict of interest.

References

  1. Daughton, C.G. Pharmaceuticals and Personal Care Products in the Environment: Overarching Issues and Overview; Springer: Dordrecht, The Netherlands, 2001. [Google Scholar]
  2. Deo, R.; Halden, R. Pharmaceuticals in the Built and Natural Water Environment of the United States. Water 2013, 5, 1346–1365. [Google Scholar] [CrossRef]
  3. Evgenidou, E.N.; Konstantinou, I.K.; Lambropoulou, D.A. Occurrence and removal of transformation products of PPCPs and illicit drugs in wastewaters: A review. Sci. Total Environ. 2015, 505, 905–926. [Google Scholar] [CrossRef] [PubMed]
  4. Kasprzyk-Hordern, B.; Dinsdale, R.M.; Guwy, A.J. The occurrence of pharmaceuticals, personal care products, endocrine disruptors and illicit drugs in surface water in South Wales, UK. Water Res. 2008, 42, 3498–3518. [Google Scholar] [CrossRef] [PubMed]
  5. Liu, J.L.; Wong, M.H. Pharmaceuticals and personal care products (PPCPs): A review on environmental contamination in China. Environ. Int. 2013, 59, 208–224. [Google Scholar] [CrossRef] [PubMed]
  6. Wang, L.; Ying, G.G.; Zhao, J.L.; Yang, X.B.; Chen, F.; Tao, R.; Liu, S.; Zhou, L.J. Occurrence and risk assessment of acidic pharmaceuticals in the Yellow River, Hai River and Liao River of north China. Sci. Total Environ. 2010, 408, 3139–3147. [Google Scholar] [CrossRef] [PubMed]
  7. Liu, D.; Wang, J.; Zhou, J.; Xi, Q.; Li, X.; Nie, E.; Piao, X.; Sun, Z. Fabricating I doped TiO2 photoelectrode for the degradation of diclofenac: Performance and mechanism study. Chem. Eng. J. 2019, 369, 968–978. [Google Scholar] [CrossRef]
  8. Wang, J.; Lou, Y.; Zhuang, X.; Song, S.; Liu, W.; Xu, C. Magnetic Pr6O11/SiO2@Fe3O4 particles as the heterogeneous catalyst for the catalytic ozonation of acetochlor: Performance and aquatic toxicity. Sep. Purif. Technol. 2018, 197, 63–69. [Google Scholar] [CrossRef]
  9. Taggart, M.A.; Cuthbert, R.; Das, D.; Sashikumar, C.; Pain, D.J.; Green, R.E.; Feltrer, Y.; Shultz, S.; Cunningham, A.A.; Meharg, A.A. Diclofenac disposition in Indian cow and goat with reference to Gyps vulture population declines. Environ. Pollut 2007, 147, 60–65. [Google Scholar] [CrossRef]
  10. Balbi, T.; Montagna, M.; Fabbri, R.; Carbone, C.; Franzellitti, S.; Fabbri, E.; Canesi, L. Diclofenac affects early embryo development in the marine bivalve Mytilus galloprovincialis. Sci. Total Environ. 2018, 642, 601–609. [Google Scholar] [CrossRef]
  11. Guo, R.; Xia, X.; Zhang, X.; Li, B.; Zhang, H.; Cheng, X.; Xie, M.; Cheng, Q. Construction of Ag3PO4/TiO2 nano-tube arrays photoelectrode and its enhanced visible light driven photocatalytic decomposition of diclofenac. Sep. Purif. Technol. 2018, 200, 44–50. [Google Scholar] [CrossRef]
  12. Zhao, J.; Wang, Q.; Fu, Y.; Peng, B.; Zhou, G. Kinetics and mechanism of diclofenac removal using ferrate(VI): Roles of Fe(3+), Fe(2+), and Mn(2). Environ. Sci. Pollut. Res. Int. 2018, 25, 22998–23008. [Google Scholar] [CrossRef]
  13. Iervolino, G.; Zammit, I.; Vaiano, V.; Rizzo, L. Limitations and Prospects for Wastewater Treatment by UV and Visible-Light-Active Heterogeneous Photocatalysis: A Critical Review. Topics Curr. Chem. 2019, 378, 7. [Google Scholar] [CrossRef] [PubMed]
  14. Zuorro, A.; Lavecchia, R.; Monaco, M.M.; Iervolino, G.; Vaiano, V. Photocatalytic Degradation of Azo Dye Reactive Violet 5 on Fe-Doped Titania Catalysts under Visible Light Irradiation. Catalysts 2019, 9, 645. [Google Scholar] [CrossRef] [Green Version]
  15. Xia, D.; Lo, I.M.C. Synthesis of magnetically separable Bi2O4/Fe3O4 hybrid nanocomposites with enhanced photocatalytic removal of ibuprofen under visible light irradiation. Water Res. 2016, 100, 393–404. [Google Scholar] [CrossRef] [PubMed]
  16. Yao, H.; Fan, M.; Wang, Y.; Luo, G.; Fei, W. Magnetic titanium dioxide based nanomaterials: Synthesis, characteristics, and photocatalytic application in pollutant degradation. J. Mater. Chem. A 2015, 3, 17511–17524. [Google Scholar] [CrossRef]
  17. Castro, J.; Paz, S.; Mena, N.; Urresta, J.; Machuca-Martinez, F. Evaluation of heterogeneous catalytic ozonation process for diclofenac degradation in solutions synthetically prepared. Environ. Sci. Pollut. Res. Int. 2019, 26, 4488–4497. [Google Scholar] [CrossRef]
  18. Deng, Y.; Ezyske, C.M. Sulfate radical-advanced oxidation process (SR-AOP) for simultaneous removal of refractory organic contaminants and ammonia in landfill leachate. Water Res. 2011, 45, 6189–6194. [Google Scholar] [CrossRef] [PubMed]
  19. Kumar, A.; Khan, M.; Fang, L.; Lo, I.M.C. Visible-light-driven N-TiO2@SiO2@Fe3O4 magnetic nanophotocatalysts: Synthesis, characterization, and photocatalytic degradation of PPCPs. J. Hazard. Mater. 2019, 370, 108–116. [Google Scholar] [CrossRef] [PubMed]
  20. Arlos, M.J.; Hatat-Fraile, M.M.; Liang, R.; Bragg, L.M.; Zhou, N.Y.; Andrews, S.A.; Servos, M.R. Photocatalytic decomposition of organic micropollutants using immobilized TiO2 having different isoelectric points. Water Res. 2016, 101, 351–361. [Google Scholar] [CrossRef] [PubMed]
  21. Cai, Q.; Hu, J. Decomposition of sulfamethoxazole and trimethoprim by continuous UVA/LED/TiO2 photocatalysis: Decomposition pathways, residual antibacterial activity and toxicity. J. Hazard. Mater. 2017, 323, 527–536. [Google Scholar] [CrossRef] [PubMed]
  22. Jallouli, N.; Pastrana-Martínez, L.M.; Ribeiro, A.R.; Moreira, N.F.F.; Faria, J.L.; Hentati, O.; Silva, A.M.T.; Ksibi, M. Heterogeneous photocatalytic degradation of ibuprofen in ultrapure water, municipal and pharmaceutical industry wastewaters using a TiO2/UV-LED system. Chem. Eng. J. 2018, 334, 976–984. [Google Scholar] [CrossRef]
  23. Augugliaro, V.; Bellardita, M.; Loddo, V.; Palmisano, G.; Palmisano, L.; Yurdakal, S. Overview on oxidation mechanisms of organic compounds by TiO2 in heterogeneous photocatalysis. J. Photoch. Photobio. C 2012, 13, 224–245. [Google Scholar] [CrossRef] [Green Version]
  24. Carp, O. Photoinduced reactivity of titanium dioxide. Prog. Solid State Chem. 2004, 32, 33–177. [Google Scholar] [CrossRef]
  25. Žunič, V.; Škapin, S.D.; Maček-Kržmanc, M.; Bračko, I.; Sever Škapin, A.; Suvorov, D. Influence of the triblock copolymer P123 and phosphorous on the physico-chemical properties of TiO2. Appl. Catal A-Gen. 2011, 397, 241–249. [Google Scholar] [CrossRef]
  26. Achilleos, A.; Hapeshi, E.; Xekoukoulotakis, N.P.; Mantzavinos, D.; Fatta-Kassinos, D. Factors affecting diclofenac decomposition in water by UV-A/TiO2 photocatalysis. Chem. Eng. J. 2010, 161, 53–59. [Google Scholar] [CrossRef]
  27. Awfa, D.; Ateia, M.; Fujii, M.; Yoshimura, C. Novel Magnetic Carbon Nanotube-TiO2 Composites for Solar Light Photocatalytic Degradation of Pharmaceuticals in the Presence of Natural Organic Matter. J. Water Process. Eng. 2019, 31. [Google Scholar] [CrossRef]
  28. Salaeh, S.; Juretic Perisic, D.; Biosic, M.; Kusic, H.; Babic, S.; Lavrencic Stangar, U.; Dionysiou, D.D.; Loncaric Bozic, A. Diclofenac removal by simulated solar assisted photocatalysis using TiO2-based zeolite catalyst; mechanisms, pathways and environmental aspects. Chem. Eng. J. 2016, 304, 289–302. [Google Scholar] [CrossRef]
  29. Sahu, S.P.; Qanbarzadeh, M.; Ateia, M.; Torkzadeh, H.; Maroli, A.S.; Cates, E.L. Rapid Degradation and Mineralization of Perfluorooctanoic Acid by a New Petitjeanite Bi3O(OH)(PO4)2 Microparticle Ultraviolet Photocatalyst. Environ. Sci. Tech. Lett. 2018, 5, 533–538. [Google Scholar] [CrossRef]
  30. Murgolo, S.; Moreira, I.S.; Piccirillo, C.; Castro, P.M.L.; Ventrella, G.; Cocozza, C.; Mascolo, G. Photocatalytic Degradation of Diclofenac by Hydroxyapatite-TiO2 Composite Material: Identification of Transformation Products and Assessment of Toxicity. Materials 2018, 11, 1779. [Google Scholar] [CrossRef] [Green Version]
  31. Kowalska, K.; Maniakova, G.; Carotenuto, M.; Sacco, O.; Vaiano, V.; Lofrano, G.; Rizzo, L. Removal of carbamazepine, diclofenac and trimethoprim by solar driven advanced oxidation processes in a compound triangular collector based reactor: A comparison between homogeneous and heterogeneous processes. Chemosphere 2020, 238, 124665. [Google Scholar] [CrossRef]
  32. Bernabeu, A.; Vercher, R.F.; Santos-Juanes, L.; Simón, P.J.; Lardín, C.; Martínez, M.A.; Vicente, J.A.; González, R.; Llosá, C.; Arques, A.; et al. Solar photocatalysis as a tertiary treatment to remove emerging pollutants from wastewater treatment plant effluents. Catal. Today 2011, 161, 235–240. [Google Scholar] [CrossRef]
  33. Andreozzi, R.; Raffaele, M.; Nicklas, P. Pharmaceuticals in STP effluents and their solar photodegradation in aquatic environment. Chemosphere 2003, 50, 1319–1330. [Google Scholar] [CrossRef]
  34. Tang, T.; Lu, G.; Wang, W.; Wang, R.; Huang, K.; Qiu, Z.; Tao, X.; Dang, Z. Photocatalytic removal of organic phosphate esters by TiO2: Effect of inorganic ions and humic acid. Chemosphere 2018, 206, 26–32. [Google Scholar] [CrossRef] [PubMed]
  35. Zhao, Q.; Sun, J.; Li, J.; He, J. Kinetics and mechanism of Horner–Wadsworth–Emmons reaction of weakly acidic phosphonate in solid–liquid phase-transfer catalysis system. Catal. Commun. 2013, 36, 98–103. [Google Scholar] [CrossRef]
  36. Pereira, J.H.; Reis, A.C.; Queiros, D.; Nunes, O.C.; Borges, M.T.; Vilar, V.J.; Boaventura, R.A. Insights into solar TiO2-assisted photocatalytic oxidation of two antibiotics employed in aquatic animal production, oxolinic acid and oxytetracycline. Sci. Total Environ. 2013, 463–464, 274–283. [Google Scholar] [CrossRef]
  37. Sheng, H.; Li, Q.; Ma, W.; Ji, H.; Chen, C.; Zhao, J. Photocatalytic degradation of organic pollutants on surface anionized TiO2: Common effect of anions for high hole-availability by water. Appl. Catal. B-Environ. 2013, 138–139, 212–218. [Google Scholar] [CrossRef]
  38. Rao, Y.; Han, F.; Chen, Q.; Wang, D.; Xue, D.; Wang, H.; Pu, S. Efficient degradation of diclofenac by LaFeO3-Catalyzed peroxymonosulfate oxidation---kinetics and toxicity assessment. Chemosphere 2019, 218, 299–307. [Google Scholar] [CrossRef]
  39. Klamerth, N.; Malato, S.; Maldonado, M.I.; Agüera, A.; Fernández-Alba, A.R. Application of Photo-Fenton as a Tertiary Treatment of Emerging Contaminants in Municipal Wastewater. Environ. Sci. Technol. 2010, 44, 1792–1798. [Google Scholar] [CrossRef] [PubMed]
  40. Vela, N.; Calin, M.; Yanez-Gascon, M.J.; Garrido, I.; Perez-Lucas, G.; Fenoll, J.; Navarro, S. Photocatalytic oxidation of six endocrine disruptor chemicals in wastewater using ZnO at pilot plant scale under natural sunlight. Environ. Sci. Pollut. Res. Int. 2018, 25, 34995–35007. [Google Scholar] [CrossRef] [PubMed]
  41. Vela, N.; Calín, M.; Yáñez-Gascón, M.J.; Garrido, I.; Pérez-Lucas, G.; Fenoll, J.; Navarro, S. Photocatalytic oxidation of six pesticides listed as endocrine disruptor chemicals from wastewater using two different TiO2 samples at pilot plant scale under sunlight irradiation. J. Photoch. Photobio. A 2018, 353, 271–278. [Google Scholar] [CrossRef]
  42. Becerril, M.E.; Ramírez-García, J.J.; Cavazos, N.; Serrano, A.R. Determination of the Kinetic Behavior of Diclofenac in Aqueous Solution by UV Light Radiation. Water Air Soil Poll. 2019, 230. [Google Scholar] [CrossRef]
  43. Uyguner-Demirel, C.S.; Bekbolet, M. Significance of analytical parameters for the understanding of natural organic matter in relation to photocatalytic oxidation. Chemosphere 2011, 84, 1009–1031. [Google Scholar] [CrossRef]
  44. Li, W.; Lu, S.; Qiu, Z.; Lin, K. Clofibric acid degradation in UV254/H2O2 process: Effect of temperature. J. Hazard. Mater. 2010, 176, 1051–1057. [Google Scholar] [CrossRef] [PubMed]
  45. Altmann, J.; Massa, L.; Sperlich, A.; Gnirss, R.; Jekel, M. UV254 absorbance as real-time monitoring and control parameter for micropollutant removal in advanced wastewater treatment with powdered activated carbon. Water Res. 2016, 94, 240–245. [Google Scholar] [CrossRef] [PubMed]
  46. Alharbi, S.K.; Kang, J.; Nghiem, L.D.; van de Merwe, J.P.; Leusch, F.D.L.; Price, W.E. Photolysis and UV/H2O2 of diclofenac, sulfamethoxazole, carbamazepine, and trimethoprim: Identification of their major degradation products by ESI–LC–MS and assessment of the toxicity of reaction mixtures. Process. Saf. Environ. 2017, 112, 222–234. [Google Scholar] [CrossRef] [Green Version]
  47. Shimabuku, K.K.; Kennedy, A.M.; Mulhern, R.E.; Summers, R.S. Evaluating Activated Carbon Adsorption of Dissolved Organic Matter and Micropollutants Using Fluorescence Spectroscopy. Environ. Sci. Technol. 2017, 51, 2676–2684. [Google Scholar] [CrossRef] [PubMed]
  48. Guerard, J.J.; Miller, P.L.; Trouts, T.D.; Chin, Y.P. The role of fulvic acid composition in the photosensitized degradation of aquatic contaminants. Aquatic Ences 2009, 71, 160–169. [Google Scholar] [CrossRef]
  49. Li, Y.; Niu, J.; Shang, E.; Crittenden, J.C. Influence of dissolved organic matter on photogenerated reactive oxygen species and metal-oxide nanoparticle toxicity. Water Res. 2016, 98, 9–18. [Google Scholar] [CrossRef]
  50. Chow, C.W.K.; Fabris, R.; Leeuwen, J.V.; Wang, D.; Drikas, M. Assessing Natural Organic Matter Treatability Using High Performance Size Exclusion Chromatography. Environ. Sci. Technol. 2008, 42, 6683–6689. [Google Scholar] [CrossRef]
  51. Lewis, R.; van Leeuwen, J.A.; Smernik, R.J.; Chow, C.W.K.; Everson, A.; Nothrop, S.C.; Beecham, S. Changes in the organic character of post-coagulated Pinus radiata sulfite pulp mill wastewater under aerated stabilization basin treatment—A laboratory scale study. Chem. Eng. J. 2011, 175, 160–168. [Google Scholar] [CrossRef]
  52. Plant, E.L.; Smernik, R.J.; van Leeuwen, J.; Greenwood, P.; Macdonald, L.M. Changes in the nature of dissolved organics during pulp and paper mill wastewater treatment: A multivariate statistical study combining data from three analytical techniques. Environ. Sci. Pollut. Res. Int. 2014, 21, 4265–4275. [Google Scholar] [CrossRef] [PubMed]
Figure 1. The device for simulating visible light catalytic degradation of DCF in sewage.
Water 12 02902 g001
Figure 2. The removal effect of photocatalytic and photocatalysis on DCF in deionized water.
Water 12 02902 g002
Figure 3. The effect on DCF degradation and changes of TOC in the photocatalytic process in SE-A and SE-B. (a) shows photocatalytic degradation rates of DCF in three different background solutions. (b) shows the changes of TOC during photocatalysis.
Water 12 02902 g003
Figure 4. The effect of different components in wastewater on the photocatalytic degradation of DCF.
Water 12 02902 g004
Figure 5. The toxicity of DCF solution under different background water.
Water 12 02902 g005
Figure 6. The changes of UV254, UV365, COD and correlation analysis after photocatalytic degradation in SE-A and SE-B. (a) and (b) are the decreasing trend of UV254 and UV365. (c) and (d) are the content of COD after photocatalytic degradation in SE-A and SE-B, respectively. (e) and (f) reveal the correlation between COD and UV254 and UV365 in SE-A and SE-B.
Water 12 02902 g006
Figure 7. The UV-Vis absorption spectra before and after the photocatalytic reaction of SE-A and SE-B.
Water 12 02902 g007
Figure 8. The changes of three-dimensional fluorescence of DOM in SE-A and SE-B after the photocatalytic degradation of TiO2.
Water 12 02902 g008
Figure 9. The distribution and changes of molecular weight of DOMs during the degradation. (a) and (b) are the changes in molecular weight of DOMs in SE-A and SE-B, respectively.
Water 12 02902 g009
Figure 10. (a) is repeatability of photocatalytic, (b) is the SEM images of TiO2 during the photocatalytic degradation of DCF in actual sewage.
Water 12 02902 g010
Table 1. The basic water quality indicators of SE-A and SE-B.
IndicatorsSE-ASE-BLevel A Atandard of GB 18918-2002
pH (-)8.037.516–9
COD (mg/L)362150
TN (mg/L)24.3316.2415
TP (mg/L)0.580.380.5
NH3-N (mg/L)4.83.25(8)
Table 2. The anion ion chromatography content of SE-A and SE-B.
Secondary EffluentPeak NameResidence Time (min)Content (mg/L)Content (mol)
SE-ACl8.09877.80682.192
NO314.75729.37980.474
SO42−23.99847.24210.492
SE-BCl7.94061.66651.737
NO314.03212.02390.194
SO42−23.78224.10310.251
Table 3. The relationship between peak time and molecular weight.
Peak Time/Min0.5–2.25.7–6.27.7–8.510.5–14
Molecular Weight1,180,000–4,530,00050,280–74,6278175–15,378106–1684
Publisher’s Note: MDPI stays neutral with regard to jurisdictional claims in published maps and institutional affiliations.

