Article

The Initial Deposition Behavior of Silica Colloid and Amino-Modified Silica Colloid in Unsaturated Sand Columns

by
Yosuke Fujita
1 and
Motoyoshi Kobayashi
2,*
1
Iron and Steel Division, JFE Mineral Company, Ltd., 1 Kokan-cho, Fukuyama, Hiroshima 721-0931, Japan
2
Faculty of Life & Environmental Sciences, University of Tsukuba,1-1-1 Tennodai, Tsukuba, Ibaraki 305-8572, Japan
*
Author to whom correspondence should be addressed.
Water 2020, 12(10), 2892; https://doi.org/10.3390/w12102892
Submission received: 16 September 2020 / Revised: 13 October 2020 / Accepted: 14 October 2020 / Published: 16 October 2020
(This article belongs to the Section Wastewater Treatment and Reuse)

Abstract

:
Colloid transport experiments focusing on the initial deposition stage in water-unsaturated sand columns were conducted. To examine the effect of electrostatic interaction in the unsaturated condition, negatively and positively charged silica colloids were used for column transport experiments under different salt concentrations. The results of the column experiments were analyzed based on the colloid filtration theory and the deposition rate constants, and the single collector efficiency was calculated. The deposition rate constants of both negatively and positively charged silica in a water-unsaturated condition are larger than those in a water-saturated condition at an equivalent salt concentration, because the interface between air and water acts as an additional deposition site. The negatively charged silica shows the salt concentration, above which electric double layer (EDL) repulsion can be neglected, and the salt concentration is called critical deposition concentration (CDC). The CDCs were almost the same values in water-saturated as well as unsaturated conditions. The deposition rate constants of the positively charged silica were slightly increased at 0.05 mM due to the EDL attractive forces in the saturated condition. However, we could not see the significant effects of the EDL attractive force in the unsaturated condition in this study. Also, the present results demonstrated that a correlation equation for calculating collector efficiency can be applied to the non-spherical collector particles.

1. Introduction

It has been very important to understand the transport phenomena of colloidal particles in porous media for controlling deep-bed filtration and predicting contaminants’ fates in aquifers [1,2]. Colloidal particles stimulate the contaminants’ transport, or the colloidal particles themselves act as harmful contaminants in the soil [3,4,5]. Therefore, more and more researches have been performed to clarify the effect of solution chemistry, the surface properties of particles, flow rate, colloid size, and water content on colloid transport [6,7,8,9,10,11,12].
Above all, silica and surface-modified silica particles are often utilized as industrial materials—such as abrasive agents, carriers of catalysts, and composite materials. In addition, engineered nanoparticles are treated with silica coating to improve the dispersibility of nanoparticles [13]. Furthermore, radioactive spherical particles of silicate glass released by the accident of Fukushima Daiichi Nuclear Power Plant were found [5]. These radioactive silica particles were sampled from the ground in Fukushima, and thus such particles may migrate in subsurface regions. Thus, we have to consider the transport behavior of silica and particles coated by silica in soil and water environments. The water content of soil matrix is fluctuated, and soil matrix is composed of non-spherical particles in an actual environment. Therefore, it is necessary to elucidate the colloid transport behavior under unsaturated conditions, where the air–water interface (AWI) appears in the pore, in porous media formed with non-spherical collectors.
The movability of colloidal particles in porous media composed of packed collector particles is dependent on the colloid deposition rates onto the collector surface. The deposition kinetics is affected by hydrodynamic and physicochemical interactions between colloids and the collectors [2,14,15]. Previous systematic studies showed that the effects of physicochemical interactions on the colloid deposition can be well-described by the Derjaguin–Landau–Verwey–Overbeek (DLVO) theory under water-saturated conditions. That is, that the van der Waals (vdW) interaction and electric double layer (EDL) interaction mainly occurs between colloidal particles and collector particles. When colloidal particles and collector particles are similarly charged, the EDL repulsive force dominates. However, when the attractive vdW force becomes larger than the repulsive force by the compression of EDL at higher ionic strength, colloidal particles can be attached to the collector surface [16,17].
The deposition mechanism is complicated in water-unsaturated conditions because of the appearance of AWI. The colloidal particles can be captured at not only the AWI but also in the thin water film, the stagnant point of flow, and the interface line of air–water–solid (AWS) [18,19,20,21,22]. In addition, the hydrophobic force acts as an attractive force between the AWI and hydrophobic colloidal particle, because the air–water interface is super-hydrophobic [23]. These previous researches demonstrated that the attachments to the AWI, straining, and retention at the AWS triple point are peculiar deposition mechanisms in a water-unsaturated condition [24,25]. It is pointed out that the colloid deposition to the AWI and retention by straining are also affected by ionic strength and solution pH. These mechanisms are promoted with decreasing EDL repulsion force.
However, most of these studies were conducted in later deposition conditions, where the additional deposition mechanisms may also occur [6,7,8,21,26]. While the colloid deposition rate is only affected by the interaction between the colloids and the collector in the early deposition stage, the deposition rate is affected by the attached particles with an increase of the deposition amount of colloidal particles in the later deposition stage. When the repulsive force is dominant between colloidal particles, attached particles inhibit the further deposition of colloidal particles. Meanwhile, if the attractive force exists between each colloidal particle, the attached particles act as additional deposition sites. Generally, these phenomena are called blocking and ripening phenomena, respectively [27,28]. These situations, where the deposition rate changes with increasing deposition amounts, are called the later stage of the deposition. Saiers et al. conducted column transport experiments and determined the deposition amounts of the AWI and the SWI in unsaturated conditions by using colloidal silica particles. They conducted their experiments in the later stage of deposition and carried out model analysis with the advection–dispersion equation containing the blocking effect [6]. However, the blocking mechanisms are still not clear in unsaturated conditions, and it is not clear that the transport model can be applied to the experimental results. Therefore, it is difficult to conclude how collector surface and AWI act to affect colloid deposition in the late stage of the deposition, and there is less discussion of critical deposition concentration above which EDL repulsion can be neglected, in unsaturated conditions.
The transport experiments clearly distinguishing the initial and later deposition stages are needed, because the attached colloid particles act as the additional deposition site and change the colloid deposition rate in the later stage. The initial stage deposition has been developed for the water-saturated condition known as a colloid filtration theory. For example, the Tufenkji and Elimelech (TE) equation [14] is available for the evaluation of deposition kinetics in the initial stage in a packed bed of spherical beads without EDL interaction. Then, we can simply observe the effects of physicochemical interaction on the colloid retention without blocking and ripening effects. It is important to develop a similar framework for water-unsaturated conditions. Therefore, we have been focusing on the early deposition stage in water-unsaturated conditions.
For this end, we have performed the deposition experiment focusing on the initial deposition stage in water-unsaturated conditions. We used two different silica particles and examined the effect of the EDL forces as a function of salt concentration. The deposition rate constants were calculated from the experimental data of the breakthrough curves, and we evaluated the physicochemical interactions between each surface quantitatively. Furthermore, we investigated the applicability of the TE equation to non-spherical collector particles, namely sand. We have aimed at examining the basic transport behavior of silica and surface-modified silica particles in unsaturated conditions, and try to expand colloid filtration theory to the water-unsaturated conditions.

2. Materials and Methods

2.1. Colloidal Particles

Silica particles (KE-P50 Lot:8110, Nippon Shokubai, Osaka, Japan) were adopted as model colloids. Dried powder-like silica particles were heat-treated at 800 °C over 24 h. After the heating process, the silica particles were cooled at room temperature and dispersed in water [29]. The silica particles were nearly spherical with an average diameter of 490 ± 23 nm (determined by measuring 700 particles with transmission electron microscopy (TEM)). The average hydrodynamic diameter (z-average) was 530 nm from the measurement of dynamic light scattering (ZetaSizer Nano, Malvern, Malvern, UK). Silica particles have a negative charge at pH over 4, and the charging behavior is known to be calculated by 1 pK-basic Stern model [30,31]. The calculated value of diffuse layer potential at 1 mM salt concentration is shown in Figure 1.
To test the effects on the charge sign of the colloidal particles, we modified the silica surface with amino groups by silane coupling. The modified particles were positively charged and these particles are called amino–silica particles hereafter. The procedure of silane coupling is given below. The silica particles heated at 800 °C were dispersed in ethanol. The concentration of suspension was about 100 mg/L. We added the 3-aminopropyltri methoxysilane, NH3, and H2O to the suspension. The final concentrations of the 3-aminopropyltri methoxysilane, NH3, and H2O in the mixture were 0.02 M, 0.02 M, and 0.8 M respectively. The above mixture was continually stirred at 50 °C for 3 h [34]. After three hours, the mixed suspension was centrifuged at 2000 rpm for 15 min. Then, the supernatant was removed. The precipitate was dispersed in ethanol again and centrifuged at the same condition. This ethanol washing step was repeated seven times. After the washing by ethanol, the amino–silica particles were washed by deionized water (Elix) eight times with the same procedure. These ethanol and deionized water washing treatments were performed to remove the unreacted substances and the NH3. After the washing, the amino–silica particles were freeze-dried. The average hydrodynamic diameter (z-average) of amino–silica particles measured with dynamic light scattering (ZetaSizer Nano, Malvern, UK) was 519 nm, and it was almost the same as the value of the original silica particles. The zeta potential of the amino–silica from the measured electrophoretic mobility with Zeta Sizer Nano (Malvern) via the Smoluchowski equation was shown in Figure 1.
The suspension pH was adjusted by the addition of HCl and NaOH. The isoelectric point of the amino–silica was pH 6.5, and the particles were positively charged at pH below 6.5. In this experiment, the pH of the original silica suspension was controlled to 6.9 to let the particles be negatively charged. On the one hand, the pH of amino–silica suspension was 5.1 to ensure the particles to be positively charged. HCl and NaHCO3 (0.16~0.5 mM) were used for controlling the suspension pH. NaCl was used to adjust salt concentration.

2.2. Collector Particles Composing Porous Media

This study adopted Toyoura sands (Toyoura Silicate Mineral Corp, Shimonoseki, Japan) as collector particles composing porous media in a column. The major chemical component of the Toyoura sand is SiO2 and the average diameter of the sand was 274 ± 50 μm. The Toyousa sand particles were washed by the following procedure before use in experiments. About 300 g of the sands was washed several times in a 3 L beaker containing deionized water to eliminate larger impurities. After that, the sand immersed in a 6% H2O2 solution was heated by a hot stirrer, and its temperature was kept at 70 °C for 5 days to decompose organic impurities. After the H2O2 treatment, the sand was sonicated (As one, USK-5) for 99 min with soaking deionized water, then the sand was extensively rinsed with deionized water. This sonication step was repeated 10 times [35].
The zeta potential of Toyoura sands measured at 1 mM NaCl are also shown in Figure 1 [34]. The measurement was conducted by using the streaming potential method. The Toyoura sands have a negative charge, and the absolute zeta potential increases as pH is increased. The charging behavior is analogous to that of silica particles. In addition, the zeta potential of air bubbles, which was measured by the microscope electrophoresis method [35], is shown in Figure 1. Air bubbles also have negative charge and the absolute zeta potential increases at higher pH. This can be understood by the adsorption of hydroxide ions at the AWI [35].
The specific surface area of Toyoura sand was 0.622 m2/g by the BET method with nitrogen gas (SA-3100, Beckman Coulter, Brea, CA, USA). Meanwhile, the specific surface area measured by the air permeability method was reported as 0.012 m2/g by Uno et al. [36]. The porosity of the Toyoura sand bed is 0.429. To measure the porosity of Toyoura sand, the sand was wet-packed in a column to reach a predetermined volume under a maintained water level. After that, the Toyoura sand was dried in an oven at 105 °C for 24 h to measure the water mass. We confirm that dryness will not change after the 24 h drying process in advance.

2.3. Experimental Procedure

The setup of experiments is summarized in Figure 2. The column was made by pilling up acrylic cylinders having 3.2 cm inner diameter. The height of the column was 3 cm, and the cleaned sand was packed to the 2 cm height. The cleaned sand was wet-packed in the column, keeping the level of water higher than the sand surface. The pressure sensors (Sensez, HTVN-100kPa, Tokyo, Japan) were installed at the heights of 0.5 and 1.5 cm from the column bottom to measure the suction of the column. A nylon-made membrane having 10 μm pore size (Nylon Net Filter 10 μm, Merck Millipore Ltd., Darmstadt, Germany) was placed at the column bottom. To disperse the solution all over the column surface, a glass plate of 2.2 cm diameter and a nylon filter of 1.8 cm diameter were put under the point of dripping. Column experiments were systematically carried out under water-saturated as well as water-unsaturated conditions at various salt concentrations. The colloid concentration was determined to 30 mg/L by preliminary experiments to avoid the blocking and the ripening effects. The experiments of colloid transport were performed at least twice at each solution condition, and all the results are shown in the same graph in the later part of this paper. The experimental procedure is described below.
Firstly, the electrolyte solution, which did not contain colloid particles, was pumped for conditioning water chemistry in the column. After flowing several pore volumes of the solution into the column, the inflow solution was changed to the suspension of silica. In the transport experiments in water-unsaturated sand, the water content was adjusted by slowly decreasing the flow rate and applying the suction to the bottom of the column before changing the inflow solution. To prevent colloid aggregation and settling in the suspension bottle, the solution of salt and the suspension of silica were mixed just before the inlet of the column. The effluent colloid concentration was continuously monitored by a spectrophotometer (APEL, PD-303) at a 340 nm wavelength. After 6 to 8 pore volumes of the suspension had flowed into the column, the experiments were finished, and the column was broken to each of the cylinders, and the water content of the sand was determined by gravimetry with drying in the oven at 110 °C. The conditions of experiments are shown in Table 1. The values of pH, water saturation, and approach velocity in Table 1 are averaged values obtained at each condition. Standard deviation of each of the values is also shown in Table 1. Adjustment of the water saturation by 50% was attempted; however, that did not have exactly the same value in all the experiments due to the small column volume. Thus, each colloid transport experiment was conducted at least twice.

2.4. Colloid Transport Model

The transport behavior of colloidal particles in the initial deposition stage is governed by the advection–dispersion equation including deposition:
C t = D h 2 C x 2 v C x k p c C
where v is the velocity of pore water, D h is the dispersion coefficient, k p c is the colloid deposition rate constant. In water-unsaturated conditions, it is difficult to geometrically define the collector surface area per unit of pore water volume. In this study, the effects of the collector surface area and the AWI area on the deposition are included in the deposition rate constant. Of these, k p c reflects the interaction between colloid particles and collector particles and is expressed by the following equation with the single collector efficiency η 0 and the attachment efficiency α [24]
k p c = 3 ( 1 f ) v 2 d c α η 0
where f is the porosity of porous media (packed bed of collector particles), and d c is collector particle diameter. The η 0 means collector efficiency without the EDL repulsion force and α reflects the effect of EDL repulsion force. The product α η 0 is regarded as the net colloid collector efficiency taking into consideration the physicochemical interaction. This is obtained by the following Equation (3).
α η 0 = 2 3 d C ( 1 f ) L ln C C 0
where L is the length of the column, C is the colloid concentration at the column outlet, and C 0 is the influent colloid concentration of suspension. Combining Equations (2) and (3), we obtain the equation for calculating deposition rate constants from the experimental values of the effluent concentration at plateaus in both water-saturated and -unsaturated conditions.
k p c = v L ln C C 0
Furthermore, the collector efficiency without the EDL repulsive force is calculated by the correlation equation, which is based on the trajectory analysis and the numerical solution of the advection–dispersion equation [14,15]. In this study, we use the correlation equation provided by Tufenkji and Elimelech, called the TE equation, and compare the experimental values with calculated value [14]. The collector efficiency is calculated by the following equation.
η 0 = η D + η I + η g
The left-hand side of Equation (5) refers to collector efficiency coming from each deposition mechanism and η D is the diffusional deposition, η I is the deposition by interception, and η g is the deposition by gravitational sedimentation. In Equation (5), the terms on the right-hand side are expressed by dimensionless parameters as follows.
η D = 2.4 A s 1 3 N R 0.081 N P e 0.715 N v d w 0.052
η I = 0.55 A s N R 1.675 N A 0.125
η g = 0.22 N R 0.24 N G 1.11 N v d w 0.053
where each dimensionless parameters are defined as follows,
N R = d c / d p
N P e = 2 d c U / D
N v d w = A / k T
N A = A / 12 π μ d p 2
N G = 2 d p 2 ( ρ p ρ f ) g 9 μ U
and As is Happel’s cell model parameter depending on porosity f.
A s = 2 ( 1 ω 5 ) 2 3 ω + 3 ω 5 2 ω 6
ω = ( 1 f ) 1 3
All the parameters needed for calculations are given in Table 2. Additionally, k is the Boltzmann constant, and D is diffusion coefficient defined as D = kT/(3 π d p μ ). We assume Hamaker’s constant A = 8.3 × 10⁻²¹ J, which is reported as that of silica across water [37].

3. Results and Discussion

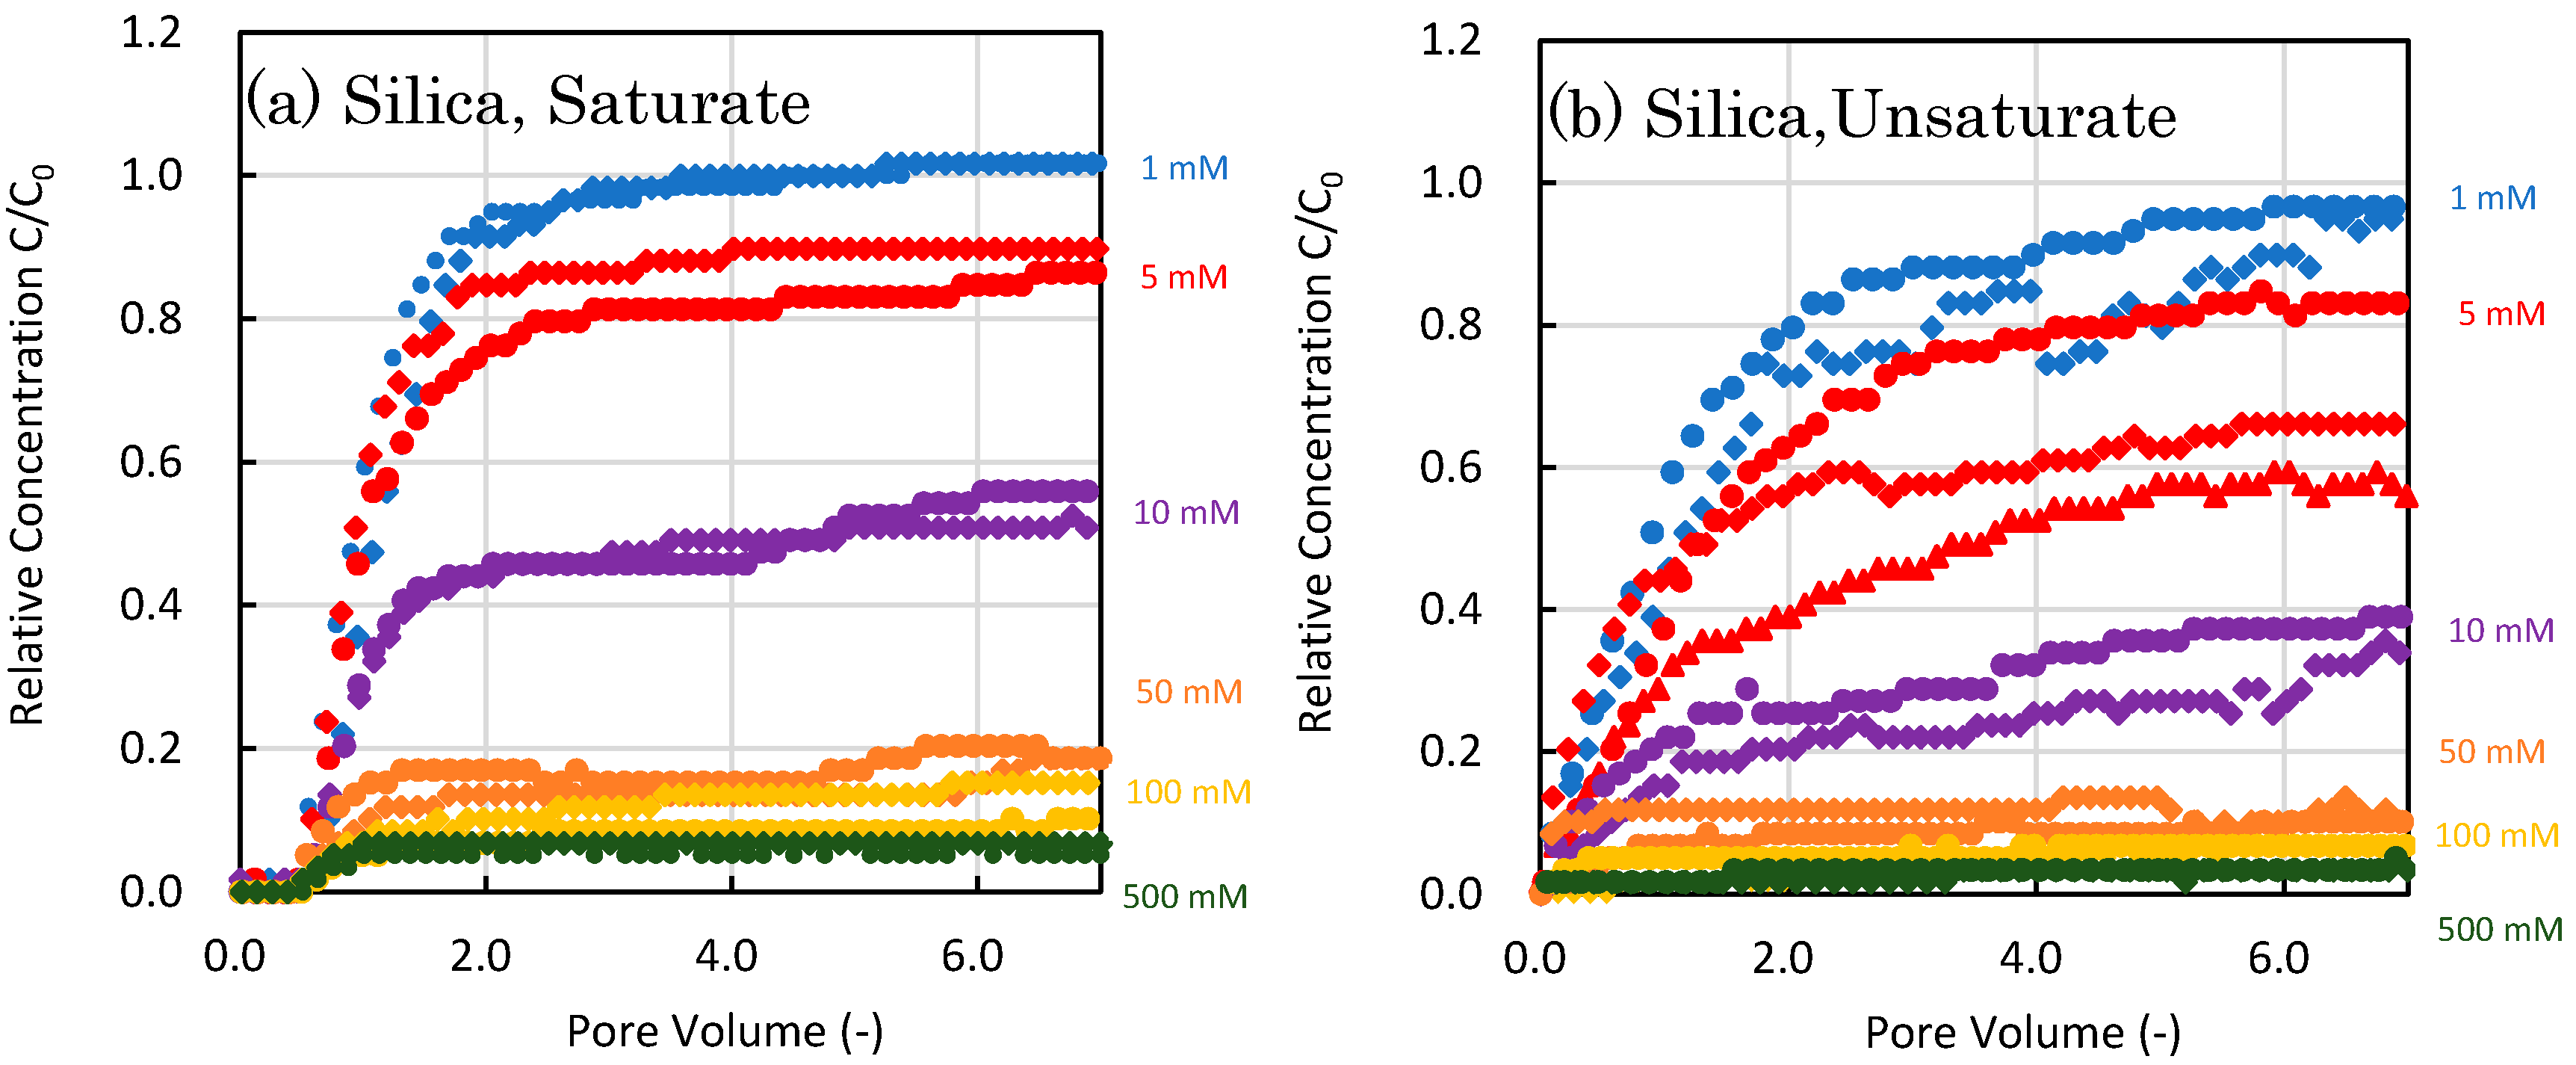
3.1. Colloid Transport Experiment in the Column

Figure 3a,b shows the breakthrough curves of original silica particles for six different salt concentrations at pH 6.9. Figure 3c,d shows the breakthrough curves of amino–silica at pH 5.1. The left side graphs (a) and (c) are the results of water-saturated conditions, and the right side of graphs (b) and (d) are those of water-unsaturated conditions. The relative colloid concentration in the effluent compared to that of the influent is plotted against the pore volume PV. The PV is the cumulative volume flowed into the column per the water volume in the column and is expressed by the following equation:
P V = U t L θ
where U refers to the approach velocity, L is the column length, t is the time, and θ is the volumetric water content. The figure indicates that the effluent concentration C sharply rises around 1PV and reaches a plateau. In unsaturated conditions, the relative concentration C/C0 quickly commences to increase and takes longer time to result in a plateau, because the hydrodynamic dispersity becomes larger.
When the original silica suspensions were flowed into the column, the C/C0 reached unity at 1 mM salt concentration condition. The relative concentration at the breakthrough decreased with increasing salt concentration of the suspension. This is because both colloidal particles and collector particles have negative charges and thus the deposition is inhibited by the EDL repulsion force at low salt concentrations. However, the repulsive force diminishes with increasing salt concentration and the vdW force induces colloid deposition.
The same tendency—the relative concentration decreasing with increasing salt concentration—was observed in an unsaturated condition. The EDL repulsive force also acts between the original silica particles and the AWI due to the negative charge of the AWI. Therefore, the C/C0 at breakthrough is also high at the low salt concentration, and decreases with increasing salt concentration in unsaturated conditions [6]. Furthermore, compared with the water-saturated condition, the relative concentration for the water-unsaturated condition is lower than that of the saturated condition in each salt concentration. The introduction of the air phase enhances the capture of colloidal particles [7,23]. The hydrophobic interaction between silica particles and the AWI is insignificant due to silica particles being hydrophilic [38,39]. Thus, the decreasing of the relative concentration is probably induced by the straining effect in a low salt concentration condition, because the EDL repulsion force between silica particles and each surface was dominant. However, in a high salt concentration, the EDL repulsion force is diminished, and the air–water interface plays a major role in the silica particles retention.
When the amino–silica was used for column transport experiments, the EDL attractive force appeared between the amino–silica particles and the collector sand particles. When the electrolyte concentration is above 5 mM, the relative concentration is kept at low values and the relative concentration at breakthrough has the same value as that of the original silica colloid at 500 mM conditions. Meanwhile, the relative concentration decreases at 0.05 mM salt concentration. The EDL attractive force does not promote the colloid deposition when the electrolyte concentration is higher than 5 mM. This suggests that the effect of the EDL attractive force on the deposition kinetics is pronounced at low salt concentration by the development of EDL thickness [17,40,41].
In unsaturated conditions, the EDL attractive force works also between the amino–silica particle and the AWI. Therefore, the C/C0 decreases in a water-unsaturated condition at any electrolyte concentration compared with water-saturated conditions. However, the increase of deposition amounts of colloid is not found at 0.05 mM, as observed in the water-saturated condition. This is because most amino–silica particles are deposited in the column, and then, we could not detect a clear change of the breakthrough curve.

3.2. Deposition Rate Constants

Using the results of colloid transport experiments in the column, we obtained the deposition rate constant of colloidal particles by using Equation (4). The results are shown in Figure 4a,b for water-saturated as well as water-unsaturated conditions. The deposition rate constant is plotted against the electrolyte concentration. In the saturated condition, the value of the deposition rate of the similarly charged system increases with the increase of the salt concentration up to 100 mM, and reaches a constant above 100 mM. At a salt concentration higher than 100 mM, the electrolyte concentration reaches the critical deposition concentration (CDC), and the EDL repulsive force can be neglected.
On the other hand, in the system of positively charged amino–silica, the deposition rates were almost constant for salt concentrations from 5 to 500 mM, and slightly increased with decreasing salt concentrations as shown in Figure 4a. Furthermore, the deposition rate constant is almost the same value for both silica particles at 500 mM and amino–silica above 5 mM. Thus, the enhancement of deposition rate by the EDL attractive force is weak in higher salt conditions and gradually develops with decreasing salt concentration [17,40].
In the unsaturated condition as shown in Figure 4b, the same dependence on salt concentration was observed for both the original silica particles as was found for the water-saturated condition. In addition, the results suggest the existence of CDC even in the unsaturated condition. The absolute value of the deposition rate constant is higher for the water-unsaturated condition, but the CDC is almost the same value irrespective of the water saturation. This is because both the collector and the AWI have similar zeta potential in our experimental conditions. In the initial stage of the deposition, the air–water interface works as an additional deposition site. While we cannot discriminate between the effects of each deposition mechanism, we find that the total deposition rate in the water-unsaturated condition also has a critical deposition concentration similar to that of the water-saturated condition.
In this research, the effect of collector surface area per unit volume of pore water is included in the deposition rate constant. At higher salt concentration, the colloidal particles can approach both the collector surface and the AWI. Therefore, the increase of the deposition rate is due to the appearance of the AWI, which traps the colloidal particles. Because colloidal particles easily attach the surface of the collector, the effect of the AWI on colloid retention is decreased relatively when the salt concentration is above the CDC. At low salt concentration, on the other hand, the deposition rate is increased by straining. Because the EDL repulsion force is dominant, the contribution of straining mechanisms is remarkable in a low salt concentration [7,38].
It is difficult to quantitatively discuss the deposition rate of amino–silica in an unsaturated condition due to the low relative concentration at breakthrough. But results show that the AWI works as an additional deposition site because the deposition rate above 5 mM salt concentration is higher in a water-unsaturated condition. Further study is needed to examine how the EDL attractive force acts in a water-unsaturated condition.

3.3. Comparison of the Experimental Value of Single Collector Efficiency η 0 with Calculated Value of η 0 by TE Equation in Water-Saturated Condition

We can calculate the collector efficiency η 0 by Equation (3) from the experimental results above CDC in a water-saturated condition and the TE Equations (5)–(8) using the parameters listed in Table 2. In Figure 5, the horizontal axis is the collector efficiency determined by experimental value and the vertical axis is the calculated value from the TE equation. The diameter of the collector particles dc is treated as a parameter.
The diameter of Toyoura sand measured by the microscopy was 0.274 mm. With this diameter, the calculated value of the collector efficiency by the TE equation is smaller than the experimental value. On the other hand, the specific surface area measured by the air permeability method was 0.012 m2/g, and this corresponds to 0.19 mm diameter by assuming a hard sphere [36]. When this value is used, the calculated values by the TE equation are in good agreement with the experimental ones. The BET method is also used for measuring the specific surface area, but this method measures the outer surface area as well as the internal cracking and micro pore. Therefore, the specific surface area reaches 0.622 m2/g and the converted diameter is 3.6 μm. The air permeability method evaluates the specific surface area as a portion contributes to the flow of the air, which corresponds to the outer periphery of the collector particles.
The correlation equation is established by assuming the spherical collector [14,15] and shows good agreement with the experimental deposition rate obtained in the packed beds of spherical beads [14,15]. In contrast, Toyoura sand particles are not spherical in shape, and also have surface roughness. Thus, the TE equation underestimates the experimental value, if the collector diameter measured by microscopy is used for the calculation. However, the TE equation is available to the non-spherical particles by taking account of the effects of surface roughness and particle shape as an “effective” collector diameter. Our results suggest that the use of the fluid dynamic diameter calculated from the surface area determined from air permeability is useful for the evaluation of colloid deposition using the TE equation.

4. Conclusions

We performed colloid transport experiments in packed beds of sand particles focusing on the initial deposition stage in water-saturated and unsaturated conditions. The negatively charged original silica particles and the positively charged amino–silica particles were used for the experiment to examine the effects of electric double layer (EDL) interaction.
With the negatively charged silica particles, the deposition rate constant of the water-unsaturated condition is larger than that of the saturated condition at each salt concentration due to the existence of the interface between air and water. The deposition rate increases with increasing salt concentration and reaches a constant above critical deposition concentration (CDC). In addition, the CDC is almost the same value irrespective of water saturation. When the silica particles are positively charged, the deposition rate constant of the water-unsaturated condition is also larger than that of the water-saturated condition, and the deposition rate is slightly increased at 0.05 mM due to the attractive EDL force in the water-saturated condition.
Collector efficiency calculated by the Tufenkji and Elimelech (TE) equation is smaller than the experimental value, when the collector diameter measured by microscopy is used. Meanwhile, the calculated value agrees with the experimental value, if we use the fluid dynamic collector diameter converted from the specific surface area measured by the air-permeability method. This suggests that the TE equation is available for non-spherical collectors by using fluid dynamic size reflecting surface roughness and shapes as a collector diameter.

Author Contributions

Y.F. conceived the idea and methodology for the project and conducted experiments and wrote the draft of this paper. M.K. conceived the idea for the project and provided ideas for the analysis of the results, supervised the research, and improved this paper. All authors have read and agreed to the published version of the manuscript.

Funding

This study was supported by JSPS KAKENHI (19H03070).

Conflicts of Interest

The authors declare no conflict of interest.

Abbreviations

AWIAir–water interface
AWSAir–water–solid interface
CDCCritical deposition concentration
EDLElectric double layer
PVPore volume
CColloid concentration
C0Initial colloid concentration
tTime
DhDispersion coefficient
DDiffusion coefficient
xDistance from column inlet
vPore water velocity
UApproach velocity
LColumn length
kBoltzmann constant
gGravitational acceleration
θVolumetric water contents
kpcDeposition rate constants
η0Single collector efficiency
αAttachment efficiency
dcCollector diameter
dpParticle diameter
ρpParticle density
ρfFluid density
µFluid viscosity
TTemperature
AHamaker constant
fPorosity
AsHappel model parameter
ηDCollector efficiency by diffusion
ηICollector efficiency by interception
ηGCollector efficiency by sedimentation
NRAspect ratio
NPEPeclet number characterizing ratio of convective transport to diffusive transport
Nvdwvan der Waals number characterizing ratio of van der Waals interaction energy to the particle’s thermal energy
NARepresents combined influence of van der Waals attraction forces and fluid velocity on particle deposition rate due to interceptionGravity
NGRatio of Stokes particle settling velocity to approach velocity of the fluid
ω ( 1 f ) 1 3

References

  1. Yao, K.M.; Habibian, M.T.; O’Melia, C.R. Water and waste water filtration. Concepts and applications. Environ. Sci. Technol. 1971, 5, 1105–1112. [Google Scholar] [CrossRef]
  2. Kretzschmar, R.; Borkovec, M.; Grolimund, D.; Elimelech, M. Mobile subsurface colloids and their role in contaminant transport. Adv. Agron. 1999, 66, 121–193. [Google Scholar] [CrossRef]
  3. McCarthy, J.; Zachara, J. ES & T Features: Subsurface transport of contaminants. Environ. Sci. Technol. 1989, 23, 496–502. [Google Scholar] [CrossRef]
  4. Novikov, A.P.; Kalmykov, S.N.; Utsunomiya, S.; Ewing, R.C.; Horreard, F.; Merkulov, A.; Clark, S.B.; Tkachev, V.V.; Myasoedov, B.F. Colloid transport of plutonium in the far-field of the Mayak Production Association. Russia. Sci. 2006, 314, 638–641. [Google Scholar] [CrossRef] [Green Version]
  5. Yamaguchi, N.; Mitome, M.; Akiyama-Hasegawa, K.; Asano, M.; Adachi, K.; Kogure, T. Internal structure of cesium-bearing radioactive microparticles released from Fukushima nuclear power plant. Sci. Rep. 2016, 6, 20548. [Google Scholar] [CrossRef] [Green Version]
  6. Saiers, J.E.; Lenhart, J.J. Ionic-strength effects on colloid transport and interfacial reactions in partially saturated porous media. Water Resour. Res. 2003, 39. [Google Scholar] [CrossRef] [Green Version]
  7. Torkzaban, S.; Bradford, S.A.; van Genuchten, M.T.; Walker, S.L. Colloid transport in unsaturated porous media: The role of water content and ionic strength on particle straining. J. Contam. Hydrol. 2008, 96, 113–127. [Google Scholar] [CrossRef]
  8. Fujita, Y.; Kobayashi, M. Transport of colloidal silica in unsaturated sand: Effect of charging properties of sand and silica particles. Chemosphere 2016, 154, 179–186. [Google Scholar] [CrossRef]
  9. Morales, V.L.; Sang, W.; Fuka, D.R.; Lion, L.W.; Gao, B.; Steenhuis, T.S. Impact of dissolved organic matter on colloid transport in the vadose zone: Deterministic approximation of transport deposition coefficients from polymeric coating characteristics. Water Res. 2011, 45, 1691–1701. [Google Scholar] [CrossRef]
  10. Zevi, Y.; Dathe, A.; Mccarthy, J.F.; Richards, B.K.; Steenhuis, T.S. Distribution of colloid particles onto interfaces in partially saturated sand. Environ. Sci. Technol. 2005, 39, 7055–7064. [Google Scholar] [CrossRef]
  11. Wang, Z.; Zhang, W.; Li, S.; Zhou, J.; Liu, D. Transport of silica colloid through saturated porous media under different hydrogeochemical and hydrodynamic conditions considering managed aquifer recharge. Water 2016, 8, 555. [Google Scholar] [CrossRef] [Green Version]
  12. Chen, Y.; Ma, J.; Wu, X.; Weng, L.; Li, Y. Sedimentation and Transport of Different Soil Colloids: Effects of Goethite and Humic Acid. Water 2020, 12, 980. [Google Scholar] [CrossRef] [Green Version]
  13. Guerrero-Martínez, A.; Pérez-Juste, J.; Liz-Marzán, L.M. Recent progress on silica coating of nanoparticles and related nanomaterials. Adv. Mater. 2010, 22, 1182–1195. [Google Scholar] [CrossRef]
  14. Tufenkji, N.; Elimelech, M. Correlation equation for predicting single-collector efficiency in physicochemical filtration in saturated porous media. Environ. Sci. Technol. 2004, 38, 529–536. [Google Scholar] [CrossRef]
  15. Nelson, K.E.; Ginn, T.R. New collector efficiency equation for colloid filtration in both natural and engineered flow conditions. Water Resour. Res. 2011, 47. [Google Scholar] [CrossRef] [Green Version]
  16. Elimelech, M.; O’Melia, C.R. Effect of particle size on collision efficiency in the deposition of Brownian particles with electrostatic energy barriers. Langmuir 1990, 6, 1153–1163. [Google Scholar] [CrossRef]
  17. Elimelech, M. Kinetics of capture of colloidal particles in packed beds under attractive double layer interactions. J. Colloid Interface Sci. 1991, 146, 337–352. [Google Scholar] [CrossRef]
  18. Wan, J.; Tokunaga, T.K. Partitioning of clay colloids at air–water interfaces. J. Colloid Interface Sci. 2002, 247, 54–61. [Google Scholar] [CrossRef] [Green Version]
  19. Lenhart, J.J.; Saiers, J.E. Transport of silica colloids through unsaturated porous media: Experimental results and model comparisons. Environ. Sci. Technol. 2002, 36, 769–777. [Google Scholar] [CrossRef]
  20. Crist, J.T.; McCarthy, J.F.; Zevi, Y.; Baveye, P.; Throop, J.A.; Steenhuis, T.S. Pore-scale visualization of colloid transport and retention in partly saturated porous media. Vadose Zone J. 2004, 3, 444–450. [Google Scholar] [CrossRef]
  21. Mitropoulou, P.N.; Syngouna, V.I.; Chrysikopoulos, C.V. Transport of colloids in unsaturated packed columns: Role of ionic strength and sand grain size. Chem. Eng. J. 2013, 232, 237–248. [Google Scholar] [CrossRef]
  22. Sang, W.; Morales, V.L.; Zhang, W.; Stoof, C.R.; Gao, B.; Schatz, A.L.; Zhang, Y.; Steenhuis, T.S. Quantification of colloid retention and release by straining and energy minima in variably saturated porous media. Environ. Sci. Technol. 2013, 47, 8256–8264. [Google Scholar] [CrossRef]
  23. Donaldson, S.H., Jr.; Røyne, A.; Kristiansen, K.; Rapp, M.V.; Das, S.; Gebbie, M.A.; Lee, D.W.; Stock, P.; Valtiner, M.; Israelachvili, J. Developing a general interaction potential for hydrophobic and hydrophilic interactions. Langmuir 2015, 31, 2051–2064. [Google Scholar] [CrossRef]
  24. Bradford, S.A.; Torkzaban, S. Colloid transport and retention in unsaturated porous media: A review of interface-, collector-, and pore-scale processes and models. Vadose Zone J. 2008, 7, 667–681. [Google Scholar] [CrossRef] [Green Version]
  25. Flury, M.; Surachet, A. Role of air-water interfaces in colloid transport in porous media: A review. Water Resour. Res. 2017, 53, 5247–5275. [Google Scholar] [CrossRef]
  26. Zhang, W.; Zhang, W.; Morales, V.L.; Cakmak, M.E.; Salvucci, A.E.; Geohring, L.D.; Hay, A.G.; Parlange, J.Y.; Steenhuis, T.S. Colloid transport and retention in unsaturated porous media: Effect of colloid input concentration. Environ. Sci. Technol. 2010, 44, 4965–4972. [Google Scholar] [CrossRef]
  27. Johnson, P.R.; Elimelech, M. Dynamics of colloid deposition in porous media: Blocking based on random sequential adsorption. Langmuir 1995, 11, 801–812. [Google Scholar] [CrossRef]
  28. Kuhnen, F.; Barmettlera, K.; Bhattacharjeeb, S.; Elimelechb, M.; Kretzschmara, R. Transport of iron oxide colloids in packed quartz sand media: Monolayer and multilayer deposition. J. Colloid Interface Sci. 2000, 231, 32–41. [Google Scholar] [CrossRef]
  29. Kobayashi, M.; Skarba, M.; Galletto, P.; Cakara, D.; Borkovec, M. Effects of heat treatment on the aggregation and charging of Stöber-type silica. J. Colloid Interface Sci. 2005, 292, 139–147. [Google Scholar] [CrossRef]
  30. Hiemstra, T.; Van Riemsdijk, W.H.; Bolt, G.H. Multisite proton adsorption modeling at the solid/solution interface of (hydr) oxides: A new approach: I. Model description and evaluation of intrinsic reaction constants. J. Colloid Interface Sci. 1989, 133, 91–104. [Google Scholar] [CrossRef]
  31. Kobayashi, M.; Juillerat, F.; Galletto, P.; Bowen, P.; Borkovec, M. Aggregation and charging of colloidal silica particles: Effect of particle size. Langmuir 2005, 21, 5761–5769. [Google Scholar] [CrossRef] [PubMed]
  32. Kobayashi, M.; Sugimoto, T.; Yamada, K.; Pham, T.D.; Honjo, Y. Soil and related interfacial electric phenomena:3 Electrokinetic phenomena and their applications. Jpn. J. Soil Sci. Plant Nutr. 2014, 85, 251–258. (In Japanese) [Google Scholar] [CrossRef]
  33. Yang, C.; Dabrosb, T.; Lic, D.; Czarneckid, J.; Masliyahe, J.H. Measurement of the zeta potential of gas bubbles in aqueous solutions by microelectrophoresis method. J. Colloid Interface Sci. 2001, 243, 128–135. [Google Scholar] [CrossRef]
  34. Lu, H.T. Synthesis and characterization of amino-functionalized silica nanoparticles. Colloid J. 2013, 75, 311–318. [Google Scholar] [CrossRef]
  35. Shiratori, K.; Yamashita, Y.; Adachi, Y. Deposition and subsequent release of Na-kaolinite particles by adjusting pH in the column packed with Toyoura sand. Colloid Surf. A Physicochem. Eng. Asp. 2007, 306, 137–141. [Google Scholar] [CrossRef]
  36. Uno, T.; Sugii, T.; Kamiya, K. Considerations of permeability related to physical properties of particles based on the measurement of specific surface area. J. Jpn. Soc. Civ. Eng. 1993, 469, 25–34. [Google Scholar] [CrossRef] [Green Version]
  37. Israelachvili, J.N. Intermolecular and Surface Forces; Academic Press: Cambridge, MA, USA, 2011. [Google Scholar]
  38. Zhuang, J.; Qi, J.; Jin, Y. Retention and transport of amphiphilic colloids under unsaturated flow conditions: Effect of particle size and surface property. Environ. Sci. Technol. 2005, 39, 7853–7859. [Google Scholar] [CrossRef]
  39. Wan, J.; Wilson, J.L. Colloid transport in unsaturated porous media. Water Resour. Res. 1994, 30, 857–864. [Google Scholar] [CrossRef]
  40. Kobayashi, M.; Nanaumi, H.; Muto, Y. Initial deposition rate of latex particles in the packed bed of zirconia beads. Colloid Surf. A Physicochem. Eng. Asp. 2009, 347, 2–7. [Google Scholar] [CrossRef]
  41. Sugimoto, T.; Watanabe, Y.; Kobayashi, M. Kinetics of turbulent hetero-coagulation of oppositely charged colloidal particles. Theor. Appl. Mech. Jpn. 2015, 63, 133–145. [Google Scholar] [CrossRef]
Figure 1. Zeta potentials of air bubble, Toyoura sand, amino−silica, and original silica [32,33].
Water 12 02892 g001
Figure 2. The conceptual picture of the colloid transport experiment in a column.
Water 12 02892 g002
Figure 3. Column transport experiment of silica and amino–silica in initial deposition condition. Upper row, left side: (a) original silica in water-saturated condition. Upper row right side: (b) original silica in water-unsaturated condition. Lower row, left side: (c) amino–silica in water-saturated condition. Lower row, right side: (d) amino–silica in water-unsaturated condition.
Water 12 02892 g003aWater 12 02892 g003b
Figure 4. Deposition rate constants of silica and amino-silica. (a) Saturated condition and (b) unsaturated condition.
Water 12 02892 g004
Figure 5. Comparison of the experimental collector efficiency (EXP) and calculated collector efficiency by Tufenkji and Elimelech (TE) equation [14] obtained using different assumed collector diameter dc.
Water 12 02892 g005
Table 1. Experimental conditions for silica transport in the column.
ConditionpHSaturationApproachPore Water
ParticleSaturation(%)Velocity (10−3 cm/s)Velocity (10−3 cm/s)
SilicaSaturated6.9 ± 0.13100 ± 03.5 ± 0.118.1 ± 0.27
Unsaturated6.9 ± 0.2948.1 ± 6.31.7 ± 0.068.5 ± 1.10
Amino–silicaSaturated5.0 ± 0.34100 ± 03.6 ± 0.138.4 ± 0.31
Unsaturated5.3 ± 0.2154.7 ± 9.01.8 ± 0.047.9 ± 1.42
Table 2. Parameters for calculation of collector efficiency by Tufenkji and Elimelech’s equation (TE eq), which can be summarized as Equations (6)–(15) [14].
Parameters Units
Collector diameter (dc)0.274Mm
Particle diameter (dp)490Nm
Particle density (ρp)2200kg/m3
Fluid density (ρf)1000kg/m3
Fluid viscosity (µ)1.002 × 10⁻³Pa s
Temperature (T)293K
Hamaker constant (A)8.3 × 10⁻²¹J
Porosity (f)0.429-
Happel model parameter (As)38.0-
Publisher’s Note: MDPI stays neutral with regard to jurisdictional claims in published maps and institutional affiliations.

