Article

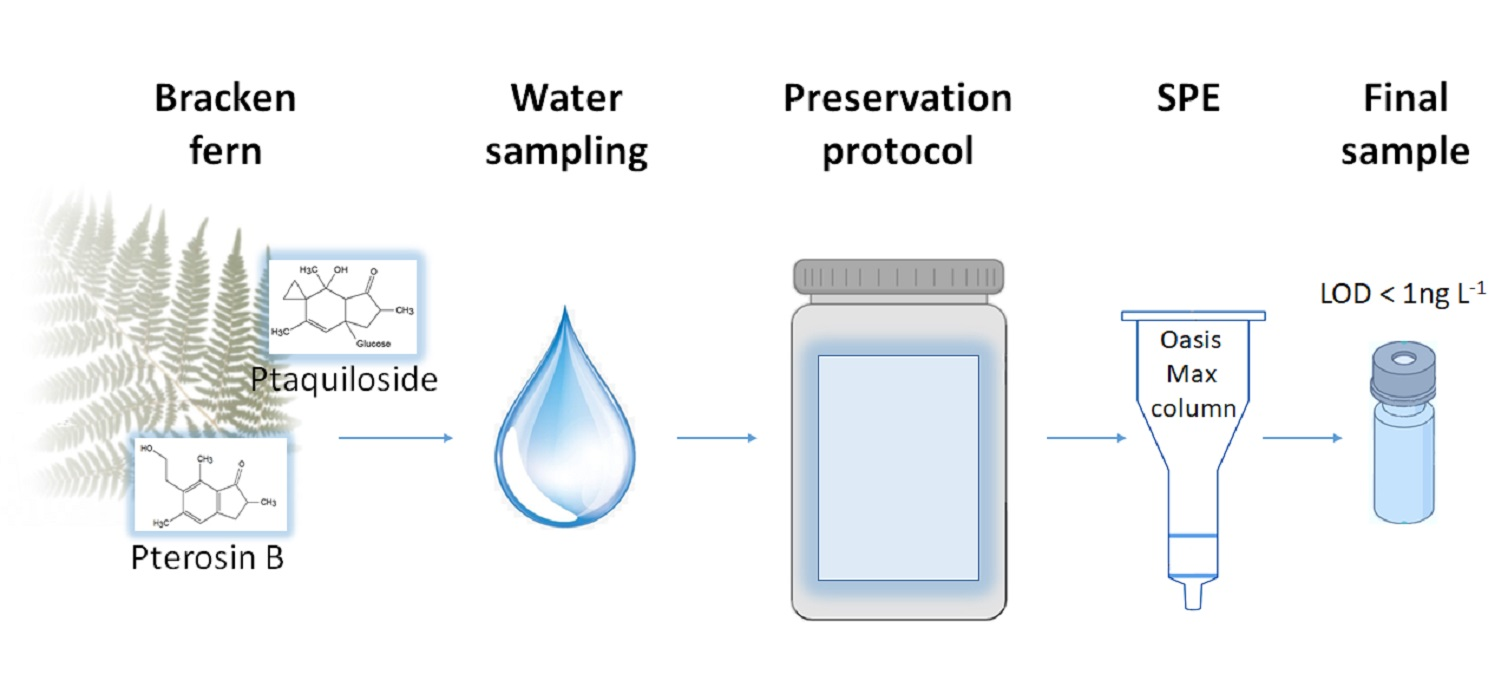
A Novel Method for Determination of the Natural Toxin Ptaquiloside in Ground and Drinking Water

by
Natasa Skrbic
1,2,*,
Ann-Katrin Pedersen
1,
Sarah C. B. Christensen
1,
Hans Christian Bruun Hansen
2 and
Lars Holm Rasmussen
3
1
Greater Copenhagen Utility HOFOR, Parkstien 10, 2450 Copenhagen, Denmark
2
Department of Plant and Environmental Sciences, University of Copenhagen, Thorvaldsensvej 40, 1871 Frederiksberg, Denmark
3
Department of Technology, University College Copenhagen, Sigurdsgade 26, 2200 Copenhagen, Denmark
*
Author to whom correspondence should be addressed.
Water 2020, 12(10), 2852; https://doi.org/10.3390/w12102852
Submission received: 7 September 2020 / Revised: 4 October 2020 / Accepted: 8 October 2020 / Published: 13 October 2020
(This article belongs to the Special Issue Emerging Contaminants (ECs) in Water)

Abstract

:
Ptaquiloside (PTA) is a carcinogenic compound naturally occurring in bracken ferns (Pteridium aquilinum). It is highly water soluble and prone to leaching from topsoil to surface and groundwaters. Due to possible human exposure via drinking water, PTA is considered as an emerging contaminant. We present a sensitive and robust method for analysis of PTA and its degradation product pterosin B (PtB) in groundwater. The method comprises two steps: sample preservation at the field site followed by sample pre-concentration in the laboratory. The preservation step was developed by applying a Plackett–Burman experimental design testing the following variables: water type, pH, filtering, bottle type, storage temperature, transportation conditions and test time. The best sample preservation was obtained by using amber glass bottles, unfiltered solutions buffered at pH 6, transported without ice, stored at 4 °C and analysed within 48 h. The recovery was 94% to 100%. The sample purification step had a pre-concentration factor of 250, and the recovery percentages of the entire method were 85 ± 2 (PTA) and 91 ± 3 (PtB). The limits of detection (LOD) of the full method were 0.001 µg L−1 and 0.0001 µg L−1 for PTA and PtB, respectively. The method enables sensitive monitoring of PTA and PtB in groundwater. Carcinogenic PTA was detected in one groundwater well (0.35 µg L−1).

Graphical Abstract

1. Introduction

Bracken fern Pteridium aquilinum (L.) Kuhn is a cosmopolitan plant species found on all continents except Antarctica. It is considered one of the most abundant plants in the world [1]. This plant species exhibits opportunistic and invasive character, often proliferating into abandoned, newly cut or burned areas. It is mostly found in forests/forest margins, recently deforested areas and regressing farmland [2,3]. The land area covered by bracken is rising on a global scale [4]. In the United Kingdom alone, Pteridium aquilinum (L.) Kuhn covers 7.3% of the total country territory [5,6].
Bracken ferns are well known for their toxic and carcinogenic properties. It is one of the few known plants that can naturally cause cancer in animals [7]. Hence, bracken is placed on the WHO/IARC list of food ingredients that are possibly carcinogenic to humans [8,9]. Direct ingestion of ferns like Pteridium spp., Pteris spp. and Cheilanthes spp. are known to result in severe animal diseases such as acute bracken fern poisoning and chronic bovine enzootic haematuria (BEH) [2]. Ptaquiloside (PTA) is a toxic norsesquiterpene glycoside and the main carcinogenic compound found in bracken [10,11]. In vivo and in vitro experiments indicate that genotoxic and cytotoxic properties of PTA are linked with tumour developments in the urinary and gastrointestinal tract [10,12,13,14]. A recent study indicates that PTA is able to promote oral carcinogenesis initiated by human papilloma virus (HPV16) [15]. Based on the PTA carcinogenic properties, the maximum tolerable concentration of PTA in drinking water has been estimated to be 0.005 to 0.016 µg L−1 [16,17]. In addition to Pteridum spp., PTA is also present in other fern species indicating its potentially larger occurrence in the environment [18].
Ptaquiloside is naturally present in the fronds, rhizomes and roots of bracken ferns [16]. PTA is found in variable concentrations in bracken fronds ranging from of 0.28 to 13.3 mg g−1 in New Zealand and 2.49 to 2.75 mg g−1 in Brasil [19,20,21,22]. Content of PTA in rhizomes is at levels between 0.01–0.90 mg g−1 [16,23]. Estimated total PTA load in mature bracken biomass is between 0.1 and 5.9 kg per ha [23,24]. Ptaquiloside is highly water soluble and leaches from the bracken fronds while bracken is still living and from litter material after it is dead [16,23]. The highly polar PTA shows very low affinity for bonding to soil particles. It is regularly found in bracken-covered soils with reported concentrations up to 7 µg L−1 in soil solution sampled at 90 cm depth [17,24]. Due to the high PTA solubility and low sorption, PTA is prone to leaching from topsoil to surface and groundwaters [16,25,26]. Recent findings from Denmark, United Kingdom and Ireland have confirmed PTA leaching to surface and upper groundwaters in bracken-dominated areas. PTA concentrations of 0.6 µg L−1 have been reported for groundwater in Ireland, up to 0.09 μg L−1 in Denmark, while PTA concentrations in surface water have reached concentrations as high as 2.2 µg L−1 during rainstorm events [26,27,28].
Ptaquiloside hydrolyses to form the much more hydrophobic pterosin B (PtB), as shown in Table 1, which is considered nontoxic [29,30,31]. Pterosin B reflects the former presence of PTA, and it can be found in bracken plant material, in soil layers and as a hydrolysis product in waters [26,32]. The stability of PTA in aqueous solutions has been shown to be strongly dependent on pH and temperature. PTA quickly degrades in aqueous solutions in the neutral to alkaline pH range, with estimated half-lives <24 h at 22 °C when pH > 6. A window of slow PTA degradation is found to be between pH 4.4 and 6.4 at low temperatures [25]. In addition, PTA hydrolysis is retarded by the presence of clay minerals [33]. In sterile soil solution, no significant degradation of PTA was observed within 28 days indicating a stabilizing effect by soil solution constituents [17,33]. In contrast, PTA can be easily degraded in nonsterile sand soil at 10 °C where PTA disappears within four weeks, and degradation is determined to be primarily microbial [34]. In unpreserved water samples (pH 8.1) PTA almost completely disappears after 24 h [35]. Hence, PTA is chemically unstable under acidic and alkaline conditions, and it is prone to microbial degradation at a wide pH range, making it challenging to collect and preserve for analysis.
Humans can be exposed to PTA via several pathways. Ingestion of young crosiers, inhaling the spores and intake of milk or meat coming from cows that have been browsing on bracken are known sources of human exposure to PTA [36,37,38,39]. Recent findings suggest that PTA could be a contaminant of concern for drinking water suppliers in bracken dominated areas and for water abstraction from single-house wells [26,27,28]. A novel modelling approach, which assesses the PTA fate in plant-soil matrix, indicates that intense precipitation over the fully developed canopy will result in significant PTA release [40]. Fast leaching of PTA beyond microbially active layers following intense rainfall events at low subsurface temperatures may be of key importance [26]. In addition, clay-containing aquifers and/or moderate acid groundwaters could make PTA hydrolysis very slow and thus sustain PTA presence for months [25,26,33]. In particular, wells with younger groundwater could be more vulnerable as there is a higher likelihood of toxin to be present. Still, to the best of our knowledge, there has been no attempt to monitor PTA and PtB in groundwater used for drinking water supply.
Analysis of PTA in groundwater is challenging due to the concentrations typically at ng L−1 scale and due to its unstable nature. The analytical methods for quantification of PTA and PtB are based on HPLC-UV [25,41,42], LC-MS [43,44], LC-MS/MS [35,45] and GC-MS [46]. Available analytical methods for PTA analysis in water including pre-concentration are UPLC-MS/MS method with LOD of 0.008 µg L−1 [35] and LC-MS/MS method with LOD 0.01 µg L−1 [28,41]. These methods are not fully optimised nor validated for groundwater analysis. Thus, a more sensitive and controlled sample preparation method is needed to ensure sample integrity and maintain the stability of PTA from sampling until analysis. A reliable method would be of great interest for regions where drinking water supply is entirely dependent on groundwater.
The aim of this study is to develop and validate a sensitive and robust preservation and pre-concentration method for determination of PTA and PtB in groundwater with LOD ≤ 0.001 µg L−1. The developed method was applied for monitoring of PTA and PtB of six groundwater wells in Denmark. The degradation product PtB was included in investigation as it serves as a memory of the past presence of PTA [26].

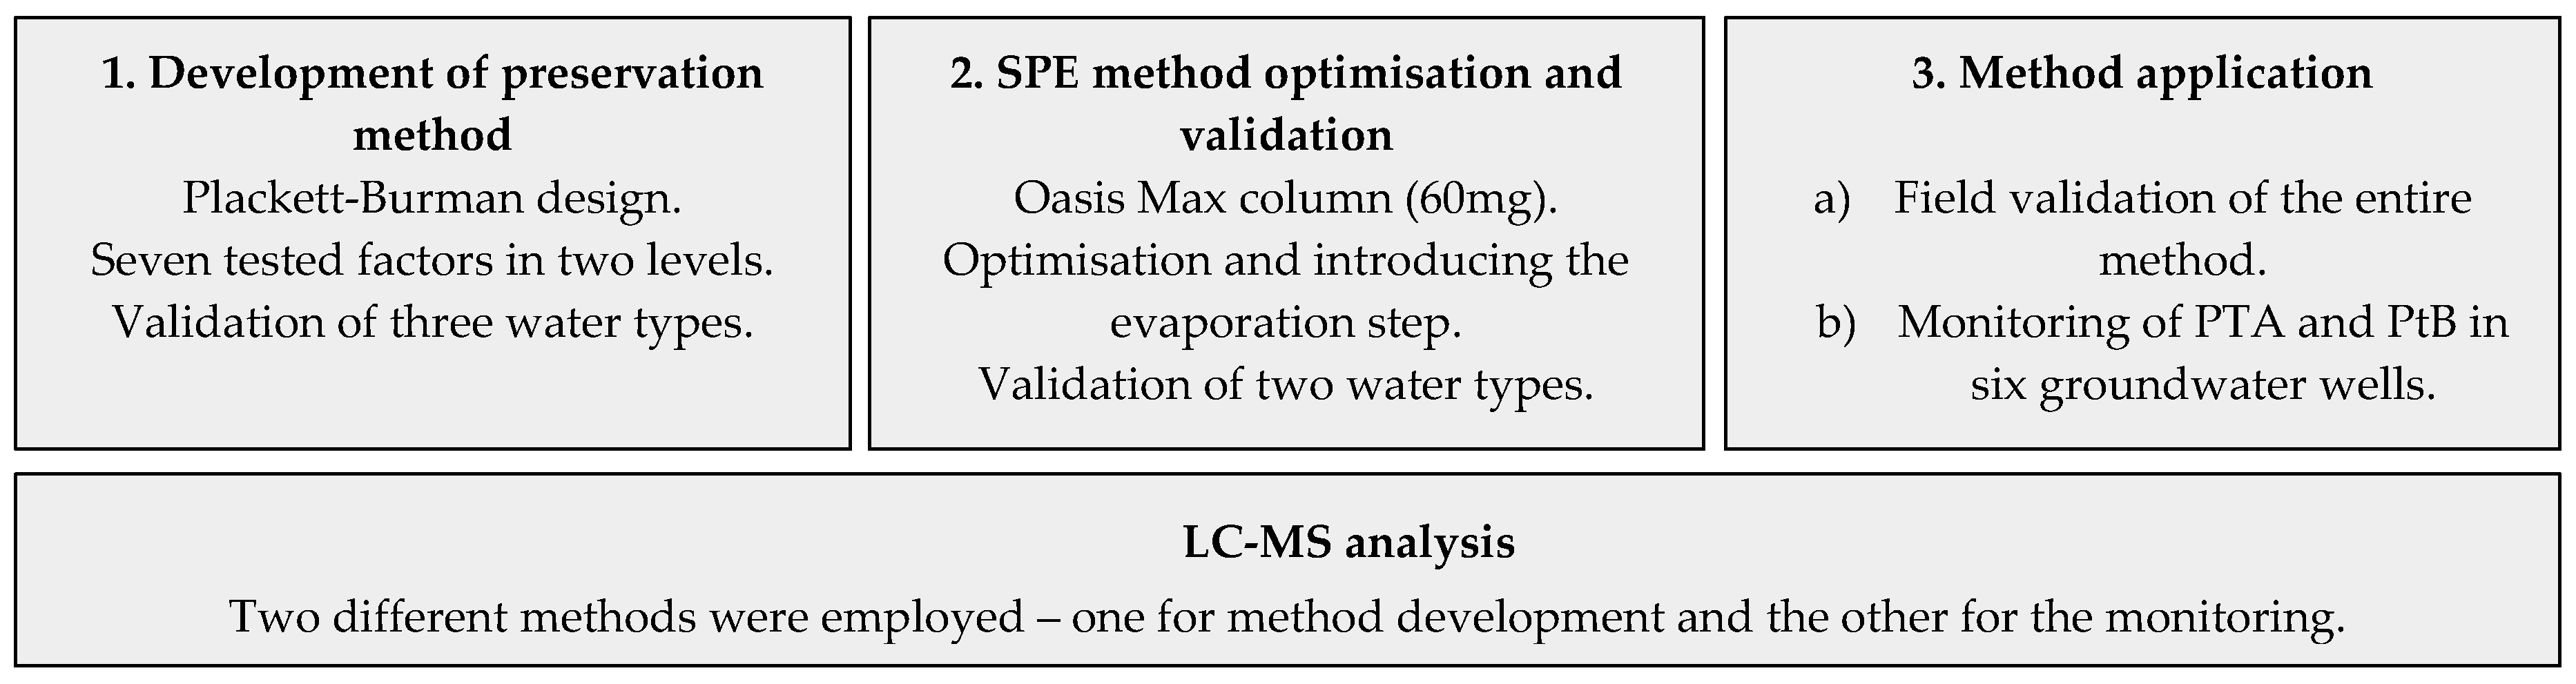
2. Materials and Methods

Development of the method for determination of PTA and PtB in groundwater comprised three steps (Figure 1). First step was establishing the preservation method by applying Plackett–Burman experimental design. Once the effective preservation protocol was developed, optimisation of SPE (solid phase extraction) method for PTA and PtB in groundwater was performed. All samples were analysed by liquid chromatography–mass spectrometry (LC-MS). Finally, the entire method was field validated and applied for PTA and PtB monitoring in six groundwater wells in Denmark. This section describes each of the steps in detail.

2.1. Chemical and Reagents

Analytical grades ammonium acetate, acids and bases (sodium hydroxide, glacial acetic acid, formic and hydrochloric acids) were obtained from Sigma-Aldrich (Steinheim, Germany). LC-MS grade methanol was purchased from Honeywell (LC-MS Chromasolv, Charlotte, NC, USA), while LC-MS grade acetonitrile was obtained from Merck Millipore (LiChrosolv hypergrade for LC-MS, Darmstadt, Germany). All solutions and eluents for LC-MS were prepared using MilliQ water (electrical resistivity 18.2 MΩcm, TOC less than 2 µg/L) which was produced in-house with a Sartorius Ultrapure water system (Sartorius Stedim Biotech GmbH, Göttingen, Germany). Oasis MAX (20 cc, 60 mg Sorbent, 30 mm particle size) was purchased from Waters (Milford, MA, USA). Finally, we used amber glass bottles (Avantor, Radnor, PA, USA), plastic bottles (Frisenette, Knebel, Denmark) and cellulose acetate filters 0.22 μm (Frisenette, Knebel, Denmark).

2.2. Stock Solutions and Calibration Standards

PTA and PtB were isolated and purified from dry bracken material using the procedure described in Clauson-Kaas et al. [35]. The purity was determined by quantitative H-NMR using 3-(trimethylsilyl) propionic-2,2,3,3-d4 acid, sodium salt solution as internal standard. PTA and PtB stock solutions used for all spiking experiments were prepared using MilliQ water and kept at −18 °C. The stock solutions were only briefly thawed and shaken before use. Calibration standards were made from pure PTA and PtB in 40% MeOH buffered with 0.1% ammonium acetate (pH 5).

2.3. Water Samples

Three different water types were used in the method development and validation covering different pH and EC as presented in Table 2. Two water types were collected at the largest drinking water well field of the HOFOR utility—Vigersted—which supplies significant amounts of drinking water to the capital city of Denmark, Copenhagen (production of 3.8 million m3 per year). Groundwater from a different part of Denmark (Western Jutland, Esbjerg), with lower pH, was also included in the study. Water chemistry data with more details and a map of the water well field site (Vigersted) are provided in Table S1 and Figure S1 in the Supplementary Material (SM), respectively.

2.4. Preservation Method for PTA

To ensure stability of the analytes from the sampling until analysis, a preservation method for PTA and PtB was developed, and its robustness was tested by applying a Plackett–Burman multifactorial experimental design [48]. This screening design allows identification of influential factors on the experimental response by performing a minimum number of experiments [49]. Seven variables with potential to affect the stability of PTA were selected. First (+) and second (-) level in each assembly designate the two different levels of the same factor (Table 3). Combination of factors in both levels resulted in eight experiments.
Raw groundwater and treated water from Vigersted were used in the Plackett–Burman experiment (Table 2). Each water sample was spiked in the lab with PTA at concentration of 100 µg L−1, and time zero sample was collected for recovery assessment. In order to adjust pH of the water samples, 0.5% ammonium acetate adjusted to pH 5 with glacial acetic acid was used. The volume of added buffer was variable depending on the specific water type (0.1–1.0 mL per 50 mL of water sample). For each water type, acetate buffer was added to a separate aliquot until pH 6.0, as determined by a pH electrode. The same amount of acetate buffer was now added to the samples to be used for PTA and PtB analysis. Water samples were handled with defined combination of factors as shown in Table 3. A flow chart of the described process is provided in Figure S2 of SM. Prior to the LC-MS analysis, all samples were diluted by a factor 2 using 40% MeOH buffered with 0.1% ammonium acetate (pH 5) in order to avoid microbial degradation and hydrolysis. After dilution, concentrations of the analytes in the samples were always within the calibration range of the analytical method (LC-MS). The recovery was evaluated after 48 h by LC-MS. In order to be time and cost efficient, the SPE step was not used in this first part of the study.

2.4.1. Data Analysis—Plackett–Burman Design

For each factor, the difference ( Δ i ) between the average of the results obtained with the factor at its first level and the average of the results obtained with the factor at its second level was calculated (Equation (1)). Letters (lz) correspond to the result labels presented in Table 3.
Δ i = l + m + v + x 4 v + x + y + z 4
To calculate if any of the Δ i are statistically significant, a t-test is applied. Equation (2) is used to compare the difference with the expected precision of the method at the 95% confidence limit (s = 5%) [50]. In that way, we were able to answer if the tested factors significantly influenced PTA stability.
| Δ i | > t × s 2

2.4.2. Robustness of the Preservation Method

The developed preservation method was further validated for both PTA and PtB for three different water types (Table 2) at spiked concentration of 100 µgL−1. In addition, the method was validated for different concentrations of PTA and PtB in the range of 50 to 150 µg L−1 in raw groundwater (Vigersted). Water samples (n = 6) were evaluated for recovery percentage of the compounds by LC-MS after being stored at 4 °C for 48 h.

2.4.3. Stability of PTA and PtB in Groundwater

To quantify the stability of PTA and PtB in the raw groundwater sampled from the Vigersted area and handled with the preservation protocol, concentration of the two analytes (100 µg L−1) was monitored during periods of 90 days (PTA) and 30 days (PtB). The water samples were kept at 4 °C, and samples for LC-MS analysis were collected over time.

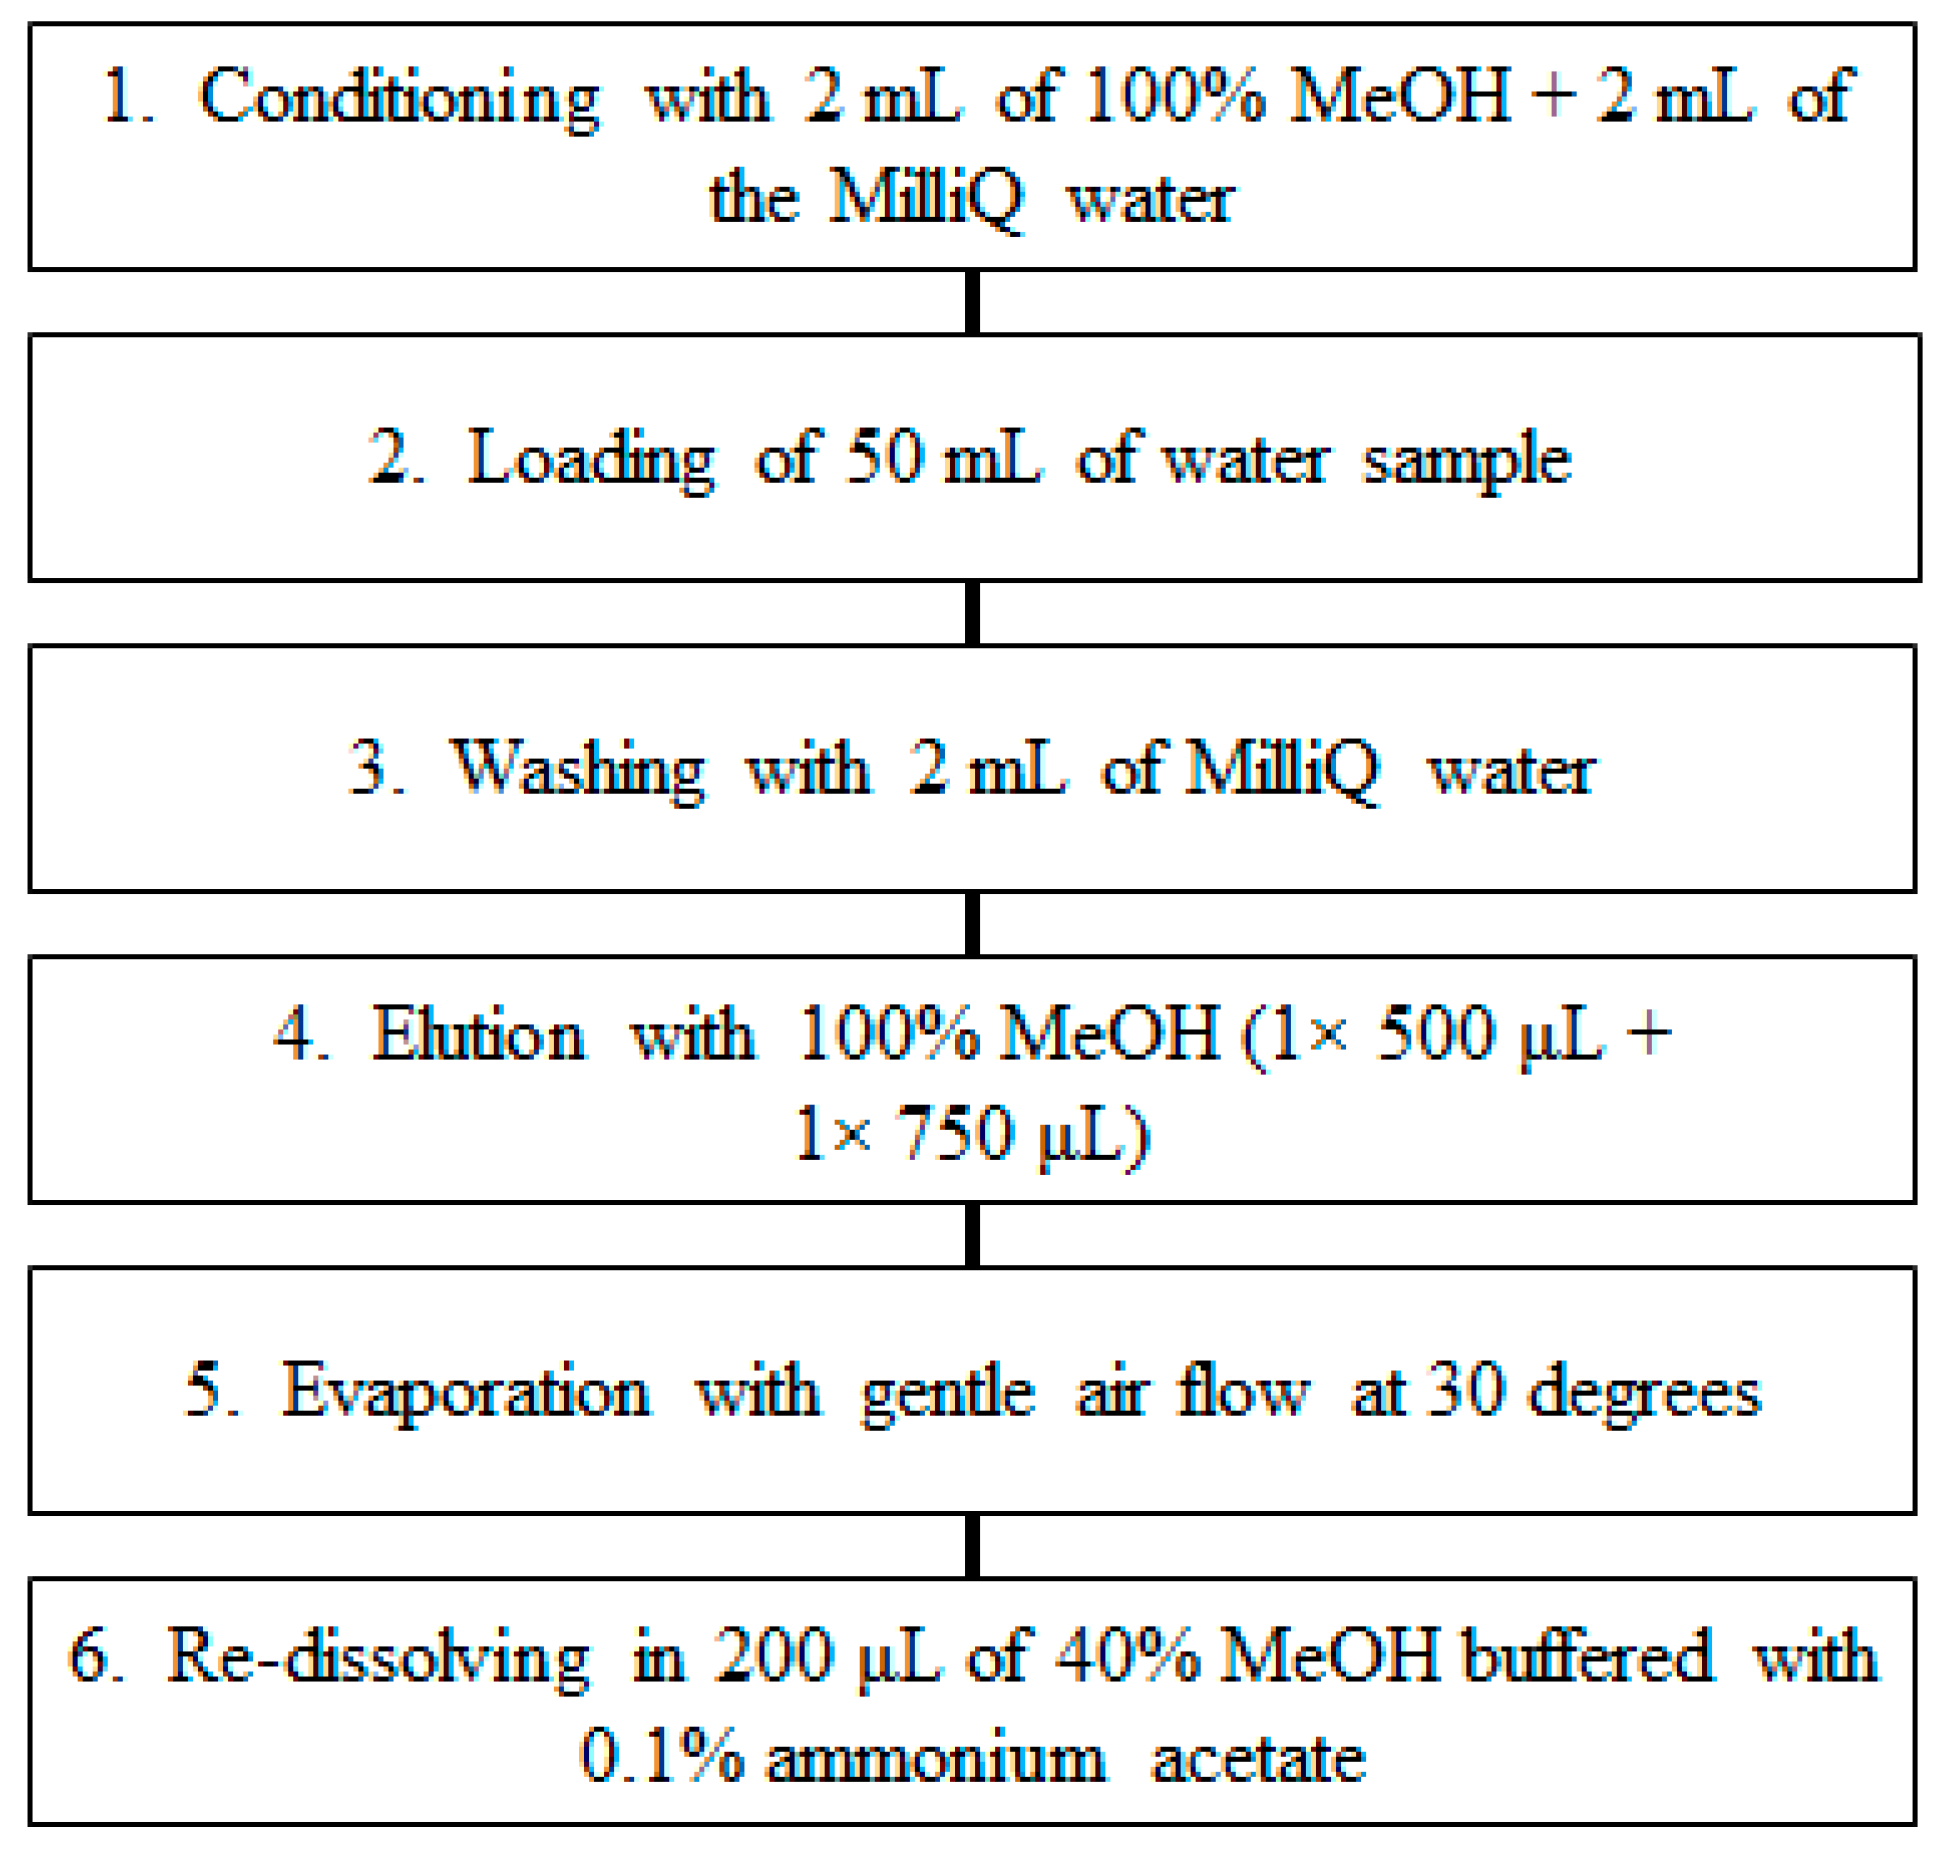
2.5. SPE Method Optimisation

Solid-phase extraction (SPE) was optimised using Oasis MAX (60 mg) columns (Waters), which has been proved to be successful in pre-concentration of PTA and PtB [35,41]. Different loading volumes of water were tested: 10, 25, 50 and 100 mL of MilliQ water spiked with PTA to the concentration of 100 µg L−1. The same SPE material, but with a higher amount of sorbent, was also evaluated (Oasis MAX, 150 mg).
Existing in-house SPE protocols by Clauson-Kaas et al. and Jensen et al. were further optimised and validated [35,41]. The final SPE protocol is presented in Figure 2. The column was conditioned and a total of 50 mL of groundwater sample was added to the column. The washing step with 15% MeOH was omitted, while the elution step was performed with higher amount of eluent. An evaporation step with gentle air flow was introduced, which facilitated evaporation of the higher eluate volume to dryness in 30 °C heating block (Mikrolab, Aarhus Supertherm). The final sample volume was 200 μL, resulting in a pre-concentration factor of 250. Introduction of the evaporation step enabled significant increase of the method limit of detection (LOD).

2.5.1. Robustness of the SPE Method

The developed SPE protocol was validated for raw groundwater and treated water for both PTA and PtB. Water samples were spiked at the concentration of 0.5 µg L−1 (n = 6) and evaluated for recovery. The compounds were determined by LC-MS.

2.5.2. Full Method Validation Including Preservation and SPE

After the preservation and SPE methods were developed and optimised, final field validation took place at the drinking water well field of HOFOR utility–Vigersted. Raw groundwater samples were collected and spiked at the field, at an environmentally relevant concentration of 0.5 µg L−1 for both PTA and PtB. The replicates (n = 6) and field blank were collected, preserved and transported to the lab according to the preservation protocol and processed following the SPE protocol within 48 h. Duplicates of groundwater without spiking were also collected for the analysis. Vials were kept at −18 °C until LC-MS analysis.

2.6. LC-MS Analysis of Water Samples

In this study, all samples were analysed using an Agilent 1260 Infinity HPLC System equipped with Agilent 6130 Single Quadrupole mass spectrometer with electrospray ionization. Injection volumes of 10–100 µL were used. Two different LC-MS methods were employed. For preservation and SPE method development, the method by Rai et al. was applied [43]. Chromatographic separation was performed using an Agilent ZORBAX Eclipse Plus C18 column (100 × 4.6 mm, 3.5 μm, C18) kept at 35 °C (Opti-SOLV-TM 0.5 μm guard column). The eluent comprised 53% MeOH and 47% 0.5 mM sodium acetate (LS-MS grade water) at a flow of 1.0 mL min−1 at isocratic mode. Quantification: PTA [M + Na]+: 421.1 m/z and PtB [M + Na]+: 241.3 m/z. For the monitoring of PTA and PtB in groundwater wells, it was possible to change to a new faster LC-MS method recently published by Kisielius et al. [44]. In this method, an Agilent InfinityLab Poroshell 120 (50 × 3.0 mm, 2.7 μm, EC-C18, column; 5 × 3.0 mm, 2.7 μm, EC-C18 guard column) was used. The analytes were separated in the analytical HPLC system thermostated at 35 °C at 1 mL min−1 flow. The mobile phase comprised water (eluent A) and acetonitrile (eluent B) both with 0.1% v/v formic acid in the following gradient elution: 0–1 min 10% B; 3 min 35% B; 4–4.5 min 95% B; 4.6–5 min 10% B. Quantification: PTA [M-glucose-H2O + H]+: 219.1 m/z and PtB [M + H]+: 219.1 m/z. Additional confirmation ions were monitored for PTA. Beside the single ion mode (SIM), all major fragments were also monitored from the total ion chromatogram (TIC), and detected fragments were compared with the reported confirmation ions: [M-glucose + H]+: 201.1 m/z, [M + Na]+: 421.2 m/z, [M + K]+: 437.1 m/z [44]. Only samples where confirmation ions were detected have been reported as positives. The instrumental LOD for quantification of PTA and PtB were 0.22 μg L−1 and 0.03 μg L−1, respectively.

2.6.1. Validation of the Analytical Method (LC-MS)

In order to define the linearity range of the LC-MS method used in the method development, one set for both PTA and PtB of 10 vials with different concentrations of the analytes was prepared and analysed in random order. The linearity of PTA and PtB was explored in the 1.25–100 µgL−1 range, and calibration curves were constructed. The LOD and LOQ was calculated as 3.3 and 10 times the SDintercept/slope of the calibration curves, respectively. Precision of the instrument was calculated using the relative standard deviation (RSD) for replicate injection (n = 10) of analytical standard injected from the same vial. To assess the method precision, the same analysis was repeated four days later (intraday variation).
The linear range of the LC-MS was found to be 1–100 µgL−1 for PTA and 2-100 µgL−1 for PtB, with a high R2 coefficient (>0.998) for both compounds (Figure S3 in SM). LOD, LOQ and the ranges of precision of instrument and standards are provided in Table 4. Intraday measurements of both PTA and PtB were taken and did not show significant deviation.

2.6.2. Application of the Method

The entire method including preservation and SPE was applied for PTA and PtB monitoring in six groundwater wells (Table 5). All wells included in the monitoring were situated in the vicinity of the Humleore forest (Denmark), where bracken fern is highly abundant. Map of the field site area with investigated wells and their distance to bracken is provided in SM (Figure S1). Only one of the groundwater wells was monitored on two occasions, during the summer and autumn 2019 (well number 4). Water samples were collected in duplicates, pH measured in the field and preserved by adding 0.5% ammonium acetate buffer (pH 5) until pH 6. The samples were pre-concentrated in the lab within 48 h from sampling. The field blank was collected and treated as a real sample during transport, preparation and analysis.

3. Results and Discussion

3.1. Preservation Method for PTA

The combination of factors resulting in best preservation of PTA was determined using the Plackett–Burman experimental design. Only pH showed statistically significant effect on PTA in favour of pH 6, when PTA was most stable in groundwater. Other tested factors did not significantly influence PTA. Therefore, it was possible to fix the level of other factors in the most convenient way for work in the field.
The final groundwater preservation protocol is as follows: 50 mL water sample collected in amber glass bottles, pH 6 obtained by addition of 0.5% ammonium acetate buffer (pH 5) in the field (typically between 0.05 and 1 mL), no filtration, transportation without ice (for transportation up to 2 h), stored at 4 °C if analysed within two weeks (otherwise samples kept at −18 °C).

3.1.1. Robustness of the Preservation Method

The developed method was successful in preserving both PTA and PtB in different groundwater samples. Water samples preserved according to the protocol were analysed after approximately 48 h. Recovery of PTA was 94% to 99% in three water types. For PtB, recoveries between 98% and 100% were found (Figure 3). The relative standard deviations (RSD) for PTB are 0.6–2.7%, while for PTA are 0–2.1% (n = 6).
If not preserved at the field site and stored in cold conditions, PTA starts to hydrolyse resulting in decreasing PTA concentrations with time. The only PTA preservation method available reports recovery of approximately 80% after 24 h in surface water samples [35]. The preservation method developed in this study ensured preservation of both PTA and PtB in various groundwater types close to 100% (after 48 h). The good recovery may be due to the optimised pH level to 6 for each of the water samples (assured by measuring the pH at the field after adding the buffer), instead of adding fixed buffer amount as done in the previous studies [27,28,35]. Furthermore, lower abundance of microorganisms in groundwater compared with surface water probably slowed down microbial degradation of PTA.
The preservation method was further validated for lower (50 µg L−1) and higher (150 µg L−1) concentrations of PTA and PtB (Figure 4). Recoveries obtained for PTA were 96–98% and RSD were 0.7–0.8% (n = 6). For PtB, recovery of 102–112% was measured, with RSD of 2–2.7% (n = 6).

3.1.2. Stability of PTA and PtB in Groundwater

Recovery of PTA close to 90% was measured in raw groundwater samples handled according to the preservation protocol after 30 days at 4 °C. Even higher recovery of 95% was obtained for PtB after storage for 30 days (Figure 5). This study demonstrates that PTA can be stabilised in groundwater samples after applying the preservation protocol, and hence overcomes degradation due to heat, light, acid or alkaline pH [25]. According to this result, water samples buffered at the field site to pH 6 (with ammonium acetate buffer pH 5), stored at 4 °C and analysed within two weeks (when PTA recovery is still 95%) will result in no significant PTA loss.

3.2. SPE Method Optimisation

Water samples were pre-concentrated by solid phase extraction using an OASIS MAX column (60 mg), and different loading volumes were tested for optimised recovery of PTA. The results showed that when the water volume was increased, lower recovery was obtained (Table 6). Other experiments also demonstrated that recovery is related to the volume of groundwater used; the higher the volume, the lower the recovery [41]. SPE columns with more sorbent (150 mg) were also tested for better retention of the analyte. Even though better retention was obtained, analyte extraction from the column required significantly higher volume of the eluent and multiple sample transfers prior and after the evaporation step which finally jeopardized sample integrity. Therefore, the OASIS MAX column with less sorbent (60 mg) was selected. The recovery of PTA after loading 50 mL of water was 85%, which still resulted in the desired LOD (≤0.001 µg L−1).

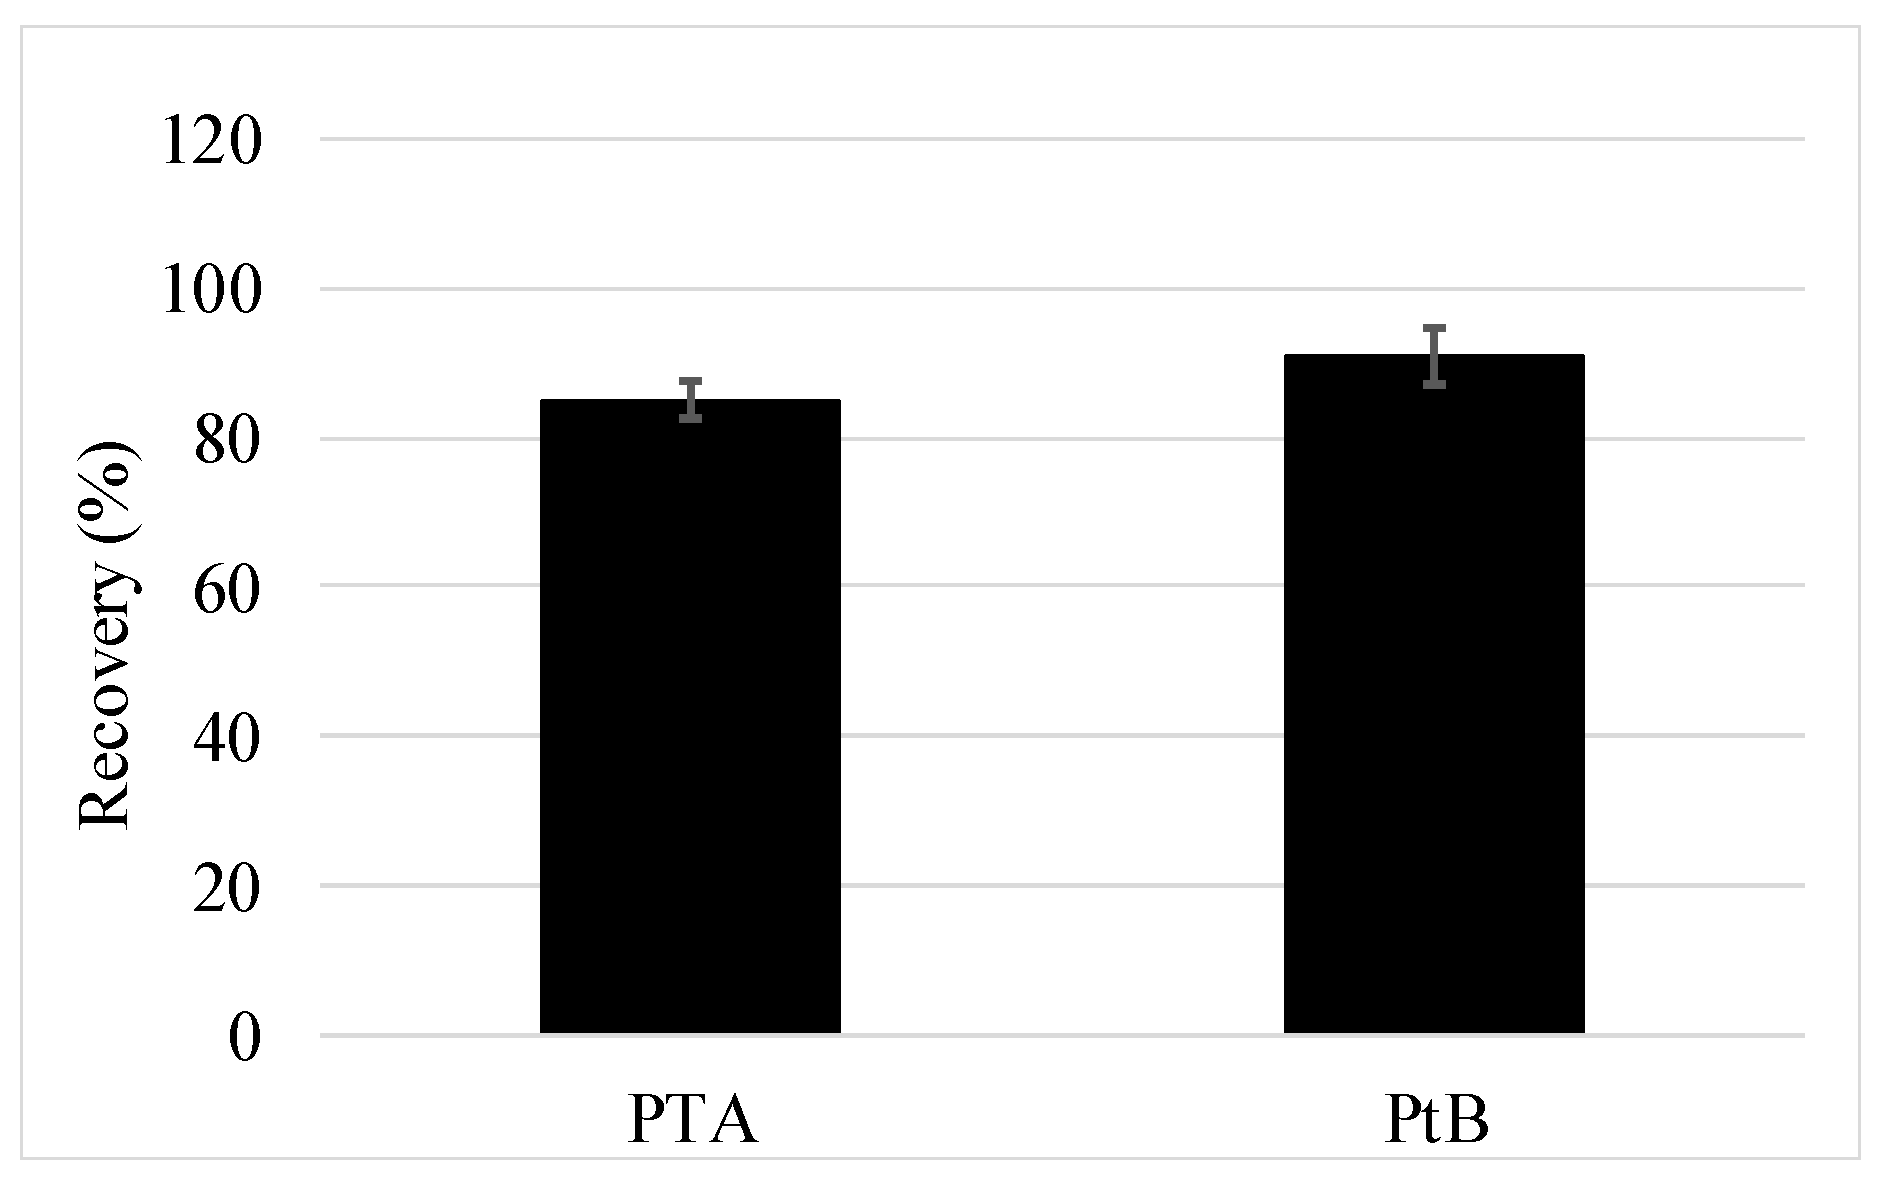
3.2.1. Robustness of the SPE Method

The SPE method was validated for both PTA and PtB in two water types. The recovery obtained for PTA was 79–81%, and 87–92% for PtB (Figure 6). The relative standard deviation (RSD) was 7–8%.
Application of the SPE method resulted in the method pre-concentration factor of 250. LOD of the entire method including pre-concentration and instrumental LOD by Kisielius et al. [44] was determined to be 0.001 µg L−1 and 0.0001 µg L−1 for PTA and PtB, respectively. To the best of our knowledge, it is the lowest LOD for PTA and PtB analyses in water samples that has been achieved so far. The most recent methods reported considerably lower pre-concentration factor with method LOD > 0.001 µg L−1 [27,28,35]. These methods were used in the latest investigations of PTA and PTB in the aquatic environment [27,28].

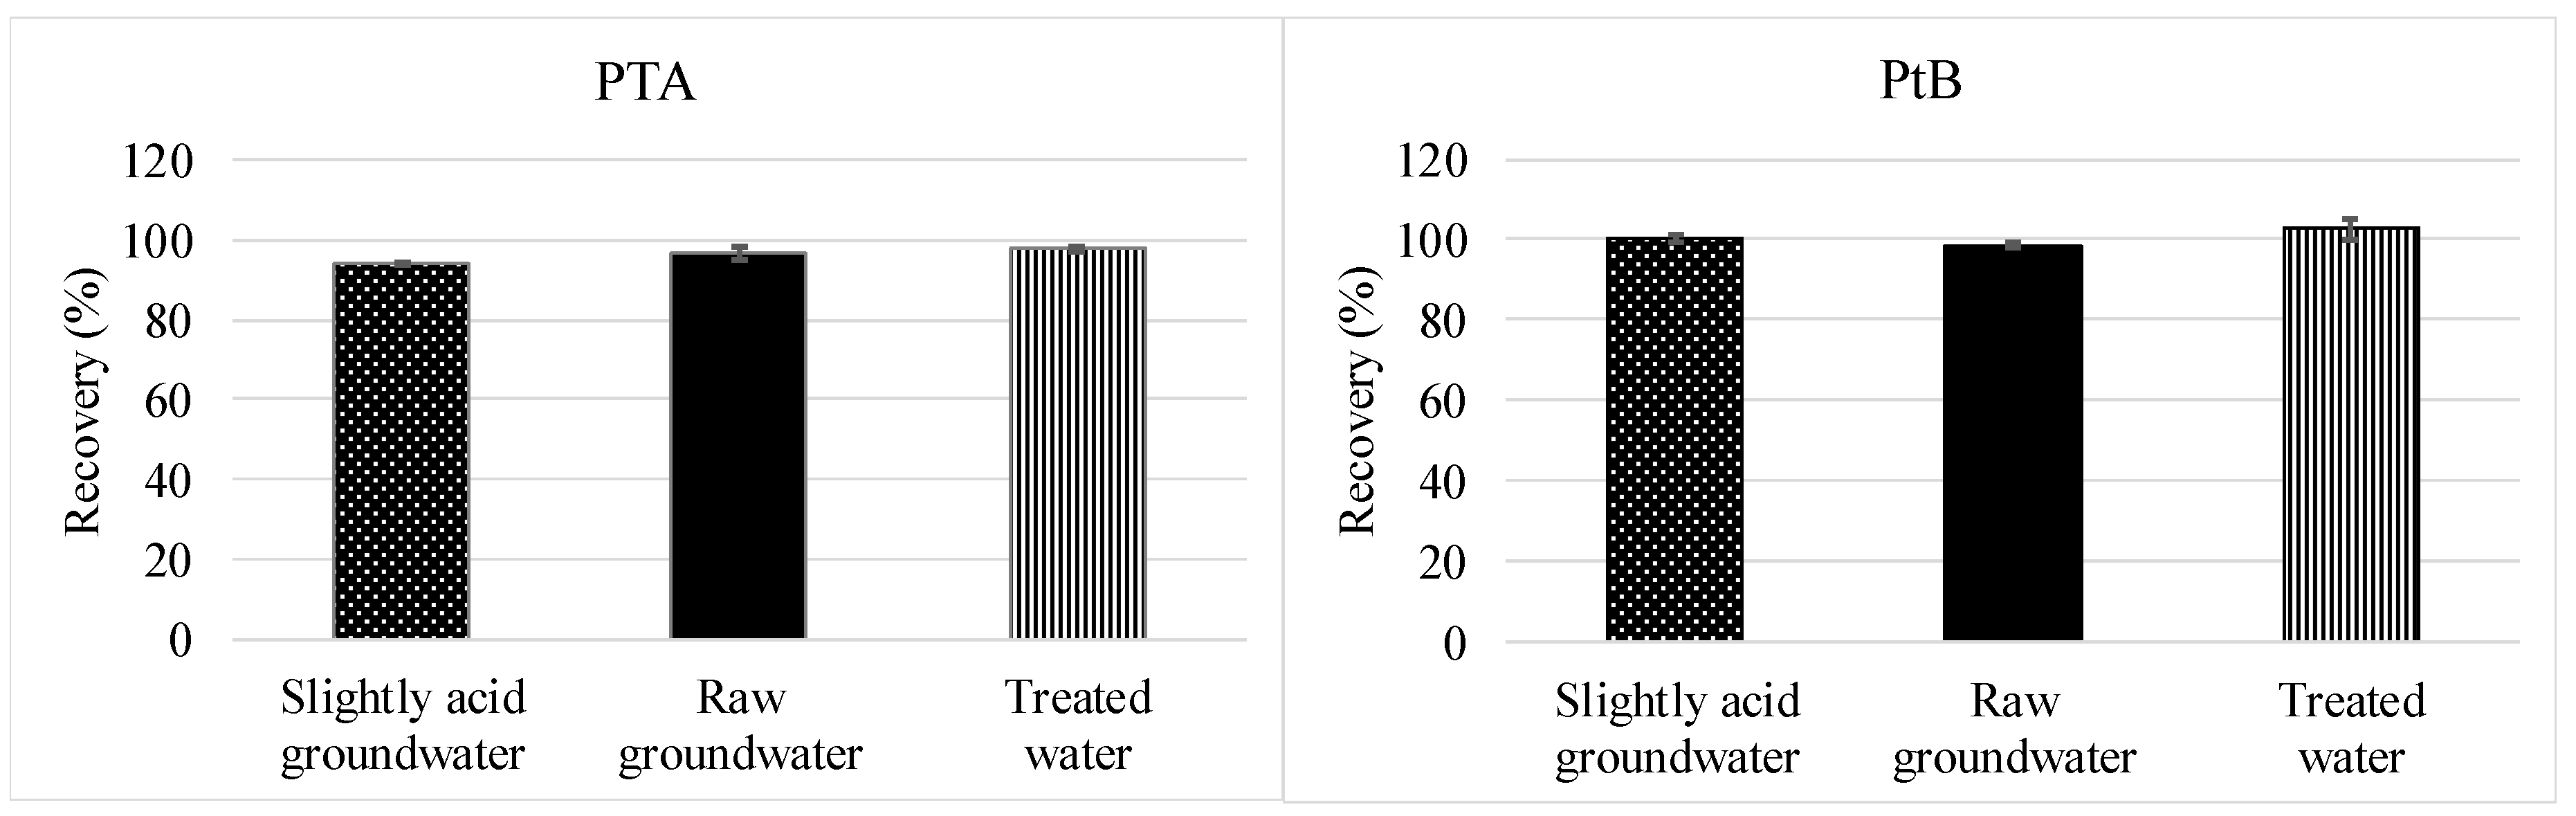
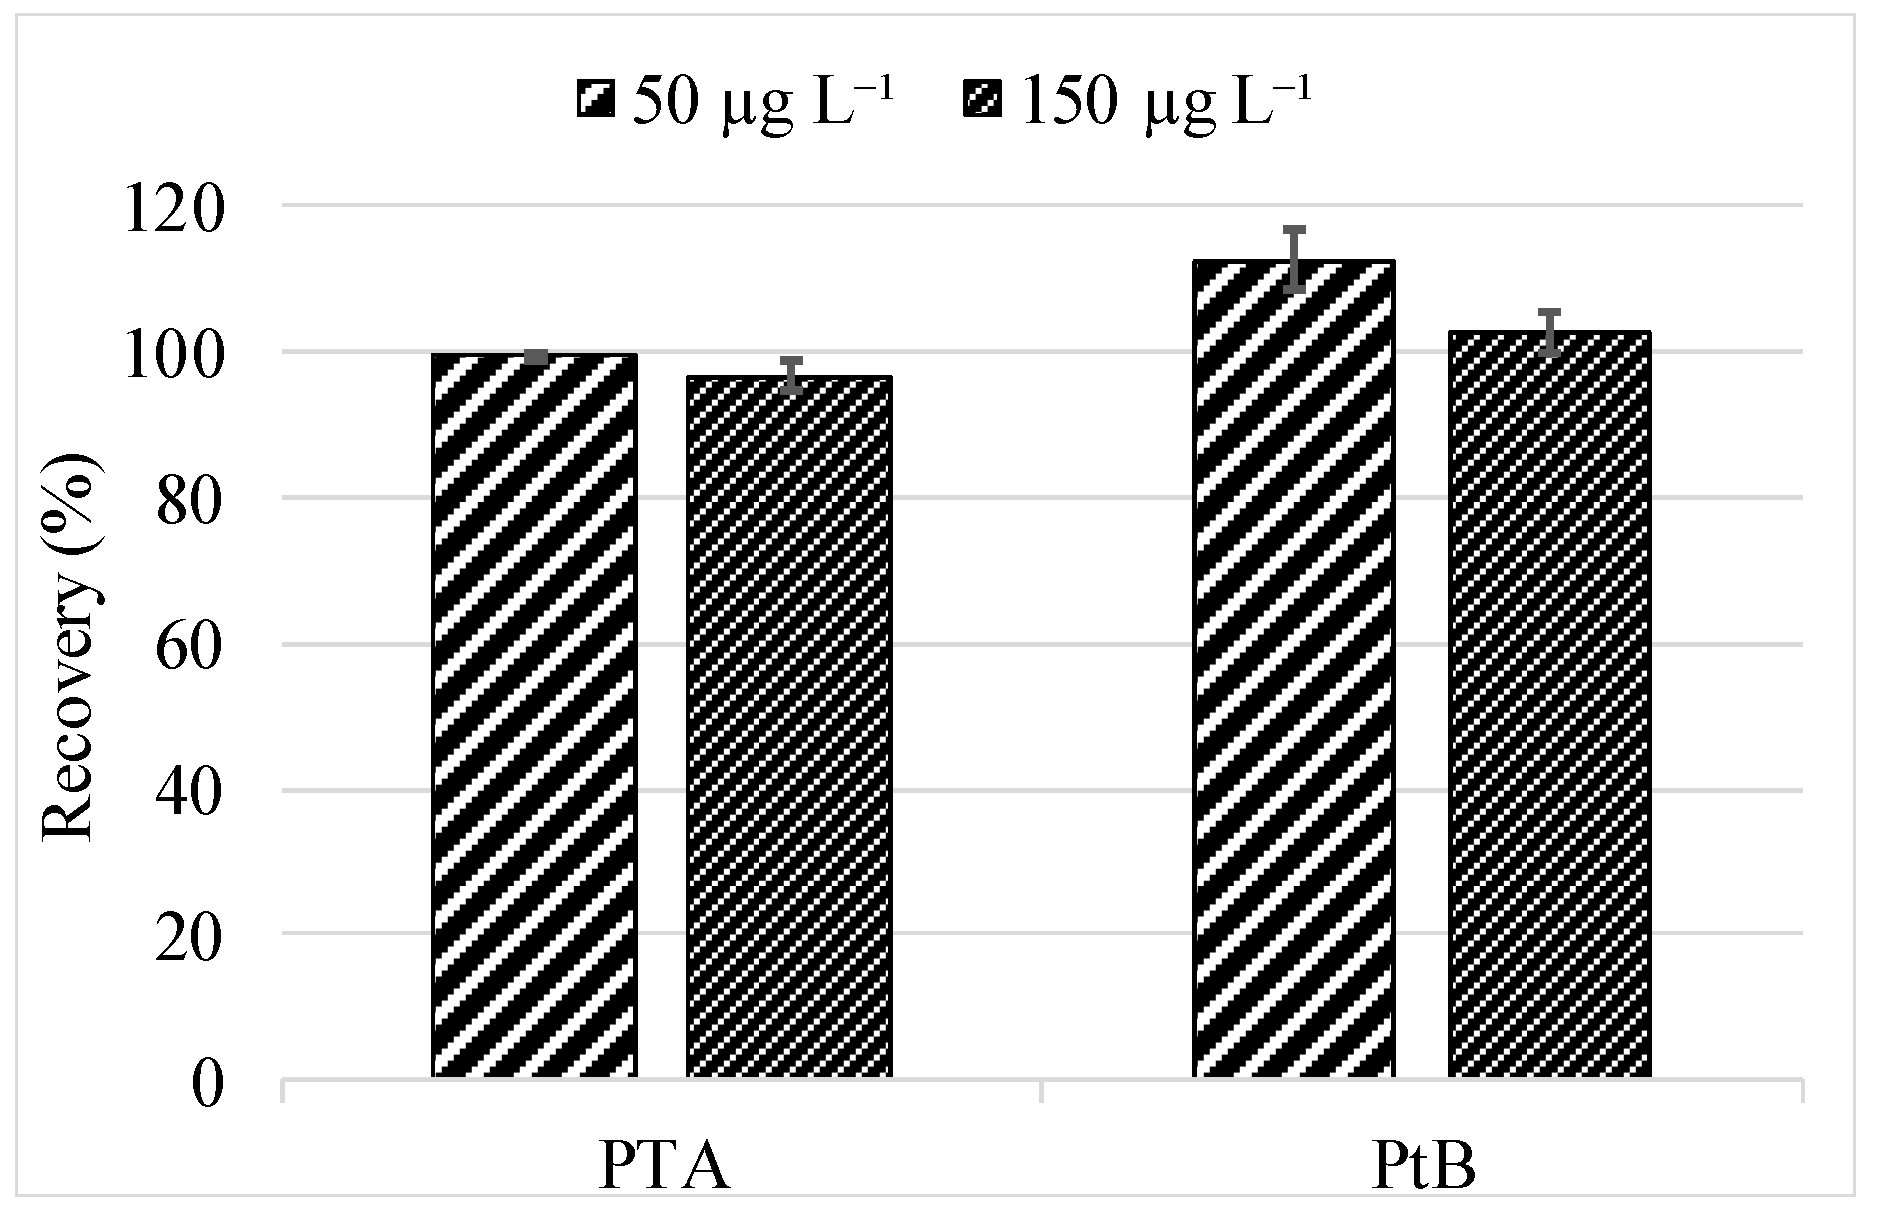
3.2.2. Full Method Validation Including Preservation and SPE

The entire method was validated by spiking and preserving raw groundwater samples at the field (drinking water well site Vigersted). Then, the samples were transported to the laboratory for analysis. Recoveries of 85% and 91% were measured for PTA and PtB, respectively (Figure 7). These results are in line with the results obtained in the laboratory (Figure 6), and hence confirming that the method is robust and reliable. Unspiked groundwater samples and field blanks included in the study did not show presence of PTA and PtB.

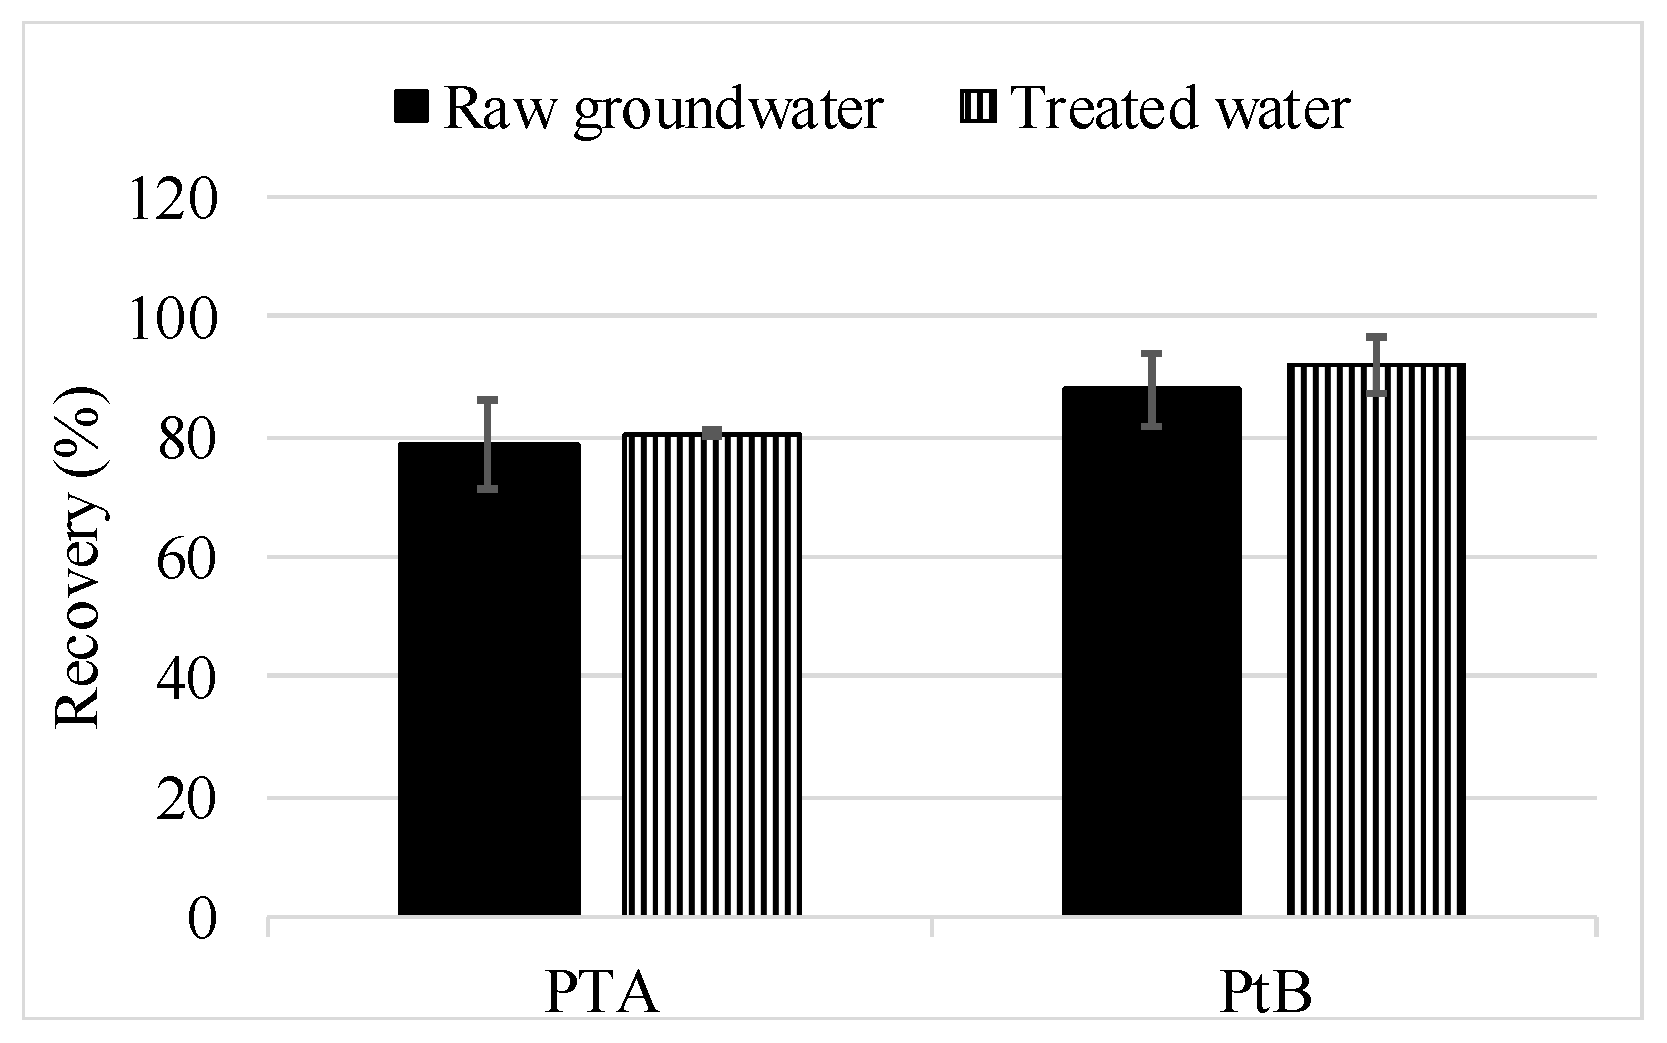
3.2.3. Application of the Method and PTA Findings in Groundwater

The new preservation and SPE method was applied for PTA and PtB monitoring in six water wells located in bracken-rich areas. PTA and PtB were not found in the deep groundwater wells (42 m depth), which are used by drinking water company (HOFOR). Ptaquiloside was detected only in one of the shallow wells (groundwater well 4, Table 5) at the concentration (µg L−1 ± sd) 0.35 ± 0.1 which is highly exceeding the estimated maximum tolerable concentration of PTA in drinking water (0.005 to 0.016 µg L−1) [17]. PtB was not found in any of investigated wells. The positive PTA sample was collected in the autumn 2019, while the groundwater sample from the same location was PTA negative in the summer 2019. A similar result was reported in Ireland when PTA was detected in private spring well in the fall (0.57 µg L−1), while no PTA was found in the summer at the same location. Higher PTA concentrations in runoff water is expected to occur in pulses related to rainfall, and hence, taking occasional grab samples does not ensure catching the precipitation-linked pulses of PTA [27]. Precipitation of 24 mm rain had been monitored at a nearby weather station located approximately 20 km away from the investigated well during the week prior to the autumn 2019 sampling. On the other hand, only 3 mm were measured in the week before the summer 2019 sampling when no PTA was found [51]. Thus, precipitation may be an important driver for PTA leaching to the deeper layers when timing of sampling become a critical factor for PTA detection in groundwater.
With this small-scale monitoring study, we confirm that leaching of PTA is possible to water wells in bracken-infested areas. In this case, the PTA positive well was not used as a drinking water source. However, there are 55,000 private single-abstraction drinking wells in Denmark of which many are close to the natural and bracken-rich landscapes [52]. They are typically shallow and lack any sort of water treatment, which makes them especially vulnerable to any pollution source. Households supplied from this type of water wells might be exposed to carcinogenic PTA above the estimated tolerable concentration. In addition, although PTA was not detected in the deeper groundwater wells, potential presence of cracks or macropores in soil could result in fast transport of PTA, as it is often the case with pesticides [53]. As such, PTA leaching to groundwater wells is rather site-specific, and a broader assessment is needed.

4. Conclusions

The presented method was successful in preservation and pre-concentration of the bracken toxin PTA and its degradation product PtB in various groundwater samples. The only critical factor for preservation of PTA in groundwater was pH. The method has the desired limit of detection of 0.001 µg L−1, which enables sensitive monitoring relevant for toxicity assessment. The method robustness was validated for various water types at different toxin concentration levels. Additionally, the developed preservation protocol has been designed to be relatively simple to use and, as such, represents a practical method for drinking water utilities that source water from groundwater in bracken-rich areas.
The small-scale monitoring that was a part of this study found no evidence of PTA presence in deep wells. However, PTA was detected in one of the shallow groundwater wells. This suggests that transport of carcinogenic PTA towards drinking water reservoirs is possible, yet that it is site specific and that it may be expected in relation to the rain events. These results call for broader monitoring of PTA and PtB in groundwater, and they are of great importance for drinking water companies, which are obliged to provide a good quality drinking water.

Supplementary Materials

The following are available online at https://www.mdpi.com/2073-4441/12/10/2852/s1, Table S1: Water chemistry data for raw groundwater and treated water (Vigersted) sampled in January 2019. Source: HOFOR (Denmark). Figure S1: Vigersted water wells field site, water wells included in the monitoring and bracken-rich area in Humleore forest. Source: GEUS database, Denmark [47]. Figure S2: Flow chart for developing the preservation method of PTA in groundwater samples. Figure S3: Calibration curves of the standard solutions of analytes.

Author Contributions

Conceptualization, N.S., A.-K.P., S.C.B.C., H.C.B.H. and L.H.R.; methodology, N.S. and L.H.R.; software, N.S.; investigation, N.S.; data curation, N.S. and L.H.R.; writing—original draft preparation, N.S.; writing—review and editing, A.-K.P., S.C.B.C., H.C.B.H. and L.H.R.; visualization; N.S.; supervision, A.-K.P., S.C.B.C., H.C.B.H. and L.H.R.; funding acquisition, A.-K.P., H.C.B.H. and L.H.R. All authors have read and agreed to the published version of the manuscript.

Funding

This project and the APC was funded by the European Union’s Horizon 2020 research and Innovation Programme under the Marie Sklodowska-Curie grant agreement No. 722493 (NaToxAq).

Acknowledgments

The authors would like to thank Ulrich Bruus Madsen from Humleore forest district for help in localizing private groundwater wells in Vigersted, Randi Nielsen (DIN Forsyning) for providing water samples, also laboratory technicians Jimena Bertorello Martinez (University College Copenhagen), Helle Sparwath and technicians Steen Dam Larsen, Dennis Oreskov (Greater Copenhagen Utility HOFOR) for their assistance with groundwater sampling.

Conflicts of Interest

The authors declare no conflict of interest.

References

  1. Taylor, J.A. The bracken problem: A global perspective. AIAS Occas. Publ. 1990, 40, 3–19. [Google Scholar]
  2. Smith, B.L. The toxicity of bracken fern (genus Pteridium) to animals and its relevance to man. Handb. Plant Fungal Toxic. 1997, 63–76. [Google Scholar] [CrossRef]
  3. Roos, K.; Rödel, H.G.; Beck, E. Short-and long-term effects of weed control on pastures infested with Pteridium arachnoideum and an attempt to regenerate abandoned pastures in South Ecuador. Weed Res. 2011, 51, 165–176. [Google Scholar] [CrossRef]
  4. Matongera, T.N.; Mutanga, O.; Dube, T.; Sibanda, M. Detection and mapping the spatial distribution of bracken fern weeds using the Landsat 8 OLI new generation sensor. Int. J. Appl. Earth Obs. Geoinf. 2017, 57, 93–103. [Google Scholar] [CrossRef]
  5. Pakeman, R.J.; Marrs, R.H.; Howard, D.C.; Barr, C.J.; Fuller, R.M. The bracken problem in Great Britain: Its present extent and future changes. Appl. Geogr. 1996, 16, 65–86. [Google Scholar] [CrossRef]
  6. Marrs, R.H.; Watt, A.S. Biological flora of the british isles: Pteridium aquilinum (L.) Kuhn. J. Ecol. 2006, 94, 1272–1321. [Google Scholar] [CrossRef]
  7. da Costa, R.M.G.; Bastos, M.; Oliveira, P.A.; Lopes, C. Bracken-associated human and animal health hazards: Chemical, biological and pathological evidence. J. Hazard. Mater. 2012, 203, 1–12. [Google Scholar] [CrossRef]
  8. International Agency for Research on Cancer (IARC)—Summaries & Evaluations, Bracken fern (Pteridium aquilinum) and Some of Its Constituents. 1998. Available online: http://www.inchem.org/documents/iarc/vol40/brackenfern.html (accessed on 10 March 2020).
  9. Agents Classified by the IARC Monographs. 2018. Available online: https://monographs.iarc.fr/list-of-classifications-volumes/ (accessed on 10 March 2020).
  10. Van der Hoeven, J.C.M.; Lagerweij, W.J.; Posthumus, M.A.; Van Veldhuizen, A.; Holterman, H.A.J. Aquilide A, a new mutagenic compound isolated from bracken fern (Pteridium aquilinum (L.) Kuhn). Carcinogenesis 1983, 4, 1587–1590. [Google Scholar] [CrossRef]
  11. Mori, H.; Sugie, S.; Hirono, I.; Yamada, K.; Niwa, H.; Ojika, M. Genotoxicity of ptaquiloside, a bracken carcinogen, in the hepatocyte primary culture/DNA-repair test. Mutat. Res. Lett. 1985, 143, 75–78. [Google Scholar] [CrossRef]
  12. Gomes, J.; Magalhães, A.; Michel, V.; Amado, I.F.; Aranha, P.; Ovesen, R.G.; Hansen, H.C.B.; Gärtner, F.; Reis, C.A.; Touati, E. Pteridium aquilinum and its ptaquiloside toxin induce DNA damage response in gastric epithelial cells, a link with gastric carcinogenesis. Toxicol. Sci. 2012, 126, 60–71. [Google Scholar] [CrossRef]
  13. Shahin, M.; Smith, B.L.; Worral, S.; Moore, M.R.; Seawright, A.A.; Prakash, A.S. Bracken Fern carcinogenesis: Multiple intravenous doses of activated Ptaquiloside induce DNA adducts, Monocytosis, increased TNFα levels, and mammary gland carcinoma in rats. Biochem. Biophys. Res. Commun. 1998, 244, 192–197. [Google Scholar] [CrossRef]
  14. Hirono, I.; Aiso, S.; Yamaji, T.; Mori, H.; Yamada, K.; Niwa, H.; Ojika, M.; Wakamatsu, K.; Kigoshi, H.; Niiyama, K. Carcinogenicity in rats of ptaquiloside isolated from bracken. GANN Jpn. J. Cancer Res. 1984, 75, 833–836. [Google Scholar]
  15. da Costa, R.M.G.; Neto, T.; Estêvão, D.; Moutinho, M.; Félix, A.; Medeiros, R.; Lopes, C.; Bastos, M.M.S.M.; Oliveira, P.A. Ptaquiloside from bracken (Pteridium spp.) promotes oral carcinogenesis initiated by HPV16 in transgenic mice. Food Funct. 2020, 11, 3298–3305. [Google Scholar] [CrossRef]
  16. Rasmussen, L.H.; Jensen, L.S.; Hansen, H.C.B. Distribution of the carcinogenic terpene ptaquiloside in bracken fronds, rhizomes (Pteridium aquilinum), and litter in Denmark. J. Chem. Ecol. 2003, 29, 771–778. [Google Scholar] [CrossRef]
  17. Rasmussen, L.H.; Hansen, H.C.B.; Lauren, D. Sorption, degradation and mobility of ptaquiloside, a carcinogenic Bracken (Pteridium sp.) constituent, in the soil environment. Chemosphere 2005, 58, 823–835. [Google Scholar] [CrossRef] [PubMed]
  18. Rasmussen, L.H.; Pedersen, H.Æ. Screening for ptaquiloside in ferns: Using herbarium specimens for qualitative mapping purposes. Phytochem. Anal. 2017, 28, 575–583. [Google Scholar] [CrossRef] [PubMed]
  19. Rasmussen, L.; Lauren, D.; Smith, B.; Hansen, H. Variation in ptaquiloside content in bracken (Pteridium esculentum (Forst. f) Cockayne) in New Zealand. N. Z. Vet. J. 2008, 56, 304–309. [Google Scholar] [CrossRef] [PubMed]
  20. Ribeiro, D.d.S.F.; Keller, K.M.; Soto-Blanco, B. Ptaquiloside and Pterosin B Levels in Mature Green Fronds and Sprouts of Pteridium arachnoideum. Toxins 2020, 12, 288. [Google Scholar] [CrossRef] [PubMed]
  21. Nagao, T.; Saito, K.; Hirayama, E.; Uchikoshi, K.; Koyama, K.; Natori, S.; Morisaki, N.; Iwasaki, S.; Matsushima, T. Mutagenicity of ptaquiloside, the carcinogen in bracken, and its related illudane-type sesquiterpenes I. Mutagenicity in Salmonella typhimurium. Mutat. Res. Mol. Mech. Mutagen. 1989, 215, 173–178. [Google Scholar] [CrossRef]
  22. Rasmussen, L.H.; Hansen, H.C.B. Growth of Bracken in Denmark and the Content of Ptaquiloside in Fronds. In Poisonous Plants and Related Toxins; Acamovic, T., Stewart, C.S., Pennycott, T., Eds.; CABI: Wallingford, UK, 2004; pp. 354–360. [Google Scholar]
  23. Rasmussen, L.H.; Donnelly, E.; Strobel, B.W.; Holm, P.E.; Hansen, H.C.B. Land management of bracken needs to account for bracken carcinogens–a case study from Britain. J. Environ. Manag. 2015, 151, 258–266. [Google Scholar] [CrossRef]
  24. Rasmussen, L.H.; Kroghsbo, S.; Frisvad, J.C.; Hansen, H.C.B. Occurrence of the carcinogenic Bracken constituent ptaquiloside in fronds, topsoils and organic soil layers in Denmark. Chemosphere 2003, 51, 117–127. [Google Scholar] [CrossRef]
  25. Ayala-Luis, K.B.; Hansen, P.B.; Rasmussen, L.H.; Hansen, H.C.B. Kinetics of ptaquiloside hydrolysis in aqueous solution. Environ. Toxicol. Chem. Int. J. 2006, 25, 2623–2629. [Google Scholar] [CrossRef]
  26. Clauson-Kaas, F.; Jensen, P.H.; Jacobsen, O.S.; Juhler, R.K.; Hansen, H.C.B. The naturally occurring carcinogen ptaquiloside is present in groundwater below bracken vegetation. Environ. Toxicol. Chem. 2014, 33, 1030–1034. [Google Scholar] [CrossRef]
  27. Clauson-Kaas, F.; Ramwell, C.; Hansen, H.C.B.; Strobel, B.W. Ptaquiloside from bracken in stream water at base flow and during storm events. Water Res. 2016, 106, 155–162. [Google Scholar] [CrossRef]
  28. O’Driscoll, C.; Ramwell, C.; Harhen, B.; Morrison, L.; Clauson-Kaas, F.; Hansen, H.C.B.; Campbell, G.; Sheahan, J.; Misstear, B.; Xiao, L. Ptaquiloside in Irish bracken ferns and receiving waters, with implications for land managers. Molecules 2016, 21, 543. [Google Scholar] [CrossRef] [PubMed]
  29. Matsuoka, A.; Hirosawa, A.; Natori, S.; Iwasaki, S.; Toshio, S.; Ishidate, M., Jr. Mutagenicity of ptaquiloside, the carcinogen in bracken, and its related illudane-type sesquiterpenes: II. Chromosomal aberration tests with cultured mammalian cells. Mutat. Res. Mol. Mech. Mutagen. 1989, 215, 179–185. [Google Scholar] [CrossRef]
  30. Ojika, M.; Wakamatsu, K.; Niwa, H.; Yamada, K. Ptaquiloside, a potent carcinogen isolated from bracken fern pteridiumaquilinum var. latiusculum: Structure elucidation based on chemical and spectral evidence, and reactions with amino acids, nucleosides, and nucleotides. Tetrahedron 1987, 43, 5261–5274. [Google Scholar] [CrossRef]
  31. Yamada, K.; Ojika, M.; Kigoshi, H. Ptaquiloside, the major toxin of bracken, and related terpene glycosides: Chemistry, biology and ecology. Nat. Prod. Rep. 2007, 24, 798–813. [Google Scholar] [CrossRef] [PubMed]
  32. Yoshihira, K.; Fukuoka, M.; Kuroyanagi, M.; Natori, S. Further Characterization of 1-Indanone Derivatives from Bracken, Pteridium aquilinum var. latiu8culum. Chem. Pharm. Bull. 1972, 20, 426–428. [Google Scholar] [CrossRef] [Green Version]
  33. Ovesen, R.G.; Rasmussen, L.H.; Hansen, H.C.B. Degradation kinetics of ptaquiloside in soil and soil solution. Environ. Toxicol. Chem. Int. J. 2008, 27, 252–259. [Google Scholar] [CrossRef]
  34. Engel, P.; Brandt, K.K.; Rasmussen, L.H.; Ovesen, R.G.; Sørensen, J. Microbial degradation and impact of Bracken toxin ptaquiloside on microbial communities in soil. Chemosphere 2007, 67, 202–209. [Google Scholar] [CrossRef] [PubMed]
  35. Clauson-Kaas, F.; Hansen, H.C.B.; Strobel, B.W. UPLC-MS/MS determination of ptaquiloside and pterosin B in preserved natural water. Anal. Bioanal. Chem. 2016, 408, 7981–7990. [Google Scholar] [CrossRef] [PubMed]
  36. Alonso-Amelot, M.E.; Castillo, U.; De Jongh, F. Passage of the bracken fern carcinogen ptaquiloside into bovine milk. Lait 1993, 73, 323–332. [Google Scholar] [CrossRef] [Green Version]
  37. Alonso-Amelot, M.E.; Castillo, U.; Smith, B.L.; Lauren, D.R. Excretion, through milk, of ptaquiloside in bracken-fed cows. A quantitative assessment. Lait 1998, 78, 413–423. [Google Scholar] [CrossRef] [Green Version]
  38. Fletcher, M.T.; Reichmann, K.G.; Brock, I.J.; McKenzie, R.A.; Blaney, B.J. Residue potential of norsesquiterpene glycosides in tissues of cattle fed Austral bracken (Pteridium esculentum). J. Agric. Food Chem. 2011, 59, 8518–8523. [Google Scholar] [CrossRef]
  39. Aranha, P.C.R.; Hansen, H.C.B.; Rasmussen, L.H.; Strobel, B.W.; Friis, C. Determination of ptaquiloside and pterosin B derived from bracken (Pteridium aquilinum) in cattle plasma, urine and milk. J. Chromatogr. B 2014, 951, 44–51. [Google Scholar] [CrossRef] [PubMed]
  40. García-Jorgensen, D.B.; Hansen, H.C.B.; Abrahamsen, P.; Diamantopoulos, E.; Garc, D.B. A novel model concept for modelling the leaching of natural toxins: Results for the case of ptaquiloside. Environ. Sci. Process. Impacts 2020, 22, 1768–1779. [Google Scholar] [CrossRef]
  41. Jensen, P.H.; Jacobsen, O.S.; Hansen, H.C.B.; Juhler, R.K. Quantification of ptaquiloside and pterosin B in soil and groundwater using liquid chromatography-tandem mass spectrometry (LC-MS/MS). J. Agric. Food Chem. 2008, 56, 9848–9854. [Google Scholar] [CrossRef]
  42. Ribeiro, D.d.S.F.; Keller, K.M.; Melo, M.M.; Soto-Blanco, B. Determination of ptaquiloside in cow’s milk by HPLC-UV. Semin. Ciências Agrárias 2019, 40, 1715–1722. [Google Scholar] [CrossRef]
  43. Rai, S.K.; Sharma, R.; Kumari, A.; Rasmussen, L.H.; Patil, R.D.; Bhar, R. Survey of ferns and clinico-pathological studies on the field cases of enzootic bovine haematuria in Himachal Pradesh, a north-western Himalayan state of India. Toxicon 2017, 138, 31–36. [Google Scholar] [CrossRef]
  44. Kisielius, V.; Lindqvist, D.N.; Thygesen, M.B.; Rodamer, M.; Hansen, H.C.B.; Rasmussen, L.H. Fast LC-MS quantification of ptesculentoside, caudatoside, ptaquiloside and corresponding pterosins in bracken ferns. J. Chromatogr. B 2020, 1138, 121966. [Google Scholar] [CrossRef] [PubMed]
  45. Xu, J.; Fei, W.; Zhu, C.; Qian, Y.; Xie, T.; Liu, Q. Determination of ptaquiloside in Pteridium aquilinum by ultra performance liquid chromatography-tandem mass spectrometry. J. Food Saf. Qual. 2018, 9, 4601–4606. [Google Scholar]
  46. Fletcher, M.T.; Brock, I.J.; Reichmann, K.G.; McKenzie, R.A.; Blaney, B.J. Norsesquiterpene Glycosides in Bracken Ferns (Pteridium esculentum and Pteridium aquilinum subsp. wightianum) from Eastern Australia: Reassessed Poisoning Risk to Animals. J. Agric. Food Chem. 2011, 59, 5133–5138. [Google Scholar] [CrossRef] [PubMed]
  47. National Groundwater Database JUPITER, GEUS Database (Denmark). Available online: https://www.geus.dk/produkter-ydelser-og-faciliteter/data-og-kort/national-boringsdatabase-jupiter/ (accessed on 20 March 2020).
  48. Plackett, R.L.; Burman, J.P. The design of optimum multifactorial experiments. Biometrika 1946, 33, 305–325. [Google Scholar] [CrossRef]
  49. Vanaja, K.; Shobha Rani, R.H. Design of experiments: Concept and applications of Plackett Burman design. Clin. Res. Regul. Aff. 2007, 24, 1–23. [Google Scholar] [CrossRef]
  50. Prichard, E.; Barwick, V. Quality Assurance in Analytical Chemistry; John Wiley & Sons: Hoboken, NJ, USA, 2007; Volume 25. [Google Scholar]
  51. National Centers for Environmental Information, NOAA. Available online: https://www.ncdc.noaa.gov/cdo-web/ (accessed on 19 March 2020).
  52. Danish Environmental Protection Agency. Available online: https://mst.dk/natur-vand/vand-i-hverdagen/drikkevand/hvem-leverer-drikkevandet/ (accessed on 14 May 2020).
  53. Kördel, W.; Egli, H.; Klein, M. Transport of pesticides via macropores (IUPAC technical report). Pure Appl. Chem. 2008, 80, 105–160. [Google Scholar] [CrossRef]
Figure 1. Experimental flow chart.
Water 12 02852 g001
Figure 2. Solid-phase extraction (SPE) flow chart.
Water 12 02852 g002
Figure 3. Recovery of PTA and PtB in different spiked groundwater samples handled according to the preservation protocol (48 h between spiking and analysis; 95% confidence limit; n = 6). The error bars represent relative standard deviation (RSD).
Water 12 02852 g003
Figure 4. Recovery of PTA and PtB at 50 µg L−1 and 150 µg L−1 in spiked raw groundwater (Vigersted) handled according to the preservation protocol (48 h between spiking and analysis; 95% confidence limit; n = 6). The error bars represent relative standard deviation (RSD).
Water 12 02852 g004
Figure 5. Stability of PTA (n = 2) and PtB (n = 6) in raw groundwater samples (Vigersted) at 4 °C handled according to the preservation protocol (95% confidence limit). The error bars represent relative standard deviation (RSD). The dots represent the measured data points, while the lines are linear interpolation between them.
Water 12 02852 g005
Figure 6. Validation of the SPE method for two water types in the lab (95% confidence limit; n = 6). The error bars represent relative standard deviation (RSD).
Water 12 02852 g006
Figure 7. Recovery of PTA and PtB of the entire method (preservation and SPE) at the field (95% confidence limit; n = 6). Relative standard deviation (3–4%) is represent by the error bars.
Water 12 02852 g007
Table 1. Physicochemical properties of ptaquiloside and pterosin B.
PtaquilosidePterosin B
CAS number87625-62-534175-96-7
Molecular FormulaC20H30O9C14H18O2
Molecular Weight398.45 g mol−1218.29 g mol−1
Log Kow a−0.63 [35] 3.33 [25]
Rate constant for hydrolysis at neutral conditions (4.4 < pH < 6.4) (22 °C)9.49 ± (6.02) × 10−4 h−1 [35]-
Hydrolysis of PTA
Water 12 02852 i001
a Kow = octanol/water partition coefficient.
Table 2. Three groundwater types used in the method development and validation (preservation and SPE). Water parameters presented are measured in the field.
Water TypeLocation (Denmark)pHT (°C)EC (mS/m)
Raw groundwater aVigersted7.367.372
Raw groundwaterEsbjerg6.438.5 c29 c
Treated water bVigersted7.847.8100
a Raw groundwater is untreated groundwater from the water wells. b Treated water is raw groundwater treated with aeration and biological sand filtration. c National groundwater database Jupiter, GEUS (Denmark) [47].
Table 3. Tested factors at two levels used in Plackett–Burman design.
VariableFirst Level (+)Second Level (−)
A: Water typeRaw groundwaterTreated water
B: Bottle typePlasticGlass
C: Filtering (0.2 μm)YesNo
D: pH5.56
E: Transportation time2 h6 h
F: Transportation conditionsNo iceWith ice
G: Sample storage conditions4 °C−18 °C
Experiment no.ABCDEFGResults
1+++++++l
2+++m
3+++p
4+++w
5+++v
6+++x
7+++y
8+++z
Table 4. Validation of the LC-MS method for PTA and PtB determination (preservation and SPE method development) [43].
CompoundObserved Linearity Range (µg L−1)R2LOD (µg L−1)LOQ (µg L−1)Precision of the Instrument CV% (n = 10)
PTA1–1000.9991.54.61.0
PtB2–1000.9982.78.13.0
PTA intraday1–1000.9991.75.11.1
PtB intraday2–1001.0001.44.13.2
Table 5. Description of the groundwater wells included in monitoring.
Groundwater WellWell TypeSampling DateLocationpHEC (mS/m)OwnerDepth (m)Purpose
1.Deep03.07.201955.47599, 11.907157.3692HOFOR42Drinking water
2.Deep03.07.201955.47479,
11.90556
7.1782HOFOR42Drinking water
3.Deep03.07.201955.47407,
11.90258
7.8741HOFOR42Drinking water
4.Shallow03.07.2019;
08.09.2019
55.475063,
11.907543
7.0
6.9
320
340
Private8Technical water a
5.Shallow03.07.201955.47616,
11.90973
6.9 592Private-Technical water a
6.Shallow03.07.201955.47134,
11.91239
7.2476Private10Drinking water
a Technical water is groundwater not used for drinking.
Table 6. Recovery percentage of PTA with different loading volumes (n = 2) of MilliQ spiked water samples OASIS MAX column (60 mg).
Tested Loading VolumesRecovery (%)
10 mL99 ± 1
25 mL99 ± 3
50 mL85 ± 2
100 mL79 ± 1

