Article

Benthic Diatom Communities in Urban Streams and the Role of Riparian Buffers

by
Petra Thea Mutinova
1,2,
Maria Kahlert
3,*,
Benjamin Kupilas
1,4,
Brendan G. McKie
3,
Nikolai Friberg
1,5,6 and
Francis J. Burdon
3
1
Norwegian Institute for Water Research (NIVA), 0349 Oslo, Norway
2
Applied Ecology and Phycology, Institute for Biological Sciences, University of Rostock, 18059 Rostock, Germany
3
Department of Aquatic Sciences and Assessment, Swedish University of Agricultural Sciences, 75007 Uppsala, Sweden
4
Institute of Landscape Ecology, University of Münster, 48149 Münster, Germany
5
Freshwater Biological Section, Department of Biology, University of Copenhagen, 2100 Copenhagen, Denmark
6
Water@leeds and School of Geography, University of Leeds, Leeds LS2 9JT, UK
*
Author to whom correspondence should be addressed.
Water 2020, 12(10), 2799; https://doi.org/10.3390/w12102799
Submission received: 11 September 2020 / Revised: 30 September 2020 / Accepted: 2 October 2020 / Published: 9 October 2020
(This article belongs to the Special Issue Ecosystem Functioning in Rivers and Riparian Zones)

Abstract

:
Urbanization impacts stream ecosystems globally through degraded water quality, altered hydrology, and landscape disturbances at the catchment and riparian scales, causing biodiversity losses and altered system functioning. Addressing the “urban stream syndrome” requires multiple mitigation tools, and rehabilitation of riparian vegetation may help improve stream ecological status and provide key ecosystem services. However, the extent to which forested riparian buffers can help support stream biodiversity in the face of numerous environmental contingencies remains uncertain. We assessed how a key indicator of stream ecological status, benthic diatoms, respond to riparian habitat conditions using 10 urban site pairs (each comprising of one unbuffered and one buffered reach), and additional urban downstream and forest reference upstream sites in the Oslo Fjord basin. Diatom communities were structured by multiple drivers including spatial location, land use, water quality, and instream habitat. Among these, riparian habitat condition independently explained 16% of variation in community composition among site pairs. Changes in community structure and indicator taxa, along with a reduction in pollution-tolerant diatoms, suggested tangible benefits of forested riparian buffers for stream biodiversity in urban environments. Managing urban impacts requires multiple solutions, with forested riparian zones providing a potential tool to help improve biodiversity and ecosystem services.

1. Introduction

Urbanization is a driver of global environmental change with a disproportionate impact on freshwater ecosystems [1,2]. The term ‘‘urban stream syndrome’’ describes the consistently observed ecological degradation of streams draining urban land [3]. Urbanization causes complex changes in stream hydrology, geomorphology and biogeochemical cycles, contributing to declines in biodiversity and altered system functioning [4,5,6]. Adjacent riparian zones in urban stream networks are often profoundly transformed through vegetation removal, bank reinforcement, imperviousness, and soil degradation leading to further impacts on stream ecosystems [7]. Reduced shading causes higher instream temperatures, increased surface runoff and inputs of wastewater decrease water quality, and terrestrial biodiversity losses disrupt aquatic-terrestrial food webs [8,9,10]. Thus, changes due to urbanization often lead to catchment-wide impacts reaching far beyond the urban area [2], with cumulative effects driving changes in communities downstream [11]. As a consequence, there is great interest in developing effective management strategies to help reverse impacts of urbanization and improve biodiversity and ecosystem services in urban landscapes [12].
One management tool to address the effects of urbanization on stream ecosystems are forested riparian buffers [13]. Forested riparian buffers, comprising strips of continuous woody vegetation, create “green corridors” that improve ecological connectivity by linking aquatic and adjacent terrestrial ecosystems in stream–riparian networks [14]. Functioning riparian buffers help regulate stream temperature and light regimes, stabilize banks, reduce sediment, nutrient and contaminant inputs from surface runoff, and provide key food resources for aquatic food webs [14,15,16,17,18]. The presence of forest in cityscapes provides much-needed habitat for a wide range of terrestrial organisms [19,20]. Forested vegetation helps to counteract the ‘urban heat island’ effect by moderating air temperatures and the impacts of heat waves [21,22]. Vegetated riparian zones also have high amenity values by providing space for recreation and improving the aesthetic appeal of urban environments [23]. Thus, forested riparian zones deliver a broad portfolio of benefits that complement other management strategies, like pollution source control, stormwater management, re-configuration of channel morphology, and bank stabilization [24].
However, the optimal characteristics of riparian buffers and the extent to which they can help improve stream ecological quality remain uncertain [14]. Urban land use and riparian degradation frequently covary, and studies disentangling the relative importance of catchment urbanization compared with riparian land use are limited [3,25]. Establishing guidelines for buffer attributes (e.g., widths) are hindered by several challenges [15], including the uncertainties that derive from these upstream contingencies [26]. Opposition to the establishment of woody riparian vegetation buffers may also reflect conflicts with other management priorities, such as maintaining hydraulic efficiencies for surface runoff [27]. These challenges require targeted case studies that focus on key food-web compartments within stream–riparian networks to develop a general framework for implementing forested buffers in human-impacted landscapes [14]. We aimed to assess how an important indicator of stream ecological status, benthic diatoms, respond to forested riparian buffers in an urban context.
Diatoms (Bacillariophyceae) are a group of microalgae that occur in virtually all aquatic habitats, often dominate freshwater primary production, and encompass a diverse flora occupying a range of ecological niches [28]. As a consequence, freshwater diatoms are widely used as indicators of environmental change [29], and are an important standard and harmonized bioindicator for the European Water Framework Directive (WFD) [30]. Diatom communities respond to water quality, including acidification, nutrient enrichment, and organic pollution [31,32,33], and a variety of diatom indices have been developed for detecting and quantifying anthropogenic impacts [31,34,35]. Increased stream temperatures, light availability, hydrogeomorphic disturbance, and land surface imperviousness can also have measurable influences on stream diatoms [33,36,37,38,39,40], making freshwater diatoms particularly useful bioindicators in urban streams [11,41]. Thus, we expected that in urban catchments, downstream sites experience cumulative impacts from upstream pressures, meaning diatom communities are characterized by lower species richness and increased abundances of stress tolerant species as compared with upstream reference sites [11,33,36,37]. However, few studies have explicitly considered the role of riparian vegetation on urban stream diatom communities [42].
Here, we present a case study disentangling the role of forested riparian buffers relative to other key environmental factors shaping benthic diatom community structure in urban streams. Establishing this information would contribute to effective strategies for managing biodiversity and ecosystem services in urban stream–riparian networks. We sampled 10 site pairs comparing a downstream buffered site (i.e., forested riparian buffer) with an upstream unbuffered site [14] within the Oslo urban area. We also sampled forested reference sites and more impacted urban downstream sites to fully explore the pressure gradient in our urban stream–riparian networks. We focused on the following research questions and hypotheses:
  • Can the influence of forested riparian buffers on benthic diatom communities be disentangled from other key drivers in urban streams? We hypothesized that the effect of riparian buffers would be weak due to overwhelming influences of catchment-wide urbanization causing degraded water quality and altered hydrogeomorphology.
  • Can forested riparian buffers mitigate impacts of urbanization on diatom communities? We hypothesized that the provision of shading might have positive influences on biodiversity by reducing abundances of dominant, stress-tolerant diatoms and increasing the presence of rare species with ecological preferences for shaded conditions.
  • When do forested riparian buffers contribute the most to improved stream ecological status? Here, we hypothesized that any change in diatom communities conferred by improved riparian conditions (i.e., forested buffers) would be contingent on the level of upstream impacts. Specifically, we predicted that positive effects would weaken with increasing catchment degradation, reflecting limits induced by poor water quality and hydrogeomorphological changes.

2. Materials and Methods

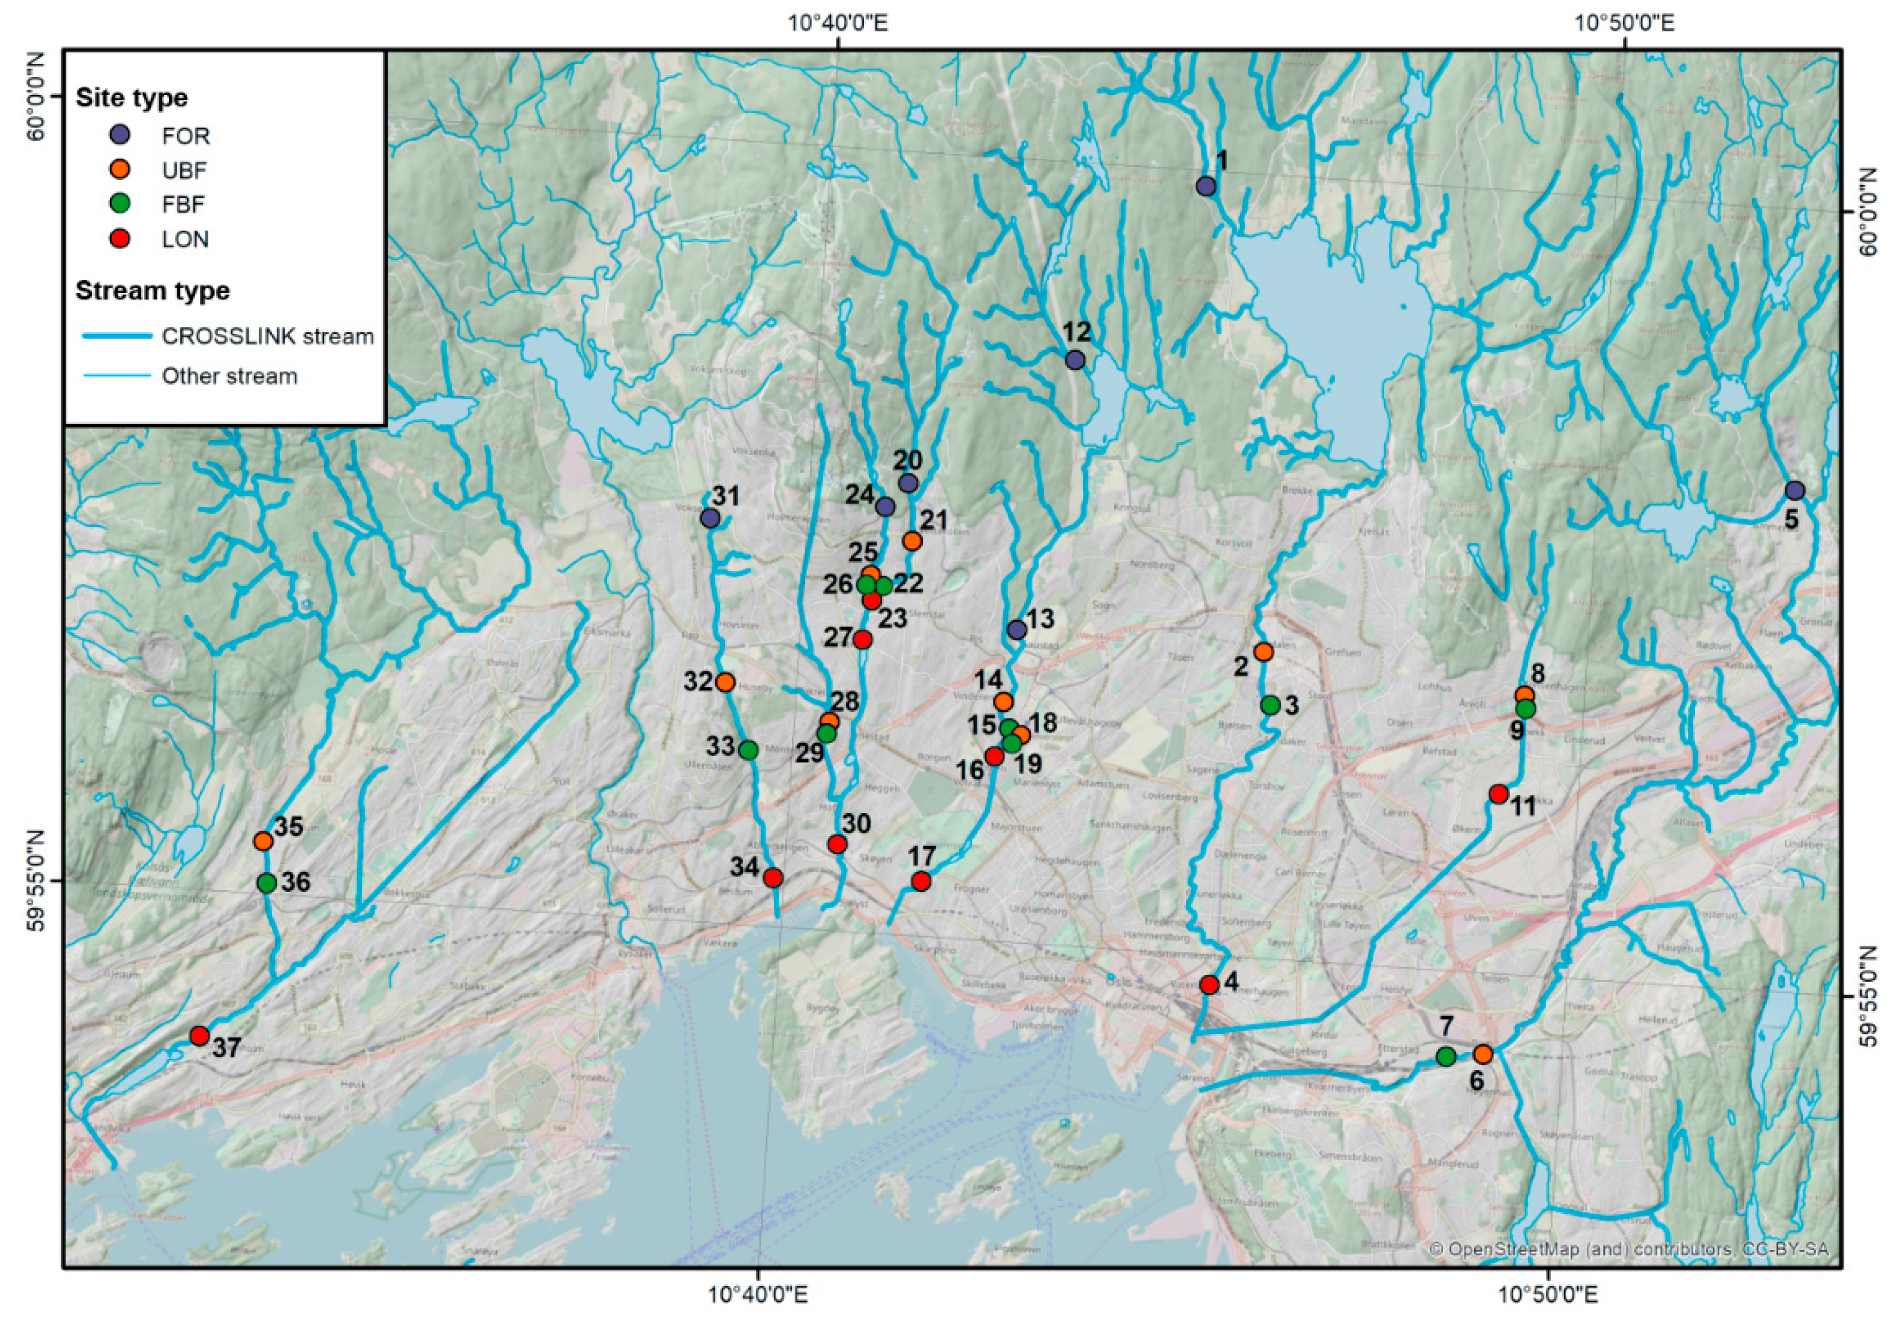
2.1. Study Design and Sites

We investigated 36 sites within the Oslo stream network, belonging to eight urban/peri-urban streams discharging into the Oslo Fjord basin (Figure 1; Table S1, Supplementary Materials). Oslo is one of the fastest growing capitals in Europe with an extensive history of catchment modification [43,44], and thus is a suitable urban environment to test our hypotheses.
Our research was conducted as part of the European BiodivERsA project CROSSLINK using the tiered study design described in Burdon et al. [14]. The CROSSLINK paired approach explores aspects of lateral and longitudinal connectivity. In our study, we investigated 10 pairs of unbuffered and buffered sites (20 in total) in the Oslo urban area. Within each pair, an upstream unbuffered site (further abbreviated as UBF) was selected with no woody riparian buffer or only a few shrubs and small trees (e.g., Alnus incana, Fraxinus excelsior, and Acer platanoides; Diameter at Breast Height, DBH < 5 cm). A downstream forested buffered site (FBF) was selected with a woody riparian buffer consisting of large trees (DBH > 5 cm) on both banks. The minimal buffer length was 50 m moving upstream from the downstream end of the sampling reach, and the buffer width was 2–3× wetted stream width.
The CROSSLINK network approach focuses on aspects of longitudinal connectivity [14]. This involved additional sites located upstream or downstream of the site pairs. We selected seven upstream forested reference sites (FOR) as a pristine, least impacted sites with woody riparian vegetation on both banks as described above. In addition, we selected nine longitudinal ‘matrix’ sites (LON) that had the most downstream locations in our stream networks, within the Oslo urban area, and typically without an extensive forested riparian buffer as described above. These longitudinal sites captured the cumulative effect of urban disturbances from the upstream catchment.
All streams were wadeable, 1st–3rd order, mostly 2–5 m wide, with a stable streambed dominated by gravels and cobbles. At each site, diatoms were sampled within a shorter effective sampling reach that was 20–30 m long. This sampling reach was nested within a longer habitat assessment reach of 50 m. Both reaches started at the same point at the downstream end of each site. Further information on study sites and water sampling is detailed in Table S1 (Supplementary Materials).

2.2. Water Quality

We collected water samples in the middle of a stream channel, by filling a 1-L plastic container just below the water surface at the downstream end of each site. The first round of sampling was in September 2017 during high water flow phase, and the second round July−August 2018 during a low water flow phase. Samples from paired sites were collected on the same day at a similar time of day. We stored samples on ice and refrigerated them immediately upon return to the laboratory. Samples were processed within 24 h following standard methods at the Norwegian Institute for Water Research (NIVA) laboratory. We measured total nitrogen (NS 4743:1993), ammonium (NH4N; [45]), nitrite- and nitrate-nitrogen (NO2N + NO3N; NS 4745:1991), total phosphorus (NS 4725:1984), and dissolved reactive phosphorus (PO4P; NS 4724). Nitrite- and nitrate-nitrogen (i.e., oxidized nitrogen, NO2N + NO3) is henceforth described as nitrate. We further summed values for nitrate and ammonium to estimate total inorganic nitrogen (TIN) [14]. Finally, we took spot measurements of pH and specific conductivity at field sites during sampling using a handheld probe (WTW pH/Cond 340i). See Table S1 (Supplementary Materials) for water chemistry data.

2.3. Instream Habitat

We conducted a standardized instream habitat assessment [14] in September–October 2018. Stream depths, flow velocities, and widths (wetted channel and bank-full widths) were measured at sites on 5–6 transects randomly spread throughout the study reach. Substrate composition (e.g., fine sediment, gravels/cobbles, boulders, bedrock) was visually assessed. We used the Wentworth grain scale classification for substrate size categorizations [46]. We included concrete as a habitat category due to its prevalence in the urban environment. We also visually assessed % cover of bryophytes and filamentous algae separately from inorganic substrate. We recorded the length (b-axis) of 100 random particles following the Wolman method [47].

2.4. Riparian Habitat and Catchment Land Uses

We conducted a standardized riparian habitat assessment [14] in August-September 2018 to describe riparian habitat on both banks at each sampling site. Canopy cover was measured via the smartphone app “CanopyApp” (University of Hampshire, Durham, NH, USA). Large trees with DBH > 5 cm were identified to the lowest taxonomical level possible, and we measured their circumference for DBH estimates. The number of fallen logs with a diameter > 10 cm, at least partly located inside the investigated area were recorded and measured (length, circumference). We visually assessed vegetation/habitat categories (e.g., % unmanaged long grasses, managed short grasses, ground mosses and lichens, plant litter, bare ground, small trees and shrubs with DBH < 5 cm). We added some urban elements (e.g., roads, walls, fences) as habitat categories. The % cover of these vegetation/habitat categories were recorded as a vertical projection on to the ground.
We also evaluated 13 attributes on each bank for the Riparian Condition Index (RCI), a qualitative index of riparian integrity [48] adapted for European conditions [14]. The 13 attributes include shading, buffer vegetation, buffer width, buffer intactness, as well as soil quality, soil drainage, bank stability, etc., and are ranked 1–5 with scores indicating status from poor to excellent. The summed scores for each bank and averaged, leading to a qualitative index of riparian condition.
Data on land-use cover for stream catchments upstream of each study site were acquired from the CORINE Land Cover Inventory (CLC, available online 10th August 2020).

2.5. Diatoms

Diatom Sampling—Diatoms were sampled from late September 2017 to early October 2017, during a hydrologically stable period (Table S1) using the same standard methods described for the CROSSLINK project [14]. At each site, we sampled 10 stones (10–25 cm in diameter) with no or minimal coverage of bryophytes and filamentous algae. We selected stones in a stratified random manner, aimed at sampling lotic areas within the effective sampling reach (20–30 m). The sampled areas were representative of the site and we took care to avoid areas that might have been exposed aerially in the four weeks prior to sampling (e.g., stream margins). We brushed the upper surface of each stone with a clean toothbrush and rinsed the material to a plastic tray with ca. 500 mL stream water. We homogenized the sample in the plastic tray and poured it into a 250-mL container. Samples were stored on ice until our return to the laboratory, whereby all samples were refrigerated and allowed to settle overnight. Within 24 h of sampling, we decanted 2/3 of the liquid in each container and filled it up with 96% ethanol. Prior to preservation with ethanol, small subsamples of live diatom material were assessed to ensure that the samples contain mostly living cells. No quality assurance issues were detected, thus all samples were used for further processing.
Diatom Identification—The diatom permanent slides were prepared using the standardized method of chemical digestion by hydrogen peroxide (H2O2, 30%) [49]. Firstly, ~1 mL of sedimented material from each sample was transferred to an individual container (i.e., 25 mL centrifuge tube). The ethanol-fixation was washed out from the samples by distilled water and centrifugation (using a Relative Centrifuge Force [RCF] of 2607 g for five minutes), repeated three times. Following this step, H2O2 was gradually added to each sample, and then the samples were stored at a room temperature for two weeks. Following the two weeks storage, samples were centrifuged, the liquid decanted, and remaining H2O2 washed out by the distilled water and centrifugation procedure repeated five times. The final suspensions were checked for diatoms and mounted on permanent slides using the synthetic resin Naphrax (Brunel Microscopes Ltd. Wiltshire, UK). The microscopic analysis of diatom communities was conducted using Leica DM2500 light microscope, at a magnification of 1000×. From each sample, 400 randomly encountered diatom valves were determined to the lowest taxonomic level possible [50] using standard identification guides [51,52,53,54,55,56,57,58,59,60,61].
Diatom-Based Metrics—In addition to standard diversity indices (i.e., diatom richness, Shannon diversity, Pielou’s evenness, Berger-Parker dominance index, and Fisher’s alpha) we also calculated the diatom indices used in European bioassessment: the % Pollution Tolerant (PT) valves and the Trophic Diatom Index (TDI/100), calibrated to reflect organic pollution (i.e., saprobic conditions) and the impact of nutrient enrichment (especially phosphorus), respectively [31,40]; the Indice de Polluosensibilité Spécifique (IPS), an index calibrated to reflect both stressors together [34]; and the ACidity Index of Diatoms (ACID) [32], indicating the pH regime of a water course from acidic to alkaline. Indices were calculated using the OMNIDIA software (version 6.0.6) [62].

2.6. Data Analysis

Constrained Ordination and Variation Partitioning—We used constrained ordination techniques see [6,9,63,64,65] to investigate environmental and spatial influences on diatom community composition for all sites (n = 36) and site pairs (n = 20). Diatom abundance data were Hellinger transformed and used in the Euclidean-distance metric [66]. We selected predictor variables from a wider pool of data representing key groups of influence factors: spatial location, catchment land uses, water quality, and instream and riparian habitat (Table S2). To help normalize data and improve homoscedasticity, we log-transformed data (e.g., water quality parameters) and logit-transformed proportion data (e.g., % land cover, etc.). All data were then standardized (i.e., centered on the column means and scaled by unit variance) using the ‘decostand’ function in the “vegan” R package (v. 2.5-6) [67].
To select model predictors and avoid over-parametrizing models, we first removed highly collinear predictors (e.g., r > 0.75). We then used a forward-selection procedure to select a subset of explanatory variables following the method recommended by Blanchet et al. [68]. This selection procedure is performed in two steps to control for the probability of a Type I error and overestimation of the explained variance. To prevent overestimation of the explained variance, the forward selection has to be carried out with two stopping criteria: (i) the usual alpha significance level (α = 0.05) and (ii) the adjusted coefficient of multiple determination (R2adj) calculated using all potential explanatory variables. We used forward selection for both environmental and spatial predictors using the ‘forward.sel’ function in the “packfor” R package (v 0.0-8) [69]. As a final test to ensure that models were not over-parameterized, we used the ‘vif.cca’ function in the vegan R package to obtain variance inflation factors (VIF). Predictor variables were excluded if they had VIF score > 10 [70,71].
Spatial structuring of communities using Cartesian coordinates was assessed using Principal Coordinates of Neighbors Matrices (PCNM) analysis [72]. PCNM descriptors (or axes) represent a spectral decomposition of the spatial relationships among the study sites [72]. This can be important where processes structure communities at different spatial scales [73]. PCNM geographic functions are a type of ‘distance-based eigenvector maps’ (DBEMs) [72]. Thus, the PCNM approach is part of a wider family of methods also known as MEM (Moran’s eigenvector maps) [71,74]. PCNM axes were generated from spatial coordinates using the ´pcnm´ function in the vegan R package.
For all 36 sites, we first tested the independent contribution of five variable groups in the redundancy analysis (RDA) model OBM1 (Oslo Basin). We repeated this process in PSM1 using data from the site pairs (n = 20). We then combined the stream predictors (instream habitat and water quality) to make four variable groups in OBM2 for variation partitioning analysis. For these analyses, we used the vegan R package with the functions ‘rda’, ‘envfit’, and ‘varpart’. The significance of each independent variation component was permutation-tested using 1000 randomizations [75]. The results of the variation partitioning were visualized with Venn diagrams. We also visualized the results of partial redundancy analyses (i.e., conditioning out the influence of all predictors other than those representing riparian habitat).
Unconstrained Ordination and Indicator Taxa—To test our second hypothesis, we first implemented non-metric multi-dimensional scaling (NMDS) analysis on Hellinger-transformed diatom abundance data using the Euclidean-distance metric for site pairs (n = 20). Differences in community composition and dispersion between site types were tested with the ‘adonis’ and ‘betadisper’ R functions, respectively, using the vegan R package. We assessed which taxa contributed most to differences across groups using indicator species analysis (ISA). Potentially influential taxa associated with changes in community composition were first tested using the ‘simper’ R function in the vegan R package using 1000 permutations. Formal ISA was then conducted using the R package “indicspecies” [76]. Both analyses were based on NMDS models using Hellinger-transformed diatom abundance and occupancy data.
Principal Components Analysis—We used Principal Components Analysis (PCA) to create an index of catchment degradation (“urbanization”). The PCA decomposed log-transformed water quality variables (i.e., total inorganic nitrogen, ammonium, nitrite- and nitrate-nitrogen, total phosphorus, dissolved reactive phosphorus, specific conductivity, and pH) and logit-transformed upstream land-use cover variables (i.e., % of the catchment area covered by urban, agriculture, forest, water, wetlands, natural, and other) into sites scores (Axis 1, henceforth PC1) explaining 57% of total variation amongst sites (Table S4). PCA was performed using the rda function in the vegan R package.
Generalized Additive and Linear Mixed Models—We tested the influence of urbanization and differences between site types for response variables using generalized additive (GAM) and linear mixed-effects models (LME). We used these approaches to help further test our hypotheses (1, 2) by accounting for underlying environmental stress gradients and key contingencies modulating diatom responses to forested buffers. GAMs were fitted with the “bam” function in the “mgcv” R package (v. 1.8-31) [77], and included a smoothing random effect term for site “Block” to account for the non-independence of paired sites. LME (random effect: site “Block”) were fitted with REML using the ‘lmer’ function in the ‘lme4′ R package (v. 1.1-21) [78]. We also calculated mean standardized effect sizes with Hedge´s correction using the ‘batch_calc_ES’ function in the R package “SingleCaseES” (v. 0.4.3) [79] to assess the effect size of responses between site pairs (i.e., including statistically non-significant differences).
Context dependent change—To test our third hypothesis, we adopted the conceptual framework introduced in Burdon et al. [14] and applied it to our 10 site pairs (buffered and unbuffered). Specifically, we tested if the effect size of change in a given diatom response was contingent on a local transition (i.e., the improvement in riparian condition measured as an effect size), environmental context (catchment “urbanization” measured using PC1), and/or an interaction between these two terms (i.e., local transition × environmental context). We calculated effect sizes using log response ratios for the change in the %PT diatom and riparian condition (RCI) indices between unbuffered and buffered site pairs. We compared different general linear models (GLM) populated by these response and predictor variables using an information-theoretic approach. Support for the most appropriate model was based on the lowest Bayesian Information Criterion (BIC) scores.

3. Results

3.1. Description of Diatom Communities

In total, we identified 233 diatom taxa belonging to 61 genera (from 14,440 individual valves). Highest species richness were recorded within the genera of Nitzschia (28 taxa), Gomphonema (24), Eunotia (23), Navicula (15), Achnanthidium (15), Fragilaria (15) and Encyonema (11). The most abundant diatom species was Achnanthidium minutissimum (Kützing) Czarnecki. We separated this taxon into size groups following the Swedish standard [80]: one group with a mean valve width of 2.2–2.8 µm (occurring at a wide variety of sites, three times more abundant than the other taxon), and one group with a mean valve width > 2.8 µm (often dominating more impacted, nutrient-enriched sites). The other dominant taxa were Cocconeis placentula Ehrenberg (including varieties), followed by Reimeria sinuata (Greg) Kociolek and Stoermer, Navicula gregaria Donkin, Amphora pediculus (Kützing) Grunow and Amphora sp. (identified as Amphora aff. pediculus). The species richness per site varied between 16 and 49, with the mean of 29 taxa. For further information regarding diatom species richness, diversity and diatom indices, see Table S3 (Supplementary Materials).

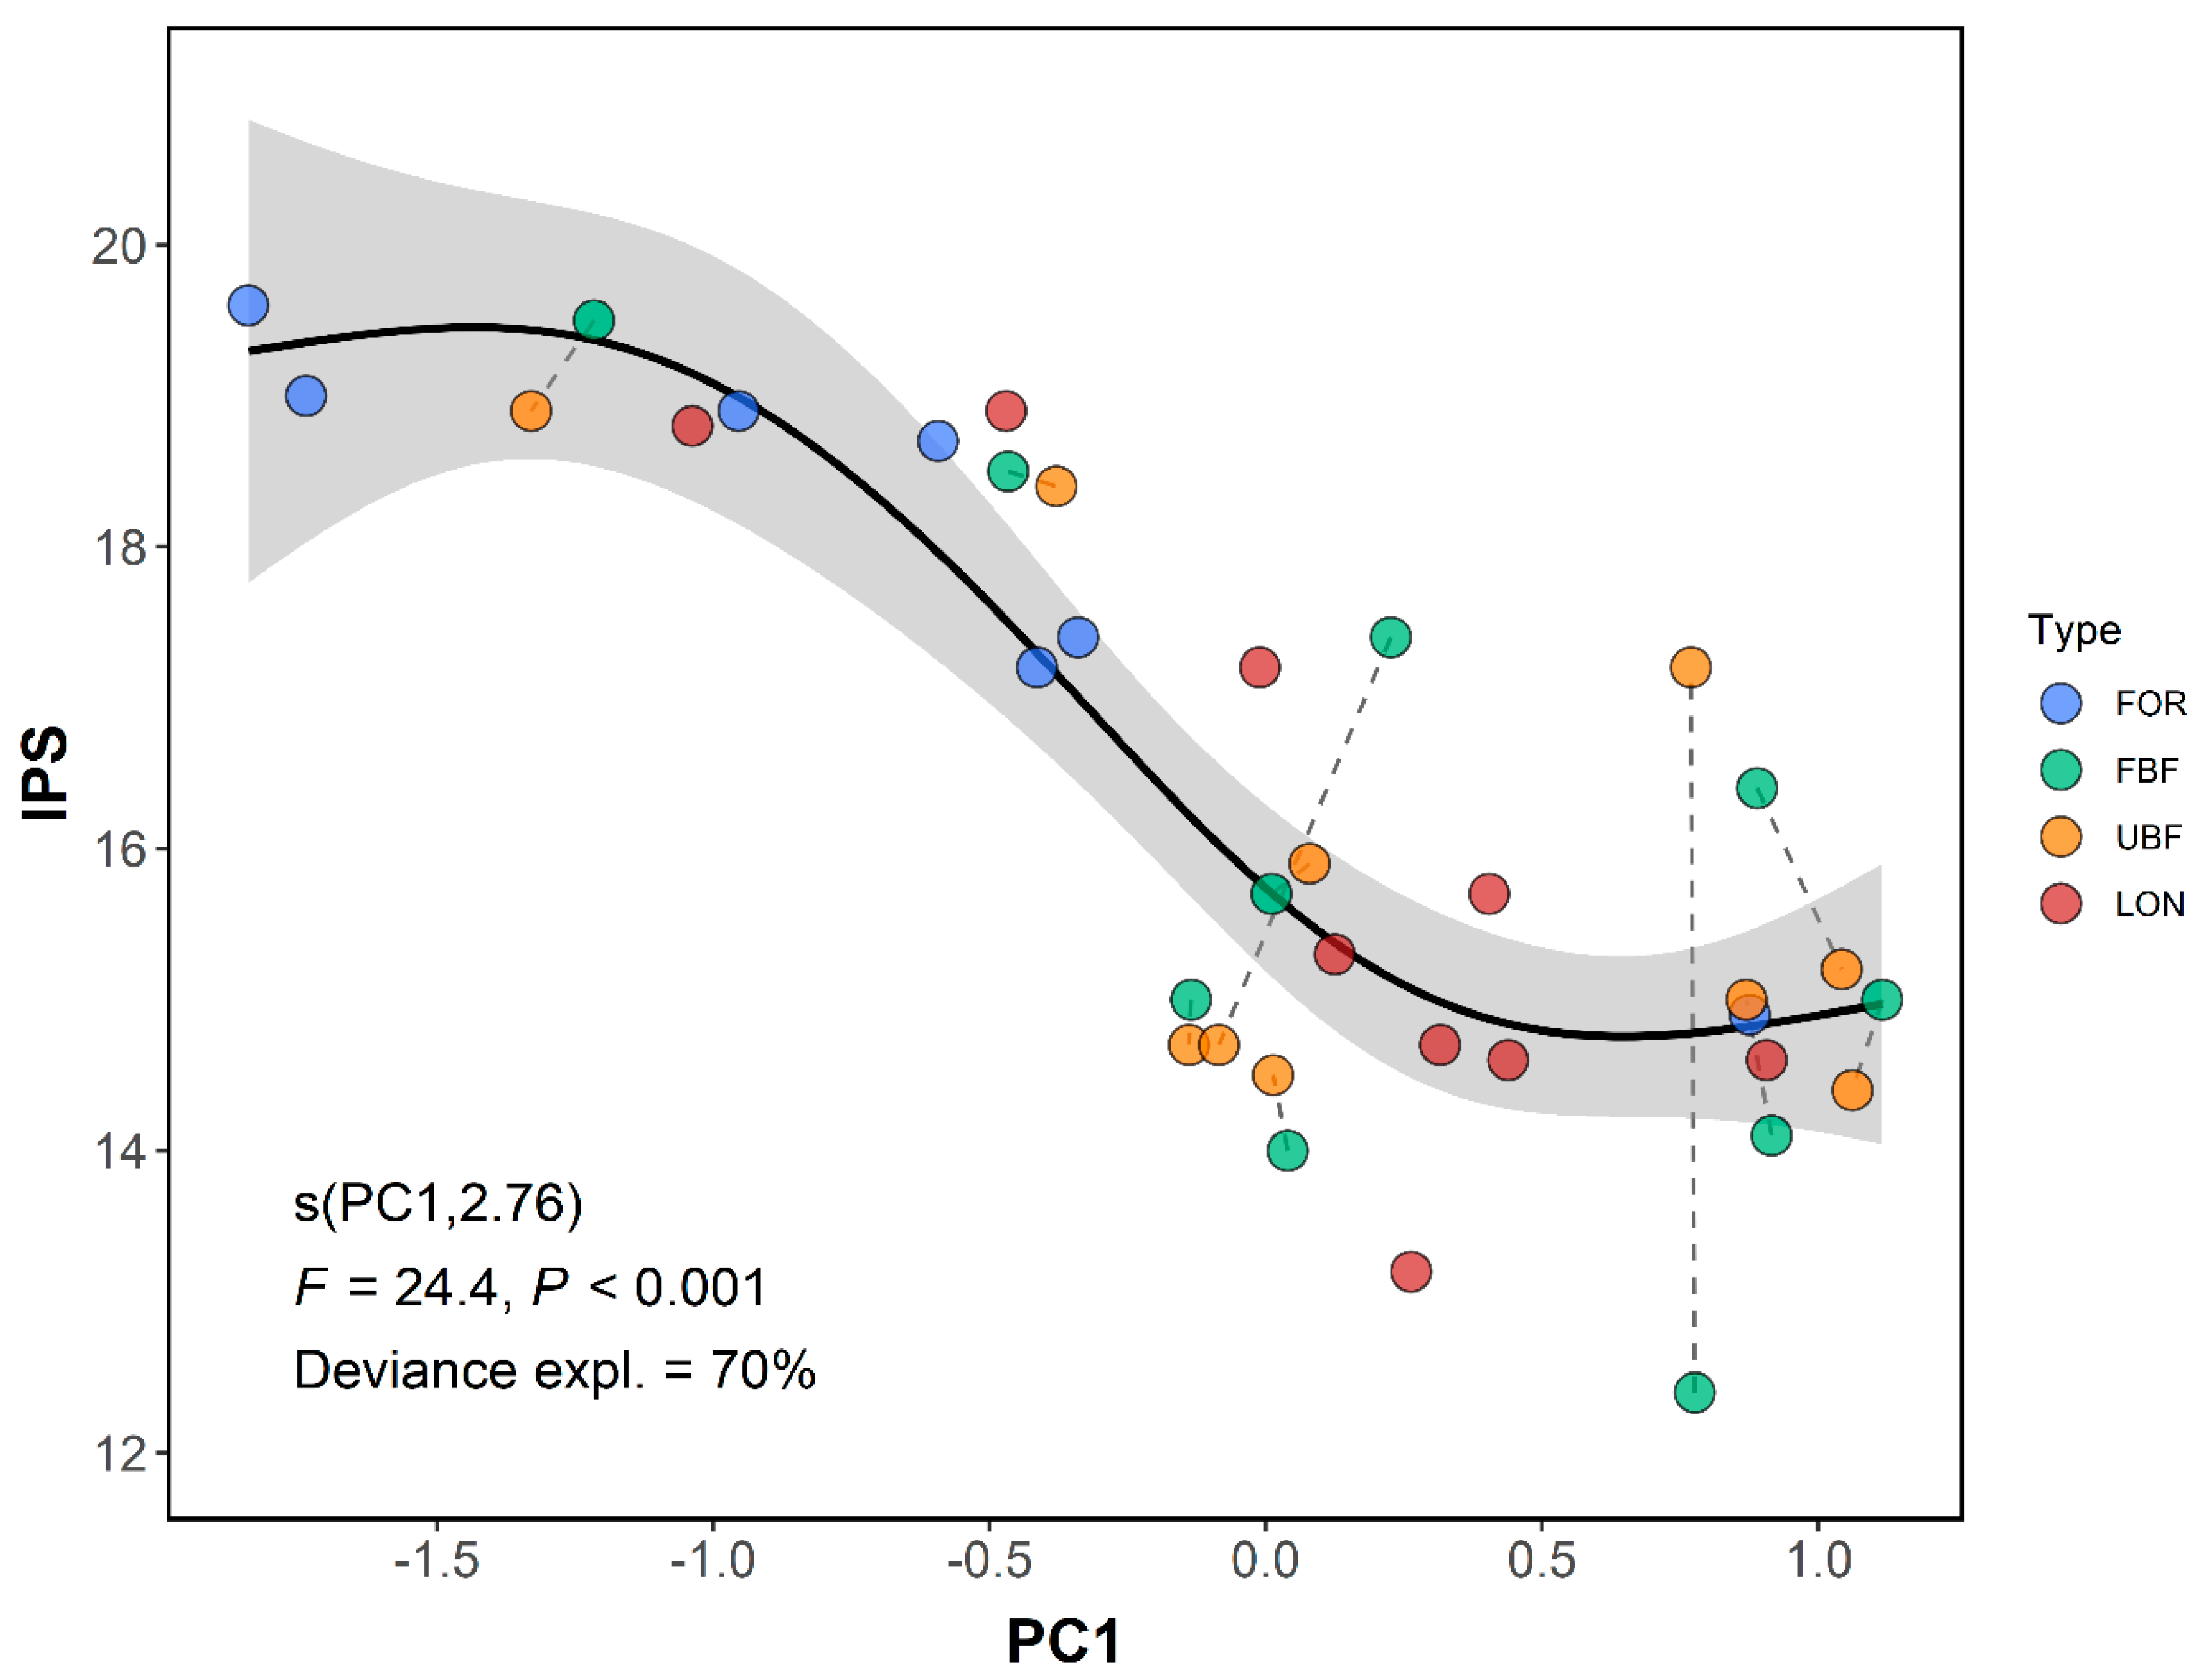
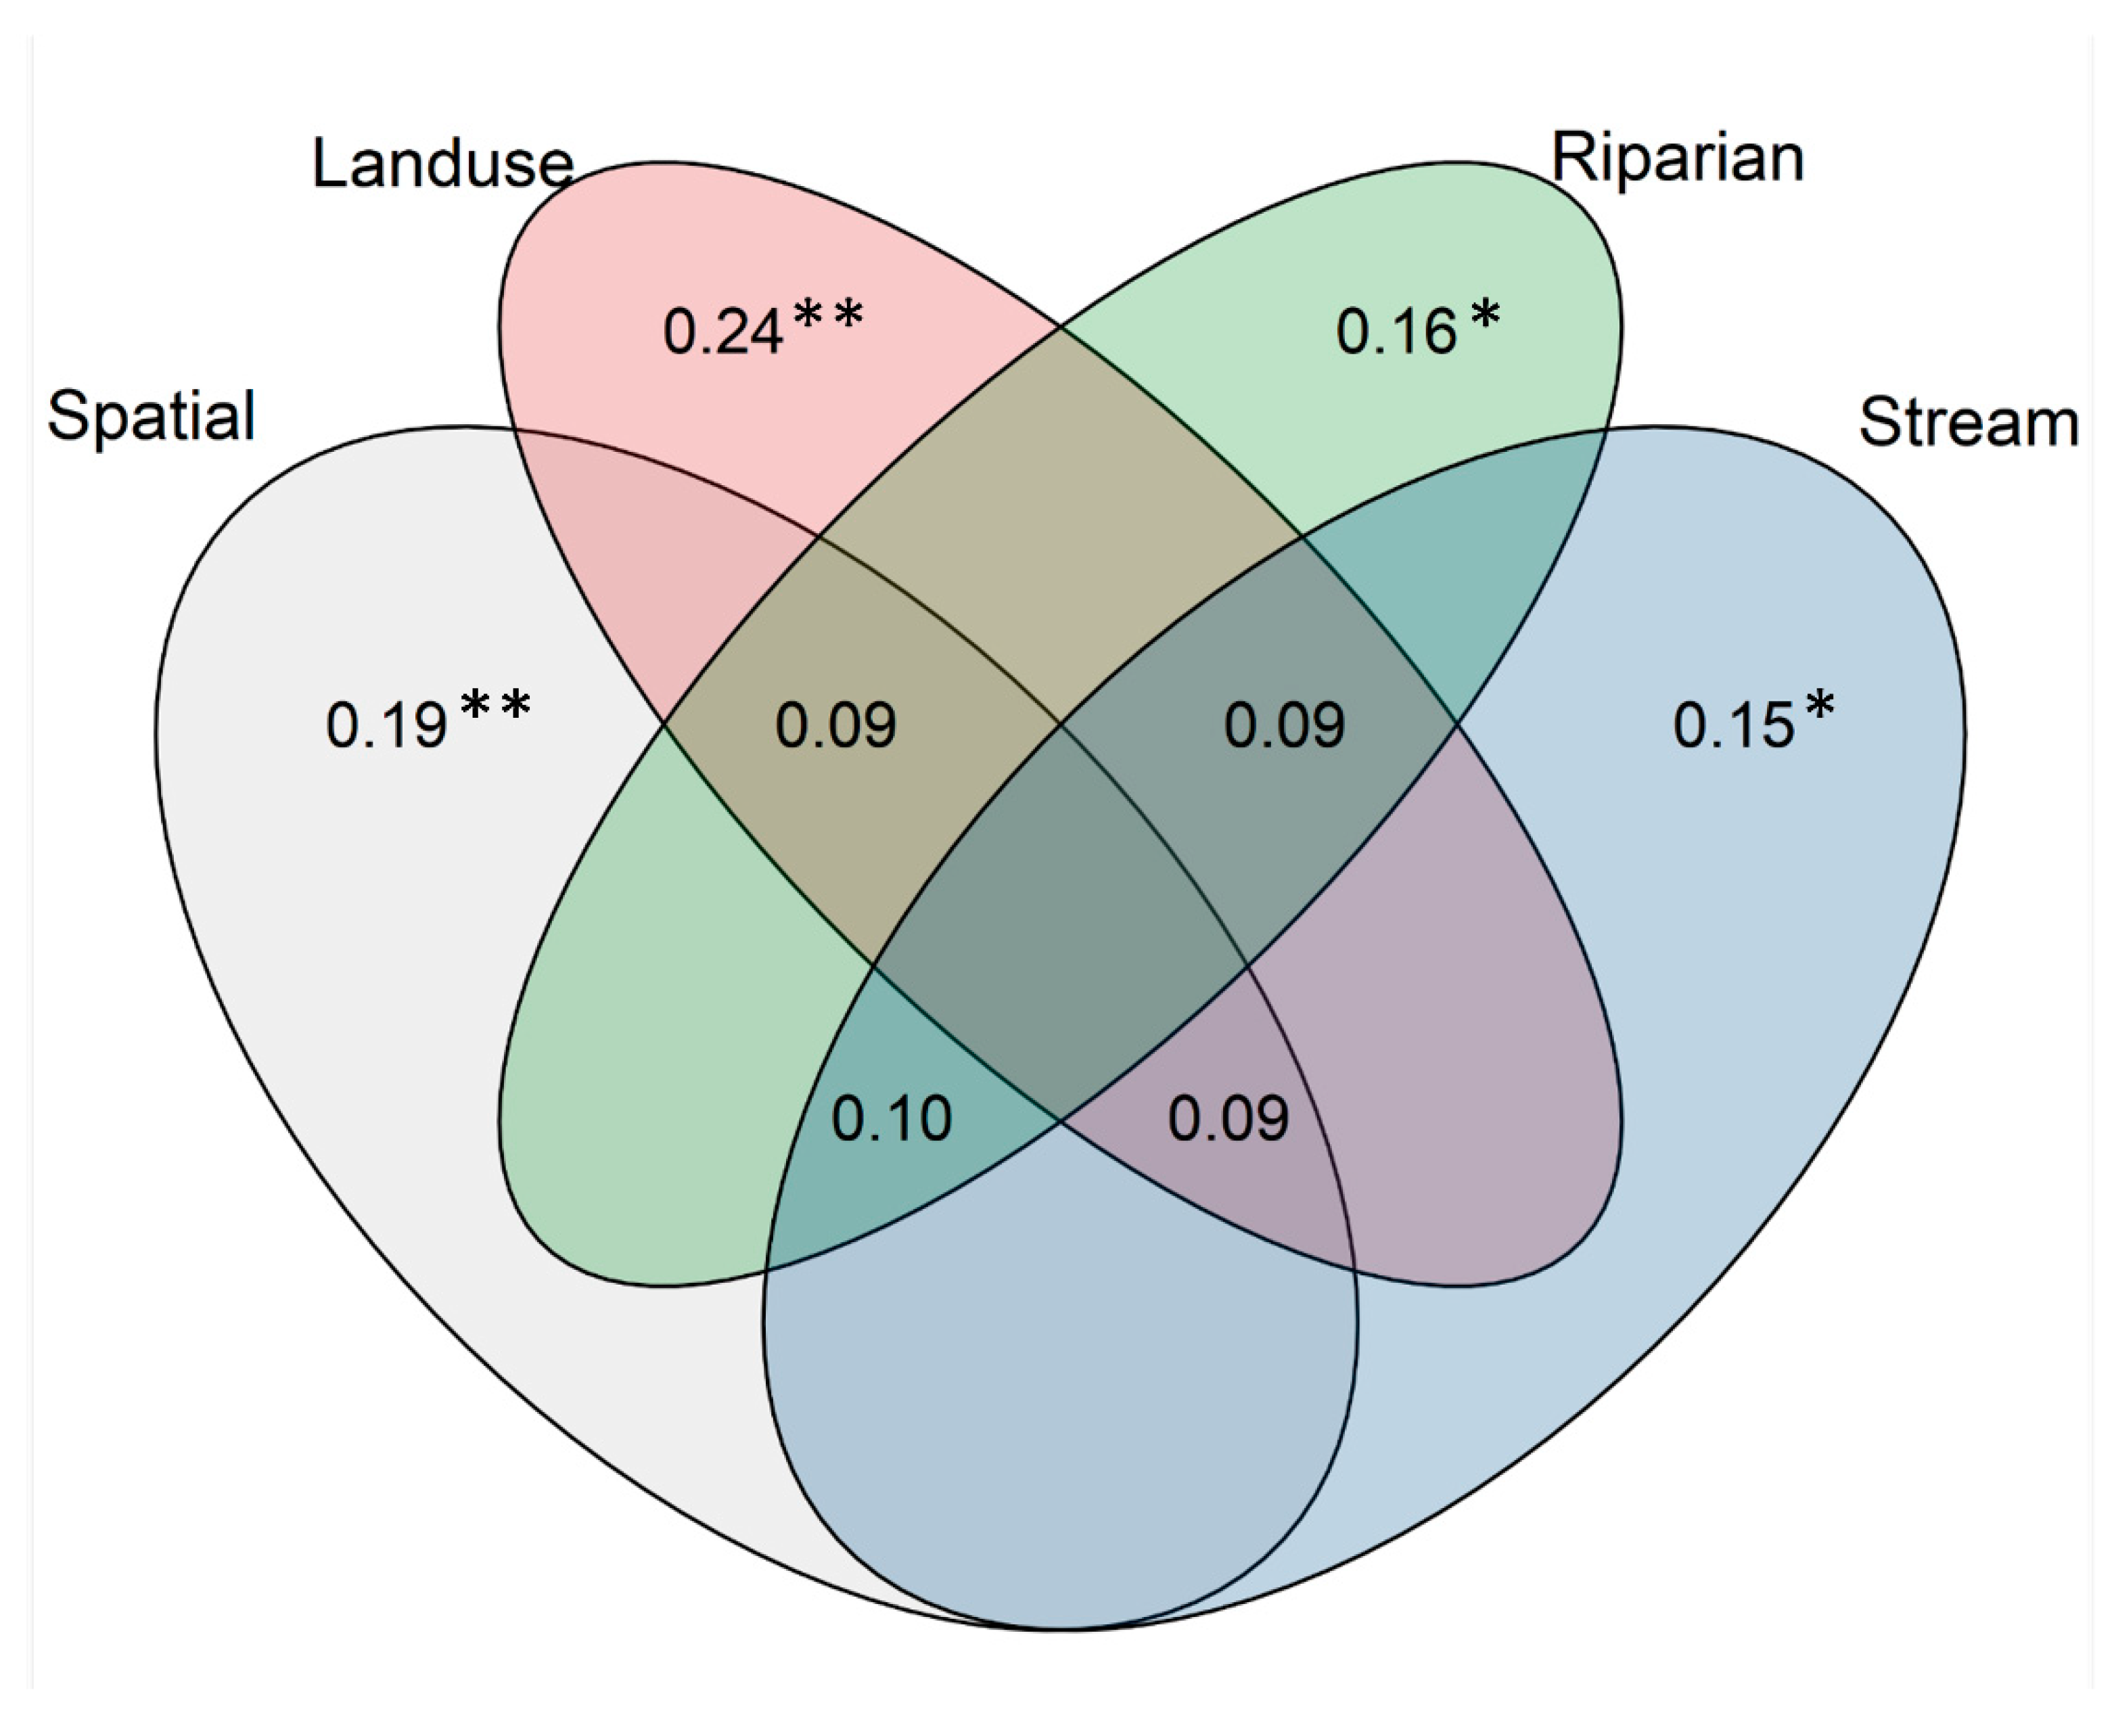
3.2. Drivers of Diatom Community Structure in the Oslo Basin

To overview factors influencing benthic diatom community composition in the Oslo basin, we first analyzed diatom communities from all 36 sites using redundancy analysis (RDA). The RDA model OBM1 included forest reference sites and downstream impacted urban “matrix” sites in addition to the 10 site pairs (unbuffered and buffered). In OBM1 we were able explain 44% of variation in diatom community structure. However, little of this variation could be attributed to significant independent contributions of individual predictor groups. Spatial location (5 PCNM axes) independently accounted for 12% of variation (F5,19 = 2.09, p < 0.001) and Water quality (Nitrate and TP) alone was able to explain 3% (F2,19 = 1.66, p < 0.05), but Land use, Riparian and Instream habitat were statistically indistinguishable, reflecting the large proportion of shared variation amongst predictor groups.
We decomposed water chemistry and land use variables using PCA into an “urbanization” index explaining 57% in total variation amongst sites (Table S4). We found strong, non-linear responses in diatom-based metrics along this urban pressure gradient. The TDI increased in response to urbanization, reflecting the impacts of nutrient enrichment along the pressure gradient (F = 15.0, p < 0.001, Deviance explained = 93%; Figure S1a). Likewise, the %PT increased, showing that declines in water quality included greater saprobity and organic enrichment (F = 6.01, p < 0.01, Dev. expl. = 33%; Figure S1b). The cumulative impact of these stressor gradients was best demonstrated in the IPS index, which showed a highly significant threshold response along the urban pressure gradient (F = 24.4, p < 0.001, Dev. expl. = 70%; Figure 2). The ACID index also responded, with higher values indicating more alkaline water conditions with increasing catchment urbanization (F = 9.16, p < 0.001, Dev. expl. = 40%, Figure S1c). In contrast, taxa richness was invariant along the urbanization gradient ( X 1 2 = 0.02 ,   p = 0.880 ) .

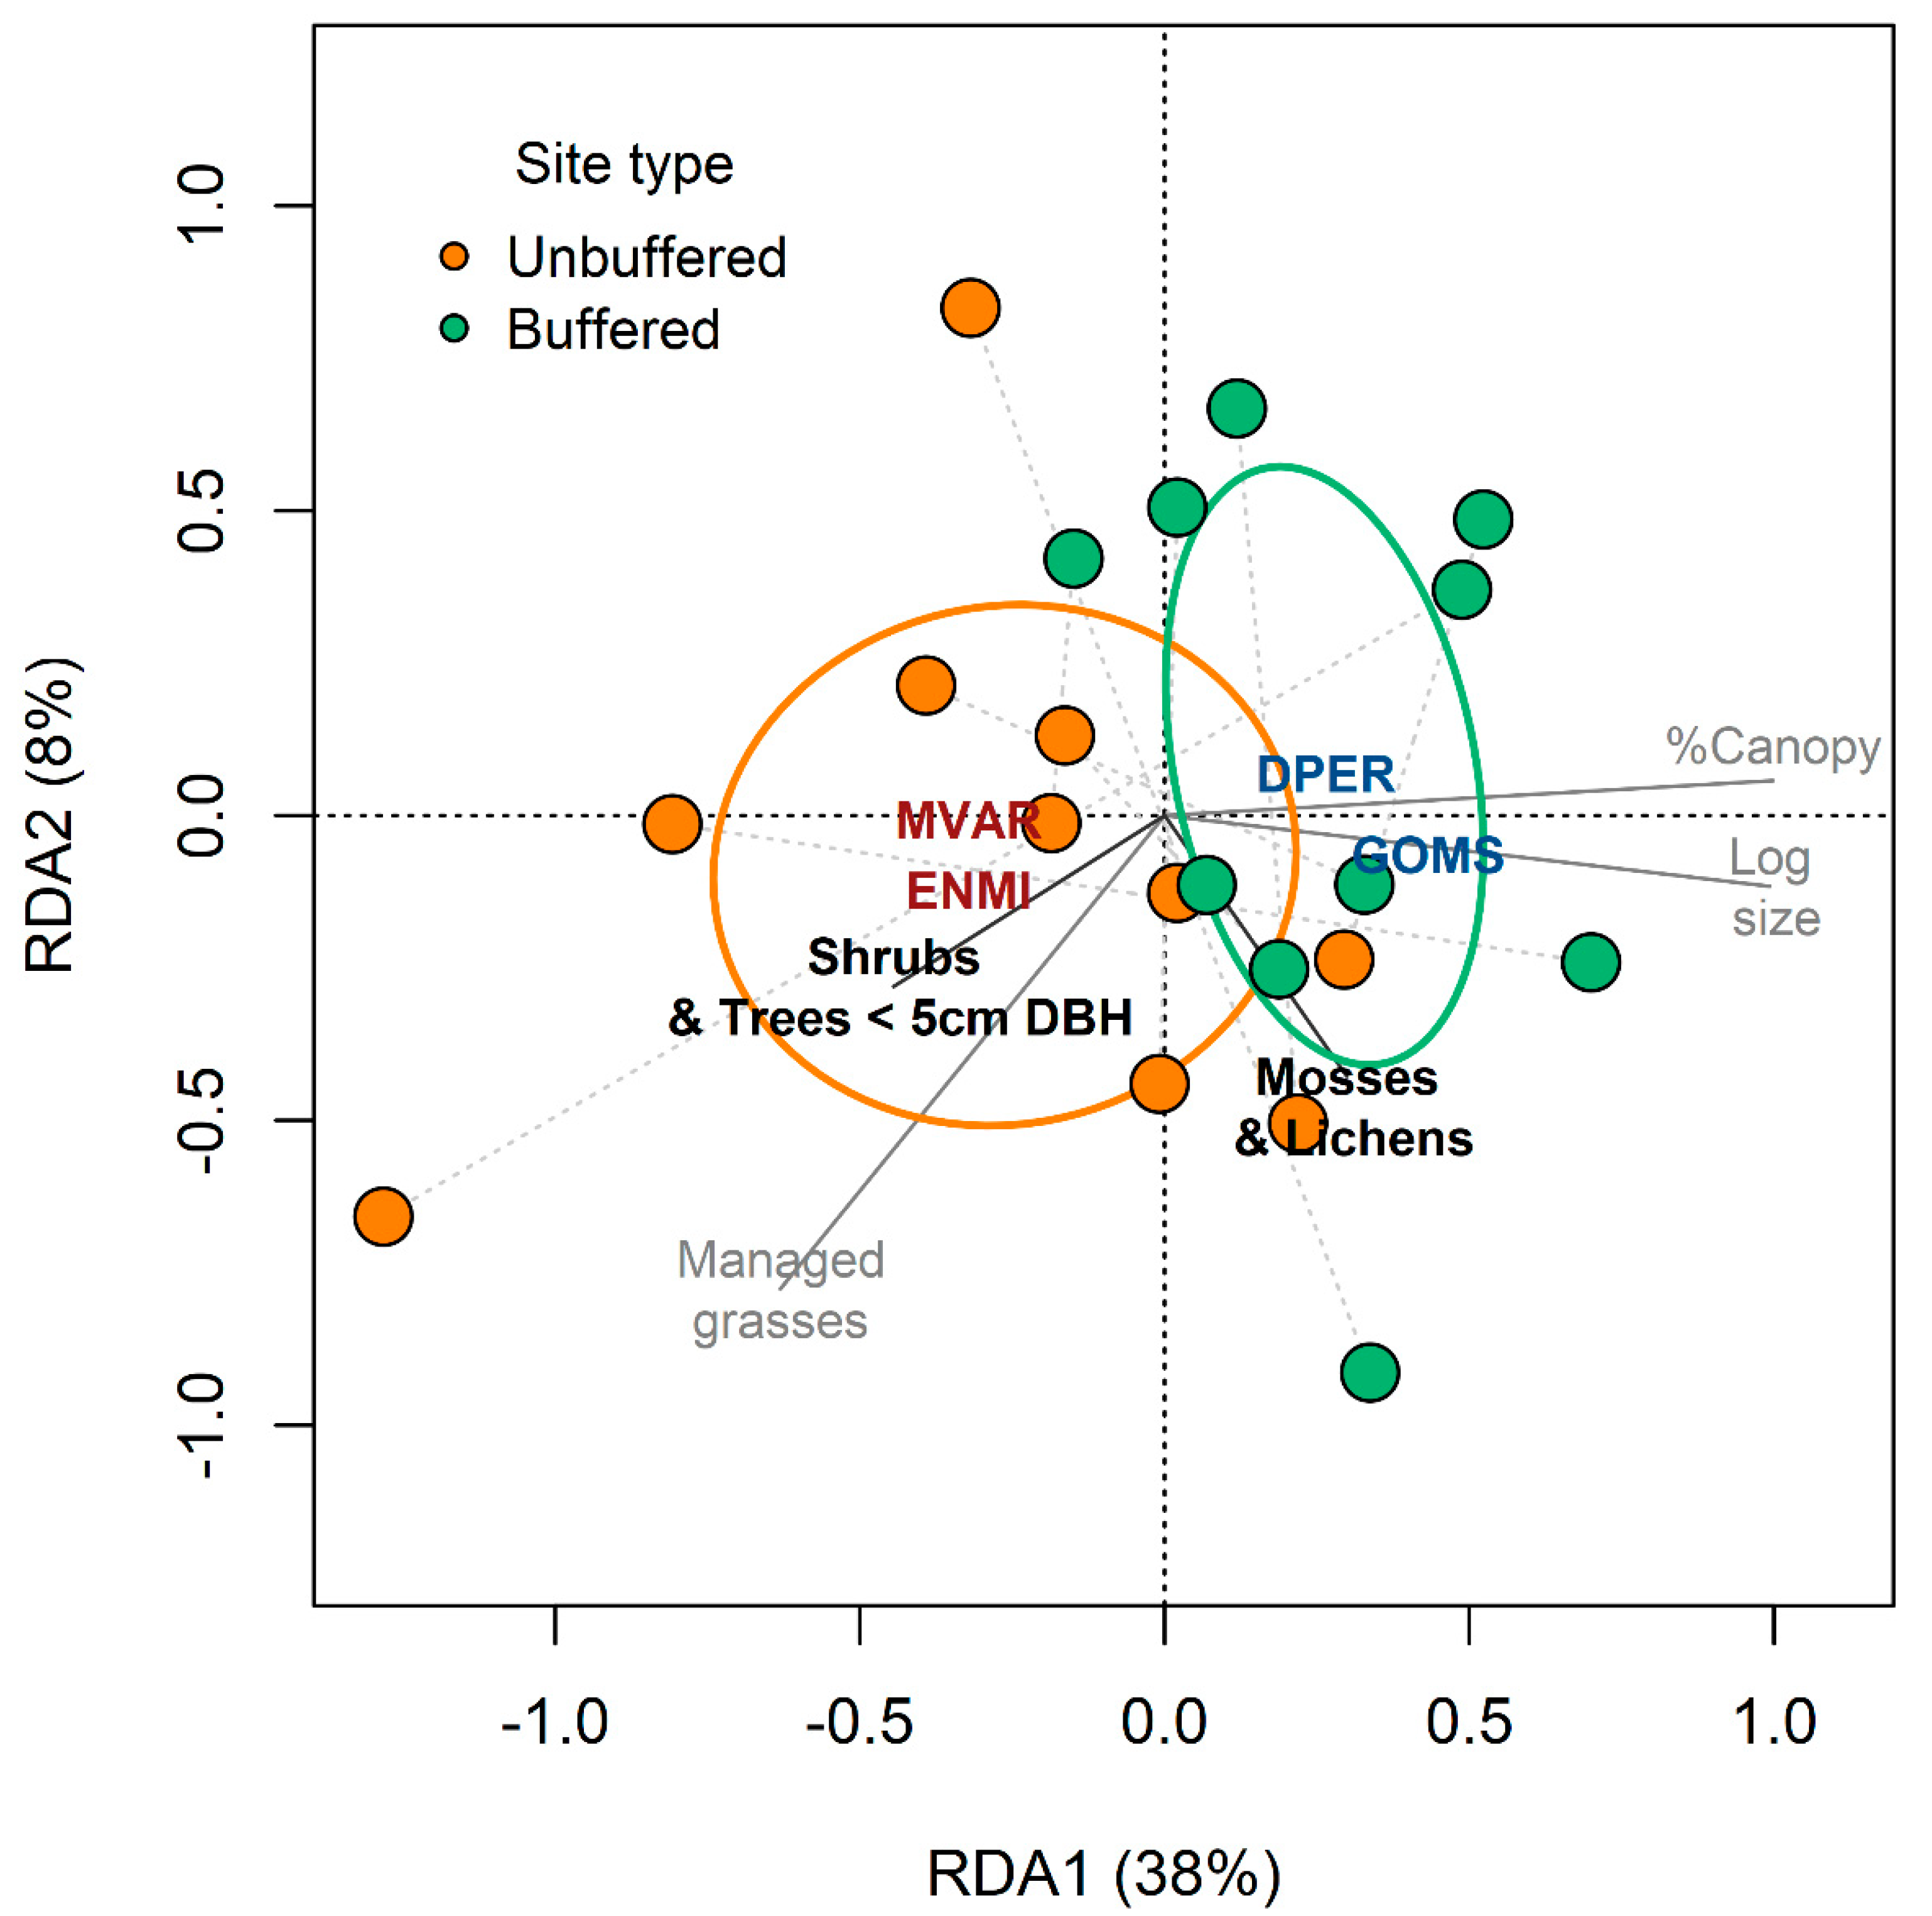
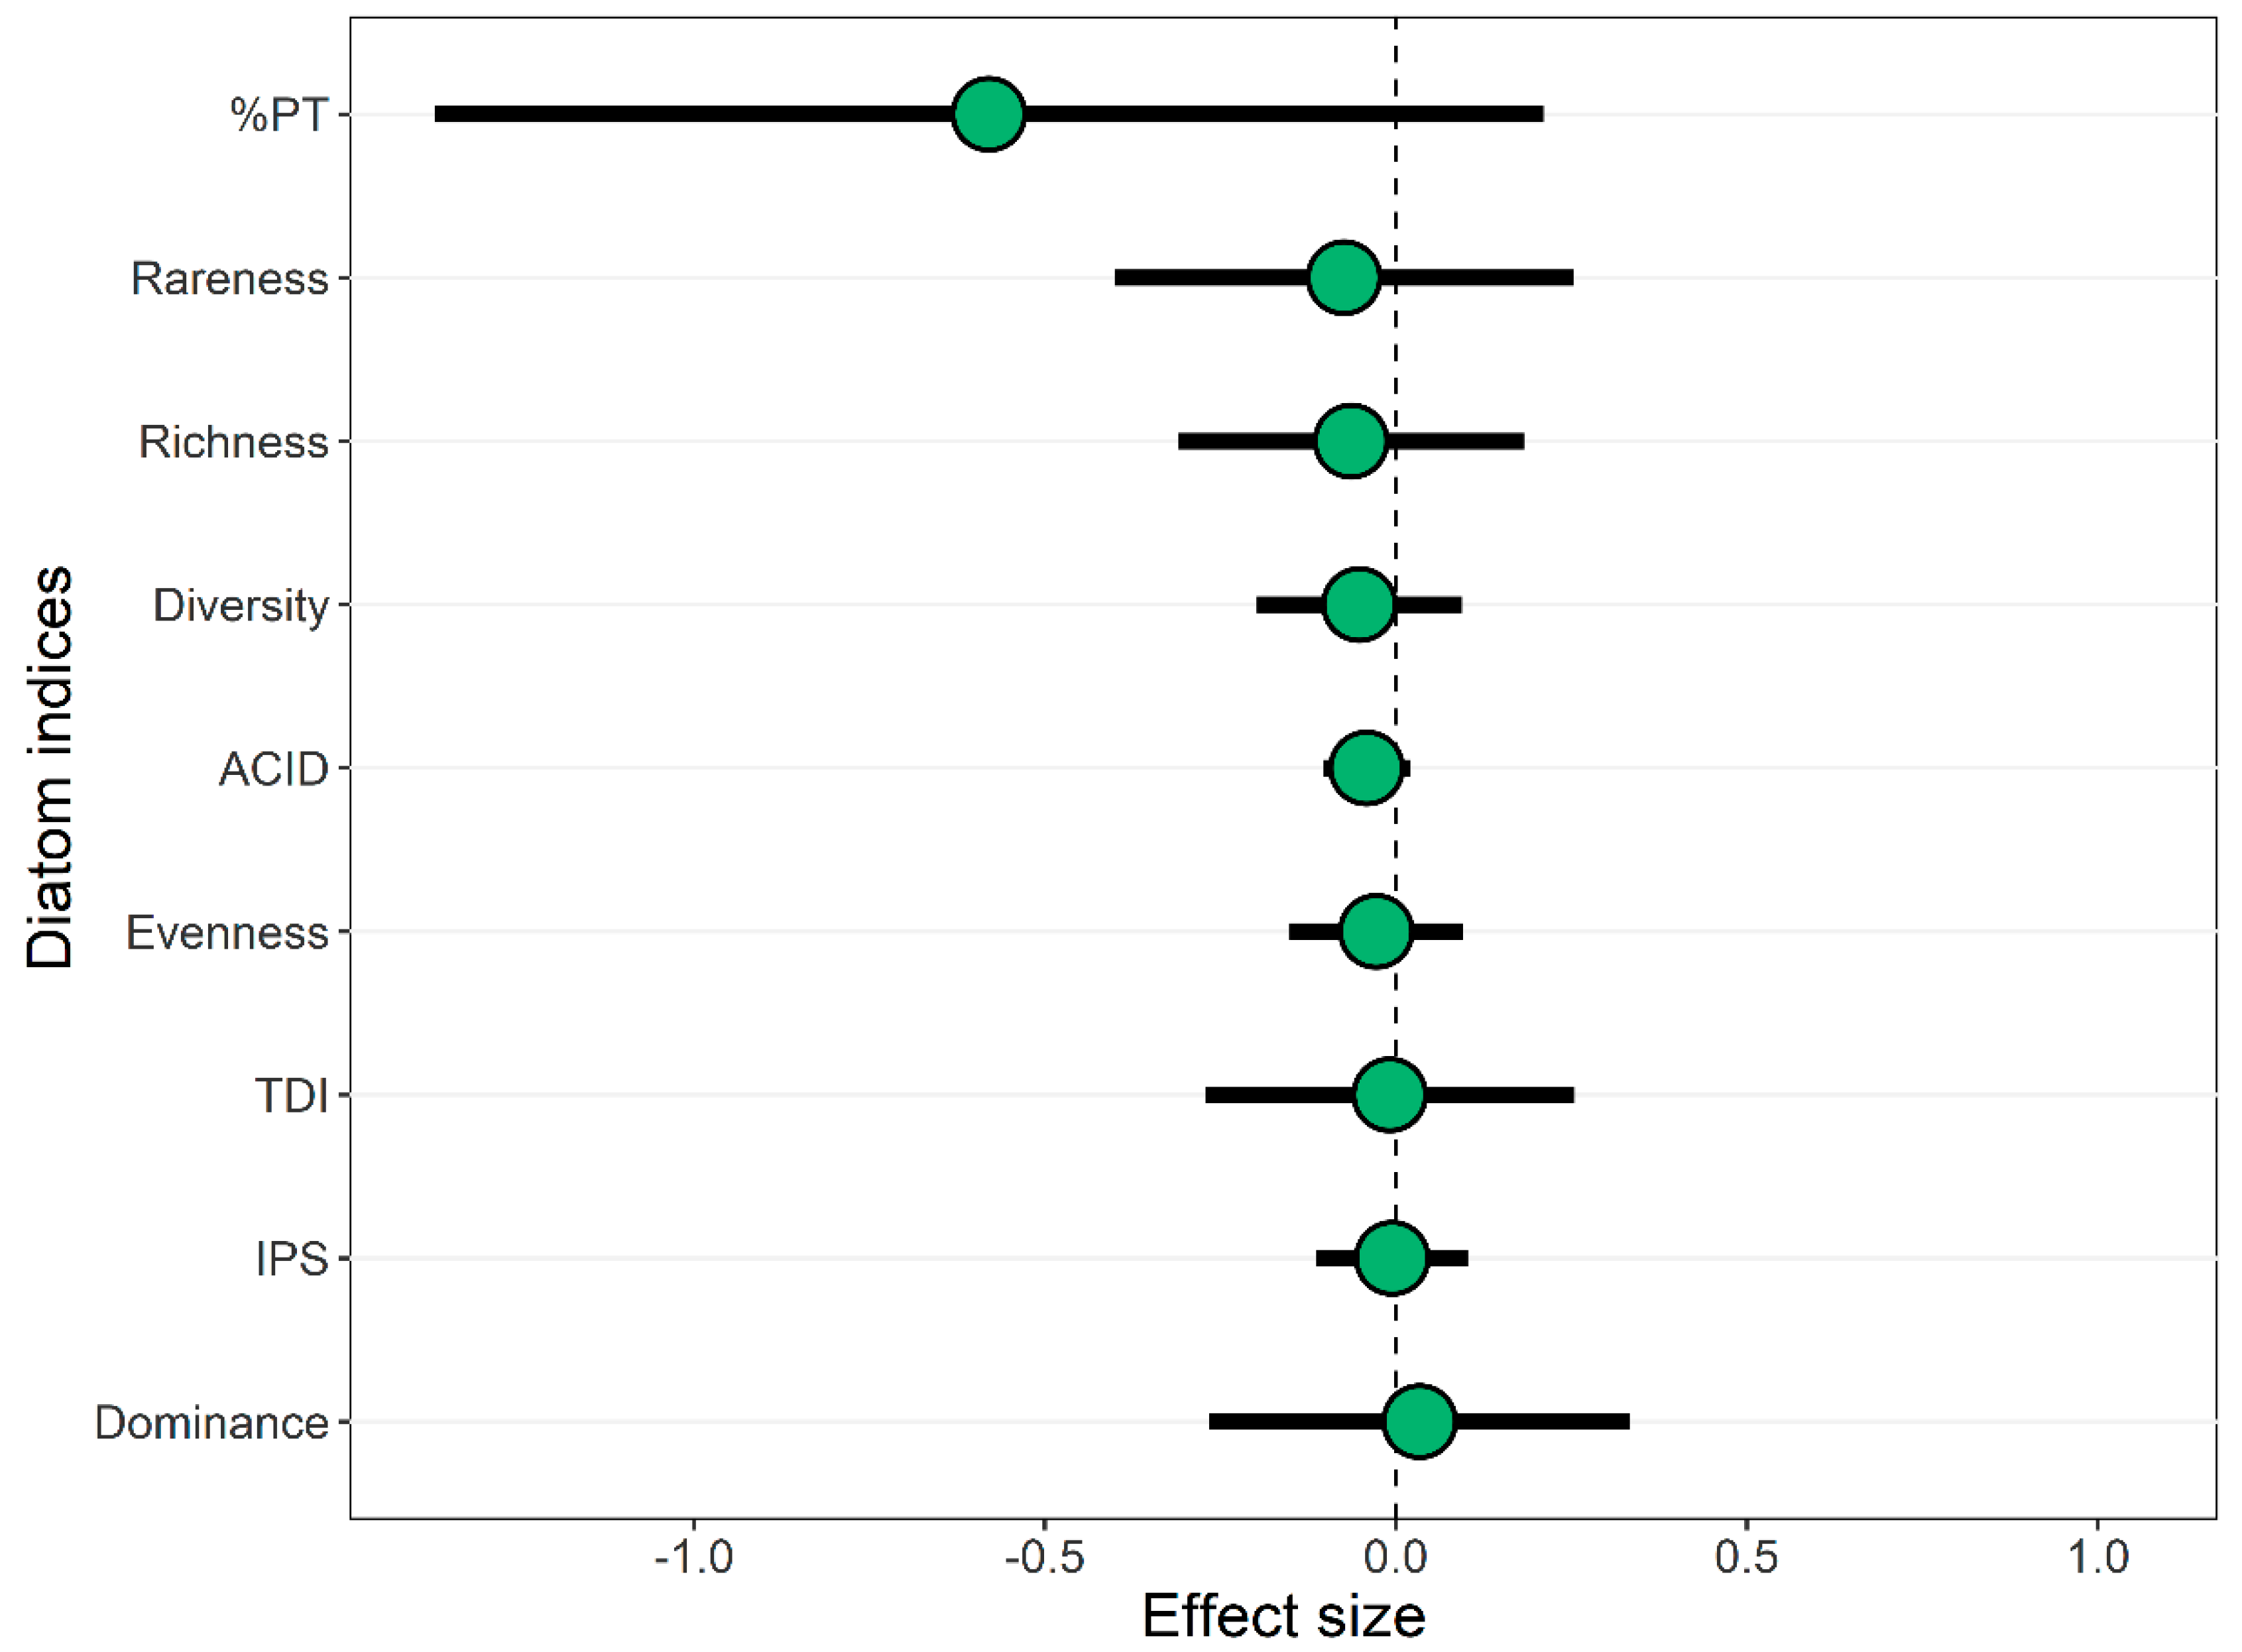
3.3. Forested Buffers and Diatoms in Urban Streams

To help understand the influence of forested riparian buffers on benthic diatom community composition in the Oslo basin, we analyzed diatom communities from the 10 urban site pairs (unbuffered and buffered reaches). First, we used an unconstrained NMDS ordination to show that benthic diatom community composition differed between urban buffered and unbuffered reaches (“adonis”, F1,18 = 0.982, p < 0.01, R2 = 5.2%). Dispersion effects did not confound the influence of site type on community composition (“betadisper”, F1,18 = 0.832, p = 0.402).
Variation partitioning (PSM2) using four groups of predictors (Spatial, Land use, Riparian, and Stream [Instream habitat + Water quality]) showed the significant independent effects of Spatial (F5,6 = 2.04, p < 0.05), Land use (F2,6 = 3.35, p < 0.01), and Stream (F4,6 = 1.92, p < 0.05), each explaining 15–24% of the total variation in the diatom community structure (Figure 3). In PSM2, riparian habitat independently explained 16% of total variation (F2,5 = 2.54, p < 0.05). Riparian habitat, stream factors, and spatial location combined explained 10% of total variation, indicating spatial autocorrelation of local stream–riparian impacts. The unexplained (residual) variation was 41%. For the results from PSM1, see Appendix B, Supplementary Materials.
We used partial redundancy analysis (pRDA) to condition (“partial”) out the influence of factors other than riparian attributes explaining variation in diatom community composition. This revealed differences in community structure after accounting for confounding spatial and environmental factors (Figure 4). The species scores from the pRDA analysis (Figure 4) indicated differences in abundances between unbuffered and buffered sites (Table S5). Notably, species tolerant of nutrient enrichment and organic pollution such as Achnanthidium minutissimum group III (mean width >2.8 µm), Melosira varians, and Navicula gregaria were more common at unbuffered sites. The more sensitive taxa Achnanthidium minutissimum group II (mean width 2.2–2.8 µm) and Reimeria sinuata were more common at the buffered ones.
Using the NMDS ordinations, we identified several potential indicator taxa for buffered and unbuffered sites (Figure 4). The indicator species analyses (ISA) revealed influential diatom taxa and potential indicators for the site types. Encyonema minutum (Hilse) D. G. Mann (OMNIDIA abbreviation ENMI) and Melosira varians C. Agardh (MVAR) were more common at the unbuffered sites, whereas Humidophila perpusilla (Grunow) Lowe, Kociolek, Johansen, Van de Vijver, Lange-Bertalot and Kopalová (DPER; in OMNIDIA as Diadesmis perpusilla (Grunow) D. G. Mann) and Gomphonema spp. (GOMS) were more common at the buffered sites (also showed in Figure 4). In the formal ISA using “indispecies”, Humidophila perpusilla, Encyonema minutum and Gomphonema spp. were significant indicator taxa at p < 0.05, whilst Melosira varians was marginal (p = 0.084). All four taxa were significant at p < 0.05 in the SIMPER (Similarity Percentage) analysis based on 1000 permutations.
Supporting these changes in diatom communities, we saw differences in habitat attributes between buffered and unbuffered sites (Table S6). Buffered sites were characterized by greater shading (% canopy cover), higher tree densities, and differences in groundcover, including more terrestrial detritus (logs and plant litter). In contrast, unbuffered sites were more open with greater proportions of grass cover. Instream changes included shallower water depths in buffered sites and higher % cover of filamentous algae at unbuffered sites.
However, despite the clear changes in diatom community structure between buffered and unbuffered sites (Figure 4), the diatom-based diversity and standard indices were more equivocal (Figure 5). Only the %PT (% Pollution Tolerant) index registered a moderate effect size of riparian buffering (Figure 5), with the provision of forest cover helping to reduce the proportion of diatom taxa with high tolerances to saprobic conditions and organic enrichment. However, this reduction was only significant ( X 1 2 = 6.56 ,   p < 0.01 ) after accounting for confounding influences of variation in riparian condition (RCI, X 1 2 = 4.47 ,   p < 0.05 ), since forest buffers were not of uniform quality.

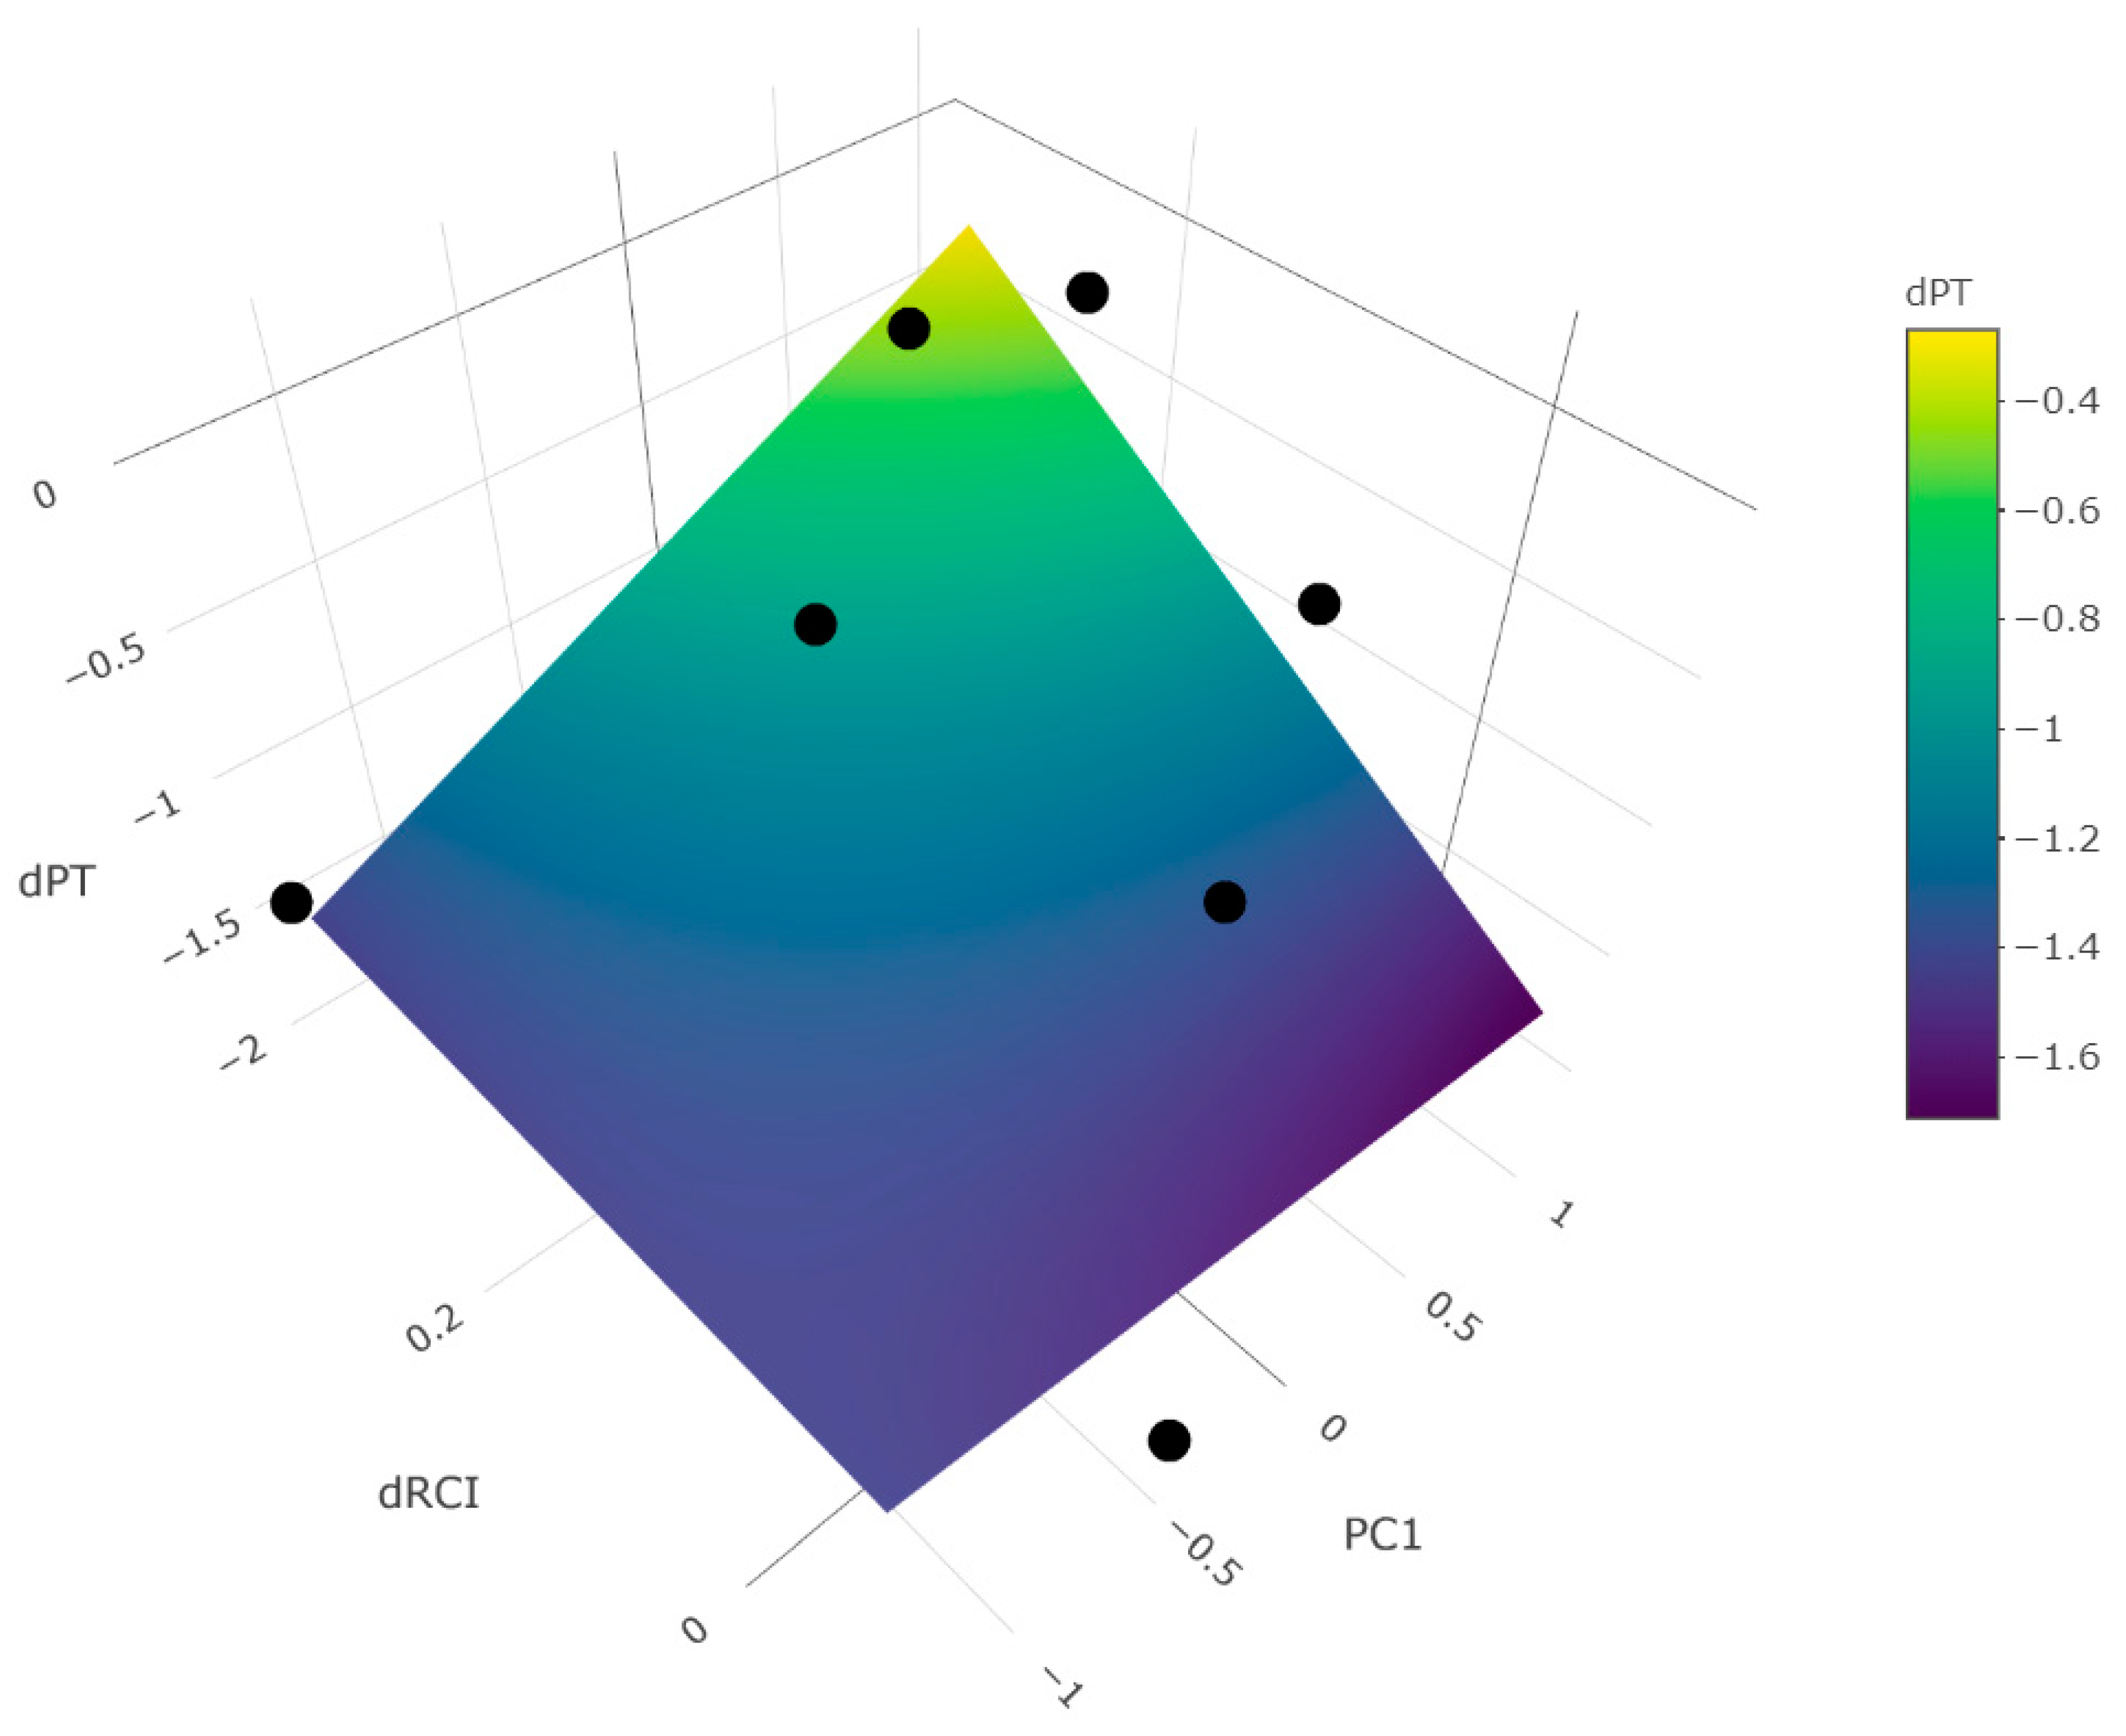
3.4. Context Dependent Influences of Forested Buffers on Diatoms

We used %PT as our diatom response variable to assess the hypothesis (3) that any change in diatom communities conferred by improved riparian conditions (i.e., forested buffers) is contingent on upstream impacts. We used %PT because it showed a moderate negative effect size in response to forested riparian buffer presence in our urban site pairs (Figure 5). We tested the effect size (log response ratio, LRR) for %PT in response to the change in riparian condition (LRR), upstream urbanization (PC1), and their interaction. We saw evidence for an interaction between catchment urbanization and riparian integrity, where the positive influence of improved riparian condition on reducing %PT weakened with increasing urbanization (Figure 6). However, despite the interplay between predictors conforming to our expectations, we did not find statistical support for this model (ΔBIC = −3.70). We had to remove an outlier site (Alna) due to a piped discharge at the downstream site confounding the forested buffer, thereby contributing to low statistical power and increased chance of a Type I error. No model tested indicated a significant influence on the change in %PT.

4. Discussion

The “urban stream syndrome” describes a general response of ecological degradation in streams with urbanized catchments [3]. Reversing these impacts has become a research focus, and the catchment scale is generally regarded as the most appropriate spatial scale for implementing effective management approaches for conserving and restoring urban streams [26]. However, there is a growing body of evidence suggesting that establishing forested riparian buffers at the reach scale can provide numerous co-benefits in multifunctional urban landscapes [14]. We sought to better understand what effect riparian buffers have on diatom communities in the urbanized Oslo basin. First, we showed that spatial location and water quality have significant independent effects on diatom communities across all site types. Declines in water quality were particularly pervasive, with several of our diatom-based metrics showing strong non-linear responses to catchment urbanization. We then focused on 10 urban site pairs, each with an upstream, unbuffered reach, and a downstream forest buffer. We were able to show that among site pairs, riparian attributes significantly explained 16% of total variation in diatom communities, despite competing influences of spatial location, urban land cover, and instream variables including habitat and water quality. The presence of a forested riparian buffer caused diatom community composition to change, including turnover of indicator taxa and a reduction in pollution tolerant taxa (%PT). Our case study targeted an important organismal group in stream–riparian networks, and was able to demonstrate tangible benefits of forest buffers. This research contributes to the wider efforts to develop a general framework for implementing riparian buffers in human-impacted landscapes.

4.1. Diatom Responses to Urbanization

Diatoms are highly effective indicators of environmental change [29], and we were able to use this organismal group to demonstrate the impacts of urbanization (i.e., land use change, declining water quality) on stream ecosystems in the Oslo basin. Our results concurred with impacts of urbanization on diatoms reported elsewhere [11,33,36,37,38,39,42,81], and we found the standard diatom indices (TDI, %PT, IPS) to be useful indicators of ecological decline along the urban pressure gradient. The strong, non-linear response of the IPS index was striking (Figure 2), and contradicted Teittinen et al. [36] who did not find the IPS to be a reliable indicator of water quality across an urban-to-rural gradient in southern Finland. However, the IPS index has been demonstrated to be a useful indicator of catchment urbanization and nutrient enrichment in Central Europe [42]. Non-linear responses to human impacts in stream ecosystems are not uncommon [64,82,83], and threshold responses in stream diatoms to human pressures include catchment land uses and nutrient loading [84,85,86]. The mechanisms underpinning these patterns are uncertain, but have been attributed to differing nutrient requirements resulting in stoichiometric imbalances [87]. For instance, synchronous declines in diatom species can occur with TP concentrations >21 μg/L (18–48 μg/L, 90% CI), in addition to simultaneous increases in tolerant species associated with the increasing nutrient enrichment [84]. Other mechanisms driving threshold responses may reflect changes in urban drainage patterns relative to urban land cover, resulting in abrupt changes in water quality [88].
Overall, diatom diversity was relatively low in the Oslo basin with species richness and composition similar to other urbanized areas of boreal Northern Europe [36,39]. The patterns we observed for taxa richness contradicted the general trend of decreasing diatom richness with increasing urbanization [11,33,36,37]. The invariance of taxa richness along the urbanization gradient in the Oslo basin could be due to stochastic influences of point source pollution (i.e., sewer overflows and/or industrial wastewater) at a handful of sites (Tables S1 and S3). For instance, several sites (e.g., Hoffselva FBF, #29) were impacted by point source discharges of unknown composition and origin, potentially contributing to the minimal taxa richness observed at these sites (16–17 diatom taxa; Table S1). Despite these potential impacts on diatom diversity, the maximal species richness among all our samples (49 diatom taxa) was recorded in the same catchment at the most downstream site (Hoffselva LON, #30). This biodiversity ‘hotspot’ might indicate positive effects of local habitat heterogeneity combined with mass effects from upstream reaches [89]. Although our study contradicted the general pattern of decreasing species richness downstream in urban catchments, Sonneman et al. [33] found that diatom species richness did not vary consistently between urban and peri-urban sites in metropolitan Melbourne, Australia. The outlier sites in the Oslo basin created “noise” in diversity patterns, thus contributing to the invariance of taxa richness along the urbanization gradient. However, these sites typically reflected an overall pattern of negative responses to catchment urbanization (e.g., Figure 2) because of their general location within the urban stream network.

4.2. Forest Buffers and Diatoms in Urban Streams

We found clear differences between diatom communities at buffered and unbuffered site pairs in the urbanized Oslo basin (Figure 4). Our variation partitioning analyses further revealed that riparian attributes independently explained 16% of variation in community structure, despite competing influences of other spatial and environmental factors. The presence of riparian forest buffers changed the diatom community to one characterized by more sensitive taxa, as evidenced by the turnover of indicator species, increased abundances of the more sensitive Achnanthidium minutissimum group (II, mean width 2.2–2.8 µm), and decreases in the %PT index. Changes in diatom communities have been reported in previous studies [39,81]. Johnson and Amlöf [39] found that although benthic diatom species composition was not strongly related to riparian forest, diatom functional traits were, with canopy cover explaining almost 33% of the total variation. However, in our study, the higher values for the %PT index upstream of the forest buffers suggested that unbuffered reaches were affected by organic pollution in addition to increased light availability.
Whilst the forest buffers in the Oslo basin are important for providing riparian shade [14], the response of the %PT index in our case study suggests factors other than canopy cover may contribute to localized restructuring of diatom communities. In urban streams, increased surface and sub-surface connectivity to drainage networks can lead to impacts on water quality [90,91], and forest buffer presence may have helped in mitigating these stress pathways. This scenario is not implausible, because in our redundancy analysis the forward-selected predictor reflecting the buffered state was a ground-cover variable (% cover of lichens and mosses), and not canopy cover or tree density. Forest buffers can reduce local impacts on water quality in urban catchments through different mechanisms: the spatial ‘footprint’ of a buffer can help avert inputs associated with road crossings and leaky sewer pipes [90,91,92], riparian vegetation can remove nitrogen by enhancing denitrification [16,93], and forest soils have the potential to act as sinks for contaminants such as chloride, thus moderating impacts of salts used for road deicing at higher latitudes [94,95].
In contrast to our results, Hlúbiková et al. [42] found that riparian buffers, irrespective of cover and intactness, were unable to reverse impacts of urbanization and nutrient enrichment on diatom assemblages. We tested why responses might be context dependent, and found some evidence for upstream impacts weakening the ability of the buffer to positively influence diatom communities at the local scale (Figure 6). We also observed limits to the benefits of forested riparian buffers, where changes in β-diversity were matched by neutral α-diversity responses (Figure 5). Interestingly, Hlúbiková et al. [42] observed considerable temporal variation in their diatom-based indices, suggesting that highly resolved time-series data might be necessary to detect benefits of riparian buffers in catchments characterized by hydrologically variability. We sampled all our sites within a narrow time frame during a hydrologically stable period, which may help to explain some of the discrepancy between our results and those reported by Hlúbiková et al. [42].
We found significant associations of key diatom indicator taxa with different site types. Although there are deficiencies in our knowledge regarding their functional traits, several clues point to their relevance in our study. At unbuffered sites, ISA selected Encyonema minutum, a species associated with oligo- to mesotrophic waters with medium conductivity [61], but not particularly sensitive according to the diatom-based IPS index [34]. Melosira varians is more common in meso- to eutrophic waters with higher conductivities including weakly-brackish waterbodies [61], lending credence to additional concerns about the impacts of localized peaks in chloride concentrations due to road salting [96]. The partial redundancy analysis revealed strong differences in abundances of A. minutissimum (III, mean width > 2.8 µm), Melosira varians, and Navicula gregaria, suggesting that conditions (i.e., eutrophication) associated with organic pollution, nutrient enrichment, and light availability were more prevalent at unbuffered sites. We also detected indicator taxa at sites with a riparian forest buffer. Gomphonema spp. is a complex of at least four unidentified species, so it is not possible to unravel its ecological preferences past the genus level. Humidophila perpusilla favors aerial and low-light habitats, such as intermittently wetted rocks in ravines [61], suggesting that forested buffers are important for providing its niche requirements in an urban context. The partial redundancy analysis suggested that the more sensitive A. minutissimum (II, mean width 2.2–2.8 µm) and Reimeria sinuata were common at buffered sites. Overall, these microalgal changes support our contention that riparian buffers can help mitigate impacts associated with urbanization.

5. Conclusions

Our case study focused on benthic diatoms, an important organismal group in stream–riparian networks, and we were able to demonstrate tangible benefits of forested riparian buffers in the urbanized Oslo basin. Future research should map structural changes in diatom communities to functional attributes including biological and biochemical traits, such as fatty acid profiles. Studies have indicated that common diatoms in our study, such as Achnanthidium minutissimum, may be important sources of essential long-chain fatty acids that help fuel aquatic-terrestrial food webs [97,98,99]. Advancing our functional understanding of diatom communities needs to work in concert with rapidly developing metabarcoding approaches [100]. These new tools can distinguish diatom species grouped together by traditional morphological-based taxonomy, thus making substantial contributions to biomonitoring [101,102]. For instance, molecular approaches could help resolve cryptic diversity within A. minutissimum, Cocconeis placentula, and Amphora pediculus that were abundant at our study sites [103,104,105], potentially revealing hidden responses to riparian buffers. Despite these future challenges, our present study has contributed to the development of a general framework for implementing forested riparian buffers in human-impacted landscapes by demonstrating how the “urban stream syndrome” can be mitigated by riparian forest patches. These modest improvements may grow in magnitude when added to the broad portfolio of benefits that riparian forest buffers can provide in modified landscapes [14].

Supplementary Materials

The following are available online at https://www.mdpi.com/2073-4441/12/10/2799/s1; Figure S1: Standard diatom indices responded to catchment urbanization (PC1): (a) the Trophic Diatom Index (TDI/100) [logit-transformed], % Pollution Tolerant valves (%PT) [logit-transformed], and (c) the ACidity Index of Diatoms (ACID) all indicating changes in environmental quality with increasing urban land cover and changes in water chemistry. Site types are indicated by different colors; dashed lines indicate site pairs. Table S1: The list of sampling sites with additional information on their location and diatom sampling date, and data on water quality. FOR = pristine forested reference site (2 FOR sites in case of Frognerelva as FOR1 and FOR2); UBF = unbuffered pair site: FBF = forested buffered pair site: LON = downstream longitudinal matrix site (2 LON sites in case of Frognerelva as LON1 and LON2). Nitrate = nitrite- and nitrate-nitrogen (i.e., oxidized nitrogen, NO2_N + NO3_N); TP = total phosphorus; Table S2: Candidate predictors used in constrained ordination models. OB = Oslo basin; PS = Paired sites; Table S3: The list of sampling sites with data on selected diatom-based metrics. TDI/100 = Trophic Diatom Index, %PT = % Pollution Tolerant valves, ACID = ACidity Index of Diatoms, FOR = pristine forested reference site (2 FOR sites in case of Frognerelva as FOR1 and FOR2), UBF = unbuffered pair site, FBF = forested buffered pair site, LON = downstream longitudinal matrix site (2 LON sites in case of Frognerelva as LON1 and LON2); Table S4: Variables and loadings for Principal Components Analysis (PCA) decomposing catchment land use and water quality variables into a single index of urbanization for all 36 sites in the Oslo basin. PC1 explained 57.0% of the variation among sites, whereas PC2 explained 11.8%; Table S5: Species list of taxa that exceed 0.2% relative abundance in the entire study, with mean % abundances at the different site types (FBF = forested buffered pair site; UBF = unbuffered pair site; FOR = pristine forested reference site; LON = downstream longitudinal matrix site). The table is completed by diatom species scores from the partial redundancy analysis model (pRDA) conditioning out confounding influences of spatial location, catchment land uses, instream habitat, and water quality to reveal the true association of diatom community composition with riparian attributes (Figure 4, Main Text) for site pairs. The scores on RDA1 explained 37% of the variation among sites. The biplot value for “% Shrubs and small trees <5cm DBH” on RDA1 was −0.44, and this riparian attribute was more associated with unbuffered sites. In contrast, the biplot value for “% Lichens & mosses” on RDA1 was 0.30, and this riparian attribute was associated with forest buffer sites. Diatom taxa mentioned in the Main Text are highlighted in bold; Table S6: Mean values for riparian and stream variables the different site types (FBF = forested buffered pair site; UBF = unbuffered pair site; FOR = pristine forested reference site; LON = downstream longitudinal matrix site). Results from mixed models testing the difference between site pairs (UBF, FBF) are also shown.

Author Contributions

Conceptualization, F.J.B., B.G.M., B.K. and N.F.; methodology, all authors; validation, P.T.M., M.K. and B.K.; formal analysis, F.J.B., with contributions from M.K. and P.T.M.; investigation, P.T.M., M.K.; resources, P.T.M.; data curation, P.T.M., B.K., B.G.M. and F.J.B.; writing—original draft preparation, P.T.M., M.K, and F.J.B.; writing—review and editing, F.J.B., with contributions from all authors; visualization, F.J.B., B.K. and P.T.M.; supervision, M.K., B.K. and N.F.; project administration, P.T.M., B.K., B.G.M. and N.F.; funding acquisition, B.G.M. and N.F.; All authors have read and agreed to the published version of the manuscript.

Funding

This research was conducted as part of the CROSSLINK project, titled “Understanding cross-habitat linkages between blue and green infrastructure to optimize management of biodiversity, ecosystem services and multiple human uses”. The CROSSLINK project was funded through the 2015–2016 BiodivERsA COFUND call for research proposals, with national funders: the Swedish Research Council for Sustainable Development (FORMAS, project 2016-01945) and the Swedish Environmental Protection Agency; The Research Council of Norway (NFR, project 264499); The Research Foundation of Flanders (FWO, project G0H6516N), Belgium; the Romanian National Authority for Scientific Research and Innovation, CCCDI—UEFISCDI, project BiodivERsA3-2015-49-CROSSLINK, within PNCDI III; and the Federal Ministry of Education and Research (BMBF, Germany, project FKZ: 01LC1621A).

Acknowledgments

We would like to thank Eivind Ekholt Andersen, Benoit Demars, Markus Lindholm, Teis Friberg, and Birk Fogde Ørnskov for their help in the field, and the wider CROSSLINK consortium for conceptualization, funding acquisition, and feedback on the manuscript. We would also like to thank the four anonymous reviewers for their comments that improved the manuscript.

Conflicts of Interest

The authors declare no conflict of interest. The funders had no role in the design of the study; in the collection, analyses, or interpretation of data; in the writing of the manuscript, or in the decision to publish the results.

Appendix A–Additional Site Information

We included Akerselva in our study, because it is an iconic Oslo river flowing through the city center. Akerselva was exceptional from our other sites in that the river is wider (e.g., 7-23 m), but still wadeable with rocky substrate. It starts from Maridalsvannet (Lake Maridal) that serves as the main municipal drinking water source for Oslo. In the past, Akerselva was severely impacted by industrial activities taking place alongside the river. More recently, the urban area surrounding Akerselva has gentrified, with riparian zones converted into parks and industrial buildings renovated and preserved for cultural heritage [106]. Consequently, the water quality of Akerselva has improved (Table S1, Supplementary Materials), in contrast to the Alna river which is highly modified, draining an active industrial area resulting in poor water quality [43], and other streams flowing through Oslo urban areas. Inputs of untreated sewage and/or industrial pollution of undetermined origin and composition were occasionally observed at site pairs Alna (#6,7), Gaustadbekken (#18,19), and Hoffselva-Makrelbekken (#28,29).

Appendix B–Additional Results Complementing the Main Text

The full Paired sites RDA model (PSM1) involved five different groups of predictors (Spatial, Land use, Riparian habitat, Instream habitat, and Water quality; Table S1) explaining 59% of the variation in the diatom community structure (F13,6 = 3.12, p < 0.001). The independent contribution of these predictors revealed significant influences of Spatial location (F5,6 = 2.04, p < 0.05, R2adj = 19%), catchment Land use (F2,6 = 3.35, p < 0.01, R2adj = 24%), Riparian habitat (F2,6 = 2.54, p < 0.05, R2adj = 16%), and Water quality (F1,6 = 2.73, p < 0.05, R2adj = 10%), whereas instream habitat (F3,6 = 1.71, p = 0.058, R2adj = 10%) was statistically indistinguishable from the other groups.

References

  1. Vörösmarty, C.J.; McIntyre, P.B.; Gessner, M.O.; Dudgeon, D.; Prusevich, A.; Green, P.; Glidden, S.; Bunn, S.E.; Sullivan, C.; Liermann, C.R.; et al. Global threats to human water security and river biodiversity. Nature 2010, 467, 555–561. [Google Scholar] [CrossRef] [PubMed]
  2. Grimm, N.; Faeth, S.H.; Golubiewski, N.E.; Redman, C.L.; Wu, J.; Bai, X.; Briggs, J.M. Global Change and the Ecology of Cities. Science 2008, 319, 756–760. [Google Scholar] [CrossRef] [PubMed] [Green Version]
  3. Walsh, C.J.; Roy, A.H.; Feminella, J.W.; Cottingham, P.D.; Groffman, P.M.; Morgan, R.P. The urban stream syndrome: Current knowledge and the search for a cure. J. North Am. Benthol. Soc. 2005, 24, 706–723. [Google Scholar] [CrossRef]
  4. Wiederkehr, F.; Wilkinson, C.L.; Zeng, Y.; Yeo, D.C.; Ewers, R.M.; O’Gorman, E.J. Urbanisation affects ecosystem functioning more than structure in tropical streams. Biol. Conserv. 2020, 249, 108634. [Google Scholar] [CrossRef]
  5. King, R.S.; Baker, M.E.; Kazyak, P.F.; E Weller, D. How novel is too novel? Stream community thresholds at exceptionally low levels of catchment urbanization. Ecol. Appl. 2011, 21, 1659–1678. [Google Scholar] [CrossRef]
  6. Burdon, F.J.; Bai, Y.; Reyes, M.; Tamminen, M.; Staudacher, P.; Mangold, S.; Singer, H.; Räsänen, K.; Joss, A.; Tiegs, S.D.; et al. Stream microbial communities and ecosystem functioning show complex responses to multiple stressors in wastewater. Glob. Chang. Biol. 2020. [Google Scholar] [CrossRef] [PubMed]
  7. Allan, J.D. Landscapes and Riverscapes: The Influence of Land Use on Stream Ecosystems. Annu. Rev. Ecol. Evol. Syst. 2004, 35, 257–284. [Google Scholar] [CrossRef] [Green Version]
  8. Taylor, S.L.; Roberts, S.C.; Walsh, C.J.; Hatt, B.E. Catchment urbanisation and increased benthic algal biomass in streams: Linking mechanisms to management. Freshw. Biol. 2004, 49, 835–851. [Google Scholar] [CrossRef]
  9. Burdon, F.; Munz, N.; Reyes, M.; Focks, A.; Joss, A.; Räsänen, K.; Altermatt, F.; Eggen, R.; Stamm, C. Agriculture versus wastewater pollution as drivers of macroinvertebrate community structure in streams. Sci. Total. Environ. 2018, 659, 1256–1265. [Google Scholar] [CrossRef]
  10. Tonkin, J.D.; Stoll, S.; Jähnig, S.C.; Haase, P. Anthropogenic land-use stress alters community concordance at the river-riparian interface. Ecol. Indic. 2016, 65, 133–141. [Google Scholar] [CrossRef]
  11. Walker, C.E.; Pan, Y. Using Diatom Assemblages to Assess Urban Stream Conditions. Hydrobiology 2006, 561, 179–189. [Google Scholar] [CrossRef]
  12. Sudduth, E.; Hassett, B.A.; Cada, P.; Bernhardt, E.S. Testing the field of dreams hypothesis: Functional responses to urbanization and restoration in stream ecosystems. Ecol. Appl. 2011, 21, 1972–1988. [Google Scholar] [CrossRef] [PubMed]
  13. Coelho, D.; Hughes, S.J.; Varandas, S.; Cortes, R.M.V. Conservation benefits of riparian buffers in urban areas: The case of the Rio Corgo (north Portugal). Fundam. Appl. Limnol. Archiv Hydrobiol. 2014, 185, 55–70. [Google Scholar] [CrossRef]
  14. Burdon, F.J.; Ramberg, E.; Sargac, J.; Forio, M.A.E.; De Saeyer, N.; Mutinová, P.T.; Moe, T.F.; Pavelescu, M.O.; Dinu, V.; Cazacu, C.; et al. Assessing the Benefits of Forested Riparian Zones: A Qualitative Index of Riparian Integrity Is Positively Associated with Ecological Status in European Streams. Water 2020, 12, 1178. [Google Scholar] [CrossRef] [Green Version]
  15. Wenger, S. A Review of the Scientific Literature on Riparian Buffer Width, Extent and Vegetation; Office of Public Service & Outreach Institute of Ecology: Athens, Greece, 1999. [Google Scholar]
  16. Sabater, S.; Butturini, A.; Clement, J.-C.; Burt, T.; Dowrick, D.; Hefting, M.M.; Matre, V.; Pinay, G.; Postolache, C.; Rzepecki, M.; et al. Nitrogen Removal by Riparian Buffers along a European Climatic Gradient: Patterns and Factors of Variation. Ecosystems 2003, 6, 0020–0030. [Google Scholar] [CrossRef]
  17. Burdon, F.J.; McIntosh, A.R.; Harding, J.S. Mechanisms of trophic niche compression: Evidence from landscape disturbance. J. Anim. Ecol. 2019, 89, 730–744. [Google Scholar] [CrossRef]
  18. Pasquino, V.; Saulino, L.; Pelosi, A.; Allevato, E.; Rita, A.; Todaro, L.; Saracino, A.; Chirico, G. Hydrodynamic behaviour of European black poplar (Populus nigra L.) under coppice management along Mediterranean river ecosystems. River Res. Appl. 2018, 34, 586–594. [Google Scholar] [CrossRef]
  19. De Andrade, A.C.; Medeiros, W.; Adams, M. Urban forest fragments as unexpected sanctuaries for the rare endemic ghost butterfly from the Atlantic forest. Ecol. Evol. 2019, 9, 10767–10776. [Google Scholar] [CrossRef]
  20. Ives, C.D.; Lentini, P.E.; Threlfall, C.G.; Ikin, K.; Shanahan, D.F.; Garrard, G.E.; Bekessy, S.A.; Fuller, R.A.; Mumaw, L.M.; Rayner, L.; et al. Cities are hotspots for threatened species. Glob. Ecol. Biogeogr. 2015, 25, 117–126. [Google Scholar] [CrossRef]
  21. Kleerekoper, L.; Esch, M.P.-V.; Salcedo, T.B. How to make a city climate-proof, addressing the urban heat island effect. Resour. Conserv. Recycl. 2012, 64, 30–38. [Google Scholar] [CrossRef]
  22. Carter, J.; Cavan, G.; Connelly, A.; Guy, S.C.; Handley, J.; Kaźmierczak, A. Climate change and the city: Building capacity for urban adaptation. Prog. Plan. 2015, 95, 1–66. [Google Scholar] [CrossRef]
  23. Kenwick, R.A.; Shammin, R.; Sullivan, W.C. Preferences for riparian buffers. Landsc. Urban Plan. 2009, 91, 88–96. [Google Scholar] [CrossRef]
  24. Bernhardt, E.S.; Palmer, M.A. Restoring streams in an urbanizing world. Freshw. Biol. 2007, 52, 738–751. [Google Scholar] [CrossRef]
  25. Walsh, C.J.; Waller, K.A.; Gehling, J.; Mac Nally, R. Riverine invertebrate assemblages are degraded more by catchment urbanisation than by riparian deforestation. Freshw. Biol. 2007, 52, 574–587. [Google Scholar] [CrossRef]
  26. Bernhardt, E.S.; Palmer, M.A. River restoration: The fuzzy logic of repairing reaches to reverse catchment scale degradation. Ecol. Appl. 2011, 21, 1926–1931. [Google Scholar] [CrossRef] [PubMed]
  27. Aberle, J.; Järvelä, J. Flow resistance of emergent rigid and flexible floodplain vegetation. J. Hydraul. Res. 2013, 51, 33–45. [Google Scholar] [CrossRef]
  28. Lowe, R.; Stoermer, E.F.; Smol, J.P. The Diatoms: Applications for the Environmental and Earth Sciences. J. North Am. Benthol. Soc. 1999, 18, 567. [Google Scholar] [CrossRef]
  29. Kelly, M.; King, L.; Chatháin, B.N. The conceptual basis of ecological-status assessments using diatoms. Biol. Environ. Proc. R. Ir. Acad. 2009, 109, 175–189. [Google Scholar] [CrossRef]
  30. Kahlert, M.; Kelly, M.; Albert, R.-L.; Almeida, S.; Bešta, T.; Blanco, S.; Coste, M.; Denys, L.; Ector, L.; Fránková, M.; et al. Identification versus counting protocols as sources of uncertainty in diatom-based ecological status assessments. Hydrobiology 2012, 695, 109–124. [Google Scholar] [CrossRef]
  31. Kelly, M.G.; Whitton, B.A. The Trophic Diatom Index: A new index for monitoring eutrophication in rivers. Environ. Biol. Fishes 1995, 7, 433–444. [Google Scholar] [CrossRef]
  32. Andrén, C.; Jarlman, A. Benthic diatoms as indicators of acidity in streams. Fundam. Appl. Limnol. Archiv Hydrobiol. 2008, 173, 237–253. [Google Scholar] [CrossRef]
  33. Sonneman, J.A.; Walsh, C.J.; Breen, P.F.; Sharpe, A.K. Effects of urbanization on streams of the Melbourne region, Victoria, Australia. II. Benthic diatom communities. Freshw. Biol. 2001, 46, 553–565. [Google Scholar] [CrossRef]
  34. CEMAGREF. Etude des Méthodes Biologiques D’appréciation Quantitative de la Qualité des Eaux; Bassin Rhône-Mediterrannée-Corse, E.R.Q., Lyon, A.F.G.S., Eds.; EMAGREF/CSIRO: Lyon, France, 1982. [Google Scholar]
  35. Coste, M.; Boutry, S.; Tison, J.; Delmas, F. Improvements of the Biological Diatom Index (BDI): Description and efficiency of the new version (BDI-2006). Ecol. Indic. 2009, 9, 621–650. [Google Scholar] [CrossRef]
  36. Teittinen, A.; Taka, M.; Ruth, O.; Soininen, J. Variation in stream diatom communities in relation to water quality and catchment variables in a boreal, urbanized region. Sci. Total. Environ. 2015, 530, 279–289. [Google Scholar] [CrossRef] [PubMed]
  37. Newall, P.; Walsh, C.J. Response of epilithic diatom assemblages to urbanization influences. Hydrobiology 2005, 532, 53–67. [Google Scholar] [CrossRef]
  38. Hill, B.H.; Stevenson, R.J.; Pan, Y.; Herlihy, A.T.; Kaufmann, P.R.; Johnson, C.B. Comparison of correlations between environmental characteristics and stream diatom assemblages characterized at genus and species levels. J. North Am. Benthol. Soc. 2001, 20, 299–310. [Google Scholar] [CrossRef] [Green Version]
  39. Johnson, R.K.; Almlöf, K. Adapting boreal streams to climate change: Effects of riparian vegetation on water temperature and biological assemblages. Freshw. Sci. 2016, 35, 984–997. [Google Scholar] [CrossRef]
  40. Kelly, M. Use of the Trophic Diatom Index to monitor eutrophication in rivers. Water Res. 1998, 32, 236–242. [Google Scholar] [CrossRef]
  41. Chen, X.; Zhou, W.; Pickett, S.T.; Li, W.; Han, L.; Ren, Y. Diatoms are better indicators of urban stream conditions: A case study in Beijing, China. Ecol. Indic. 2016, 60, 265–274. [Google Scholar] [CrossRef]
  42. Hlúbiková, D.; Novais, M.H.; Dohet, A.; Hoffmann, L.; Ector, L. Effect of riparian vegetation on diatom assemblages in headwater streams under different land uses. Sci. Total. Environ. 2014, 475, 234–247. [Google Scholar] [CrossRef]
  43. Allan, I.; Jenssen, M.T.S.; Braaten, H.F.V. Priority Substances and Emerging Contaminants in Selected Norwegian Rivers—The River Monitoring Programme 2018; Norwegian Institute for Water Research: Oslo, Norway, 2019. [Google Scholar]
  44. European Commission. Oslo—European Green Capital 2019; Publications Office of the European Union: Luxembourg, 2018; Available online: https://ec.europa.eu/environment/europeangreencapital/wp-content/uploads/2019/Oslo%20Brochure_EGCA%202019.pdf (accessed on 9 October 2020).
  45. Kerouel, R.; Aminot, A. Fluorometric determination of ammonia in sea and estuarine waters by direct segmented flow analysis. Mar. Chem. 1997, 57, 265–275. [Google Scholar] [CrossRef]
  46. Wentworth, C.K. A scale of grade and class terms for clastic sediments. J. Geol. 1922, 30, 377–392. [Google Scholar] [CrossRef]
  47. Wolman, M.G. A method of sampling coarse river-bed material. Trans. Am. Geophys. Union 1954, 35, 951–956. [Google Scholar] [CrossRef]
  48. Harding, J.S.; Clapcott, J.; Quinn, J.; Hayes, J.; Joy, M.; Storey, R.; Greig, H.; Hay, J.; James, T.; Beech, M.; et al. Stream Habitat Assessment Protocols for Wadeable Rivers and Streams of New Zealand; School of Biological Sciences: Christchurch, New Zealand, 2009. [Google Scholar]
  49. CEN, NS-EN 13946:2014 Water Quality—Guidance for the Routine Sampling and Preparation of Benthic Diatoms from Rivers and Lakes. 2014. Available online: https://www.standard.no/en/webshop/ProductCatalog/ProductPresentation/?ProductID=698749 (accessed on 9 October 2020).
  50. CEN, NS-EN 14407:2014 Water Quality—Guidance for the Identification and Enumeration of Benthic Diatom Samples from Rivers and Lakes. 2014. Available online: https://www.standard.no/en/webshop/ProductCatalog/ProductPresentation/?ProductID=698752 (accessed on 9 October 2020).
  51. Krammer, K.; Lange-Bertalot, H. Bacillariophyceae 1. Teil: Naviculaceae. In Süßwasserflora von Mitteleuropa; Ettl, H., Gerloff, J., Heynig, H., Mollenhauer, D., Eds.; Gustav Fischer Verlag: Stuttgart, Germany, 1986. [Google Scholar]
  52. Krammer, K.; Lange-Bertalot, H. Bacillariophyceae 2. Teil: Bacillariaceae, Epithemiaceae, Surirellaceae. In Süßwasserflora von Mitteleuropa; Ettl, H., Gerloff, J., Heynig, H., Mollenhauer, D., Eds.; Gustav Fischer Verlag: Stuttgart, Germany, 1988. [Google Scholar]
  53. Krammer, K.; Lange-Bertalot, H. Bacillariophyceae 3. Teil: Centrales, Fragilariaceae, Eunotiaceae. In Süßwasserflora von Mitteleuropa; Ettl, H., Gerloff, J., Heynig, H., Mollenhauer, D., Eds.; Gustav Fischer Verlag: Stuttgart, Germany, 1991. [Google Scholar]
  54. Krammer, K.; Lange-Bertalot, H. Bacillariophyceae 4. Teil: Achnanthaceae, Kritische Ergänzungen zu Navicula (Lineolatae) und Gomphonema. In Süßwasserflora von Mitteleuropa; Ettl, H., Gerloff, J., Heynig, H., Mollenhauer, D., Eds.; Gustav Fischer Verlag: Stuttgart, Germany, 1991. [Google Scholar]
  55. Krammer, K. Diatoms of Europe, Volume 1: The genus Pinnularia. In Diatoms of the European Inland Waters and Comparable Habitats; Lange-Bertalot, H., Ed.; Gantner Verlag: Ruggell, Liechtenstein, 2000. [Google Scholar]
  56. Krammer, K. Diatoms of Europe, Volume 4: Cymbopleura, Delicata, Navicymbula, Gomphocymbellopsis, Afrocymbella. In Diatoms of the European Inland Waters and Comparable Habitats; Lange-Bertalot, H., Ed.; Gantner Verlag: Ruggell, Liechtenstein, 2003. [Google Scholar]
  57. Krammer, K. Diatoms of Europe, Volume 1: The genus Cymbella. In Diatoms of the European Inland Waters and Comparable Habitats; Lange-Bertalot, H., Ed.; Gantner Verlag: Ruggell, Liechtenstein, 2002. [Google Scholar]
  58. Lange-Bertalot, H.; Metzeltin, D. Oligotrophie-Indikatoren: 800 Taxa repräsentativ für drei diverse Seen-Typen, kalkreich-oligodystroph-schwach gepuffertes Weichwasser. In Iconogr. Diatomol; Lange-Bertalot, H., Ed.; Koeltz Scientific Books, Schmitten: Oberreifenberg, Germany, 1996. [Google Scholar]
  59. Lange-Bertalot, H. Diatoms of Europe, Volume 2: Navicula sensu stricto, 10 genera separated from Navicula sensu lato, Frustulia. In Diatoms of the European Inland Waters and Comparable Habitats; Lange-Bertalot, H., Ed.; Ganthner Verlag: Ruggell, Liechtenstein, 2011. [Google Scholar]
  60. Lange-Bertalot, H.; Bak, M.; Witkowski, A.; Tagliaventi, N. Diatoms of Europe, Volume 6: Eunotia and some related genera. In Diatoms of the European Inland Water and Comparable Habitats; Krammer, K., Ed.; Ganthner Verlag: Ruggell, Liechtenstein, 2011. [Google Scholar]
  61. Lange-Bertalot, H.; Hofmann, G.; Werum, M.; Cantonati, M. Freshwater Benthic Diatoms of Central Europe: Over 800 Common Species Used in Ecological Assessment. In Koeltz Botanical Books; Cantonati, M., Kelly, M.G., Lange–Bertalot, H., Eds.; Schmitten: Oberreifenberg, Germany, 2017. [Google Scholar]
  62. Lecointe, C.; Coste, M.; Prygiel, J. “Omnidia”: Software for taxonomy, calculation of diatom indices and inventories management. Twelfth Int. Diatom Symp. 1993, 269, 509–513. [Google Scholar] [CrossRef]
  63. Burdon, F.J.; Reyes, M.; Alder, A.C.; Joss, A.; Ort, C.; Räsänen, K.; Jokela, J.; Eggen, R.I.; Stamm, C. Environmental context and magnitude of disturbance influence trait-mediated community responses to wastewater in streams. Ecol. Evol. 2016, 6, 3923–3939. [Google Scholar] [CrossRef] [PubMed] [Green Version]
  64. Burdon, F.J.; McIntosh, A.; Harding, J.S. Habitat loss drives threshold response of benthic invertebrate communities to deposited sediment in agricultural streams. Ecol. Appl. 2013, 23, 1036–1047. [Google Scholar] [CrossRef]
  65. Bray, J.; Kilroy, C.; Gerbeaux, P.; Burdon, F.J.; Harding, J.S. Ecological processes mediate the effects of the invasive bloom-forming diatom Didymosphenia geminata on stream algal and invertebrate assemblages. Hydrobiology 2019, 847, 1–14. [Google Scholar] [CrossRef]
  66. Legendre, P.; Gallagher, E.D. Ecologically meaningful transformations for ordination of species data. Oecologia 2001, 129, 271–280. [Google Scholar] [CrossRef]
  67. Oksanen, J.; Blanchet, F.G.; Friendly, M.; Kindt, R.; Legendre, P.; McGlinn, D.; Minchin, P.R.; O’Hara, R.B.; Simpson, G.L.; Solymos, P.; et al. Vegan: Community Ecology Package; R Foundation for Statistical Computing: Vienna, Austria, 2009. [Google Scholar]
  68. Blanchet, F.G.; Legendre, P.; Borcard, D. Forward selection of explanatory variables. Ecology 2008, 89, 2623–2632. [Google Scholar] [CrossRef]
  69. Dray, S.; Legendre, P.; Blanchet, G. Packfor: Forward Selection with Permutation (Canoco p.46). R Package Version 0.0-8/r136. Available online: https://R-Forge.R-project.org/projects/sedar (accessed on 9 October 2020).
  70. Quinn, G.P.; Keough, M.J. Experimental Design and Data Analysis for Biologists; Cambridge University Press (CUP): Cambridge, UK, 2002; p. 570. [Google Scholar]
  71. Borcard, D.; Gillet, F.; Legendre, P. Numerical Ecology with R; Springer Science and Business Media LLC: Berlin/Heidelberg, Germany, 2011; p. 306. [Google Scholar]
  72. Borcard, D.; Legendre, P. All-scale spatial analysis of ecological data by means of principal coordinates of neighbour matrices. Ecol. Model. 2002, 153, 51–68. [Google Scholar] [CrossRef]
  73. Borcard, D.; Legendre, P.; Avois-Jacquet, C.; Tuomisto, H. Dissecting the spatial structure of ecological data at multiple scales. Ecology 2004, 85, 1826–1832. [Google Scholar] [CrossRef] [Green Version]
  74. Dray, S.; Legendre, P.; Peres-Neto, P.R. Spatial modelling: A comprehensive framework for principal coordinate analysis of neighbour matrices (PCNM). Ecol. Model. 2006, 196, 483–493. [Google Scholar] [CrossRef]
  75. Peres-Neto, P.R.; Legendre, P.; Dray, S.; Borcard, D. Variation partitioning of species data matrices: Estimation and comparison of fractions. Ecology 2006, 87, 261425. [Google Scholar] [CrossRef]
  76. De Cáceres, M.; Legendre, P. Associations between species and groups of sites: Indices and statistical inference. Ecology 2009, 90, 3566–3574. [Google Scholar] [CrossRef] [PubMed]
  77. Wood, S.N. Generalized Additive Models; Informa UK Limited: London, UK, 2017; p. 496. [Google Scholar]
  78. Bates, D.M.; Machler, M.B.; Bolker, B.M.; Walker, S. Fitting linear mixed-effects models using lme4. J. Stat. Softw. 2015, 67, 1–48. [Google Scholar] [CrossRef]
  79. Pustejovsky, J.E.; Swan, D.M. SingleCaseES: A Calculator for Single-Case Effect Sizes. R Package Version 0.4.3. Available online: https://CRAN.R-project.org/package=SingleCaseES. (accessed on 9 October 2020).
  80. Sundberg, I.; Herlitz, E.; Jarlman, A.; Kahlert, M. Påväxt i sjöar och vattendrag—kiselalgsanalys. In Havs- och Vattenmyndigheten; Handledning för miljöövervakning: Göteborg, Sweden, 2016; p. 24, Version 3:2: 2016-01-20. [Google Scholar]
  81. Pan, Y.; Herlihy, A.T.; Kaufmann, P.; Wigington, J.; Van Sickle, J.; Moser, T. Linkages among land-use, water quality, physical habitat conditions and lotic diatom assemblages: A multi-spatial scale assessment. Hydrobiology 2004, 515, 59–73. [Google Scholar] [CrossRef]
  82. Dodds, W.K.; Clements, W.H.; Gido, K.; Hilderbrand, R.H.; King, R.S. Thresholds, breakpoints, and nonlinearity in freshwaters as related to management. J. North Am. Benthol. Soc. 2010, 29, 988–997. [Google Scholar] [CrossRef]
  83. Capon, S.J.; Lynch, A.J.J.; Bond, N.R.; Chessman, B.C.; Davis, J.; Davidson, N.; Finlayson, C.M.; Gell, P.; Hohnberg, D.; Humphrey, C.; et al. Regime shifts, thresholds and multiple stable states in freshwater ecosystems; a critical appraisal of the evidence. Sci. Total. Environ. 2015, 534, 122–130. [Google Scholar] [CrossRef] [Green Version]
  84. Taylor, J.M.; King, R.S.; Pease, A.A.; Winemiller, K.O. Nonlinear response of stream ecosystem structure to low-level phosphorus enrichment. Freshw. Biol. 2014, 59, 969–984. [Google Scholar] [CrossRef]
  85. Tang, T.; Tang, T.; Tan, L.; Gu, Y.; Jiang, W.; Cai, Q.-H. Identifying community thresholds for lotic benthic diatoms in response to human disturbance. Sci. Rep. 2017, 7, 4134. [Google Scholar] [CrossRef] [Green Version]
  86. Tibby, J.; Richards, J.; Tyler, J.J.; Barr, C.; Fluin, J.; Goonan, P. Diatom–water quality thresholds in South Australian streams indicate a need for more stringent water quality guidelines. Mar. Freshw. Res. 2019, 71, 942–952. [Google Scholar] [CrossRef]
  87. Finkel, Z.V.; Beardall, J.; Flynn, K.J.; Quigg, A.; Rees, T.A.V.; Raven, J.A. Phytoplankton in a changing world: Cell size and elemental stoichiometry. J. Plankton Res. 2009, 32, 119–137. [Google Scholar] [CrossRef] [Green Version]
  88. Walsh, C.J.; Sharpe, A.K.; Breen, P.F.; Sonneman, J.A. Effects of urbanization on streams of the Melbourne region, Victoria, Australia. I. Benthic macroinvertebrate communities. Freshw. Biol. 2001, 46, 535551. [Google Scholar] [CrossRef]
  89. Heino, J. The importance of metacommunity ecology for environmental assessment research in the freshwater realm. Biol. Rev. 2012, 88, 166–178. [Google Scholar] [CrossRef] [PubMed]
  90. McBride, M.; Booth, D.B. Urban Impacts On Physical Stream Condition: Effects Of Spatial Scale, Connectivity, And Longitudinal Trends. Jawra J. Am. Water Resour. Assoc. 2005, 41, 565–580. [Google Scholar] [CrossRef]
  91. Kaushal, S.S.; Belt, K.T. The urban watershed continuum: Evolving spatial and temporal dimensions. Urban Ecosyst. 2012, 15, 409–435. [Google Scholar] [CrossRef]
  92. Wenger, S.J.; Roy, A.H.; Jackson, C.R.; Bernhardt, E.S.; Carter, T.L.; Filoso, S.; Gibson, C.A.; Hession, W.C.; Kaushal, S.S.; Martí, E.; et al. Twenty-six key research questions in urban stream ecology: An assessment of the state of the science. J. North Am. Benthol. Soc. 2009, 28, 1080–1098. [Google Scholar] [CrossRef] [Green Version]
  93. Riis, T.; Kelly-Quinn, M.; Aguiar, F.C.; Manolaki, P.; Bruno, D.; Bejarano, M.D.; Clerici, N.; Fernandes, M.R.; Franco, J.C.; Pettit, N.; et al. Global overview of ecosystem services provided by riparian vegetation. BioScience 2020, 70, 501–514. [Google Scholar] [CrossRef]
  94. Lovett, G.M.; Likens, G.E.; Buso, D.C.; Driscoll, C.T.; Bailey, S. The biogeochemistry of chlorine at Hubbard Brook, New Hampshire, USA. Biogeochemistry 2005, 72, 191–232. [Google Scholar] [CrossRef]
  95. Kaushal, S.S.; Groffman, P.M.; Likens, G.E.; Belt, K.T.; Stack, W.P.; Kelly, V.R.; Band, L.E.; Fisher, G.T. Increased salinization of fresh water in the northeastern United States. Proc. Natl. Acad. Sci. USA 2005, 102, 13517–13520. [Google Scholar] [CrossRef] [Green Version]
  96. Porter-Goff, E.R.; Frost, P.C.; Xenopoulos, M.A. Changes in riverine benthic diatom community structure along a chloride gradient. Ecol. Indic. 2013, 32, 97–106. [Google Scholar] [CrossRef]
  97. Mitani, E.; Fumiyo, N.; Izumi, M.; Ichi, I.; Kawabata, A.; Kawachi, M.; Kato, M. Fatty acid composition profiles of 235 strains of three microalgal divisions within the NIES Microbial Culture Collection. Microb. Resour. Syst. 2017, 33, 1929. [Google Scholar]
  98. Twining, C.W.; Brenna, J.T.; Hairston, N.G.; Flecker, A.S. Highly unsaturated fatty acids in nature: What we know and what we need to learn. Oikos 2015, 125, 749–760. [Google Scholar] [CrossRef]
  99. Chari, L.; Richoux, N.; Moyo, S.; Villet, M. Dietary fatty acids of spiders reveal spatial and temporal variations in aquatic-terrestrial linkages. Food Webs 2020, 24, e00152. [Google Scholar] [CrossRef]
  100. Keck, F.; Vasselon, V.; Tapolczai, K.; Rimet, F.; Bouchez, A. Freshwater biomonitoring in the Information Age. Front. Ecol. Environ. 2017, 15, 266–274. [Google Scholar] [CrossRef]
  101. Zimmermann, J.; Glöckner, G.; Jahn, R.; Enke, N.; Gemeinholzer, B. Metabarcoding vs. morphological identification to assess diatom diversity in environmental studies. Mol. Ecol. Resour. 2014, 15, 526–542. [Google Scholar] [CrossRef] [PubMed]
  102. Hering, D.; Borja, A.; Jones, J.; Pont, D.; Boets, P.; Bouchez, A.; Bruce, K.; Drakare, S.; Hänfling, B.; Kahlert, M.; et al. Implementation options for DNA-based identification into ecological status assessment under the European Water Framework Directive. Water Res. 2018, 138, 192–205. [Google Scholar] [CrossRef] [PubMed]
  103. Potapova, M.; Hamilton, P.B. Morphological and ecological variation within the Achnanthidium minutissimum (Bacillariophyceae) species complex. J. Phycol. 2007, 43, 561–575. [Google Scholar] [CrossRef]
  104. Pinseel, E.; Vanormelingen, P.; Hamilton, P.B.; Vyverman, W.; Van De Vijver, B.; Kopalova, K. Molecular and morphological characterization of the Achnanthidium minutissimum complex (Bacillariophyta) in Petuniabukta (Spitsbergen, High Arctic) including the description of A. digitatum sp. nov. Eur. J. Phycol. 2017, 52, 264–280. [Google Scholar] [CrossRef]
  105. Romero, O.E.; Jahn, R. Typification of Cocconeis lineata and Cocconeis euglypta (Bacillariophyta). Diatom Res. 2013, 28, 175–184. [Google Scholar] [CrossRef]
  106. Berg, S.K.; Stenbro, R. Densification or Dilution? On Cultural and Economic Value Creation along the Aker River in Oslo, Norway. Hist. Environ. Policy Pract. 2015, 6, 197–213. [Google Scholar] [CrossRef]
Figure 1. The Oslo Fjord basin with study streams and sites highlighted. Different colors indicate site types: FOR = pristine forested reference site; UBF = unbuffered paired urban site; FBF = forested buffered paired urban site; LON = downstream longitudinal urban matrix site. For further site details, see Table S1 (Supplementary Materials).
Water 12 02799 g001
Figure 2. Generalized additive model showing adverse impacts of decreasing water quality on diatom communities in the Oslo basin. The non-linear decrease of the IPS index (L´Indice de Polluosensibilité Spécifique, aka the Specific Pollution Sensitivity Index [34]) is a response to increasing catchment urbanization (PC1). Site types are indicated by different colors; dashed lines indicate site pairs.
Water 12 02799 g002
Figure 3. Variation partitioning results showing the portions of variation in diatom community structure explained by different groups of predictors at 10 site pairs in the Oslo basin. The model (PSM2) describes variation in diatom communities explained by Spatial (5 PCNM Axes), Land use (% urban and % agricultural land cover), Riparian (% shrubs and small trees, % lichens and mosses) and Stream factors (% concrete, % aquatic mosses, % boulders, nitrate [mg/L, i.e., water quality]). Values < 0 are not shown. The unexplained (residual) variation was 41%. * p < 0.05, ** p < 0.01.
Water 12 02799 g003
Figure 4. Partial redundancy analysis (pRDA) of diatom communities at site pairs revealed the influence of riparian attributes after conditioning out confounding spatial and environmental factors. Riparian attributes used in the pRDA are shown in black. We also correlated additional riparian attributes that intuitively are associated with forested riparian buffers and unbuffered, upstream reaches (‘envfit’; Log size, R2 = 28.7%, p < 0.05; % Canopy cover, R2 = 10.4%, p = 0.391; and % Managed grasses, R2 = 24.9%, p = 0.084). Indicator diatom species for unbuffered sites were Encyonema minutum (ENMI) and Melosira varians (MVAR), whereas Humidophila perpusilla (DPER, in OMNIDIA as Diadesmis perpusilla) and Gomphonema spp. (GOMS) were characteristic of buffered sites.
Water 12 02799 g004
Figure 5. Effect sizes for differences in diatom-based indices between 10 pairs of unbuffered and buffered sites. Indices include standard diatom indices and α-diversity metrics. Only %PT showed a moderate negative effect size with present of riparian buffer. Effect sizes are expressed as mean log response ratios (with 95% CI). Rareness = Fisher´s alpha; Richness = species richness; Diversity = Shannon diversity; Evenness = Pielou’s evenness; Dominance = Berger-Parker dominance index.
Water 12 02799 g005
Figure 6. Context dependent change may be common in urban catchments [63], and we found some evidence for environmental contingencies in diatom responses to forest buffers. Increasing urbanization (PC1) weakened the potential for change in riparian habitat (ΔRCI = dRCI) to influence the reduction in %PT (ΔPT = dPT). Each point represents a site pair (unbuffered and buffered sites) in the Oslo basin.
Water 12 02799 g006

