Abstract
Coastal erosion, a worldwide social issue, has garnered substantial attention. Numerous methods have been implemented to control coastal erosion problems; however, the presence of rigid structures limits erosion mitigation, thereby causing various challenges. For instance, in the case of submerged breakwaters, local scour in front of the structure and scour caused by the flow occurring in open inlets affect the subsidence and stability of the structure and can also cause structural failure. To solve these problems, this paper proposes a hybrid method of using a submerged breakwater with an artificial coral reef installation; further, this study evaluates the attenuation of waves and mitigation of sediment transportation through large-scale 3D hydraulic experiments. We found that the hybrid method with an artificial coral reef installed in the open inlet shows excellent wave control and plays a clearly beneficial role in the advancement of the shoreline. The artificial coral reef method reduced the return flow generated by the drag force at the breakwater shoulder and open inlet. In addition, scour at the breakwater shoulder was inhibited by collecting the sand escaping offshore. Simultaneously, scour at the open inlet was also mitigated. The application of the hybrid method compensated for the problems caused by local scour and erosion in the submerged breakwater, thereby leading to the improvement of its function. Therefore, the hybrid method proposed in this paper was determined to be applicable not only for submerged breakwaters, but also for various structures for controlling coastal erosion.
1. Introduction
As a result of global warming and abnormal weather conditions, damage from disasters such as typhoons, floods, rising sea levels, and tsunamis has increased worldwide [1,2,3]. The rise in the mean sea level has increased coastal erosion, and changes in wave direction have resulted in high, swell-like waves becoming more frequent, which cause shoreline deformation [4,5,6]. Natural disasters and artificial factors such as the construction of harbors and fishing ports accelerate coastal erosion, which prevents sediment transport and finally causes changes in waves and currents [7,8]. Beaches are buffer zones that protect coasts from the impact of marine physical phenomena such as waves. On beaches, wave energy dissipation is generated by bottom friction, wave breaking inducement, and permeability, which significantly reduce run-up, wave overtopping, and flooding. Furthermore, beaches play a crucial role in environmental conservation and disaster prevention by providing ecological functions and waterfront space.
Coastal erosion occurs continually; therefore, rigid structures, including groins, breakwaters, and submerged breakwaters, have been implemented to reduce wave energy. In addition, hybrid methods that combine rigid and flexible methods, such as beach nourishment, eco-friendly artificial vegetation, sand collectors, and beach drainage methods, have become the preferred approach, and studies on preventing coastal erosion using flexible methods have been actively conducted [9,10,11,12]. For instance, Hur et al. [13] performed an experiment to control the flow at an open inlet by developing a submerged breakwater with a drainage channel to reduce the water-level rise behind the structure. Oh et al. [14] analyzed the hydraulic stability through a hydraulic experiment using a geotextile tube to perform monitoring and verification. Kanazawa et al. [15] applied the permeable layer method to lower the groundwater level; further, they conducted a hydraulic model test to reduce the rapid erosion caused by high waves and promote beach safety. Tamrin et al. [16] developed a new type of perforated concrete block showing a similar function to natural coral reefs and artificial reefs to perform experimental research on the effects of wave attenuation. In addition, various studies on flexible structures for breakwaters have been actively conducted because of the negative public reaction to rigid structures. Fatimah et al. [17] compared and verified the energy dissipation dependence on wave height, wave length, water depth, porosity, and structure width using an artificial mangrove root system. John et al. [18] interpreted the wave attenuation trends dependent on the cross-sectional characteristics of artificial vegetation through hydraulic tests. However, most coastal erosion countermeasures designed and constructed in Korea are gravity structures, which have various issues. For instance, constructing rigid structures can cause problems such as rapid fluctuations, excessive suspended sediments, and pollution during construction, thereby leading to secondary changes in the marine environment, such as restriction of seawater circulation, and changes in water quality and marine ecosystems [19,20].
To reduce the visual and environmental impacts of these problems, submerged structures were introduced in the 1980s. Such structures are installed below the water surface, and they perform the wave energy attenuation and erosion without harming the natural landscape [21,22,23]. However, waves generated through open inlets cause localized scour in the front, at the shoulder, and at the outlet of the submerged breakwater [24,25]. These scour phenomena not only have a significant influence on the settlement and stability of the structure, but also can inhibit its function [26]. Therefore, alternative methods for alleviating the problems associated with existing structures are needed. This study focused on overcoming the limitations arising from erosion at open inlets owing to scour and rip currents caused by the downdrift generated in submerged breakwaters. To solve the problem of existing submerged breakwaters, we performed a large-scale 3D hydraulic model experiment. In particular, this experiment introduced a hybrid method that combines an existing submerged breakwater with an artificial coral reef. Through movable bed experiments, we analyzed the characteristics of sediment transport and morphological changes in the bed; further, we evaluated the feasibility of the hybrid method to determine the role of artificial coral reefs in wave attenuation and prevention of erosion and scour by analyzing changes in the coastline and flow rate when the hybrid method was applied.
2. Experimental Conditions
2.1. Outline and Composition
The experiment was conducted in a 12 m (W) × 1 m (H) × 30 m (L) section of a large-scale 3D wave flume. The incident wave was simulated using a piston-type wave generator, which can generate regular waves and irregular waves. A wave absorber, which was formed from an inclined porous structure to prevent the re-reflection of waves, was installed on the opposite side of the wave generator. For the stable induction of the experimental wave generated from the wave paddle, the flume was designed to have no inclination from the wave paddle to 20 m. After 10 m, the flume contained 20 cm of gravel at the bottom, 20 cm of non-filtered sand in the middle, and 10 cm of filtered sand at the top to create a 1/20 slope, as shown in Figure 1a. Sand with an average particle size of d50 = 0.2 mm was used for the top layer, and the grain size accumulation curve is shown in Figure 1b. The submerged breakwater was installed by staking in the sequence of 8 cm of sand-filled geotextile at the bottom and 8 cm of dolos at the top of geotextile. The experiment was performed for two cases, namely one where the submerged breakwater was installed and one where the hybrid method (i.e., the submerged breakwater with an artificial coral reef) was employed, as shown in Figure 1c,d respectively. The specifications for the structure installation are shown in Table 1, where B is the structure width, L is the structure length, H is the structure height, R is the crown depth, and Y is the offshore distance as shown in Figure 1e. The hydraulic model experiment was conducted for Case 1 with 1.00 m (B) × 0.16 m (H) × 6.00 m (L) of submerged breakwater and for Case 2 with 1.00 m (B) × 0.10 m (H) × 2.00 m (L) of artificial coral reef (Table 1).
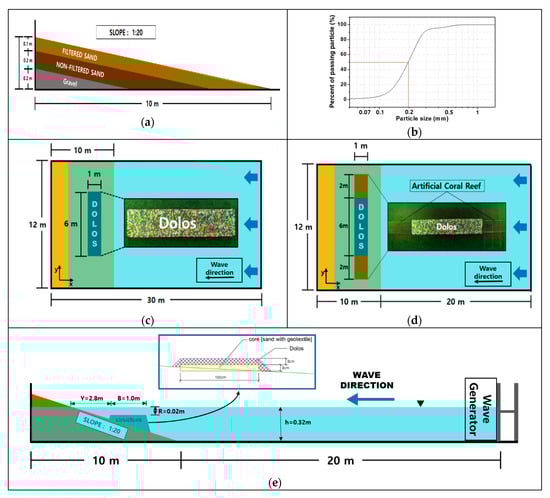
Figure 1.
3D hydraulic experiment composition and structure placement: (a) slope composition, (b) central particles size of the sand in the upper layer (d50), (c) plane placement of the submerged breakwater (Case 1), (d) plane placement of the hybrid method (Case 2), and (e) cross-section scheme of experimental structure (Case 2).

Table 1.
Specification of the 3D hydraulic experiment.
Figure 2 shows the artificial coral reef applied in the hybrid method. The artificial coral reef, which was developed based on the motif of a coral reef to prevent coastal erosion, entails a flexible construction method. It has a flexible structure, is constructed from high-density polyethylene, and contributes to both a reduction in environmental pollution and an aesthetic landscape [27]. The structure is divided into a wave reduction part and a sand collector part, which reduces the height of incident waves and collects escaping sand, respectively.
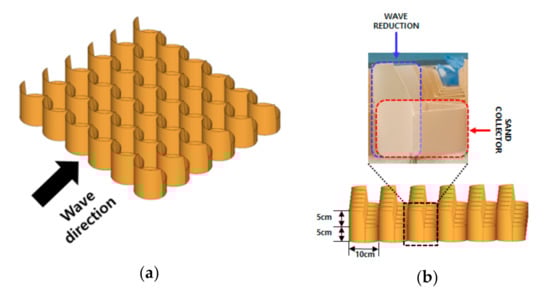
Figure 2.
Artificial coral reef: (a) scheme and (b) function.
2.2. Experimental Conditions
The incident wave condition applied to the hydraulic model experiment selected erosion-type values for CS in Equation (1), which was proposed by Sunamura and Horikawa (1974) [28].
where h is the water depth, H0 is the deep-water wave height, T is wave period, L0 is the deep-water wave length, tanβ is the initial beach slope, and CS is a dimensionless constant representing the optimum limit for erosion. In experimental water flume, 8 means total erosion, and means partial erosion or partial sedimentation, and means total sedimentation. The hydraulic experiment was conducted for 12 cm (H0) in the erosion wave condition (Table 2).
Table 2.
Experimental wave conditions.
2.3. Measurement and Analysis
The morphological changes, wave control effect, and wave distribution were investigated for the conditions in which the submerged breakwater was installed and the conditions in which the hybrid method was employed (i.e., the submerged breakwater with the artificial coral reef). We measured a wave height total of 20 points by dividing into the open inlet and area over the structure using a capacitance-type wave gauge. We measured the flow rate at a total of 15 points by dividing it into the open inlet, shoulder, and middle of the structure (Figure 3). Furthermore, we qualitatively analyzed the flow path from the submerged breakwater to the offshore area through the open inlet using a dye (rhodamine B). This flow was observed via an unmanned aerial vehicle (UAV). Considering the effect of the initial morphological change, measurements obtained during the morphology change experiments were divided into 1, 2, 8, 14, and 20 h increments. For quick and accurate measurement of the morphological changes, a 3D laser scanner (GLS1500) was utilized. Data calibration was conducted using the open-source program CloudCompare (Figure 4). The data were matched by tracking the same shape using the iterative closest point (ICP) algorithm of CloudCompare.
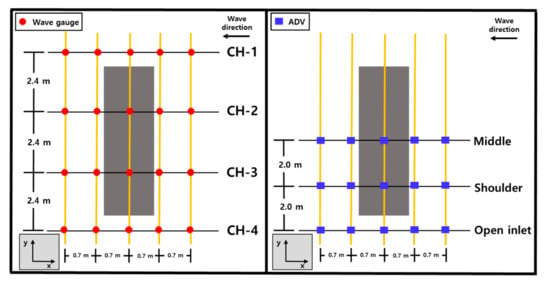
Figure 3.
Measurement locations of the wave gauge and flowmeter.
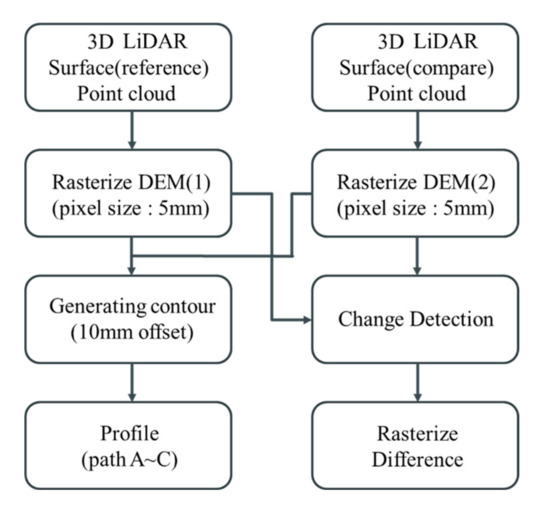
Figure 4.
Data calibration and analysis.
We conducted an analysis after matching the shapes to each data point (before wave generation at approximately 20 h) to unify the coordinate system. Noise points and out-of-range points were prepared by applying the ICP after data calibration. For data validation, we rasterized the volume change by calculating the volume for a part of the area that had no morphological changes. For the error in the region that did not change after data verification with the mean and standard deviation, we analyzed the contour and path profile after confirming that the machine error was within 2 mm (Figure A1).
3. Results and Discussion
3.1. Wave Distribution Characteristics
Figure 5 shows the wave distribution at the top of the structure when the submerged breakwater and hybrid method are applied. The horizontal axis represents x/L and the vertical axis represents the wave transmission rate (KT). The wave transmission rate is calculated using Equation (2), where Hi is the incident wave height and H′ is the wave height at the measurement point.
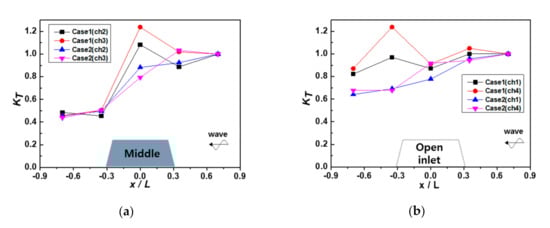
Figure 5.
Wave transmission rates by structure type (Case 1: dolos; Case 2: hybrid (dolos with the coral reef)): (a) wave distribution around the structure and (b) wave distribution at the open inlet.
Figure 5a shows the wave distribution around the structure, and Cases 1 and 2 represent the conditions under the application of the submerged breakwater and hybrid method, respectively. The wave transmission rate ranged from 0.4 to 0.5 behind the structure in Cases 1 and 2. In addition, Case 1 showed a relatively strong wave height at 1.1 of wave transmission rate near 0 cm at the crest of the structure, which was considered to be an increase in wave height as a result of breaking. Figure 5b shows the results of the wave distribution at the open inlet. The wave transmission rate was 0.8 in Case 1 and 0.6 in Case 2; this shows clear wave attenuation by the artificial coral reef in the hybrid method. The artificial coral reef method has a mechanism to attenuate the wave height via energy dissipation due to the drag force of the bottom surface, unlike the submerged breakwater. In general, the wave height was relatively high in the open inlet and low behind the structure; therefore, the flow from the open inlet to the area behind the structure was generated by the radiation stress gradient [29,30,31]. The radiation stress gradient caused by the differences in the wave height between the open inlet and area behind the structure was lower in Case 2 than that in Case 1. Therefore, the application of the hybrid method can effectively reduce longshore and rip currents, thereby resulting in stabilization of the beach.
3.2. Flow Rate Distribution Characteristics
We investigated the wave distribution around the structure, and shows the horizontal flow rate distribution (bottom) at the bottom and its dependence on the structure installation. The average flow rate was measured by dividing the middle, shoulder, and open inlet parts of the structure. Figure 6c shows the flow rate distribution over the middle of the structure. As a result, both Case 1 and Case 2 exhibited a low flow rate distribution, and a flow path was observed that moved toward the shore. Figure 6b shows the flow rate distribution at the shoulder of the structure. Note that the positive value means the flow direction of the wave and the negative means the flow direction to the offshore. In Case 1, a strong flow field of up to −18.5 cm/s formed behind the submerged breakwater. This indicated the occurrence of a strong flow behind the shoulder of the submerged breakwater. However, in Case 2, a relatively low flow of −3.77 cm/s occurred behind the structure. Figure 6a shows the flow rate distribution at the open inlet, which exhibited a strong return flow behind the structure and a decrease in the flow rate offshore. In addition, the return flow was significantly reduced in the case of the hybrid method (Case 2) compared with that in the case of the submerged breakwater (Case 1).
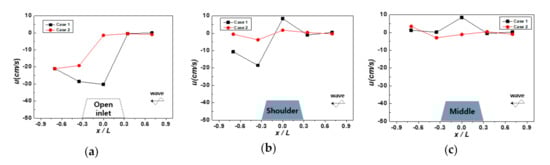
Figure 6.
Average flow rate distribution (bottom) by structure type (Case 1: dolos; Case 2: hybrid (dolos with the coral reef)): average flow rate at (a) the open inlet, (b) the shoulder of the structure, and (c) the middle of the structure.
This result indicates that the return flow was reduced by the drag force of the artificial coral reef. Figure 7 shows the distribution and direction of the flow rate vector (xz) in the x and z directions. The magnitude and direction of the flow rate vector were determined using Equation (3).
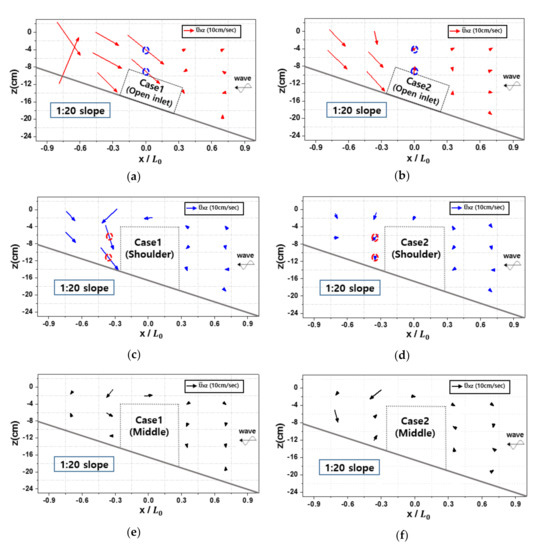
Figure 7.
Flow rate vector distribution (xz) in x and z directions by structure type (Case 1: dolos; Case 2: hybrid (dolos with the coral reef)): (a) flow rate at the open inlet with only the submerged breakwater (Case 1), (b) flow rate at the open inlet with the hybrid method (Case 2), (c) flow rate at the shoulder of the structure with only the submerged breakwater (Case 1), (d) flow rate at the shoulder of the structure with the hybrid method (Case 2), (e) flow rate at the middle of the structure with only the submerged breakwater (Case 1), and (f) flow rate at the middle of the structure with the hybrid method (Case 2).
Figure 7a,b shows the average flow rate (xz) at the open inlet. A strong flow exiting offshore behind the structure occurred owing to the increased flow rate in the open inlet. This increased flow rate was the result of differences in the average water level in Cases 1 and 2. However, in Case 1, a strong offshore flow occurred, while in Case 2, a relatively small flow distribution was observed. This caused a significant reduction in the flow rate at the location of x/L = 0 cm. In Case 2, the overall flow was greatly reduced, and in Case 1, a strong flow occurred in the offshore direction and downward along the slope near x/L0 = −0.3. This was attributed to the strong breaking wave that occurred on the crest of the structure, the average water-level rise behind the structure after breaking, and the offshore flow that occurred through the open inlet because of the difference in the average water level from the wave setup onshore and offshore. Accordingly, the strong flow at the shoulder and open inlet of the structure in Case 1 was thought to cause scour and erosion around the structure. In contrast, a decrease in the flow at the open inlet and the shoulder of the structure via the application of the artificial coral reef method (Case 2) could mitigate sediment transportation.
To qualitatively determine the flow that traveled from behind the structure to the open sea, it was tracked using a dye. Figure 8 shows the results from 0 s to 10 s for the flow of dye injected behind the shoulder of the structure as measured by a drone. As shown in the flow distribution at 5 s in Case 1, the flow predominantly moved toward the right, and the flow in the offshore direction developed in the open inlet and exited through the inlet at approximately 10 s. This was a general indication of a strong flow through the submerged breakwater to the open inlet. This strong flow could cause local scour and erosion behind the structure. However, when the hybrid method was applied, the flow exiting through the open inlet was relatively mitigated compared with that in Case 1. From the experiments, the application of the hybrid method could mitigate the problems of local scour and the erosion that generally occurs around submerged breakwaters. It could also improve the function of the submerged breakwater itself. Therefore, the hybrid method proposed in this study was determined to be applicable not only for general submerged breakwaters, but also for various structures for controlling coastal erosion.
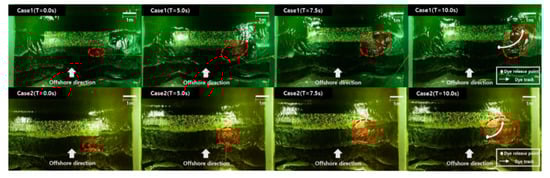
Figure 8.
Flow patterns around the structure by structure type (Case 1: dolos; Case 2: hybrid (dolos with the coral reef)) determined using dye.
3.3. Morphological Characteristics
We analyzed the morphological trends dependent on the structure type. Figure 9 shows the morphological changes 20 h after implementing each case. In Cases 1 and 2, sand accumulated behind the structure and small scour occurred in the open inlet. The offshore phase-averaged wave generation was determined via a balance between the gradients of the radiation stress and the average water level [32]. The governing equation for offshore average flow in normal states can be expressed as Equation (4). Here, xi is the coordinate system, g is the gravitational acceleration, is the density, h is the water depth, is the displacement of the average water surface, Ui is the phase-averaged flow rate, Sij is the radiation stress of the waves, and is the frictional stress of the bottom surface. This equation indicates that the average offshore flow is determined by the balance between the gradients of the radiation stress and the average water level.
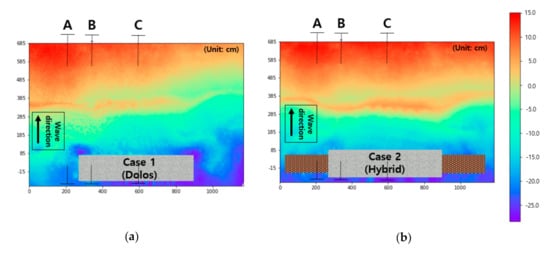
Figure 9.
Results of the 3D morphological changes after 20 h by structure type (Case 1: dolos; Case 2: hybrid (dolos with the coral reef)): (a) morphological changes after 20 h when the submerged breakwater was applied (Case 1) and (b) morphological changes after 20 h when the hybrid method was applied (Case 2).
Based on wave and velocity distribution analysis in Section 3.1 and Section 3.2, the flow was generated from the side part to the rear part of the structure due to the wave radiation stress gradient since the distribution is relatively low in the center part behind the structure rather than the side part. This phenomenon would lead to the shoreline retreat from the open inlet and the shoreline advance behind the structure at the same time. We measured the slow rate of flow because the radiation stress gradient was relatively low between the open inlet and center part of the structure in Case 2 rather than in Case 1. In addition, the blue areas shown in Figure 9a denote erosion and scour, which occurred behind the shoulders and open inlet of the structure. This is because a strong return flow occurs as a result of the differences in the mean water level, depending on the wave setup, at the open inlet and shoulder of the structure, as described in Section 3.2. This rise in the water level behind the structure is a fatal drawback of the submerged breakwater. Due to the water level rise, return flow was generated for energy equilibrium, which led to serious erosion and scour around the structure. However, in Case 2, the erosion around the structure could be mitigated because the return flow was reduced while allowing the flow over the artificial coral reef. Compare with Figure 9a (circle area), it can be seen that the blue area, which describes the area of erosion and scour, was diminished around the structure as shown in Figure 9b, which demonstrates the beneficial role of artificial coral reef to conserve the seabed. To analyze the erosion and scour precisely, we investigated cross-sections dependent on the morphological changes. These were divided into those corresponding to the open inlet (section A), shoulder (section B), and middle of the structure (section C).
Figure 10 shows the cross-sectional profiles for each structure portion. The black, orange, and blue lines each indicate the morphologies at the beginning of the experiment, 2 h later, and 14 h later, respectively. Table 3 presents coastline change(∆Y), erosion amount(∆A), maximum scour depth (Smax) for each section. Here, the negative value of ∆Y means the retreat of the coastline and the positive value means advancement of the coastline. For ∆A, a negative value means erosion, positive means sedimentation. The cross-sectional changes in the open inlet (section A) were −4 cm (Case 1) and 3 cm (Case 2) after 20 h, which indicated small coastline changes. For the maximum scour depth (Smax) at the open inlet, 5.9 cm of scour near x = 705 cm and 5.3 cm near x = 445 cm were measured in Cases 1 and 2, respectively, generated by the return flow in the open inlet (Table 3). Furthermore, we calculated the scour amounts from the morphological changes for each cross-section after wave generation. The amounts were −6386.6 cm2 and −3634.8 cm2 for Cases 1 and 2, respectively, which proves that the amount of erosion was reduced in Case 2. It was determined that the sand collector, employed in the artificial coral reef method in the open inlet, reduced erosion by collecting sand. The results of the morphological changes after 20 h in the shoulder of the structure (section B) showed coastline advancements of 42 cm and 71 cm in Cases 1 and 2, respectively, which shows that the hybrid method contributed more to the advancement of the coastline. For the maximum scour depth (Smax) in the structure, 12.7 cm of scour near x = 599 cm and 5.0 cm near x = 570 cm were measured in Cases 1 and 2, respectively, which indicated significantly reduced scour behind the shoulder of the structure in Case 2. This is attributed to the reduction in xz behind the shoulder of the structure when the hybrid method was applied, and is in line with the results in Figure 7c,d. As a result of calculating the amount of erosion in the shoulder of the structure, erosions of −1744.9 cm2 and −821.0 cm2 were obtained in Cases 1 and 2, respectively, which also revealed that the erosion was significantly reduced in Case 2. The results of the morphological changes after 20 h in the middle of the structure (section C) represent coastline advancements of 42 cm and 71 cm in Cases 1 and 2, respectively, which also support the excellent performance of the hybrid method with regard to coastline advancement. This is attributed to cross-sedimentation, owing to which sediments accumulated near the coastline because of wave reduction by the structure and the convergence of longshore currents behind the structure. In the case of the hybrid method, the radiation stress was low, and the return flow was reduced by the drag force of the artificial coral reef, which led to coastline advancement. In addition, it was determined that the morphological change around the structure was small because the scour was invisible and the value of xz was low around the structure, as shown in Figure 7e,f. Consequently, the wave reduction part of the hybrid system controlled the waves such that the differences in the energy gradient were lower than those in Case 1, and the sand collector part reduced the return flow and controlled some of the escaping sand. The experiments confirmed that the application of the hybrid method mitigated local scour and erosion of the submerged breakwater. It also improved the wave control of the structure and the coastline advancement. In this study, a 1/25 scale of the hydraulic model experiment was conducted by applying Floude’s similarity law in a water basin at Balai Pantai research center, Indonesia. The results in the experiments are judged to be able to appropriately reproduce the actual environment; thus verification and application through numerical model experiments will be performed in further study. Further studies will be conducted to evaluate the optimized hybrid design in various locations, and an on-site installation will be conducted to verify the applicability and results.
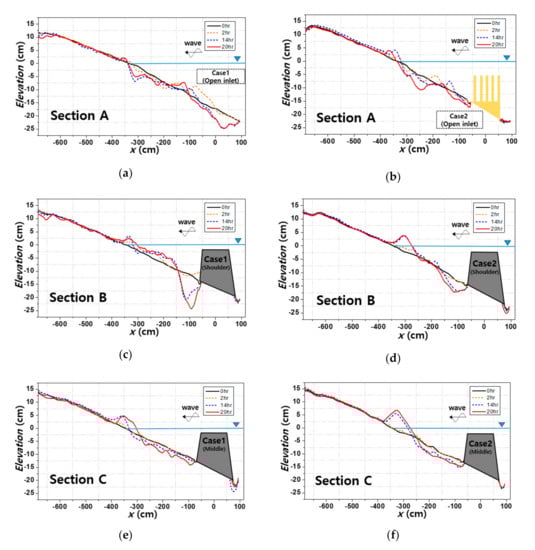
Figure 10.
Morphological changes in each cross-section by structure type (Case 1: dolos; Case 2: hybrid (dolos with the coral reef)): (a) cross-section change at the open inlet (section A) with only the submerged breakwater (Case 1), (b) cross-section change at the open inlet (section A) with the hybrid method (Case 2), (c) cross-section change at the shoulder of the structure (section B) with only the submerged breakwater (Case 1), (d) cross-section change at the shoulder of the structure (section B) with the hybrid method (Case 2), (e) cross-section change at the middle of the structure (section C) with only the submerged breakwater (Case 1), and (f) cross-section change at the middle of the structure (section C) with the hybrid method (Case 2).
Table 3.
Morphological changes dependent on the structure type.
3.4. Shoreline Response to Offshore Obstacles
Various technologies have been developed to address coastal erosion, and many studies have been conducted on shoreline response dependents on the type of structure. Black et al. [33] suggested an equation for predicting the salient and tombolo dependence on the ratio of the structure length (B) and the distance from the undisturbed shoreline (S). Equation (5) presents an empirical-based relationship for the shoreline response to the reef. Xoff and Yoff were estimated using Equation (5) to compare and evaluate the theoretical results (Table 4). Herein, Xoff and Yoff represent the distance from the tip of the salient to the offshore obstruction and the salient amplitude, respectively (Figure A2). In addition, S presents the sum of Xoff and Yoff. We computed Yoff by calculating undisturbed line (S) without disturbance at the center of the structure based on morphological change data in Figure 9. Figure 11 shows the coastline response results for the submerged breakwater and hybrid method, and the power–curve relationship is distributed within a certain range. In Case 1, this comparison revealed that the measured value of Xoff was approximately 22% larger than the reference value. This result indicated that more time was required to reach a stable shore condition, despite setting 20 h as the threshold for a stable shore in the experiment where no topographical changes occurred. In addition, the particle diameter of the experimental sand was 0.2 mm, which was considered to be a large diameter for topographical change. In Case 2, the measured value for Xoff was approximately 17% larger than the reference value. In this case, the S value decreased to reduce Xoff, which led to the advancement of the shoreline. This occurred because the disturbed area was reduced owing to wave control in the open inlet, which was caused by the application of the artificial coral reef. In general, it was found that the similarity of the hydraulic model experiment exhibited a small error range compared with the Xoff value under field conditions; further, it well-reproduced the field conditions. However, Equation (5) represents only the coastline change with respect to the structure length and detached distance, and it does not consider the wave height, structure width, and floor depth. Therefore, we intend to conduct further studies on the response of the shoreline dependence under various conditions.
Table 4.
Comparison between the present study (Case 1 and Case 2) and reference data for Equation (5).
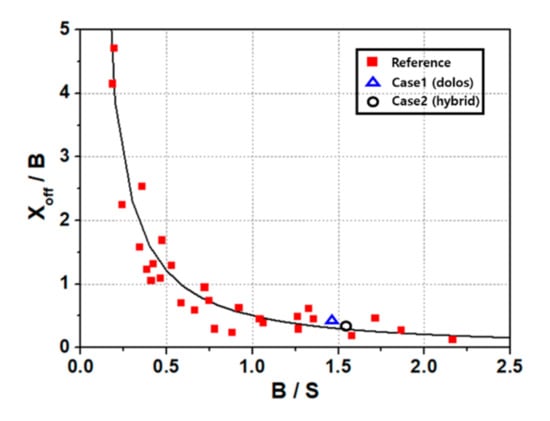
Figure 11.
Comparison between the present study (Case 1 and Case 2) and the reference data (Black and Andrews, 2001).
4. Conclusions
To solve the problem for local scour and erosion around the open inlet of submerged breakwater, we introduced the hybrid method, which combined the submerged breakwater with artificial coral reef, and we performed three-dimensional hydraulic experiments for its feasibility. For wave distribution, wave energy was reduced significantly by wave reduction, owing to frictional resistance and energy dissipation in the open inlet. For flow velocity distribution, return flow escaping to offshore through open inlet was reduced. In particular, from the experiment of dye trajectory, flow was reduced and water circulation was enabled compared to the application of submerged breakwater. From the morphological changes, we found that the coastline advanced behind the structure owing to the convergence of longshore currents in that area and the cross-sedimentation control, achieved through wave control. Furthermore, substantial scour and erosion occurred at the shoulder of the structure and the open inlet when only the submerged breakwater was present; however, in the case of the hybrid method, the scour and erosion were significantly reduced. It was determined that the application of the hybrid method controlled the movement of sediments by reducing the return flow exiting through the open inlet and shoulder of the structure. It is worthy to note that the implementation of artificial coral reefs in open inlets can reduce the return flow rate, attributed to the drag force. Further studies will be carried out to evaluate the optimized hybrid design in various locations, and an on-site installation will be conducted to verify the applicability and results.
Author Contributions
T.K. and S.K. designed the study concept; T.K., S.B., and Y.K. performed the experiment; all authors analyzed the results; and T.K., Y.K., S.M.C., and J.L. wrote the paper. All authors have read and agreed to the published version of the manuscript.
Funding
This research received no external funding.
Acknowledgments
This research was supported by Basic Science Research Program through the National Research Foundation of Korea (NRF) funded by the Ministry of Education (NRF-2020R1A6A3A13069154). This research was supported by a grant (20011068) of Regional Customized Disaster-Safety R&D Program funded by Ministry of Interior and Safety (MOIS, Korea).
Conflicts of Interest
The authors declare no conflict of interest.
Appendix A

Figure A1.
Data calibration for analysis of morphological changes.


Figure A2.
Geometric definition of shoreline (Black and Andrews, 2001).

References
- Berlemann, M.; Steinhardt, M.F. Climate Change, Natural Disasters, and Migration—A Survey of the Empirical Evidence. CESifo Econ. Stud. 2018, 63, 353–385. [Google Scholar] [CrossRef]
- Han, D.; Huh, J.; Canh, B.D.; Jin, H.S. Impacts of Sea Level Rise and Storm Surge in Yeosu, Korea. J. Coast. Res. 2019, 91, 446–450. [Google Scholar] [CrossRef]
- Kron, W.; Low, P.; Kundzewich, W.Z. Changes in risk of extreme weather events in Europe. Environ. Sci. Policy 2019, 100, 74–83. [Google Scholar] [CrossRef]
- Hur, D.S.; Lee, W.D.; Cho, W.C. Three-dimensional flow characteristics around permeable submerged breakwaters with open inlet. Ocean Eng. 2012, 44, 100–116. [Google Scholar] [CrossRef]
- Mimura, N.; Kawaguchi, E. Responses of Coastal Topography to Sea-Level Rise. In Proceedings of the 25th International Conference on Coastal Engineering, Orlando, FL, USA, 2–6 September 1996; pp. 1349–1360. [Google Scholar]
- Mimura, N.; Isobe, M.; Hosokawa, Y. Coastal Zone in the Potential Effects of Climate Change in Japan; Center for Global Environmental Research: Tsukuba, Japan, 1993; pp. 57–69. [Google Scholar]
- Hseih, T.C.; Ding, Y.; Yeh, K.C.; Jhong, R.K. Investigation of Morphological Changes in the Tamsui River Estuary Using an Integrated Coastal and dEstuarine Processes Model. Water 2020, 12, 1084. [Google Scholar] [CrossRef]
- Moghaddam, E.I.; Hakimzadeh, H.; Allahdadi, M.N.; Hamedi, A.; Nasrollahi, A. Wave-induced currents in the northern gulf of Oman: A numerical study for Ramin prot along the Iranian Coast. Am. J. Fluid Dyn 2018, 8, 30–39. [Google Scholar]
- Kramer, M.; Zanuttigh, B.; Van der Meer, J.W.; Vidal, C.; Gironella, F.X. Laboratory experiments on low-crested breakwaters. Coast. Eng. 2005, 52, 867–885. [Google Scholar] [CrossRef]
- Cavallaro, L.; Viviano, A.; Paratore, G.; Foti, E. Experiments on Surface Waves Interacting with Flexible Aquatic Vegetation. Ocean Sci. J. 2018, 53, 461–474. [Google Scholar]
- Postacchini, M.; Brocchini, M.; Corvaro, S.; Lorenzoni, C.; Mancinelli, A. Comparative analysis of sea wave dissipation induced by three flow mechanisms. J. Hydraul. Res. 2011, 49, 554–561. [Google Scholar] [CrossRef]
- Van der Meer, J.W.; Briganti, R.; Zanuttigh, B.; Wang, B. Wave transmission and reflection at low-crested structures: Design formulae, oblique wave attack and spectral change. Coast. Eng. 2005, 52, 915–929. [Google Scholar] [CrossRef]
- Hur, D.S.; Lee, W.D.; Cho, W.C.; Jeong, Y.H.; Jeong, Y.M. Rip current reduction at the open inlet between double submerged breakwaters by installing a drainage channel. Ocean Eng. 2019, 193, 106580. [Google Scholar] [CrossRef]
- Oh, Y.I.; Shin, E.C. Using submerged geotextile tubes in the protection of the E. Korean shore. Coast. Eng. 2006, 53, 879–895. [Google Scholar] [CrossRef]
- Kanazawa, H.; Matukawa, F.; Katoh, K.; Hasegawa, I. Experimental Study on the Effect of Gravity Drainage System on Beach Stabilization. In Proceedings of the 25th International Conference on Coastal Engineering, Orlando, FL, USA, 2–6 September 1996; pp. 2640–2653. [Google Scholar]
- Tamrin, S.P.; Parung, H.; Thaha, A. Experimental Study of Perforated Concrete Block Breakwater. Int. J. Eng. Technol. 2014, 14, 6–10. [Google Scholar]
- Fatimah, E.; Wahab, A.K.A.; Ismail, H. Numerical Modeling Approach of an Artificial Mangrove Root System (ArMS) Submerged Breakwater as Wetland Habitat Protector. In Proceedings of the Seventh International Conference on Coastal and Port Engineering, (PIANC-COPEDEC VII), Dubai, UAE, 24–28 February 2008; pp. 1–20. [Google Scholar]
- John, B.M.; Shirlal, K.G.; Rao, S. Effect of Artificial Sea Grass on Wave Attenuation—An Experimental Investigation. Aquat. Procedia 2015, 4, 221–226. [Google Scholar] [CrossRef]
- Miselis, J.L.; Andres, B.D.; Nicholson, R.S.; Defne, Z.; Ganju, N.K.; Navoyn, A. Evolution of Mid-Atlantic Coastal and Back Barrier Estuary Environments in Response to a Hurricane: Implications for Barrie-Estuary Connectivity. Estuaries Coasts 2016, 39, 916–934. [Google Scholar] [CrossRef]
- Talukder, A.; Mallick, D.; Hasin, T.; Anka, I.Z.; Hasan, M.M. Spatio-Temporal Variability in Hydro-Chemical Characteristics of Coastal Waters of Salimpur, Chittagong along the Bay of Bengal. J. Fish. 2016, 4, 335–344. [Google Scholar] [CrossRef]
- Douglass, L.; Weggel, J.R. Performance of a perched beach slaughter beach, Delaware. In Proceedings of the Coastal Sediments ‘87, New York, NY, USA, 12–14 May 1987; pp. 1385–1398. [Google Scholar]
- Deguchi, I.; Sawaragi, T. Beach fill at two coasts of different configuration. In Proceedings of the 20th International Conference on Coastal Engineering, Taipei, Taiwan, 9–14 November 1986; pp. 1032–1046. [Google Scholar]
- Funakoshi, H.; Shiozawa, T.; Tadokoro, T.; Tsuda, S. Drifting characteristics of littoral sand around submerged breakwater. In Proceedings of the International Conference on Hydro-technical Engineering for Port and Harbor Construction, Yokosuka, Japan, 19–21 October 1994; pp. 1157–1178. [Google Scholar]
- Soldini, L.; Lorenzoni, C.; Brocchini, M.; Mancinelli, A.; Cappietti, L. Modeling of the wave setup inshore of an array of submerged breakwaters. J. Waterw. Port Coast. Ocean Eng. 2009, 135, 38–51. [Google Scholar] [CrossRef]
- Ranasinghe, R.S.; Turner, I.L.; Symonds, G. Shoreline response to multi-functional artificial surfing reefs: A numerical and physical modelling study. Coast. Eng. 2006, 53, 589–611. [Google Scholar] [CrossRef]
- Lorenzoni, C.; Postacchini, M.; Brocchini, M.; Mancinelli, A. Experimental study of the short-term efficiency of different breakwater configurations on beach protection. J. Ocean Eng. Mar. Energy 2016, 2, 195–210. [Google Scholar] [CrossRef]
- Hong, S.H.; Choi, Y.S.; Kim, T.Y.; Lee, G.S.; Hur, D.S.; Kwon, S.C. The Enhanced Mitigation of Coastal Erosion Using the Artificial Coral Reefs. J. Coast. Res. 2019, 91, 11–15. [Google Scholar] [CrossRef]
- Sunamura, T.; Horikawa, K. Two-dimensional beach transformation due to waves. In Proceedings of the 14th International Conference on Coastal Engineering, Copenhagen, Denmark, 24–28 June 1974; Volume 2, pp. 920–938. [Google Scholar]
- Nobuoka, H.; Irie, I.; Kato, H.; Mimura, N. Regulation of nearshore circulation by submerged breakwater for shore protection. In Proceedings of the 25th International Conference on Coastal Engineering, Orlando, FL, USA, 2–6 September 1996; pp. 2391–2403. [Google Scholar]
- Dean, R.G.; Chen, R.; Browder, A.E. Full scale monitoring study of a submerged breakwater, Palm Beach, Florida, USA. In Coastal Engineering, 29th ed.; Elsevier: Amsterdam, The Netherlands, 1997; pp. 291–315. [Google Scholar]
- Van der Biezen, S.C.; Roelvink, J.A.; van de Graaff, J.; Schaap, J.; Torrini, L. 2DH morphological modelling of submerged breakwaters. In Proceedings of the 26th International Conference on Coastal Engineering, Copenhagen, Denmark, 22–26 June 1998; pp. 2028–2041. [Google Scholar]
- Mei, C.C. The Applied Dynamics of Ocean Surface Waves; World Scientific: Singapore, 1989; p. 463. [Google Scholar]
- Black, K.P.; Andrews, C.J. Sandy shoreline response to offshore obstacles part 1: Salient and tombolo geometry. J. Coast. Res. 2001, 29, 82–93. [Google Scholar]


© 2020 by the authors. Licensee MDPI, Basel, Switzerland. This article is an open access article distributed under the terms and conditions of the Creative Commons Attribution (CC BY) license (http://creativecommons.org/licenses/by/4.0/).