Article

Urea Inputs Drive Picoplankton Blooms in Sarasota Bay, Florida, U.S.A.

1
Fish and Wildlife Research Institute, Florida Fish and Wildlife Conservation Commission, 100 8th Avenue S.E., St. Petersburg, FL 33701, USA
2
College of Arts & Sciences, University of South Florida, 140 7th Avenue S., St. Petersburg, FL 33701, USA
3
College of Marine Science, University of South Florida, 140 7th Avenue S., St. Petersburg, FL 33701, USA
4
Maryland Department of Natural Resources, 1919 Lincoln Drive, Annapolis, MD 21401, USA
5
Mote Marine Laboratory, 1600 Ken Thompson Parkway, Sarasota, FL 34236, USA
6
St. Johns River Water Management District, 525 Community College Parkway S.E., Palm Bay, FL 32909, USA
*
Author to whom correspondence should be addressed.
Water 2020, 12(10), 2755; https://doi.org/10.3390/w12102755
Submission received: 23 July 2020 / Revised: 28 September 2020 / Accepted: 29 September 2020 / Published: 3 October 2020

Abstract

:
Recent increases in global urea usage, including its incorporation in slow-release fertilizers commonly used in lawn care in Florida, have the potential to alter the form and amount of nitrogen inputs to coastal waters. This shift may, in turn, impact phytoplankton community diversity and nutrient cycling processes. An autonomous water quality monitoring and sampling platform containing meteorological and water quality instrumentation, including urea and phycocyanin sensors, was deployed between June and November of 2009 in Sarasota Bay, Florida. This shallow, lagoonal bay is characterized by extensive and growing urban and suburban development and limited tidal exchange and freshwater inputs. During the monitoring period, three high-biomass (up to 40 µg chlorophyll-a·L−1) phytoplankton blooms dominated by picocyanobacteria or picoeukaryotes were observed. Each bloom was preceded by elevated (up to 20 μM) urea concentrations. The geolocation of these three parameters suggests that “finger canals” lining the shore of Sarasota Bay were the source of urea pulses and there is a direct link between localized urea inputs and downstream picoplankton blooms. Furthermore, high frequency sampling is required to detect the response of plankton communities to pulsed events.

1. Introduction

Eutrophication of estuarine and coastal waters is a significant global problem [1,2,3,4,5]. Elevated nutrient loading, typically in the form of dissolved nitrate and phosphate from agricultural sources [6,7], results in increases in estuarine and coastal phytoplankton biomass and productivity [8,9], which can lead to degraded and esthetically unappealing water quality. Other detrimental impacts include the development of harmful algal blooms (HABs), loss of seagrasses and bottom habitat, development of hypoxic zones, decreases in economically important aquatic species, changes to the local habitat biodiversity, and widespread impacts to regional tourism economies [1,2,3,10,11,12,13,14,15,16].
Globally, urea has increasingly replaced nitrate as the agricultural nitrogen (N) source in fertilizer over the past 30 years [17]. It is often used in animal feeds and manufacturing processes, to the point that it now accounts for more than 50% of global nitrogen fertilizer use [13,17,18]. How much of this urea is volatilized at the application site and how much is transported to the coastal ocean is unknown. Recent studies on urea in coastal waters suggest that allochthonous urea inputs can be significant, particularly in areas adjacent to agriculture systems during rain-driven runoff events (summarized in Glibert et al. [17] and Switzer [18]) or urban wastewater [19]. Generally present in concentrations <1 μM N in coastal systems [20,21,22,23], urea concentrations can be locally elevated and sufficient enough to represent a large portion of the dissolved organic nitrogen (DON) pool. Within tributaries of the Chesapeake Bay, urea concentrations have been reported as high as 25 to 50 µM N [13,24] and elevated concentrations have also been reported in nearshore waters adjacent to the heavily fertilized Yaqui Valley, Mexico [17,25].
Within Florida, urea is used extensively as a fertilizer for animal feeds, citrus crops, and lawns [26]. It has been shown to readily leach from both soluble and slow-release forms of fertilizer [27]. In southwest Florida, some of this urea is transferred to coastal waters. Glibert et al. [17] documented elevated urea concentrations (up to 4 μM) at the mouths of the Caloosahatchee and Shark rivers after Hurricane Charley in 2004. During low runoff conditions these rivers typically have urea concentrations <1 µM [22]. Urea concentrations of up to 1.4 μM have been noted in Florida Bay during managed flow processes out of the Everglades [28], and between 2.2 and 6.4 μM in Florida Bay’s adjacent canals and reef track [29].
Urea has long been known to be a significant N source for phytoplankton [15,30,31,32] and these allochthonous urea inputs may contribute significant N to coastal phytoplankton communities [33,34,35]. Urea is readily available for uptake by marine bacteria and phytoplankton that possess the enzyme urease (see Solomon et al. [34] for review). Its influence on the promotion of coastal HAB species has been suggested by Glibert et al. [17] based on global maps of HAB distributions and urea inputs, although Gowen et al. [10] and Davidson et al. [36] argue that there are currently insufficient data to evaluate this relationship. Urea has been shown to select for non-heterocytous cyanobacteria and chlorophytes in freshwater phytoplankton populations [37] and dinoflagellates in estuarine aquaculture ponds [38] and lagoonal waters [33]. Blooms of cyanobacteria and dinoflagellates often follow large inputs of urea to coastal waters [28,39,40,41]. Additionally, Kudela et al. [42] have demonstrated that many of the HAB species found on California’s coast will preferentially use urea as a N source, even when urea concentrations are at or below 24 µg N L−1.
In southwest Florida shelf waters, urea has been shown to be a preferred N source for dinoflagellates and cyanobacteria [22]. Much of the coastal areas of southwest Florida are bordered by extensive resort-like development, which includes residential housing, lawns or parks, and golf courses [43,44]. This has raised public concern as to the fate of fertilizers, especially urea-based lawn fertilizers, in coastal waters and their role in supporting toxic Karenia brevis blooms, which have been shown to preferentially take up urea in southwest Florida coastal waters [23,45]. Here we report on the deployment of an autonomous water quality monitoring and sampling platform, which included urea and phycocyanin (a pigment commonly used as a proxy for detecting cyanobacteria) sensors, and the relationship between in situ urea concentrations, rainfall, wind events, and picoplankton blooms in Sarasota Bay. Sarasota Bay, located in southwest Florida, is a coastal lagoonal system bordered by extensive suburban development, including man-made “finger canals”, a land development feature utilized since the 1960s to make more waterfront properties [44], but which often results in degraded water quality, particularly in summer months [46]. Man-made waterways such as these are known to act as natural incubators for numerous HAB species and have been a “hot spot” for HABs along the US east coast [47,48,49,50], including cyanobacteria HABs (cyanoHABs). Managing cyanoHABs for human and environmental safety has become a critical focus of scientists and policymakers alike over the past decade. As summarized in Bullerjahn et al. [51], agricultural nutrient loading is a major driver of cyanoHABs, and may be tightly coupled with predicted climate changes (increases in global temperature and major storm events [52]). There are few studies on the harmful properties of picocyanobacteria; however, Śliwińska-Wilczewska et al. [53,54] have shown that picocyanobacteria populations thrive under the conditions predicted to occur with global climate change and produce both allelopathic compounds that alter the phytoplankton community structure and secondary metabolites that harm aquatic flora and fauna.
The technology and platforms that we use to detect, track, and predict these blooms, especially cyanoHABs, are currently limited in spatial and temporal resolution. Data from the water quality monitoring platform described here demonstrate how autonomous high-frequency temporal sampling can detect and monitor picoplankton blooms that are not routinely captured through traditional monitoring programs. This effort also provides further evidence for resource managers of this sub-tropical lagoonal system that nutrient reductions, particularly reductions in urea-based fertilizers, must be achieved in order to reduce the threat from cyanoHABs within Sarasota Bay.

2. Methods

2.1. Sampling Stations

An autonomous water quality monitoring and sampling platform was deployed from 16 June 2009 to 10 November 2009 in 3 m of water in an area adjacent to Long Boat Key, FL in Sarasota Bay, on the mid-central Gulf coast of Florida, U.S.A. (Station 3, Figure 1). The deployment site is a shoal region with minimal boat traffic and situated immediately offshore of a large golf course. The platform was serviced biweekly, coincident with in situ sampling at the platform site and six additional stations in Sarasota Bay (Figure 1) to provide validation of the autonomous platform data and a “snapshot” of biweekly conditions within the Bay. A YSI 6600 Sonde (YSI, Inc., Yellow Springs, OH, USA) was used to profile over the depth of each station for temperature, salinity, pH, dissolved oxygen, turbidity, phycocyanin fluorescence, and chlorophyll-a (Chl-a) fluorescence. At Station 3, additional samples collected biweekly at approximately 10 cm below the surface using a modified Nisken bottle included inorganic nutrients (NO3, NH4+, PO4, and SiO4), total dissolved nitrogen (TDN), total dissolved phosphorus (TDP), particulate carbon (C), nitrogen (N) and phosphorus (P), and whole water urease activity. Whole water samples were collected for plankton analyses. All water samples were stored at ambient water temperature in a cooler and returned within two hours to the lab for processing.

2.2. Autonomous Water Quality Platform

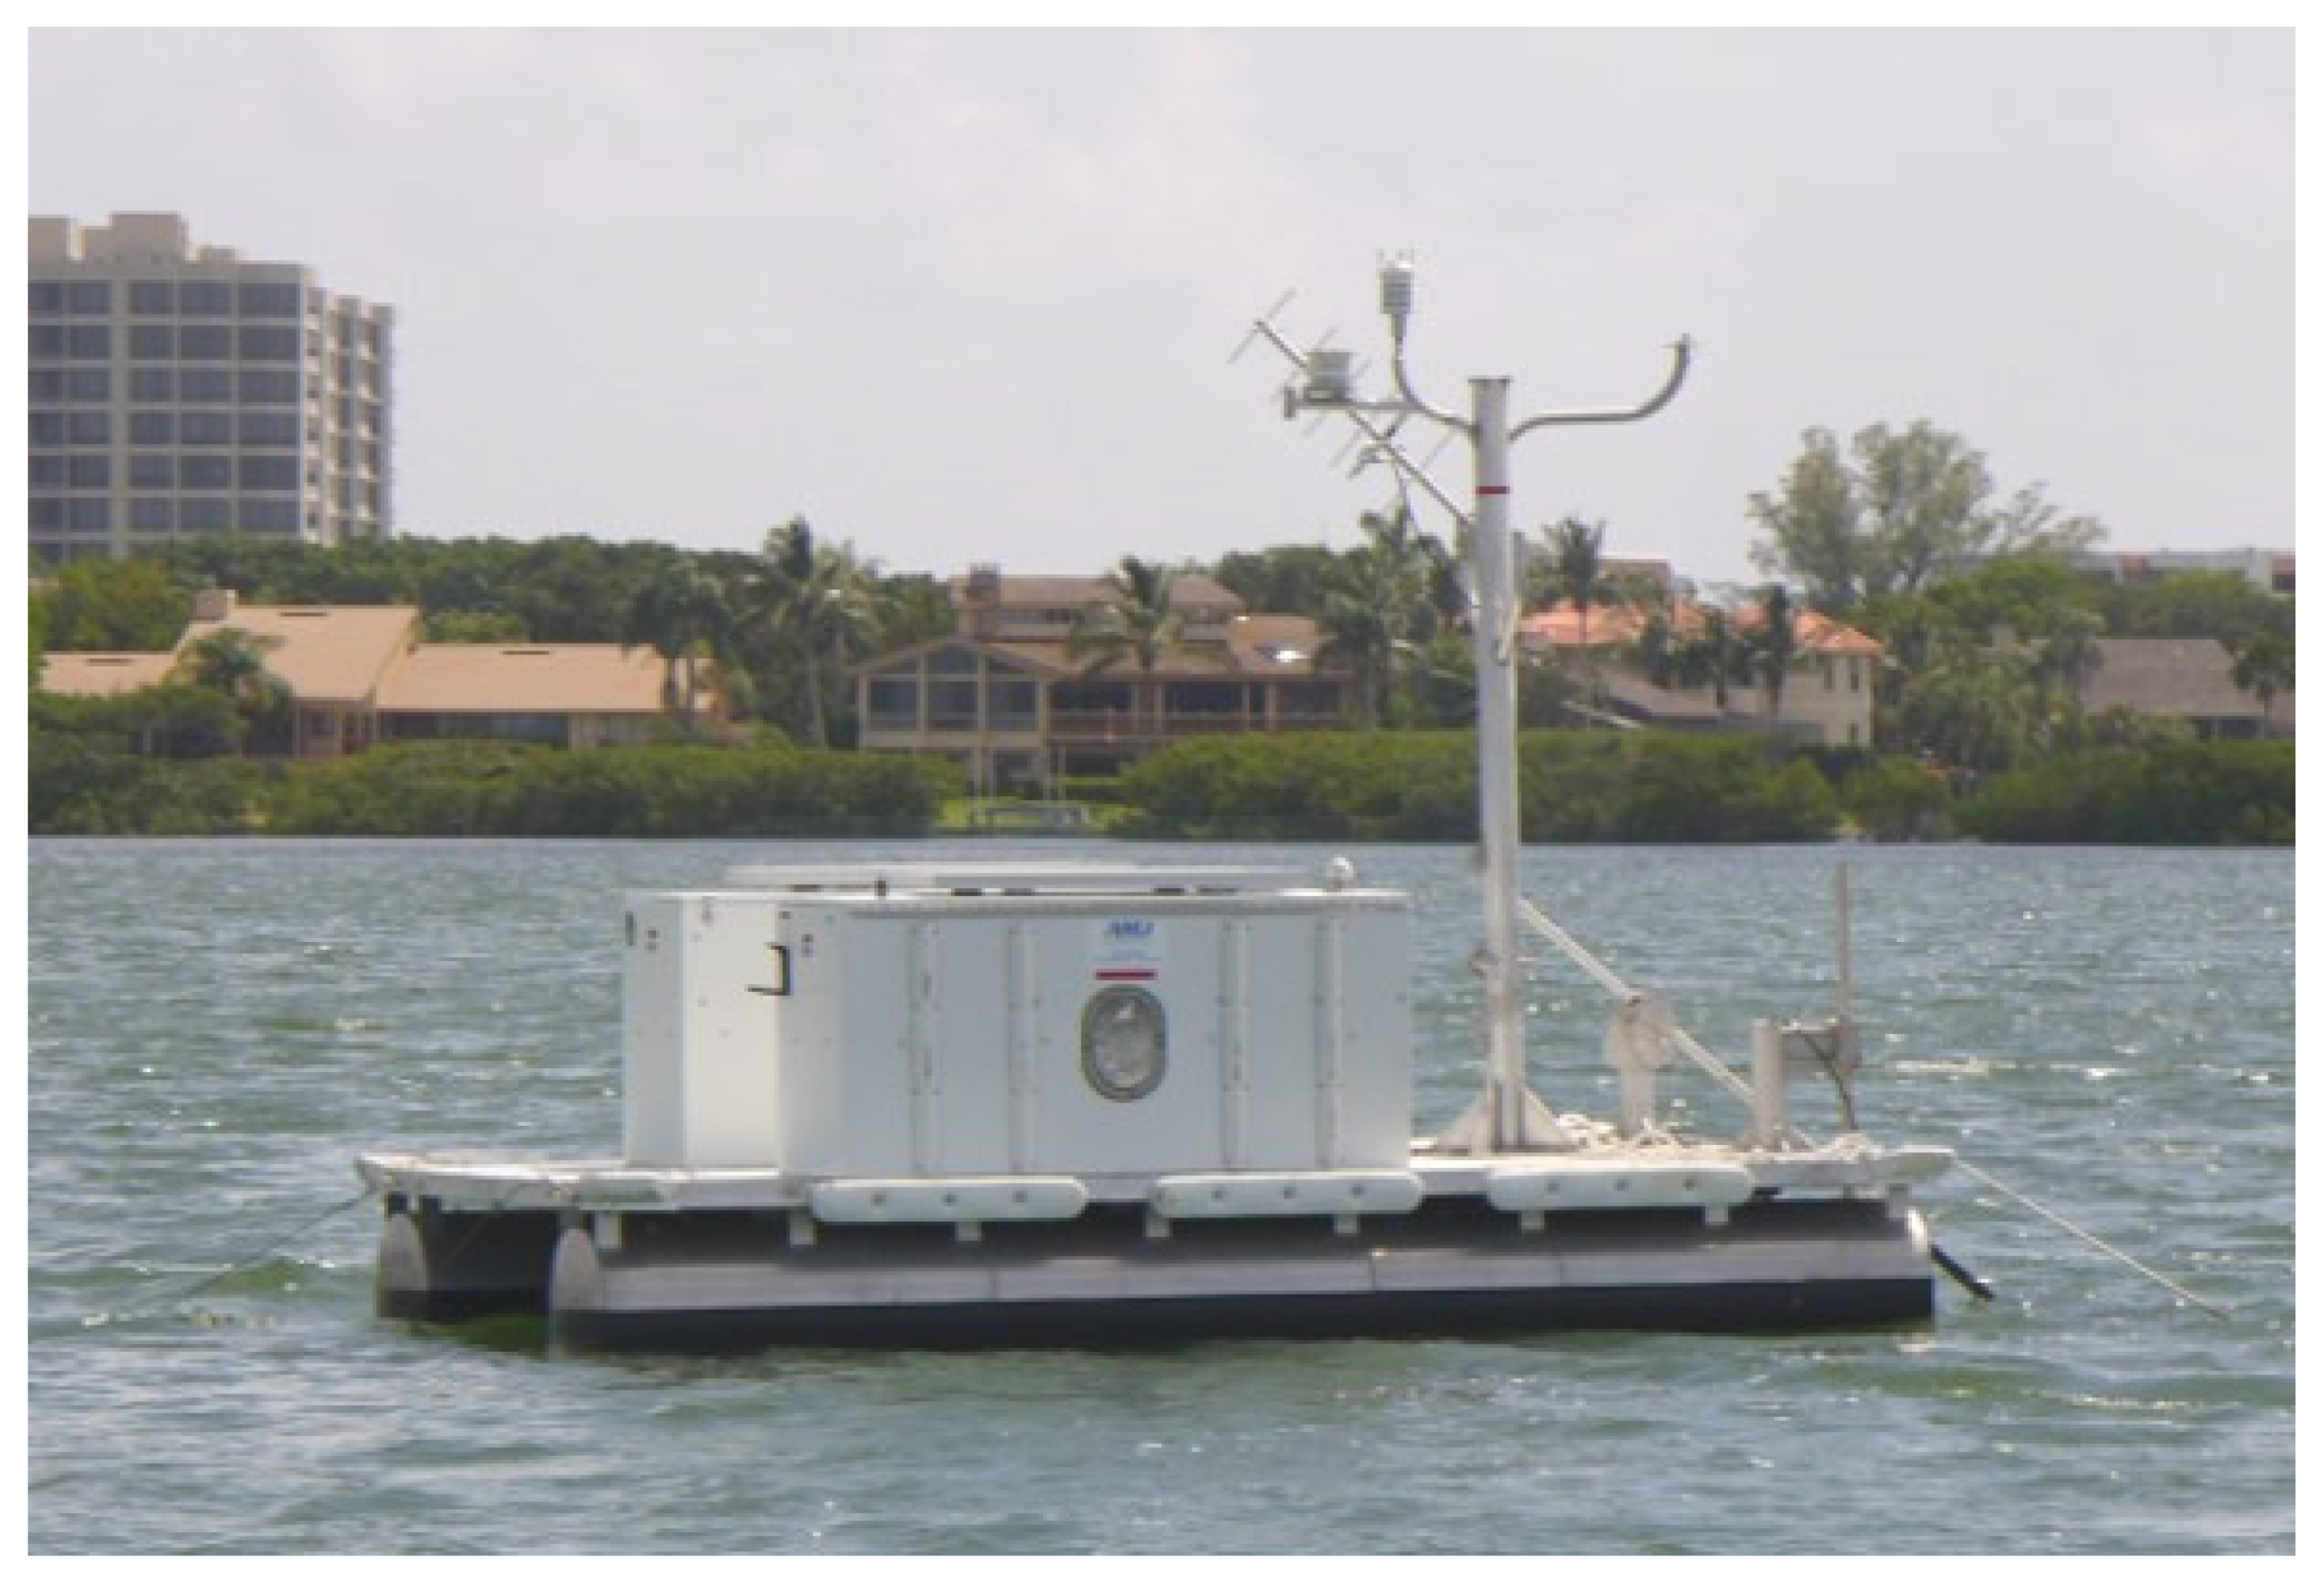
Water measurements at Station 3 were conducted using an autonomous water quality platform called the MERHAB Autonomous Research Vessel In-situ (MARVIN) [55,56]. The MARVIN platform consisted of a 14’ by 8’ aluminum pontoon boat with a mast and two 6’chests bolted on the deck that housed instruments (Figure 2). Water quality parameters measured by the instruments are listed in Table 1. A peristaltic pump was used to collect a surface water sample at the top of the hour and a bottom sample at the half hour using Tygon® (US Plastic Corporation, Lima, OH, USA) tubing fitted with 280-μm mesh screen on the intake. The near-surface tubing was lowered to approximately 0.5 m below the platform while the near-bottom tubing was kept approximately 0.5 m above the bottom. The pumped water samples were passed through a YSI 6600 sonde (YSI, Inc.) to measure salinity, temperature, Chl-a fluorescence, phycocyanin fluorescence, pH, dissolved oxygen (DO), and turbidity. Following the methods of Rahmatullah and Boyd [57] and Glibert et al. [58], a Microlab sensor (EnviroTech, Chesapeake, VA, USA) measured urea concentrations of the sampled water every three hours. Urea sampling interval was limited by the 164 min sample processing time. A Vaisala meteorological sensor (Vaisala, Woburn, MA, USA) mounted on the mast measured wind speed, wind direction, air temperature, barometric pressure, relative humidity, and precipitation. A Sontek XR ADP (Xylem, San Diego, CA, USA) mounted on the platform hull in a downward direction measured three-dimensional current speed and direction every hour and Li-Cor LI-190 and LI-192 meters (Li-Cor Biosciences, Lincoln, NE, USA) were used to measure irradiance at the surface and 1 m below the surface. The entire monitoring platform system and its component instrumentation was integrated and controlled using a Campbell CR1000 datalogger (Campbell Scientific, Logan, UT, USA). Data were downloaded every hour using a cellular modem. Power was provided by two 80 W solar panels with four 80 deep-cycle marine batteries for night and low light periods. Date and time data were recorded in GMT.

2.3. Laboratory Analyses

Whole water samples used for phytoplankton identification and enumeration (125 mL) were preserved with 5% unacidified Lugol’s iodine solution for micro- and nano-plankton and with 25% glutaraldehyde solution for picoplankton. Picoplankton and phytoplankton species, including ~70 harmful species commonly monitored by the State of Florida (see Heil and Steidinger [59]), were identified and enumerated in each preserved sample using either an Olympus IX 71 (Olympus America, Center Valley, PA, USA) or Zeiss Axiovert 25 (Carl Zeiss, Thornwood, NY, USA) inverted microscope following the modified Utermöhl technique detailed in Corcoran et al. [60] in which a minimum of 300 cells were identified and enumerated in at least 20 optical fields at a 400× magnification. Uncommon species within the sample were enumerated when examining the entire settling chamber at a 100× magnification. Phytoplankton were identified to the lowest taxonomic group possible using Wehr and Sheath [61], Tomas [62], and Steidinger et al. [63]. For data analyses, taxa were binned into the following phytoplankton functional groups: Bacillariophytes, Chlorophytes, Cryptophytes, and Dinophytes. Picoplankton samples were processed according to the method of Marshall [64] by gravity filtering 1–2 mL of glutaraldehyde preserved whole water samples onto 0.45 µm black cellulose Nuclepore filter membranes (Sigma-Aldrich, St. Louis, MO, USA) and examining the filters using the epifluorescent module on the Olympus IX 71 microscope at 1000× magnification. A minimum of 300 autofluorescent cells < 2 μm were enumerated in a minimum of 20 optical fields and categorically binned into cyanobacteria and eukaryotic components as described in Affronti and Marshall [65].
Whole water samples for size-fractionated Chl-a were filtered through Whatman GF/F (Sigma-Aldrich and 3.0 μm Nuclepore filters (Sigma-Aldrich), immediately frozen, and analyzed within two weeks of collection according to Holm-Hansen [66]. Additional water was filtered through a 3.0 μm Nuclepore filter and immediately frozen for subsequent analysis of inorganic nutrients (NO3, NH4+, PO4, and SiO4) and for determination of urea, particulate phosphorus (P), biogenic silica, total dissolved phosphorus (TDP), and total dissolved nitrogen (TDN) using an Alpkem RFA II segmented-flow nutrient analyzer (Xylem). The filter was retained and frozen for determination of biogenic silica. Samples for particulate P were filtered through precombusted (2 h, 450 °C) Whatman GF/F filters, rinsed twice with 2 mL of 0.17 Na2SO4 and frozen with 2 mL of 0.017 MgSO4 in precombusted (2 h, 450 °C) scintillation vials until analyzed. Samples for particulate N and C analyses were filtered through a pre-combusted (2 h, 450 °C) Whatman GF/F filter, washed with a 10% HCl solution made with Whatman GF/F filtered seawater, rinsed thoroughly with Whatman GF/F filtered seawater, and frozen until analysis using a Carlo-Erba Elemental Analyzer NA 1500 Series 2 instrument (CE Elantech, Inc., Lakewood, NJ, USA). Particulate P and TDP were analyzed using the methods of Solarzano and Sharp [67], TDN according to Bronk et al. [68], and biogenic silica according to Paasche [69]. Urea was analyzed following the methods of Koroleff [70], while urease activity was measured following the method of Solomon et al. [71]. Dissolved organic phosphorus (DOP) was defined as TDP less PO4. Dissolved inorganic nitrogen (DIN) was defined as NO3 plus NH4+ and dissolved inorganic phosphorus (DIP) is represented by PO4.

2.4. Urea Enrichment Experiments

Between 2 October and 22 October, additional water was collected from Station 3, returned to the laboratory within two hours, and immediately used to conduct bioassays examining the response of ambient picoplankton communities to urea additions. Water samples were first screened to remove larger grazers using a <150 µm mesh, then size-fractionated by gravity filtration through 1.0 and 12.0 μm Nuclepore (Sigma-Aldrich) filters. Duplicate 250 mL samples from each size-fraction and the original whole water sample were amended with urea additions (final concentration of 1 µM urea) while duplicate unamended samples of each fraction served as controls. All treatments were incubated at 25 °C in a Revco plant growth chamber (ThermoFisher Scientific, Waltham, MA, USA) with cool white fluorescent lights (Ecolux F40C50, Philips F40T12) set to a 12:12 L:D cycle at a saturation irradiance of 80 mmol photons m2 s−1. Picoplankton concentrations and categorization were determined as described above in each bioassay sample before and after a three-day incubation period.

2.5. Historical Data

Additional historical water quality data (Chl-a, NO3, NH4+, PO4, SiO4) collected at 40 randomly selected stations within Sarasota Bay monthly from 1998 through 2009 were provided by Sarasota County (https://sarasota.wateratlas.usf.edu/). The stations, while not coinciding with the current study’s stations due to our targeted selection of stations to monitor locations with potential runoff sources did provide a broad assessment of biogeochemical properties in Sarasota Bay over a coincident time period. Southwest Florida Water Management District rainfall data (https://www.swfwmd.state.fl.us/data), which covered a larger geographical area than the region in which the MARVIN platform collected data, were also used to provide a more comprehensive dataset for analyses.

2.6. Statistical Analysis of Wind Influence

Statistical analyses were performed on the time series data collected by the MARVIN platform using SigmaPlot (Systat Software, Inc., San Jose, CA, USA). A second order locally estimated scatterplot smoothing regression was used to minimize noise and display long term trends in the data [72]. A subset of the data was used to test whether wind events could pull water out of the sheltered “finger canals”. To create this subset, wind, current, and coincident urea data were filtered to remove urea values that might be due to runoff by selecting periods that had no rainfall within 72 h prior to sampling. Additionally, urea values were filtered to remove any values below the median. The vector directions for these higher values were plotted on a compass diagram to estimate abiotic influences on urea concentrations.

3. Results

3.1. Time Series Trends

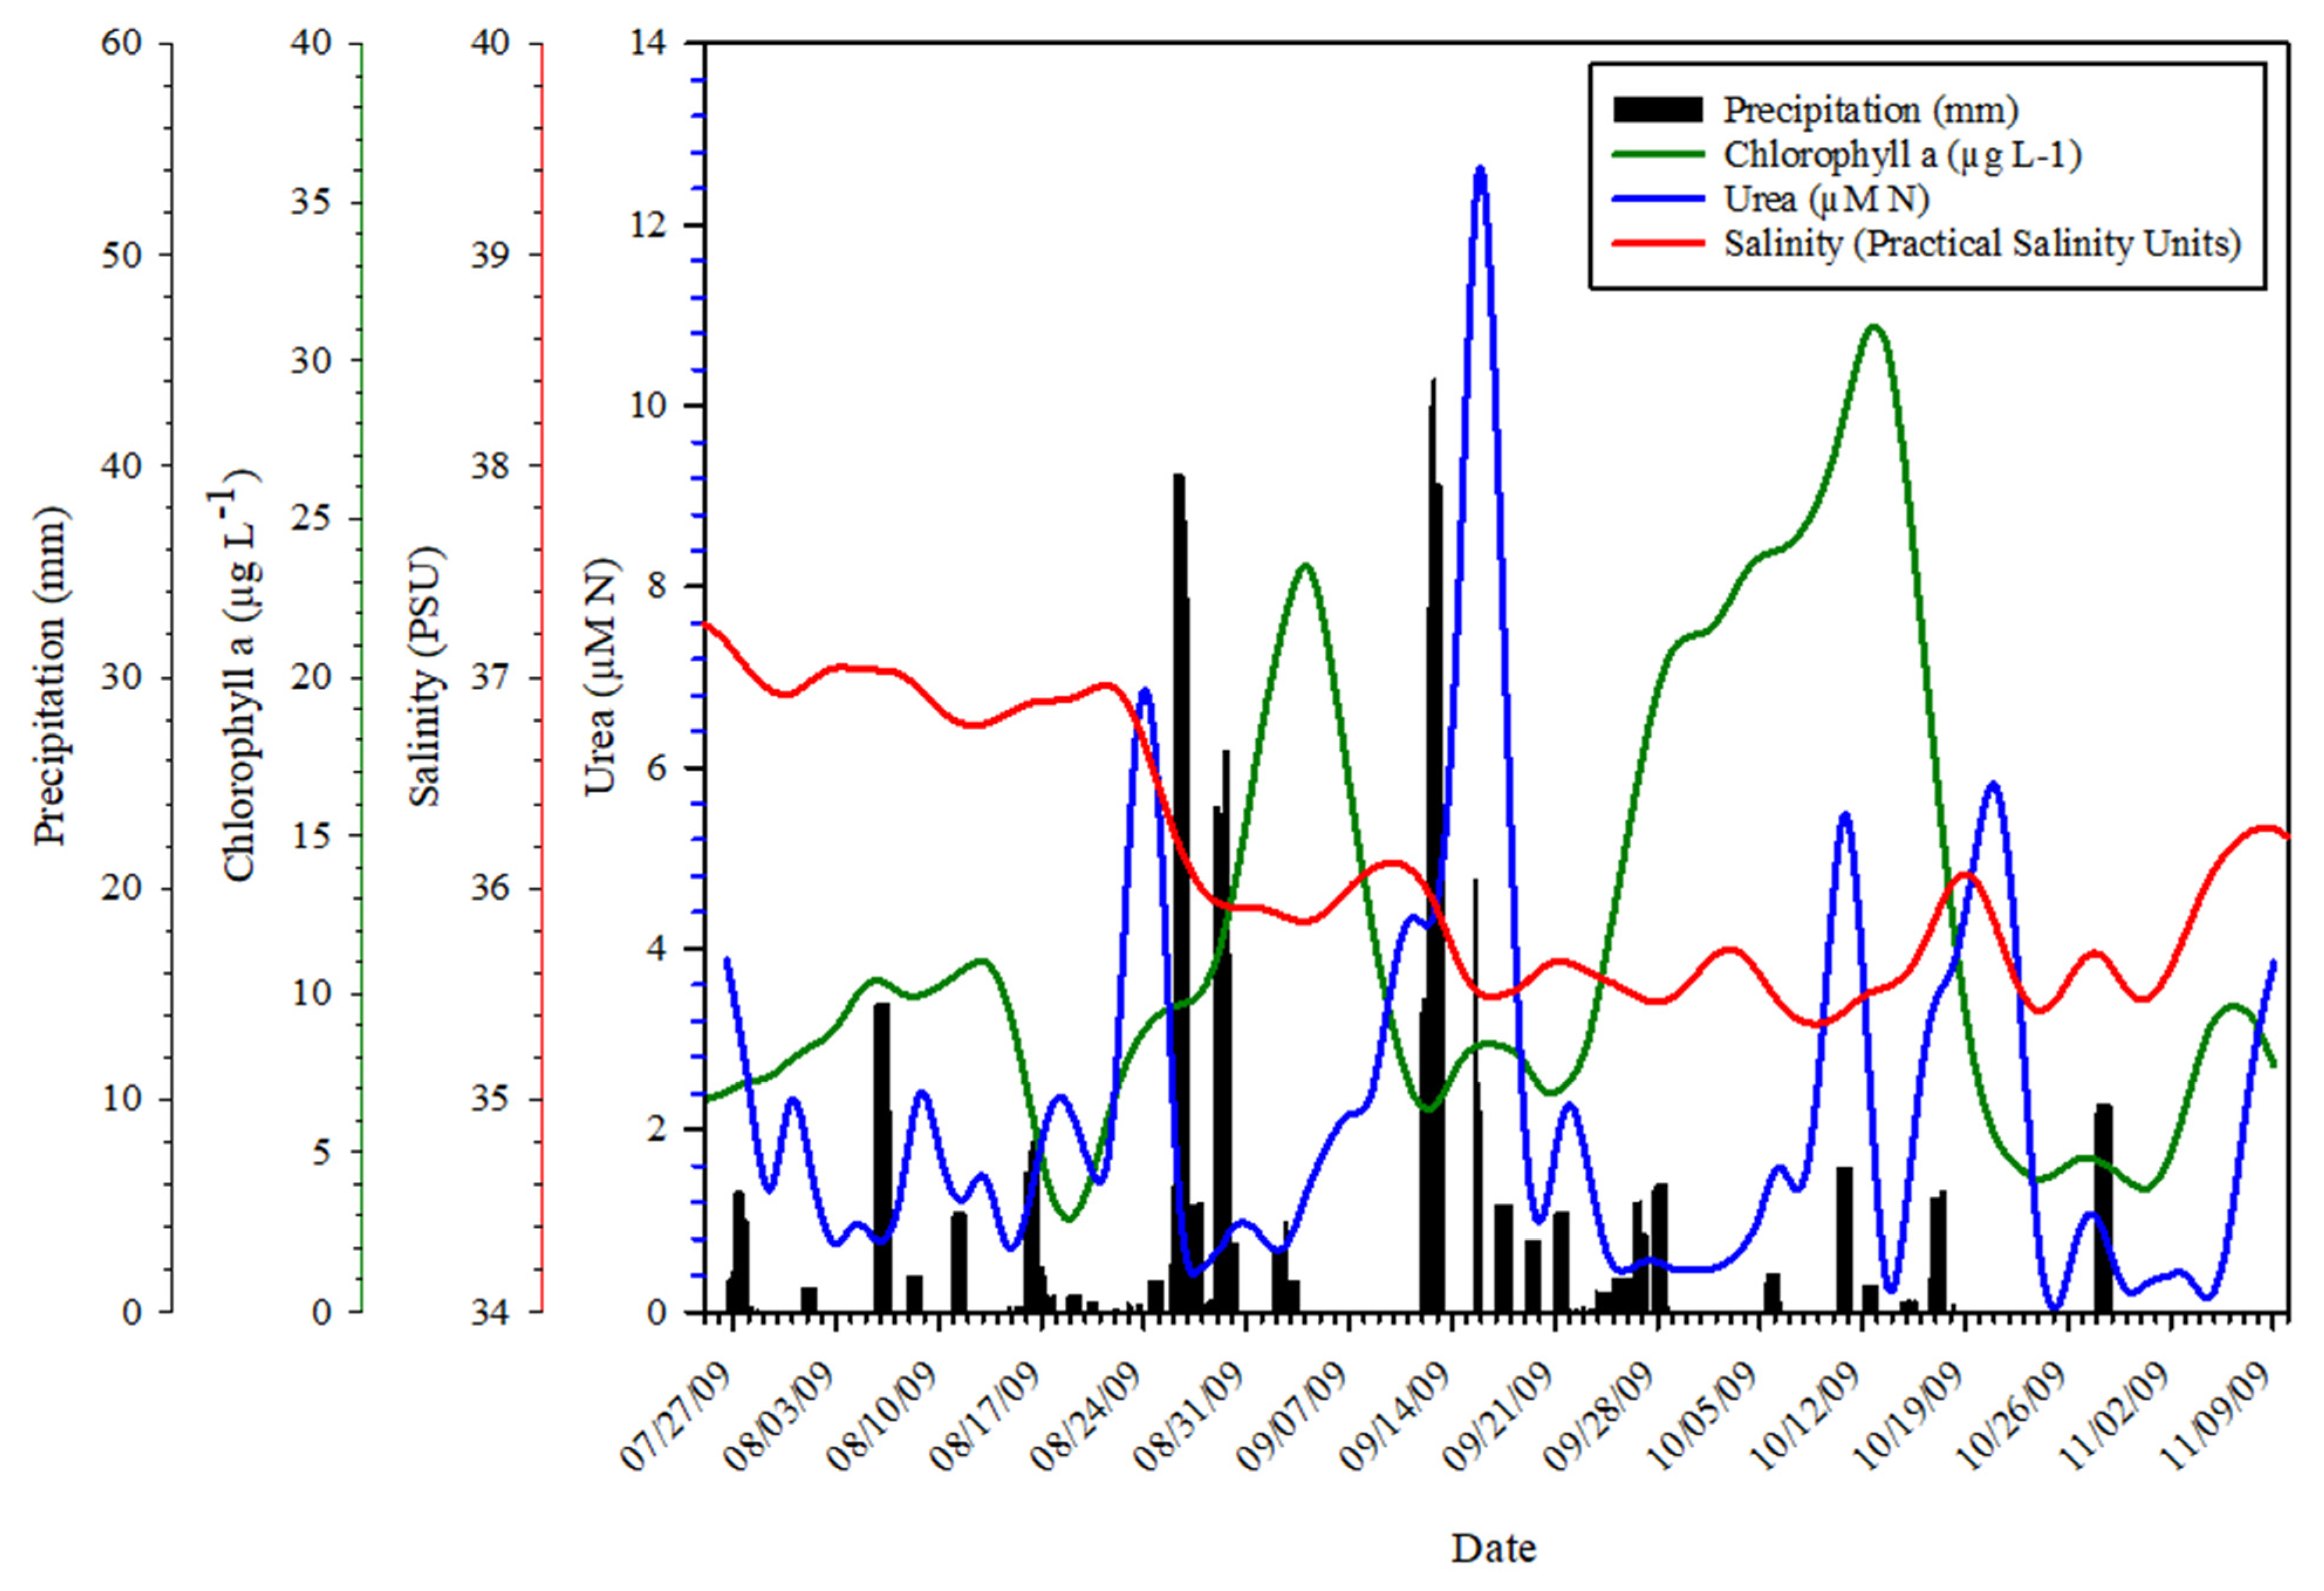
Water quality during the 2009 MARVIN platform deployment was characterized by a decrease in salinity from 38.3 to 36.2 that coincided with increased rainfall in the region (Figure 3). As the salinity declined, both urea and Chl-a values increased; Chl-a reached two maximums of 23 µg L−1 and 31 µg L−1 which were preceded by short-term (2–3 day) spikes in urea concentration, in one case this spike exceeded 12.5 µM.
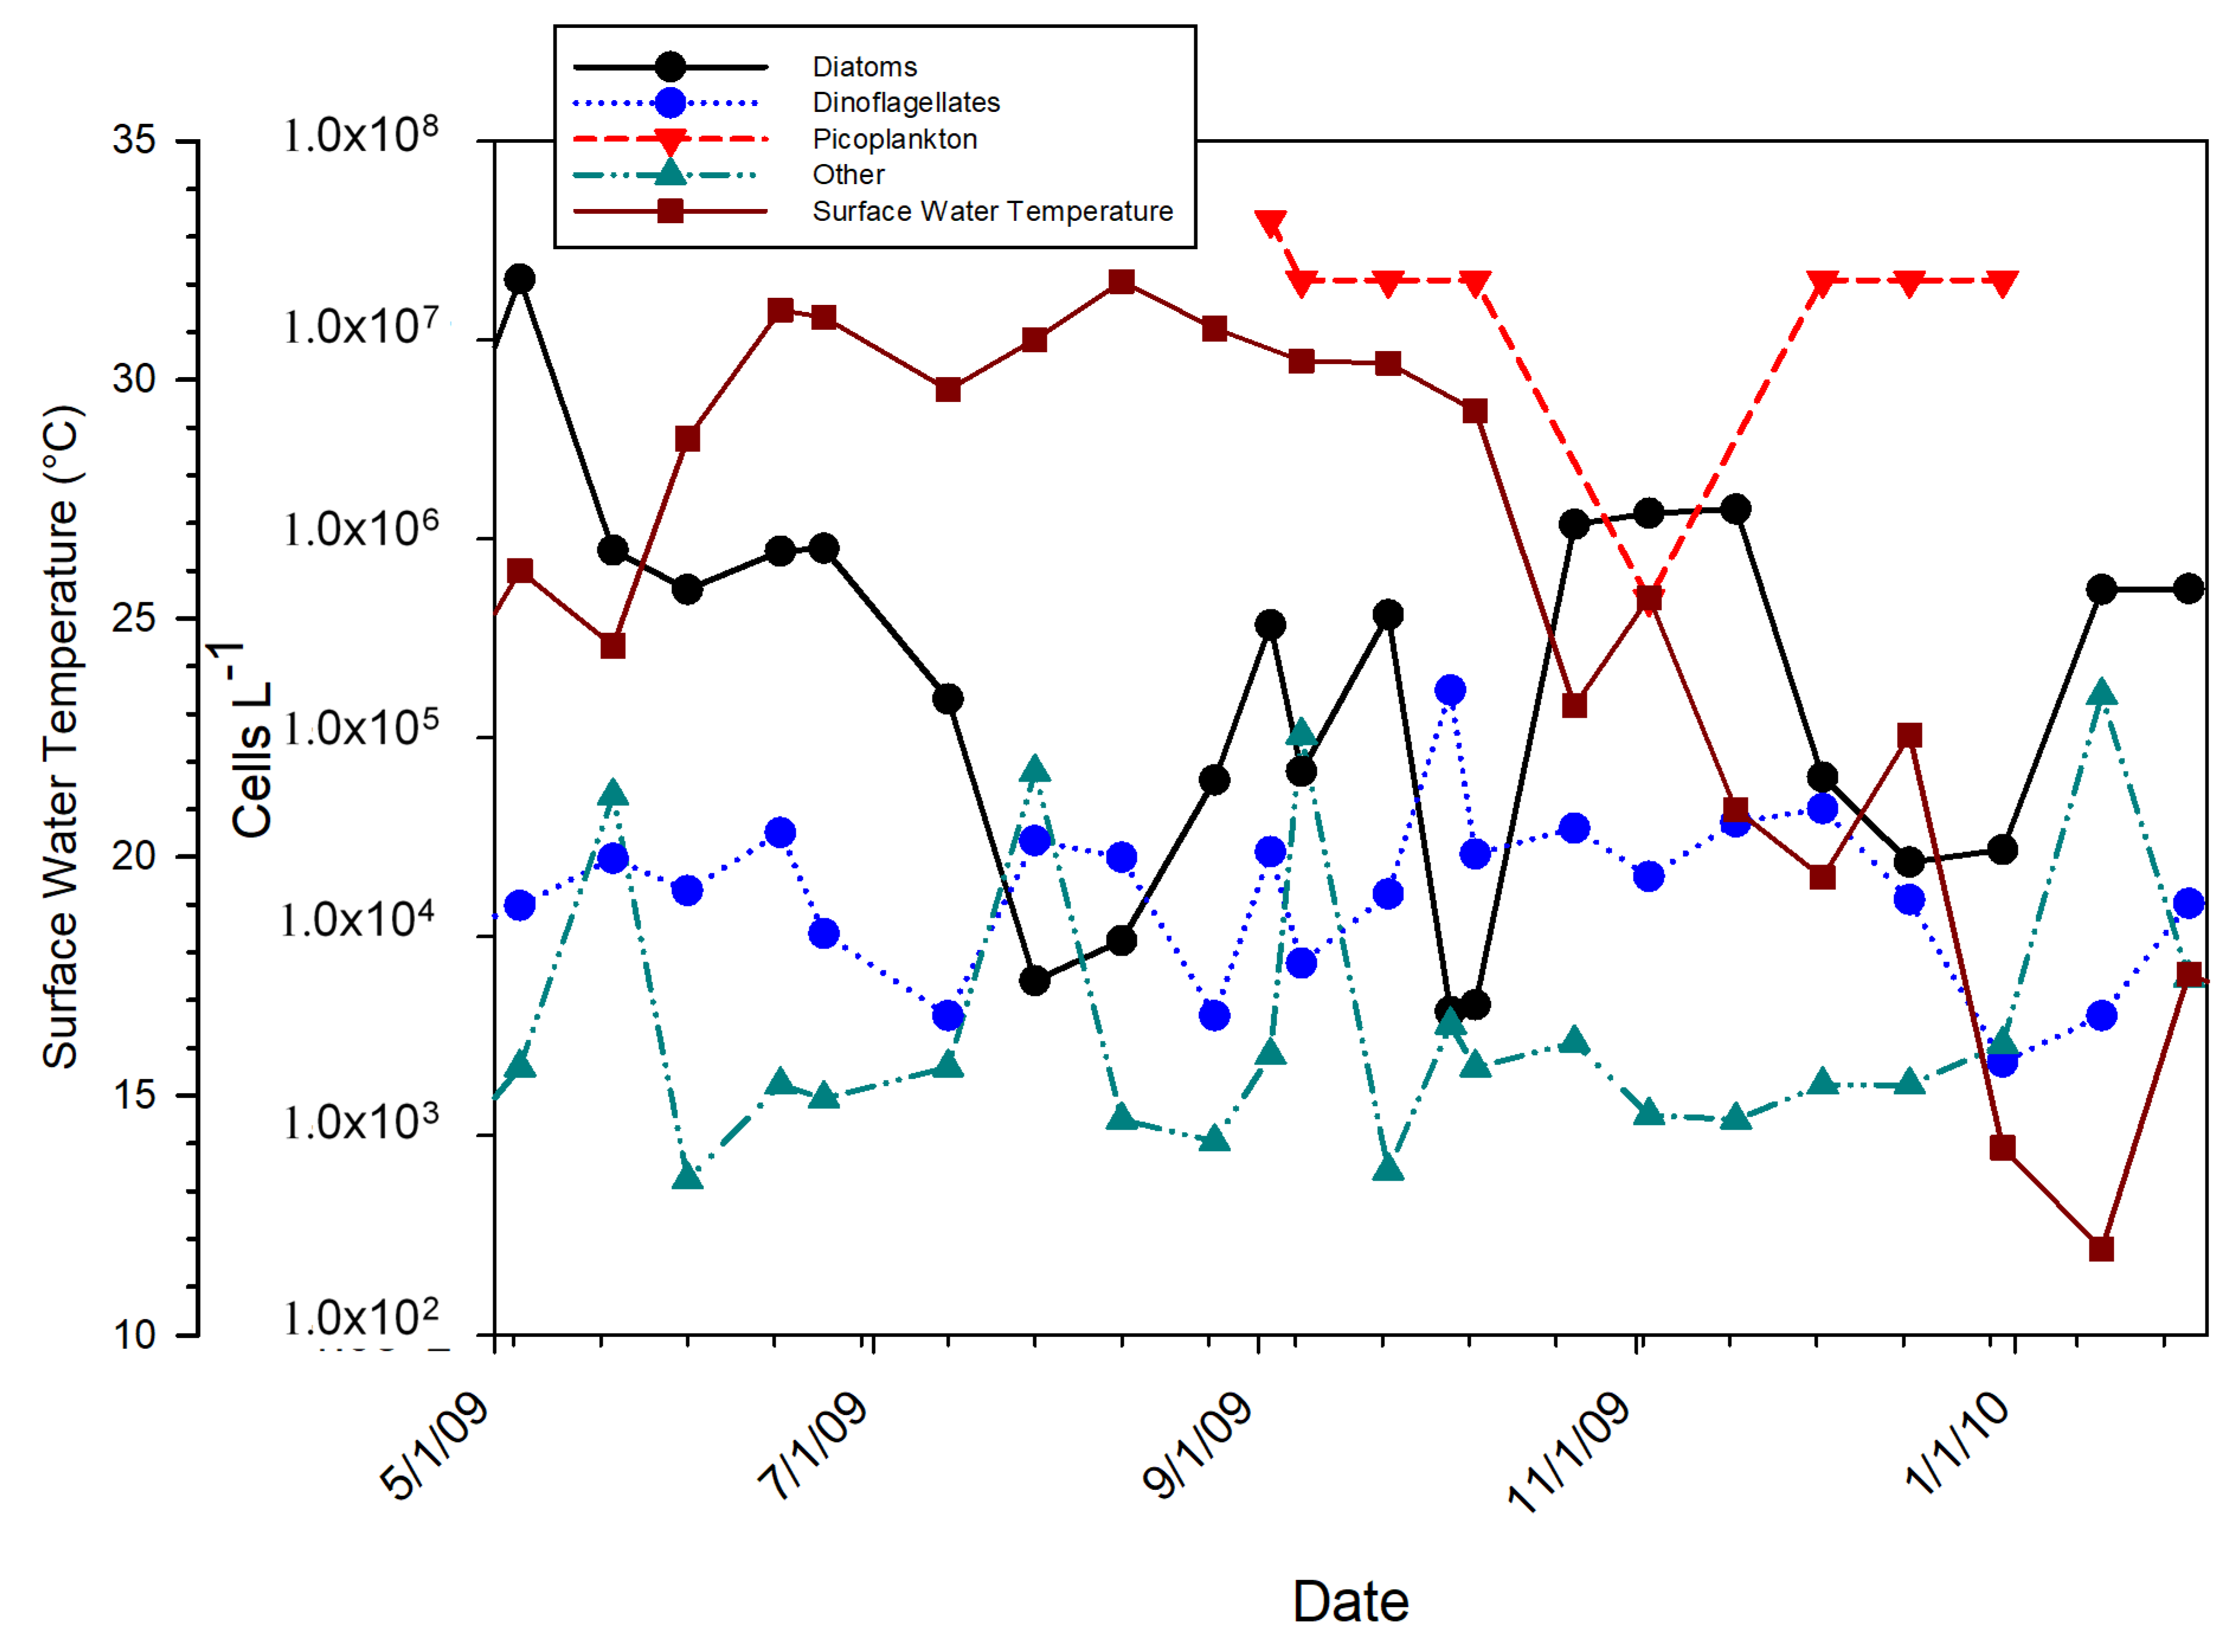
During the periods of highest observed Chl-a values, the plankton community was dominated by chlorophytes (<10 µm) or dinophytes (>10 µm) and picoplankton (<2 µm) (Figure 4). While dinoflagellates and chlorophytes were present throughout the sampling period, their concentrations never exceeded 1.9 × 10⁴ and 5.0 × 10⁴ cells L−1, respectively, and no cryptophytes were noted. A prolonged precipitation event, resulting in 74.1 mm of rain, was recorded by the MARVIN platform from 20 August to 29 August. During this period, salinity decreased by 0.2 PSU and a pulse of urea was detected which reached a maximum of 6.2 µM N on 23 August. After this urea pulse the Chl-a concentration increased from the minimum of 2.2 µg L−1 on 18 August, to a high of 24.5 µg L−1 on 4 September. Salinity decreased again between 9 September and 17 September by 0.17 PSU due to rainfall of 59 mm during this period. At the same time, urea concentration peaked at 12.6 µM N and then declined. Following this second decrease in salinity and increase in urea, Chl-a began to increase on 20 September and reached a maximum value of 32.0 µg L−1 on 12 October. Coincident with this second pulse of urea the Chl-a concentration reached 23 µg L1, salinity was reduced by 0.5 PSU, and urea concentrations reached a maximum of 5.5 µM N.
The annual rainfall in Sarasota Bay, calculated for the seven years proceeding this study, was 1080.5 mm yr−1, while the mean of the last 96 years was 1324.2 mm yr−1. An autonomous water quality buoy offshore of Sarasota Bay (http://comps.marine.usf.edu:81/) recorded average salinity values of 35.5 PSU during the deployment period. MARVIN sensors measured salinity values of 38.2 PSU during the first week of the deployment (17–24 June) and then declining values thereafter to a low of 34.7 PSU on 22 October. After 22 October salinity values rose to 36.1 PSU.

3.2. Phytoplankton Data

In the early part of the study only the settling chamber technique [60] was employed to examine the plankton community. Unfortunately, this methodology was not adequate for evaluating picoplankton populations. The subsequent use of epifluorescent microscopy [64] allowed for a more accurate assessment of the picoplankton community. Abundant picoplankton populations were detected when the water temperature was above 30 °C and declined when the water temperature dropped below 20 °C (Figure 4). Epifluorescent microscopy of picoplankton samples indicated that the Sarasota Bay picoplankton community was comprised of both prokaryotic and eukaryotic taxa. In September, when water temperatures exceeded 30 °C, the picoplankton community was dominated by picocyanobacteria (maximum concentration of 4.0 × 10⁷ cells L−1). On 2 October, total picoplankton concentrations of 2.40 × 10⁹ cells L−1 were observed at Station 3, with a coincident concentration of eukaryotic picoplankton at 1.51 × 10⁹ cells L−1. On 22 October, during the declining phase of the bloom (as indicated by Chl-a concentration), the total picoplankton concentration was 1.13 × 10⁹ cells L−1 and the eukaryotic picoplankton concentration was 7.94 × 10⁸ cells L−1. During the initial phase of the picoplankton bloom, when picocyanobacteria dominated, diatom concentration was lower and did not increase until the picoplankton community shifted to mix of both eukaryotic and prokaryotic taxa.

3.3. Urea Enrichment Experiments

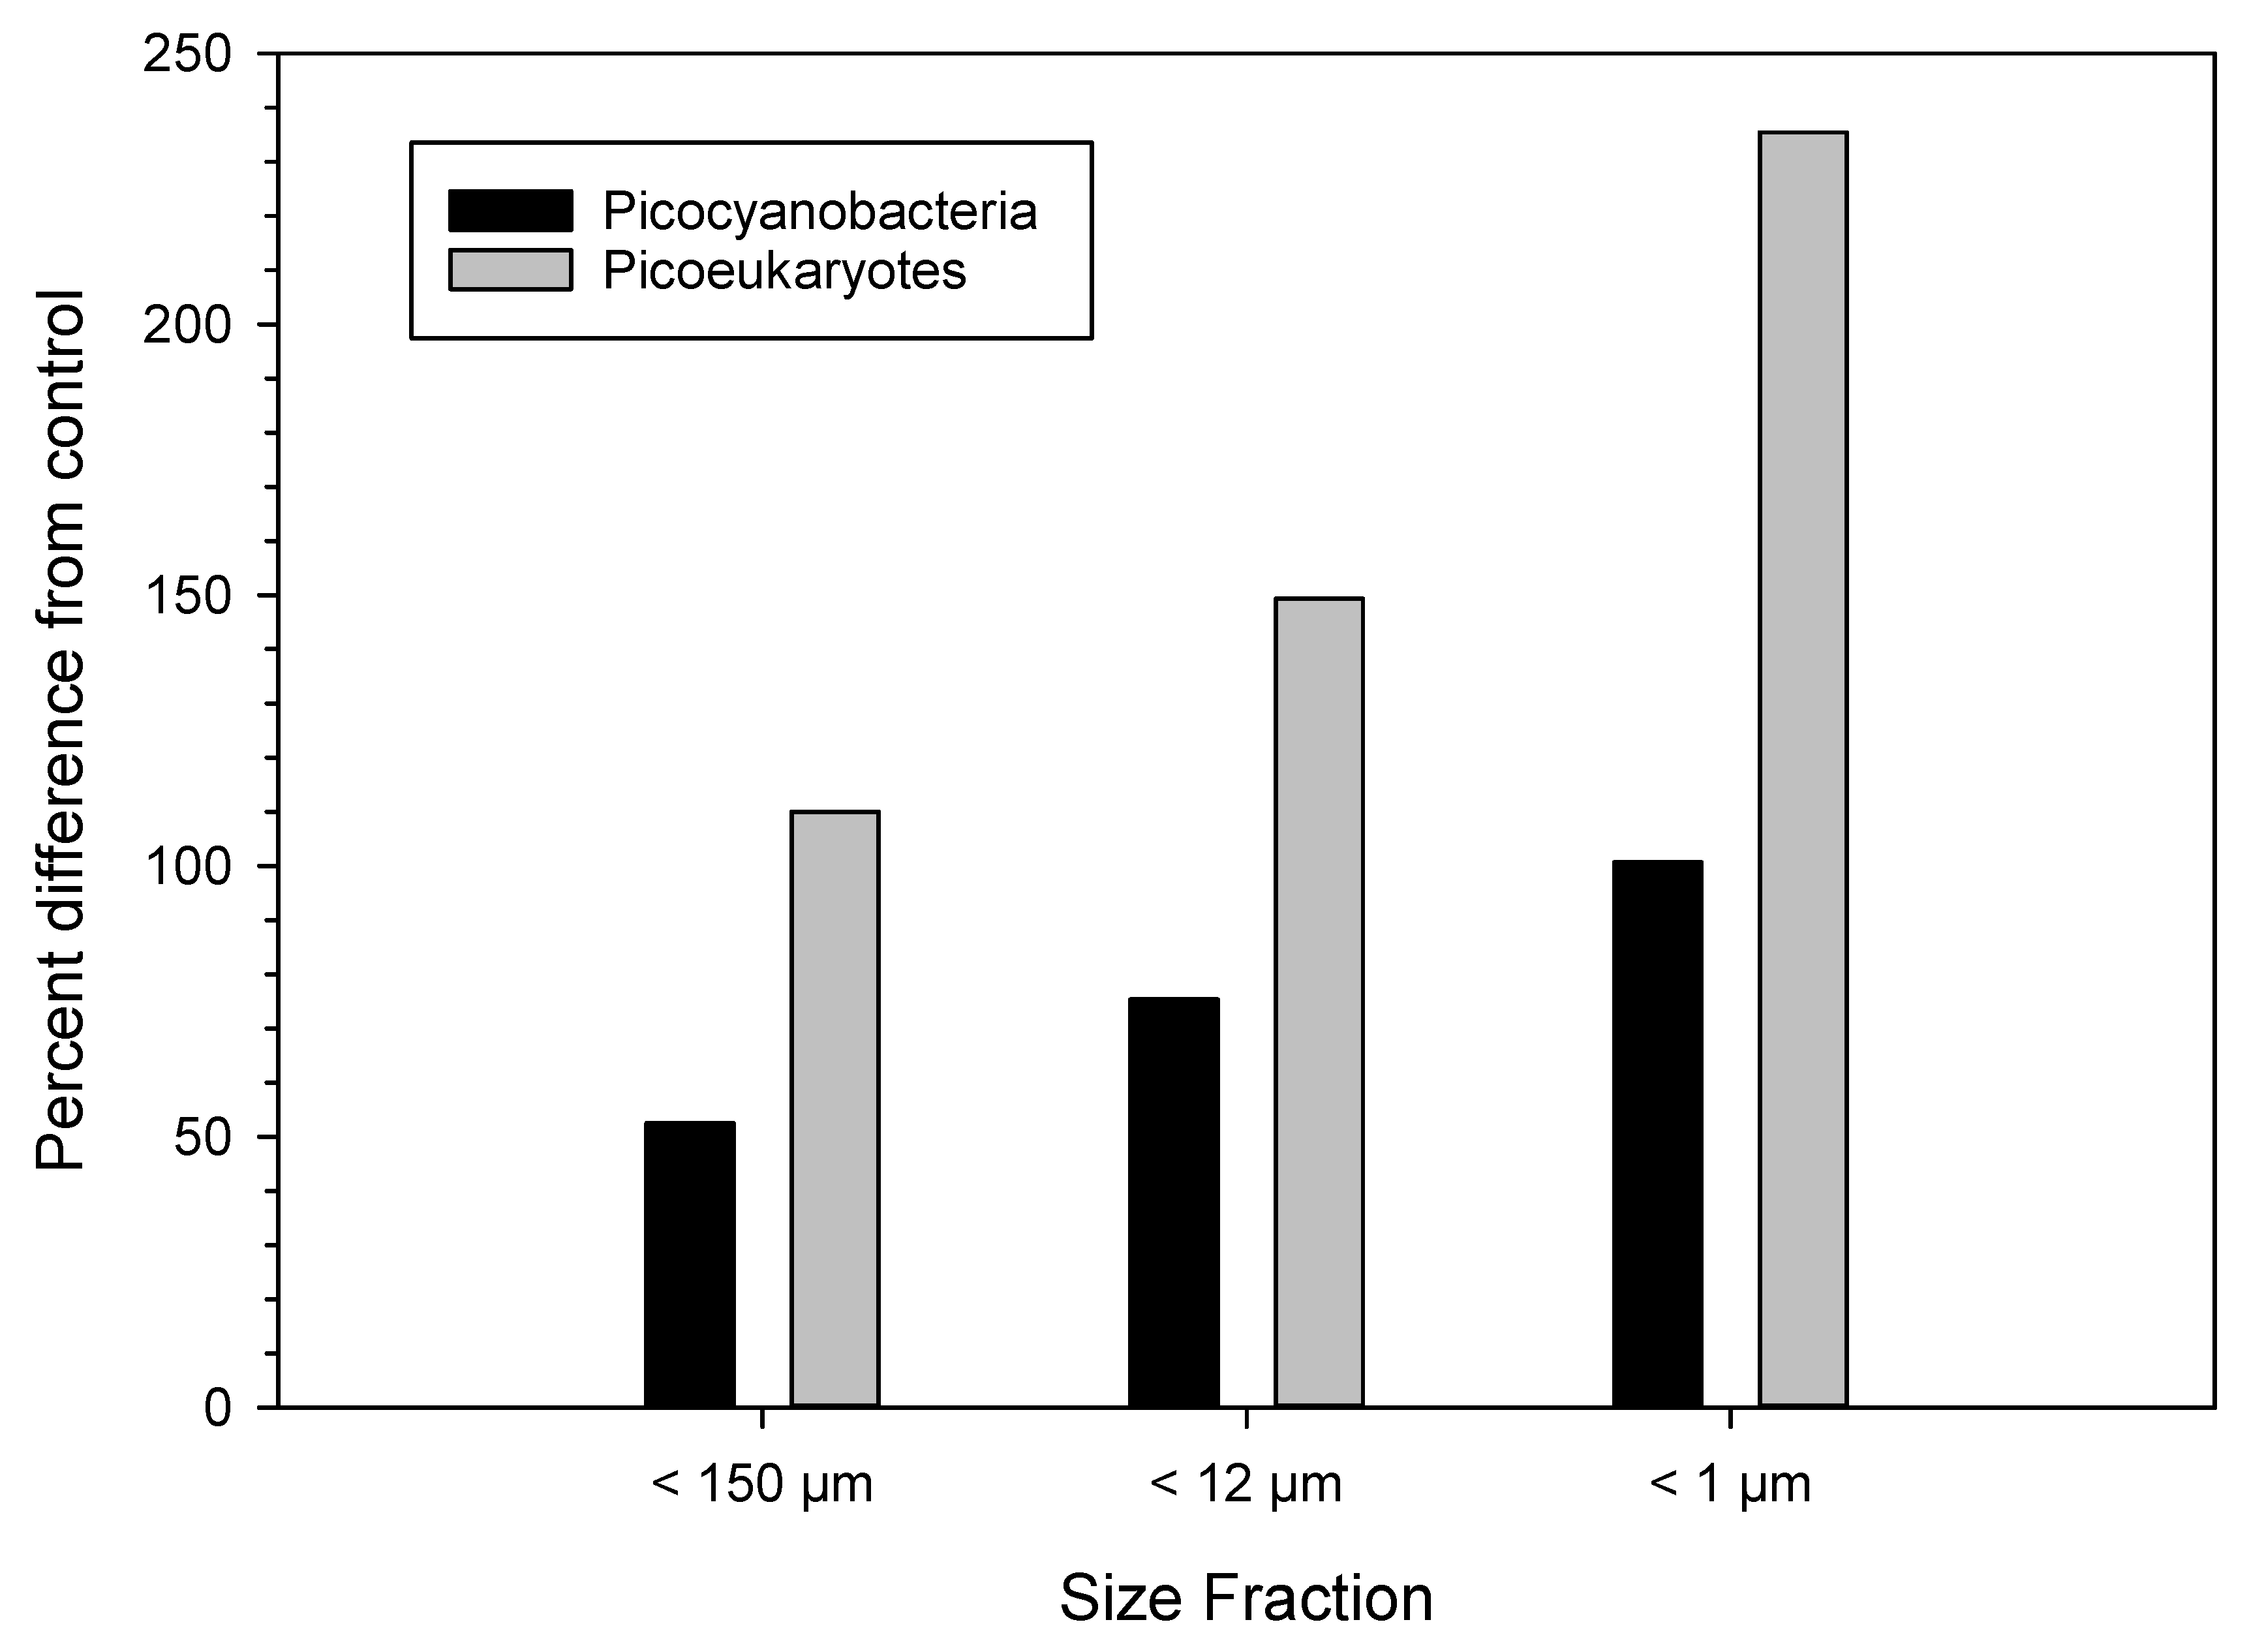
Results of the urea bioassays conducted with replicates of size-fractionated water samples (150 µm screened, <12 µm, <1 µm; n = 6) from the 2 October bloom are presented in Figure 5. These samples were used to determine the effect of a 1 µM urea addition during a three-day incubation period. All three size-fractionated water samples exhibited increases in the cell concentrations of both picocyanobacteria and picoeukaryotes in the urea enriched samples compared to the control. Increases were greater in the smaller size-fractionated water samples and the picoeukaryotes exhibited greater increases in cell concentrations within these smaller fractions, approximately double those of the picocyanobacteria.

3.4. Discrete Sample Data

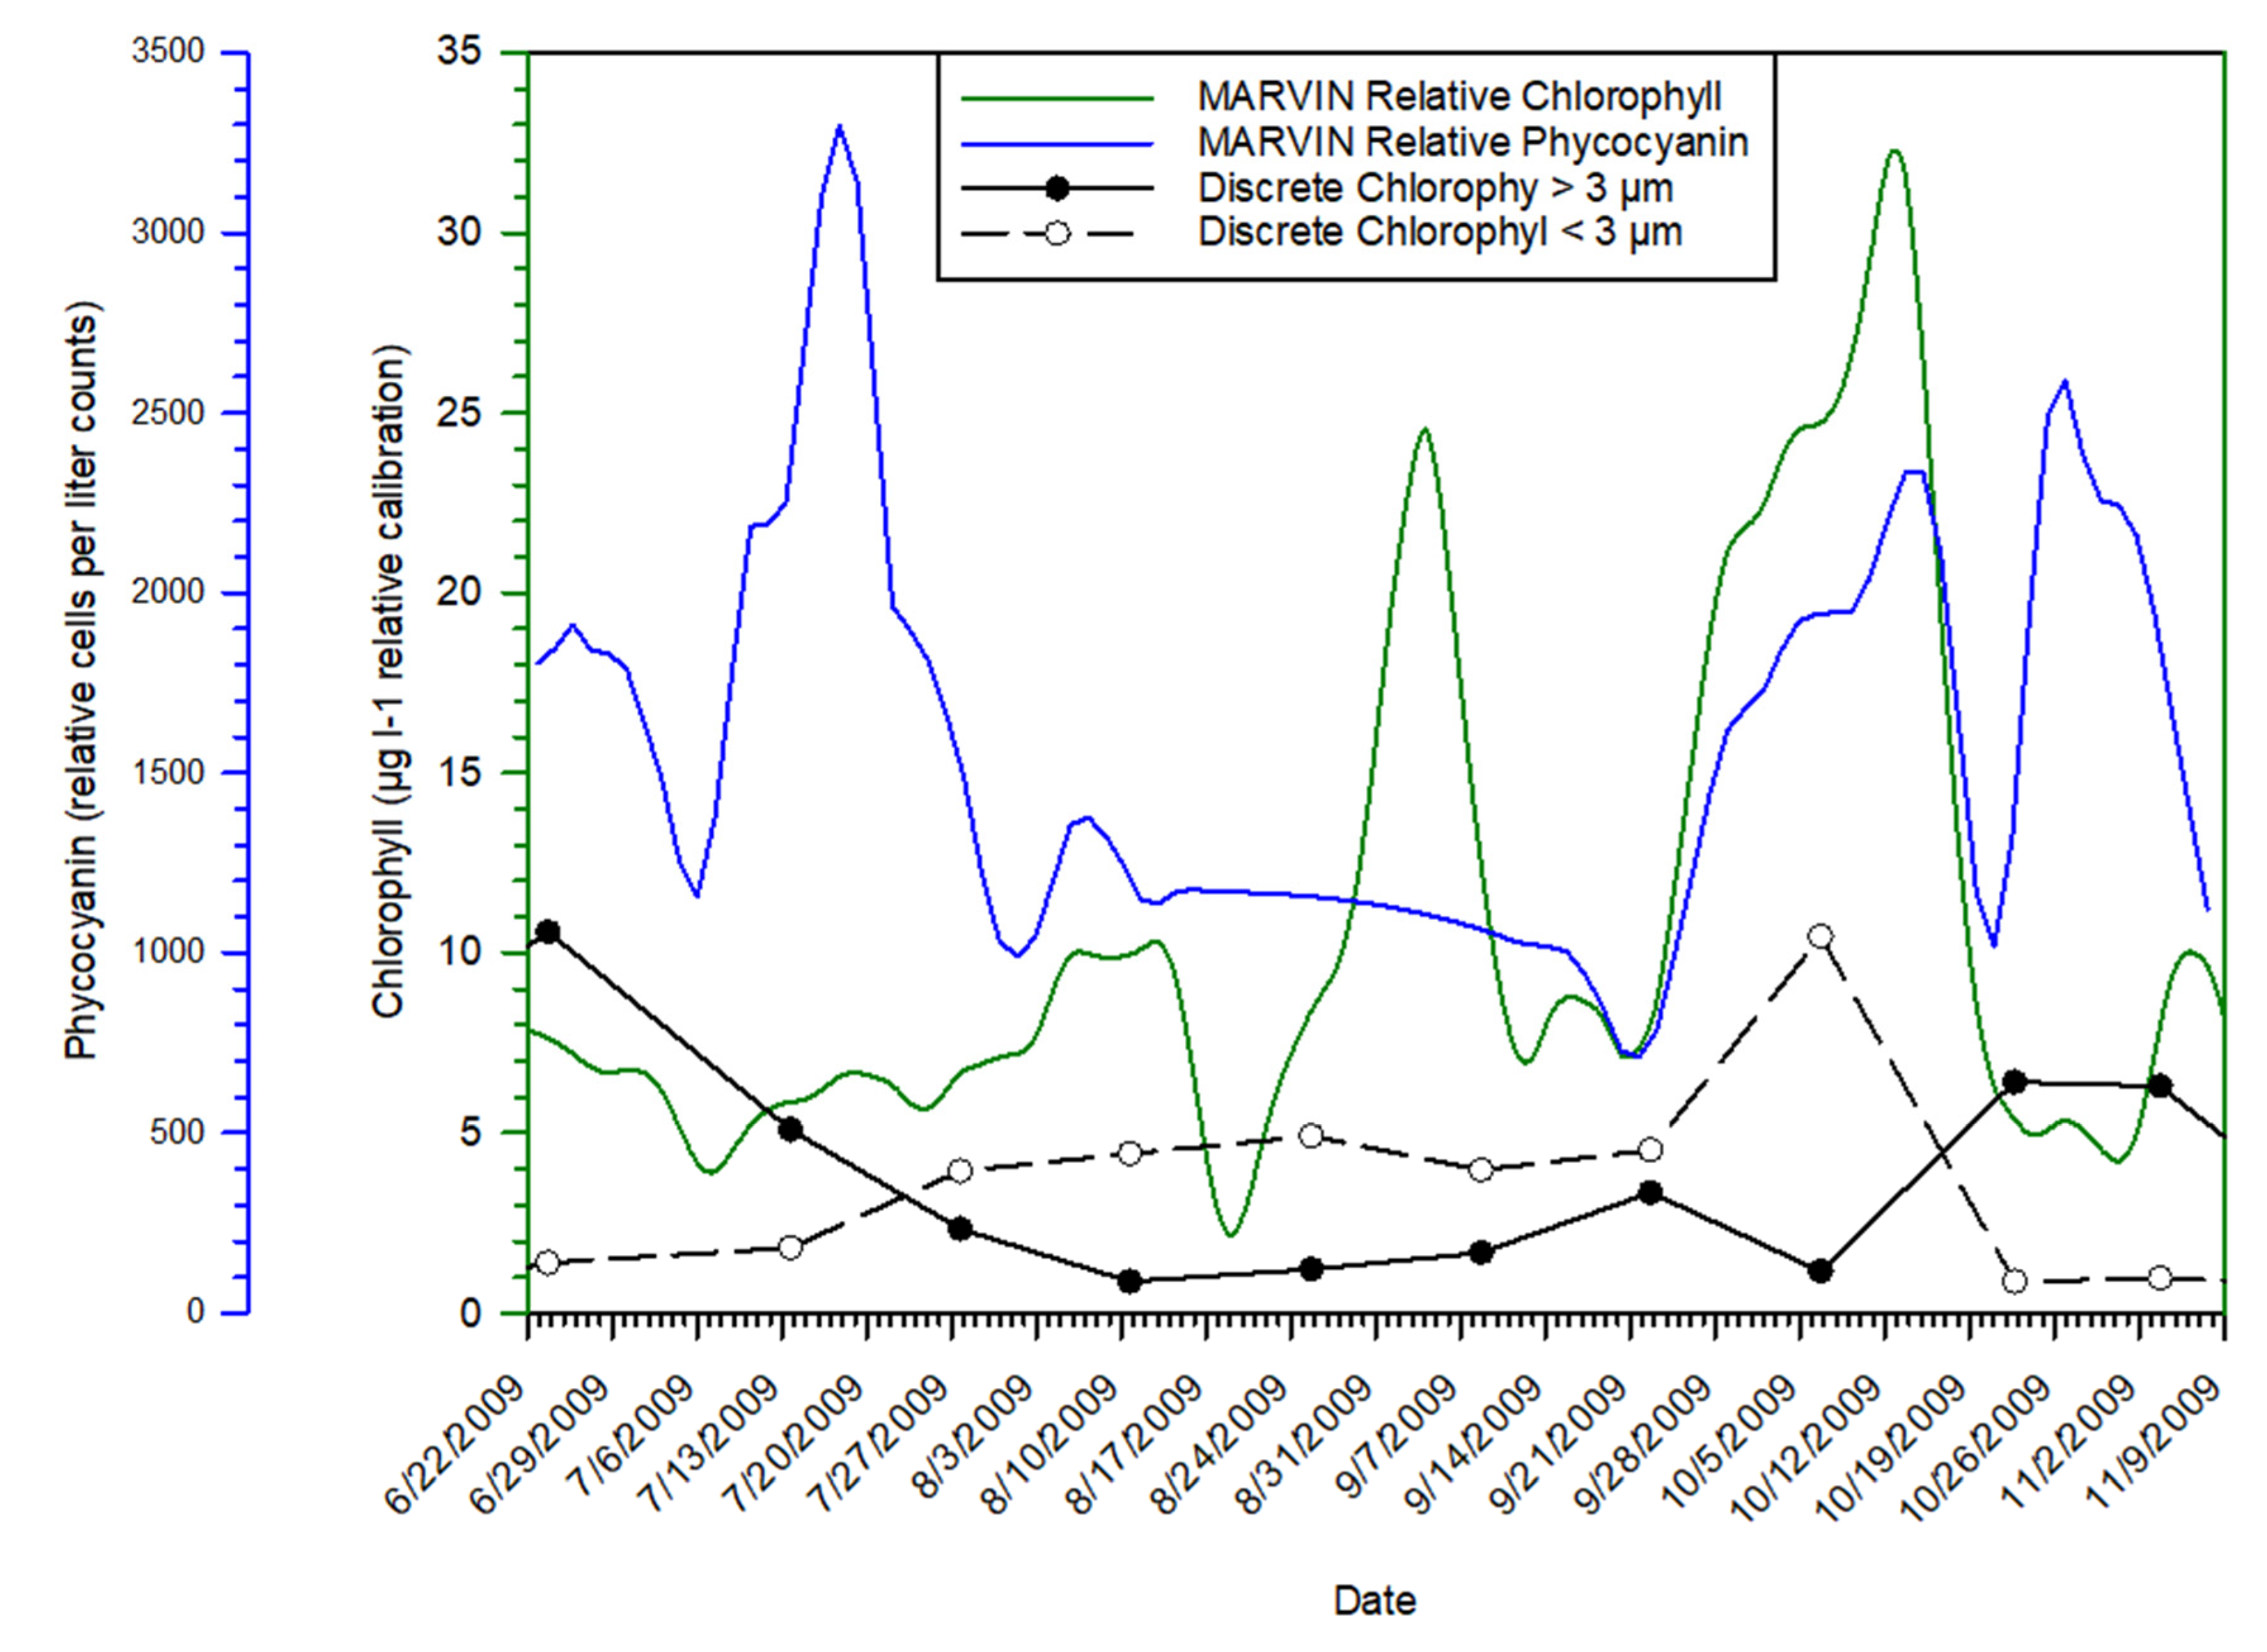
A comparison of biweekly size-fractionated Chl-a data and the MARVIN Chl-a fluorescence sensor data indicated that only one Chl-a maximum was captured by the discrete biweekly in situ sampling which began on 16 June (Figure 6). Beginning on 27 July the <3 µm Chl-a size-fraction was greater than the >3 µm fraction. This coincided with a decline in salinity and increase in urea concentrations immediately prior to the first observed Chl-a peak. This change in Chl-a fraction dominance also followed a large peak in phycocyanin fluorescence (an indicator of cyanobacteria) on 17 July. The maximum difference between the two fractions was 1.16 µg L−1 for the >3 µm fraction and 10.47 µg L−1 for the <3 µm size-fraction on 2 October, which occurred during the bloom period. Phycocyanin fluorescence also indicated a peak that mirrored the shape of the Chl-a fluorescence peak during the October 2009 bloom. The phycocyanin sensor was not available between 10 August and 17 September but exhibited a peak of 3300 relative cells L−1 on 17 July when Chl-a fluorescence was low and when the <3 µm Chl-a concentration first increased above the >3 µm fraction in value.
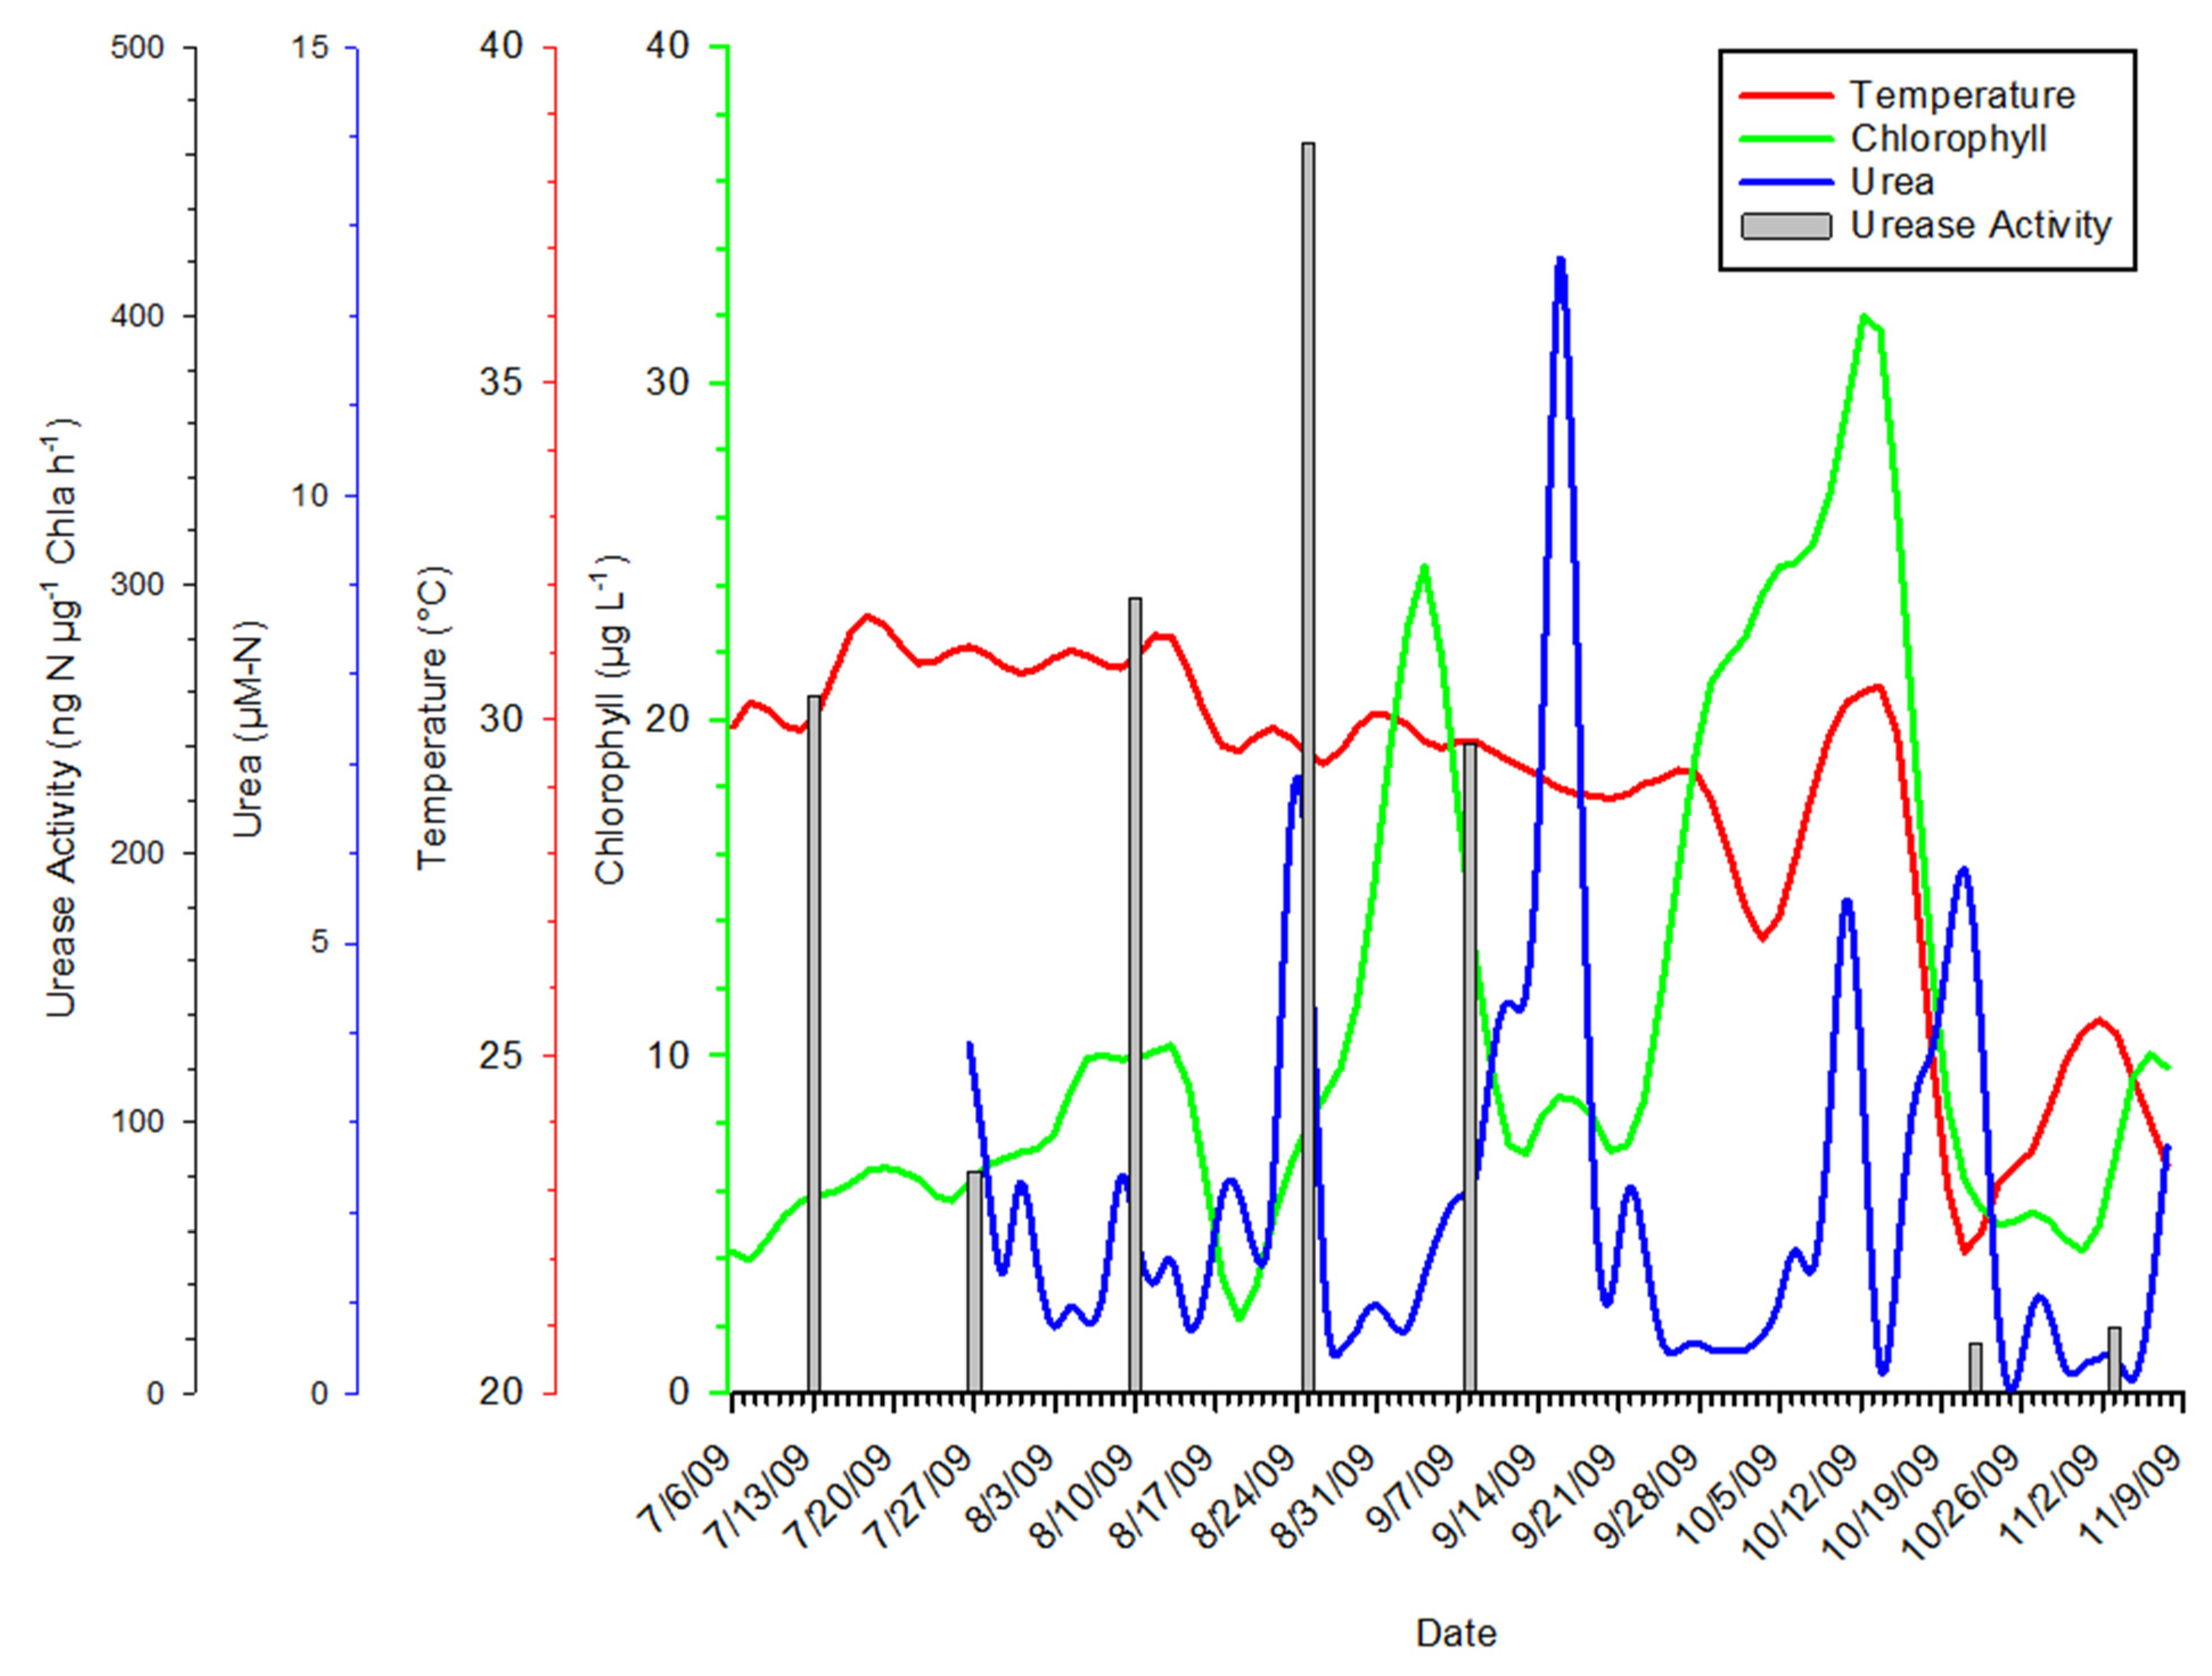
Water samples exhibited high urease activity in the summer coincident with higher water temperatures and low urease activity in the fall after the water temperature declined (Figure 7). Urease activity had a value of 259.01 ng N µg Chl-a−1 h−1 on 13 July, coincident with a phycocyanin fluorescence value of 2200 relative cells L−1. Urease activity was also elevated during the next three biweekly sampling periods, but due to the phycocyanin sensor failure there are no comparative data available. The urease activity on 10 August and the subsequent two biweekly sampling events coincided with increased urea concentrations, peaking at 241 ng N µg Chl-a−1 h−1 on 8 September. Urease activity declined in October after a 3 °C drop in water temperature, despite elevated urea concentrations. Although water temperature rapidly increased to just above 30 °C and phycocyanin fluorescence values were coincidentally high in early October, the urease activity was low. A second fall urea peak was detected on 20 October. During this time urease activity and Chl-a fluorescence values were low while phycocyanin fluorescence was high.
Dissolved inorganic nitrogen concentrations were generally low throughout the MARVIN deployment; NO3 concentrations were all within one standard deviation of 0.63 ± 0.06 µM (Table 2). The NH4+ concentrations averaged 0.39 ± 0.34 µM, with a maximum of 1.42 µM NH4+ following the first phycocyanin fluorescence peak on 27 July and a minimum of 0.07 µM during the October bloom period. Concentrations of PO4 were generally low, <0.05 ± 0.03 µM, with a maximum of 0.13 µM on 22 October during the bloom. PO4 concentrations were 0.01 μM or below the detection limit preceding the start of the wet season in June. The concentration of SiO4 was 14.82 ± 10.63 µM with a peak of 29.79 µM on 8 September and a minimum of 2.29 µM on 22 October.
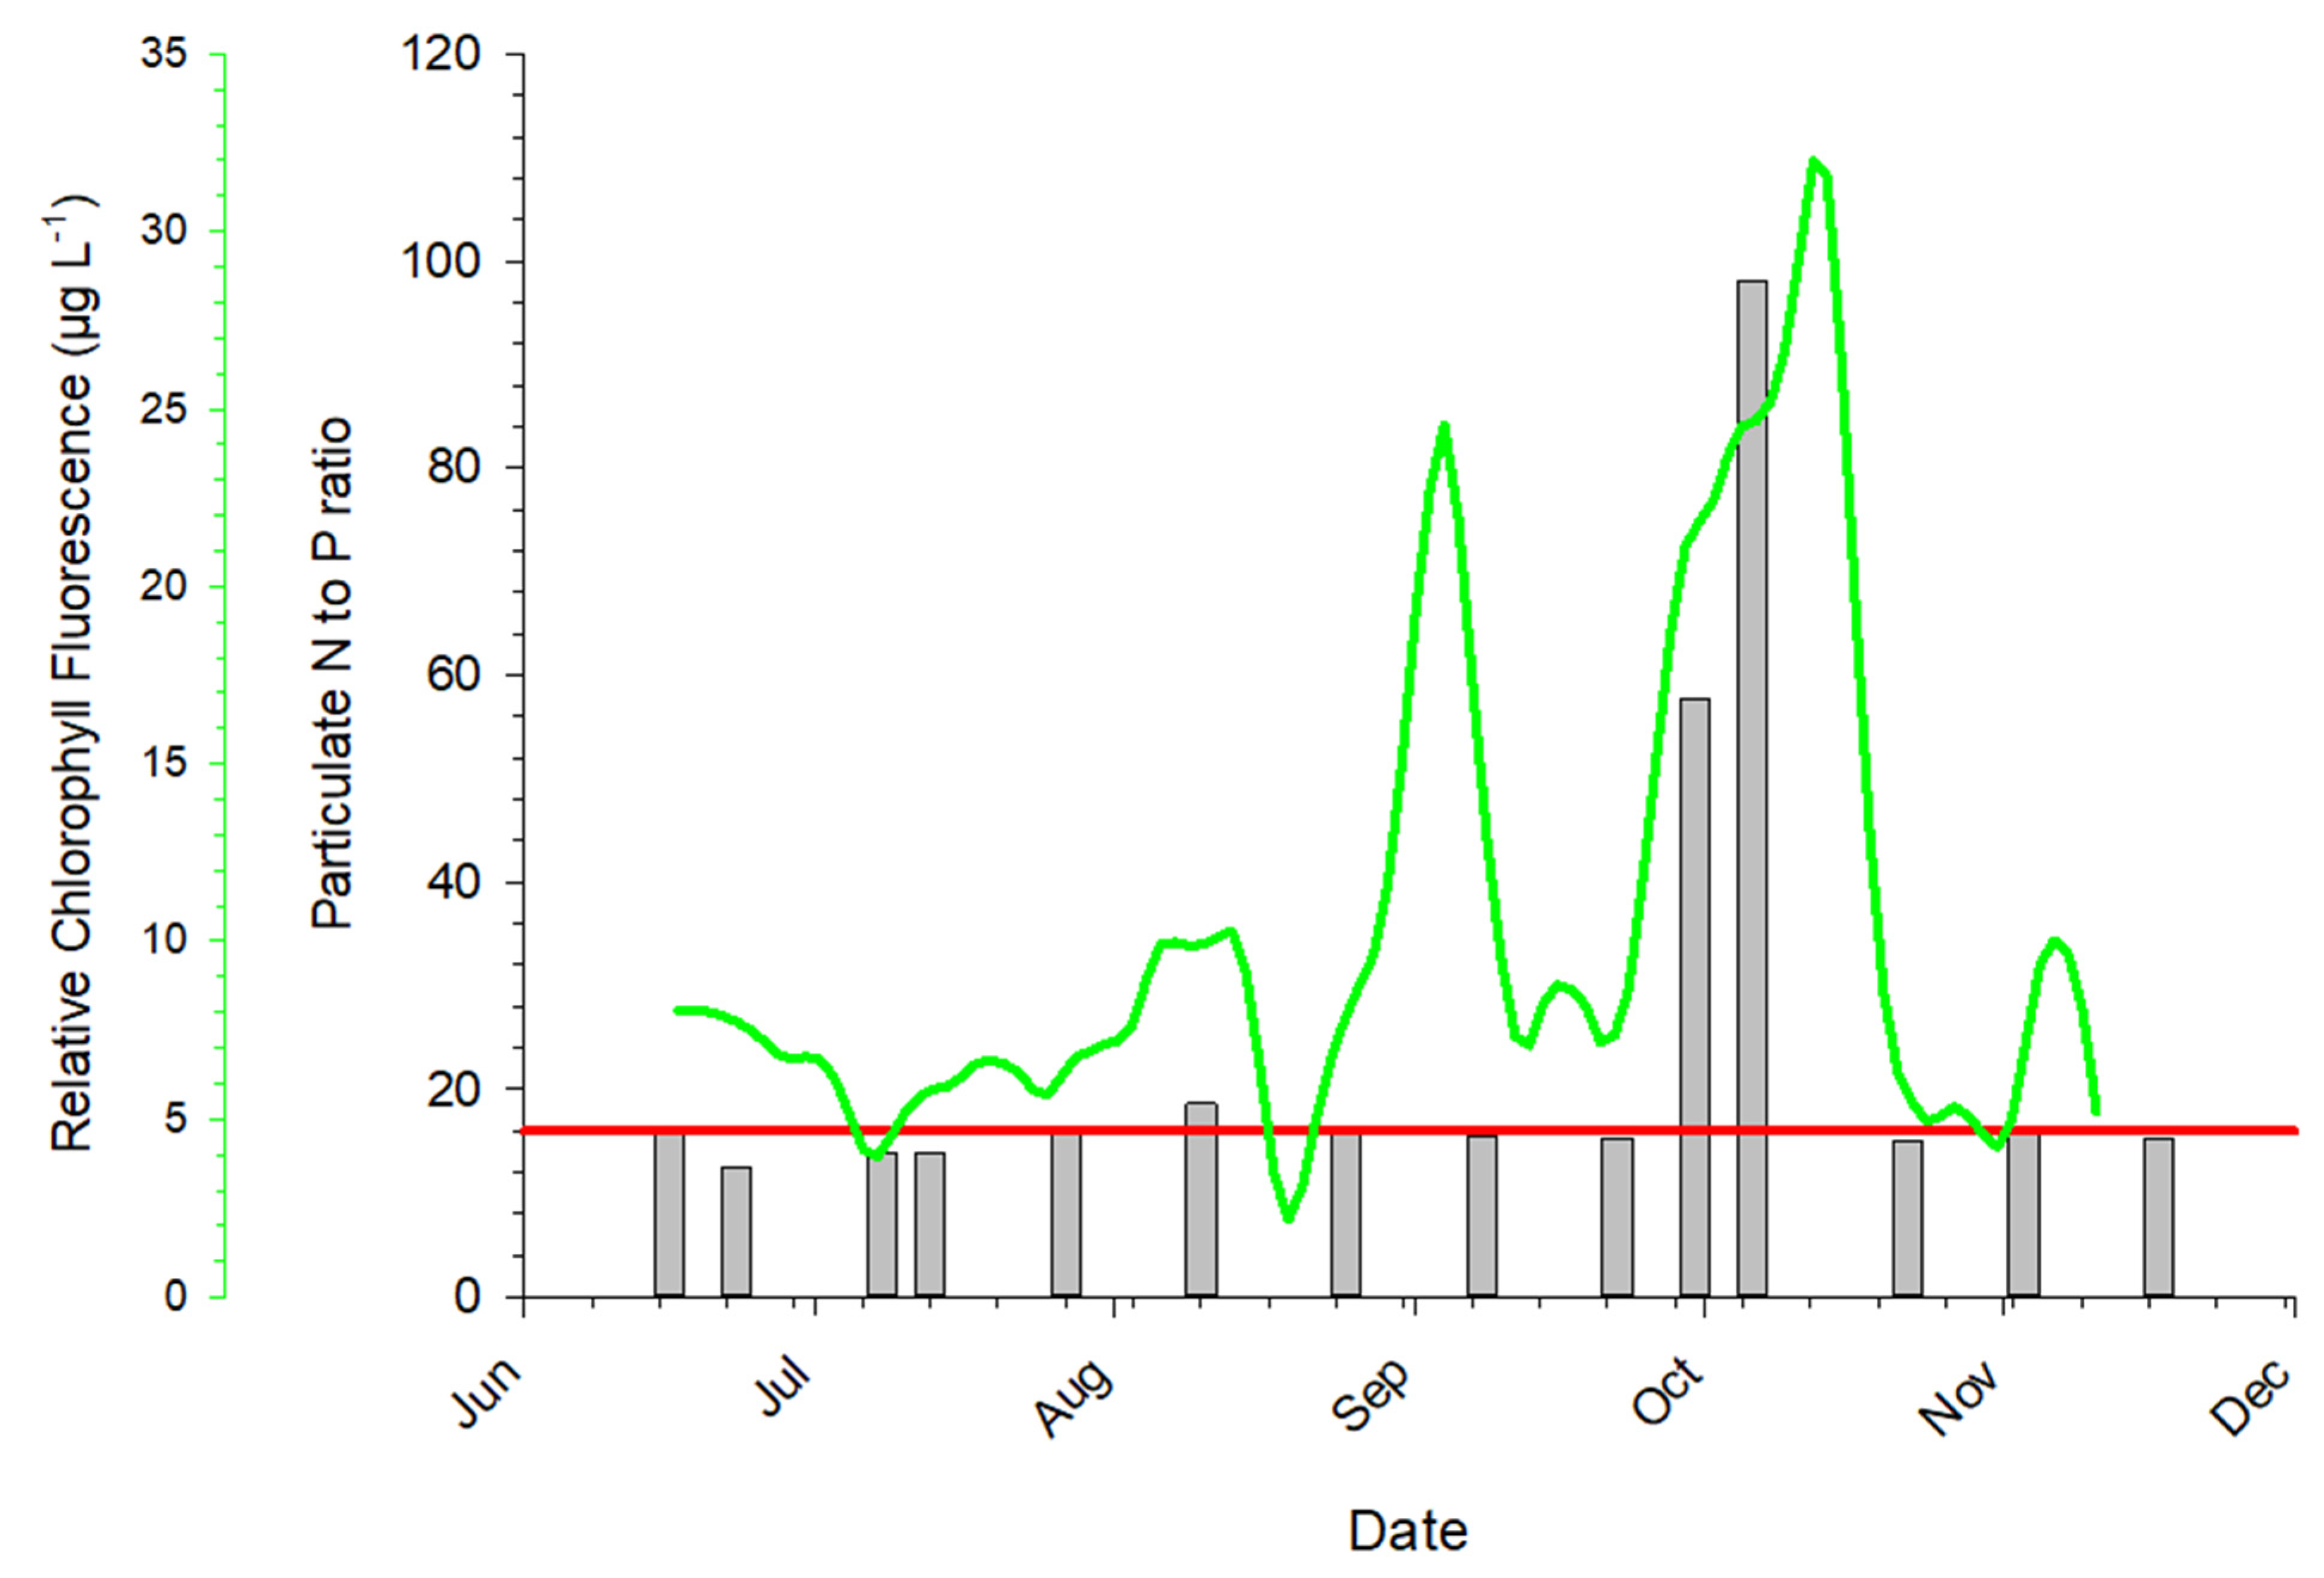
Organic and particulate nutrient concentrations exhibited high variability at the MARVIN site (Table 2). TDN values averaged 24.78 ± 3.00 µM with maximum values of 30.70 µM on 30 September and 30.74 µM on 3 November. DOP values averaged 0.48 ± 0.23 µM with maximum of 1.06 µM on 13 July and a minimum of 0.05 µM on 6 October, corresponding to the picoplankton bloom. This low DOP concentration resulted in a DON:DOP ratio of 462.0 during the October bloom period. The average values of particulate C, N, and P were 101.43 ± 30.59 µM, 12.55 ± 2.92 µM, and 0.69 ± 0.22 µM, respectively. Excluding the period during the late October picoplankton bloom, the particulate N:P ratio was 15.35 ± 1.49 (Figure 8). During the late September to early October bloom the ratio was 57.64, with a maximum value of 98.11 on 6 October.

3.5. Abiotic Data Relationships to Urea Concentrations

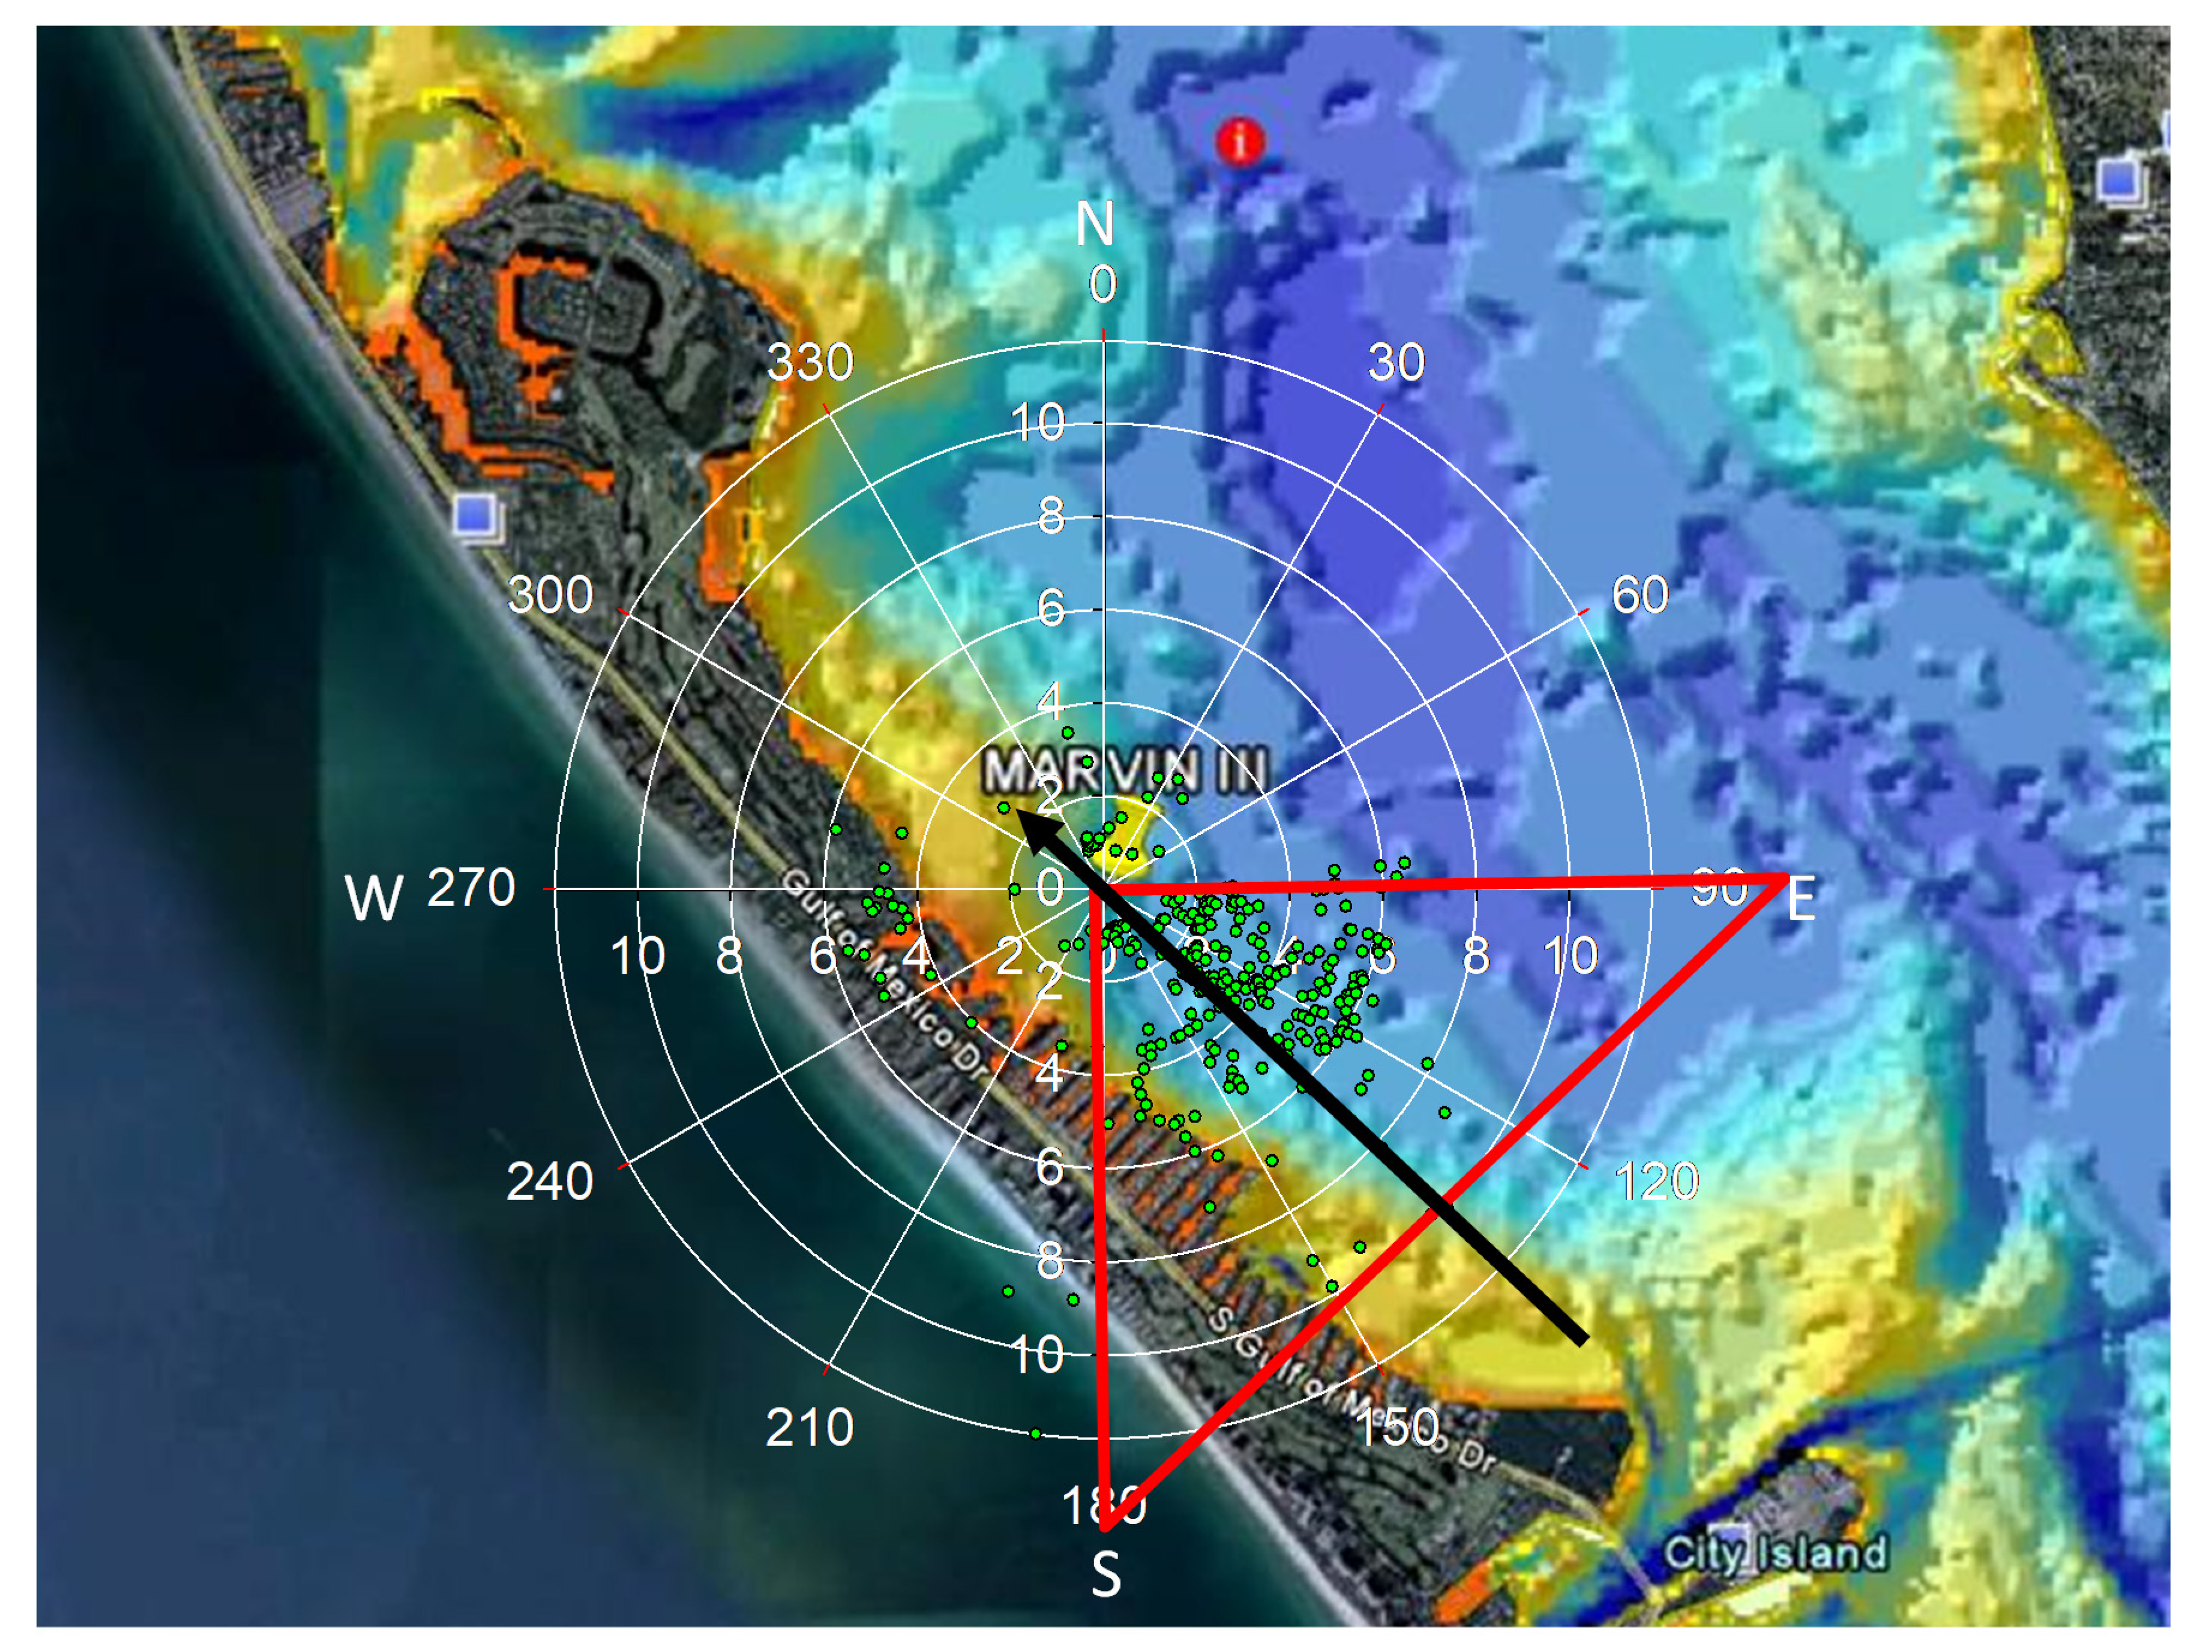
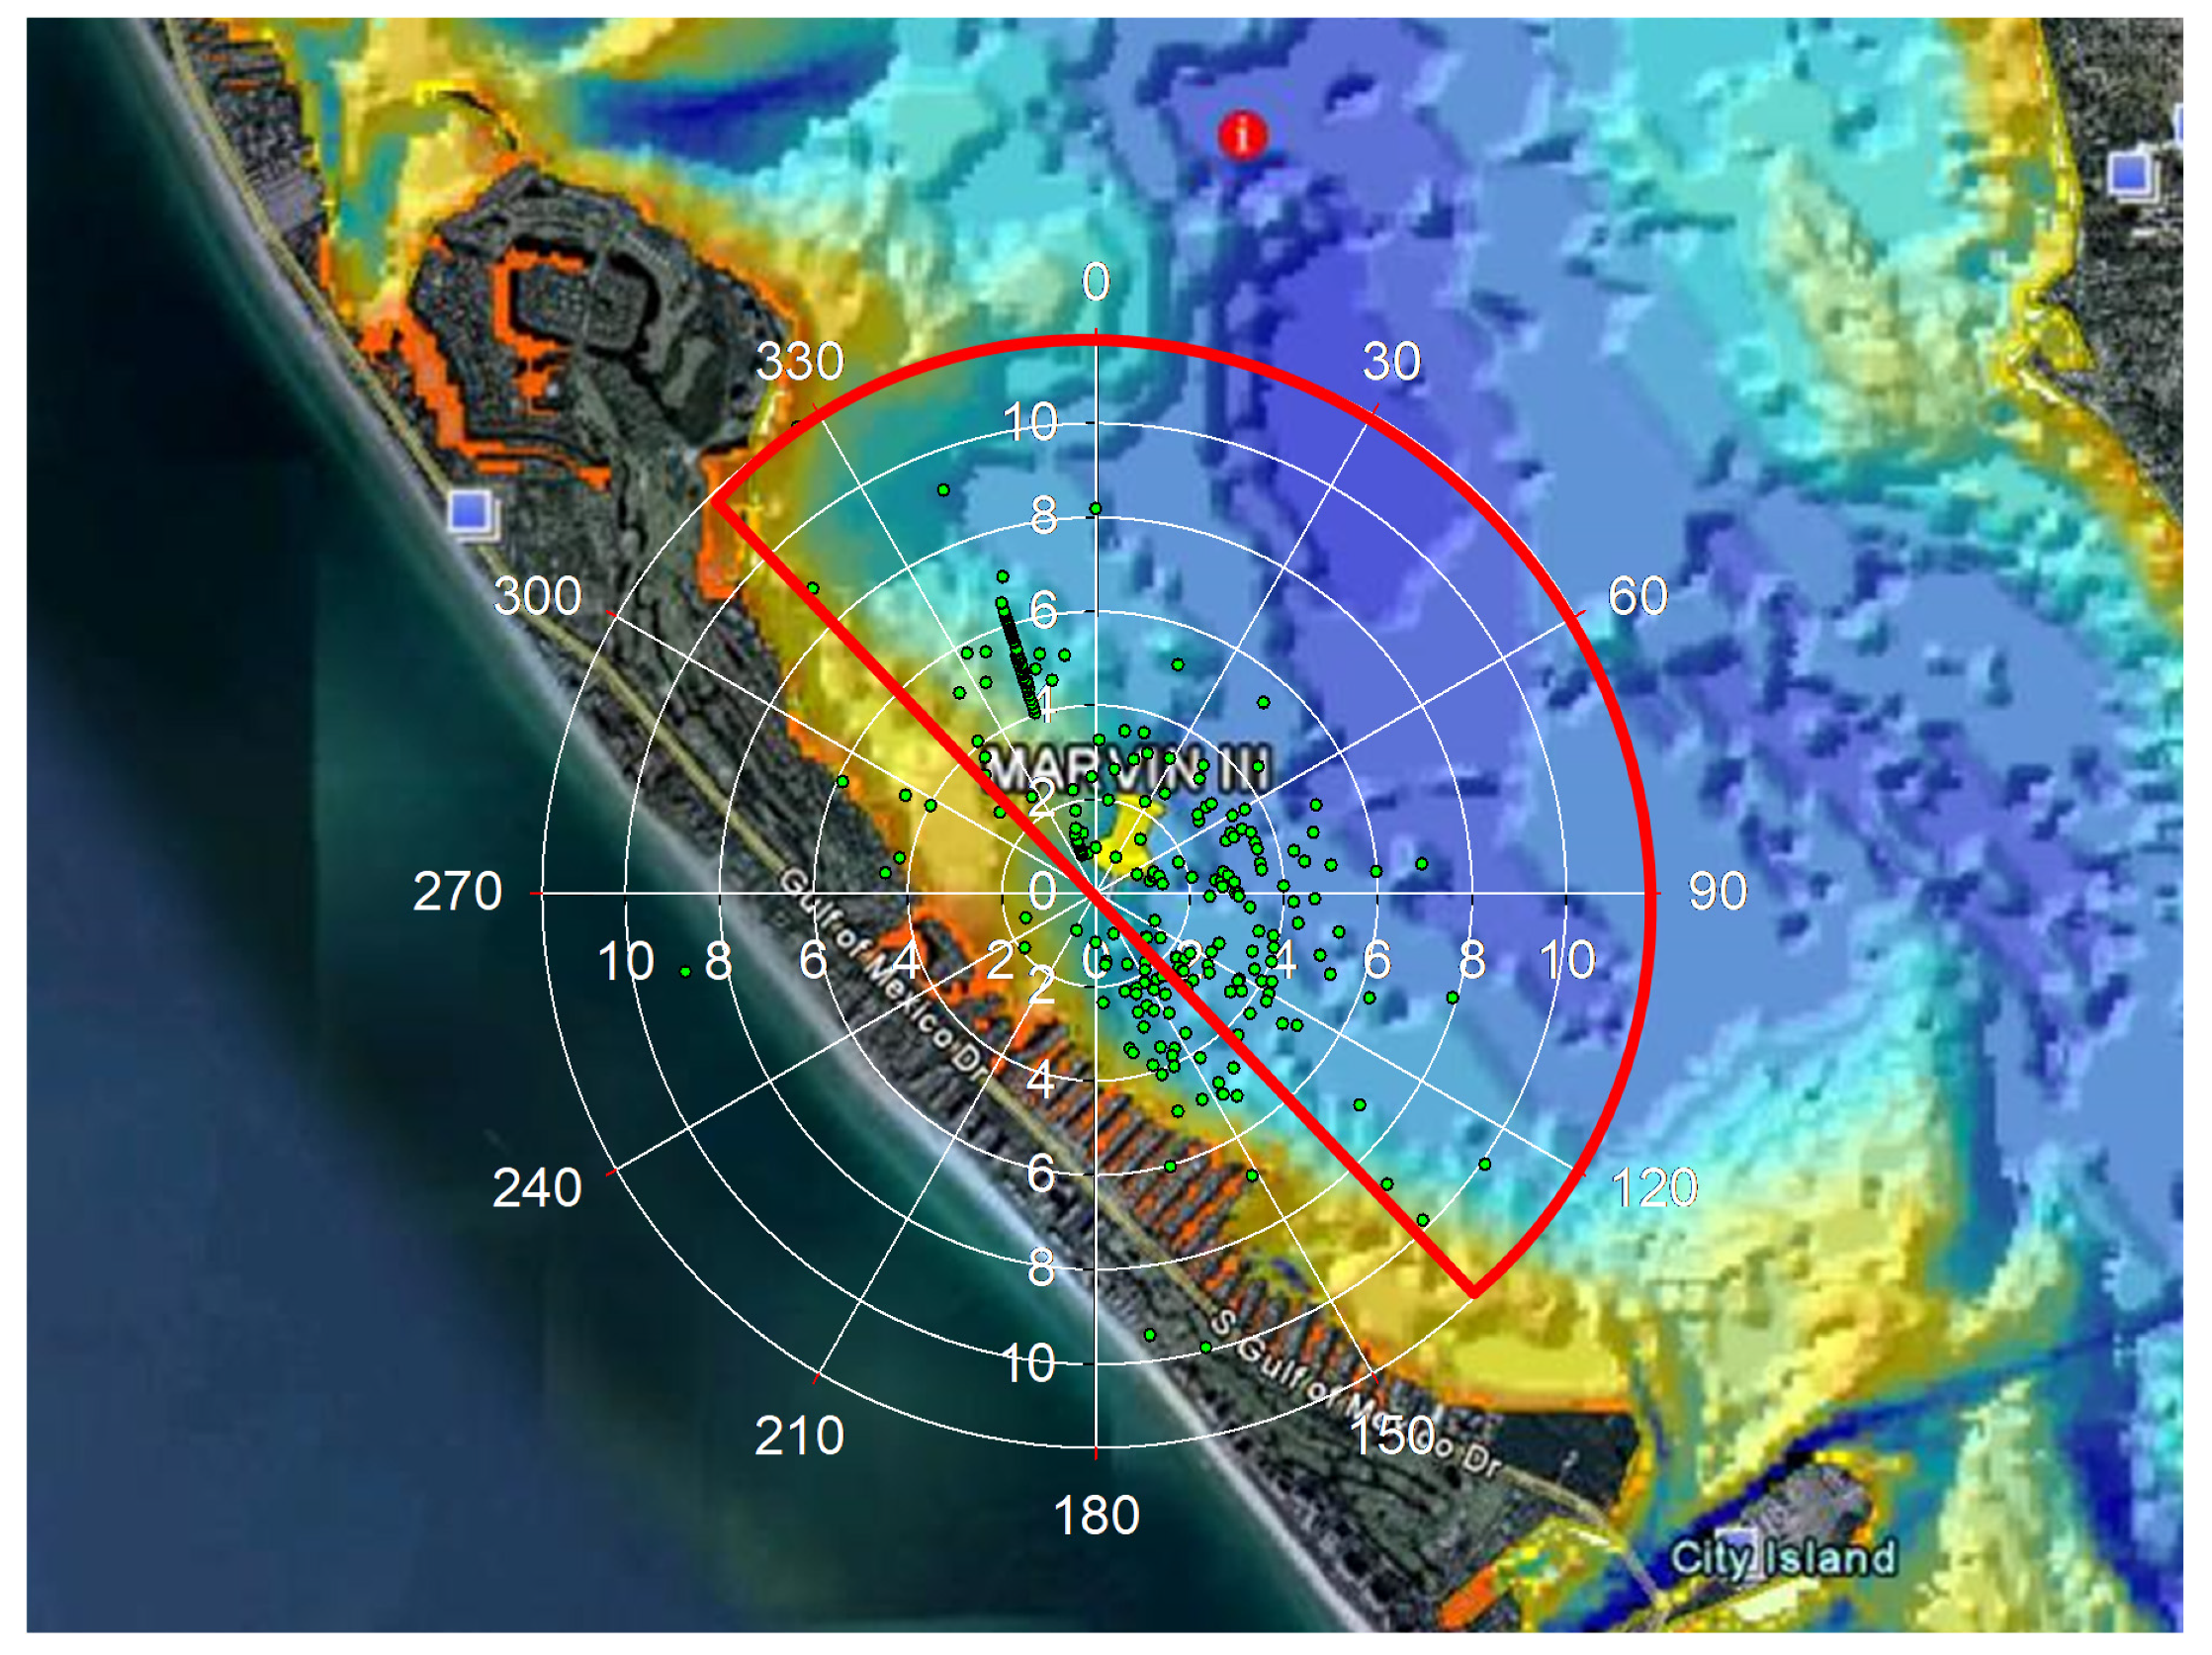
The physical data at the MARVIN site covaried with urea concentrations outside of the salinity values. The data were filtered to remove values above 20 µM N urea concentrations since these exceeded the manufacturer stated concentration range of the instrument. The median values of the resulting urea data were 0.83 µM N. A preliminary nonlinear regression analysis indicated there was a three-day lag between peak urea concentration values and decreases in salinity, so a filter was created to include only sample data collected when there was no rain in the previous 72 h and urea values above 0.83 µM N. Within this reduced data set, 78.2% of the values occurred when the wind direction was in a quadrant from 90° to 180° (Figure 9). A line heading at 133° was found to be directly parallel to the shore off Long Boat Key near the MARVIN deployment site (Station 3). The current direction when the urea concentration was above the median value was ebbing in a direction >333° or less than 133° for 79% of the urea values above the median level (Figure 10).

4. Discussion

4.1. Species Composition Shifts

Three picoplankton blooms were recorded in Sarasota Bay during the 2009 MARVIN deployment. The first bloom occurred following a period of high rainfall in August. This was followed by a second bloom after a period of rainfall (September) and a third bloom at the end of the wet season period (October) (see Figure 2 and Figure 3). The first two blooms appeared to be fueled by organic N inputs, including high urea concentrations; however, the final and largest bloom occurred during a period of both increased organic nutrient inputs and phosphate limitation (as indicated by elevated DON:DOP and DIN:DIP ratios). Phycocyanin fluorescence data indicate that the first two blooms were dominated by picocyanobacteria taxa with high urease activity, while the last was co-dominated by picoeukaryote and picocyanobacteria taxa with low urease activity and high particulate N:P and DON:DOP ratios. Even within major picoplankton groups, different genera react differently to N- and P-limitation [73] and some picoplankton can alter their physiology/genotypic expression to align with ambient nutrient conditions [74,75]. The dominant dissolved N form may also play a role in selecting for certain plankton groups, with urea selecting for cyanobacteria, picoeukaryotes and dinoflagellates [28,76,77]. In southwest Florida shelf waters, Heil et al. [22] have shown that urea favors cyanobacteria and dinoflagellates (as indicated by pigments) while nitrate favors diatom dominance. In Florida Bay, urea uptake is positively correlated with the percentage of the phytoplankton community composed of the picocyanobacterium Synechococcus sp. [28]. The MARVIN data suggest that this relationship is happening on much shorter time scales then previously demonstrated, with phytoplankton community shifts occurring in response to pulsed urea inputs on a scale of days to weeks. This time interval may be outside the resolution of most traditional, discrete water quality sampling programs. Indeed, only one of the events captured by the MARVIN platform was evident in the coincident biweekly in situ sampling. Excluding times of K. brevis blooms, historically the phytoplankton community in this region has been dominated by small diatom species, such as Skeletonema costatum, Chaetoceros spp., and naviculoid pennates, and peridinin-containing dinoflagellates [78,79]. Future efforts to monitor the temporal trends in picoplankton and nutrient concentrations should aim to collect more discrete taxonomic data so more accurate community responses to changing environmental conditions can be assessed. In some cases, a combination of several techniques, such as the modified Utermöhl and epifluorescence microscopy techniques used in the current study, coupled with fluorescence measurements, may be needed to better document phytoplankton community composition.

4.2. Nutrient Fluxes

The period of high salinity recorded by the MARVIN platform coincided with an unusual period of drought for the region. Typically, South Florida has a seasonal pattern of less rainfall during the winter months followed by greater rainfall during the summer. However, rainfall preceding the deployment period was significantly lower than is typical for these months. The resulting lack of flushing and runoff may have caused an accumulation of organic matter on land or within canals, as was demonstrated by Hicks et al. [80] and Zieliński et al. [81]. When the more typical “rainy season” commenced in the summer, the first significant precipitation event increased flushing and resulted in increased urea concentrations in adjacent waters, which in turn increased in cyanobacteria concentrations (as indicated with phycocyanin fluorescence measurements). Intermittent pulses of high rainfall followed this initial event. The shifts in nutrient and salinity concentrations in the region of the MARVIN platform during these low rainfall events were likely exacerbated by the increasing urbanization of the Sarasota Bay watershed and the lagoonal nature of Sarasota Bay, which is shallow (average depth of 1.9 m, https://sarasotabay.org/sarasota-bay/), and lacks a major freshwater tributary. The atypical drought that occurred prior to the MARVIN deployment may have potentially magnified the effects of these episodic pulses of N inputs.
Orthophosphate and DOP are generally elevated in Southwest Florida coastal environments due to local P deposits within the karst bedrock layer and associated P mining activities in central Florida which can transport P to the coast via the regional rivers [82]. The particulate N:P ratio of 98 measured at the MARVIN site on October 6, however, suggests that P may be potentially limiting phytoplankton growth in this system during certain periods. Sarasota Bay has limited exchange with the Gulf of Mexico through three passes, one at the narrow northern end of the Bay and two at the southern end. Freshwater inputs into Sarasota Bay are limited since much of the freshwater available through creek tributaries is diverted for agriculture in rural regions of the watershed and landscaping within urban environments [83]. Using the Sarasota Bay Conditions Report [84] total N and P concentrations measured during the 2009 MARVIN deployment were compared to the historical annual means of Sarasota Bay waters. In 2009, TP concentrations were below the annual mean while TN concentrations were above the annual mean. Taken in combination, these data suggest that regions of low circulation within Sarasota Bay may be periodically P limited and respond to pulses of N with increases in growth of phytoplankton species such as picocyanobacteria that are physiologically adapted to take up urea under low P concentrations, as has been demonstrated in the marine environment by Smith [85], Moore et al. [74], and Lin et al. [75].

4.3. Response to Urea Pulses

Each time there was an observed maximum in urea concentration as the result of rain-driven runoff events, Chl-a concentrations increased in response within a week. While the limited urea enrichment experiment conducted with ambient phytoplankton communities from the MARVIN site confirmed that urea inputs can result in both picocyanobacteria and picoeukaryote growth over a three-day period, the long-term impacts of urea additions were not evaluated with laboratory studies. The lag period between the urea maximum and the observed Chl-a peak in field measurements may indicate that urea is not always the preferred N source for these populations, or a shift in the dominant picoplankton species occurred that were not adequately identified during the course of this study with the binning method utilized.
Abiotic factors such as wind also influence the urea cycle in Sarasota Bay by driving the movement of water in and out of the smaller “finger canals” that line much of the shoreline. “Finger canals”, like those in the area where the MARVIN platform was moored, have high residence times [46,86] and thus may serve as DON reservoirs [80]. In Sarasota Bay, when wind direction is perpendicular to the mouth of these canals, nutrient-rich water from the canal is flushed into the Bay. The accumulation of DON within these canals on Long Boat Key, adjacent to the MARVIN site, may be related to the extensive use of fertilizers in the surrounding residential areas and golf courses to maintain landscaping, as urbanization has been demonstrated to cause of nutrification in coastal waters throughout the U.S. [3,4,5,12].
Whether the observed episodic picoplankton blooms are a normal occurrence in Sarasota Bay or whether they are enhanced by the urea inputs from the “finger canals” is not clear. In 2013, Cannizzaro et al. [87] documented a shift in the plankton community from dinoflagellates to picoplankton following autumnal rain events in Old Tampa Bay, a similar heavily urbanized, shallow waterway immediately north of Sarasota Bay. The Sarasota Bay data suggest that changes in the timing of the wet/dry season can affect the magnitude, duration, and potential speciation of local algal bloom events. Scenarios that alter regional weather and rain patterns are likely to occur in the near future [52] and several other authors (e.g., O’Neil et al. [88], Paerl et al. [5,89], Gobler et al. [90], Trainer et al. [91]) have suggested that this will intensify HABs in both concentration, duration, and toxicity, necessitating more robust HAB monitoring systems. It may be that lower precipitation during the winter months, followed by higher precipitation in the spring/summer/fall season make high concentration picoplankton blooms a more common occurrence. A shift from a base autotrophic community of diatoms to picoplankton blooms has already occurred, with deleterious impacts on seagrasses and sponges in Florida Bay [92,93,94,95]. Śliwińska-Wilczewska et al. [53] have shown that picocyanobacteria, which at times made up a majority of the phytoplankton community in Sarasota Bay, can produce allelopathic compounds that alter phytoplankton community structure. Picocyanobacteria can also produce secondary metabolites that negatively impact other algae and the production of these metabolites is influenced by nutrient availability [54]. We noted that during blooms dominated by picocyanobacteria diatom concentrations were lower; however, the presence of allelopathic compounds was not measured during this study. The ability of many picoplankton populations to thrive in elevated water temperatures [54,74] presents an additional challenge to resource managers trying to improve or maintain water quality under increased coastal eutrophication and global climate change pressures.

4.4. Possible Urea Sources

While P inputs are likely to continue due to changes in hydrology and transport from the P-rich central Florida region, the increase in urea concentrations within Sarasota Bay may arise from the use of timed-release fertilizers that utilize urea as a N source. Given the shallow depth of and high DON concentrations present in Sarasota Bay (e.g., maximum of 29.49 µM during this study), it is possible that DON may be susceptible to photodegradation. Urea is a labile component of the DON pool [96] with a turnover time of days [97]. Because of local government “rainy season” bans on fertilizer use, many private citizens and lawn care companies have shifted to the application of urea-based timed-release fertilizers. Thus, the fertilizer ban may have actually increased the observed total N flux into Sarasota Bay during these rainy periods [98,99]. Urea breaks down over time into NO3 that is readily taken up by most phytoplankton. However, certain cyanobacteria and picoeukaryotes are able to take up and assimilate urea directly via the enzyme urease [34,35]. This competitive advantage may also result in population shifts from diatoms to picoplankton in local systems subject to transient urea inputs.

4.5. Mitigation

Using nitrogen stable isotopes, Dillon and Chanton [100,101] traced most N inputs into Sarasota Bay to stormwater runoff. Sarasota County has proactively tried to mitigate runoff into the Bay through wastewater system upgrades and the construction of swales and retention ponds; however, this may not be sufficient to completely prevent runoff [100,102]. Swales are grass lined shallow ditches that act as particle traps, while retention ponds allow particulates to settle out and nutrients to be taken up by local vegetation. If N and P compounds are being flushed at high rates and in high volumes into Sarasota Bay during major storm events, which have increased in south Florida by 33% over the past decade [103], then swales may not have time to sufficiently absorb these nutrients. While the retention ponds are designed to act as particle traps, they are also known reservoirs of HAB species and can act as conduits for HAB populations to move into larger bodies of water through tidal action and flooding [48,104]. In an effort to lessen the impact of failing septic systems on the Bay, Sarasota County initiated a septic tank replacement program in 2001. At the time of this study most of these septic tanks had been replaced [105] and a subsequent study by Lapointe et al. [50] demonstrated that this program reduced N pollution in Sarasota Bay by 64%. The location of most of the remaining septic tanks in the county are along Phillippi Creek, which outflows into Roberts Bay and does not supply freshwater inflows to Sarasota Bay. Despite these activities, the mitigation methods employed by Sarasota County may not impact the “finger canals” of Sarasota Bay’s shoreline, which are characterized by low flushing rates and long retention times that allow N constituents to accumulate during dry and low flow periods.

4.6. Potential Trophic Cascades

A shift to picoplankton dominance within Sarasota Bay could potentially impact the entire food web. Picocyanobacteria can produce compounds that are deleterious to resident aquatic flora and fauna and alter the existing phytoplankton community by impacting the photosystems of diatoms and chlorophytes [53,54,106]. Additionally, because of their small size, picocyanobacteria are considered less desirable food items than diatoms and chlorophytes and have been shown to have negative impacts on the nutrition, reproduction, and behavior of organisms at higher trophic levels [107,108]. Disruptions in the food web, which can start with alterations in picoplankton-microzooplankton grazing activities [109], can affect the quantity and distribution of higher trophic animals, such as popular estuarine sport fish like speckled trout or red fish, a reduction of which would have a negative economic impact on the region’s tourism industry [110,111]. The quality of important agricultural species, such as oysters and clams, of which Florida ranks as the 5th most productive region in the United States’ USD 1.5 billion aquaculture industry [112], would also likely suffer.

4.7. Autonomous Sampling

Like other recent studies, summarized in Stauffer et al. [113], the MARVIN platform deployment in Sarasota Bay demonstrates the importance of appropriate sampling intervals when studying the influence of episodic events on water quality. In the current study, discrete sampling at two-week intervals missed several episodic nutrient pulses and ephemeral picoplankton bloom events that were captured by the MARVIN instrumentation. Discrete station sampling was limited by a two-week sampling schedule and weather events, which included periods of high rainfall when sampling was not possible due to safety concerns (i.e., frequent high winds and lightning storms). Of equal concern is the possibility that one of these episodic events may have been captured by discrete sampling and subsequently considered representative of normal conditions. This has significant implications for the management of water quality within an estuary since either a significant event may be overlooked or an episodic event considered normal. High temporal resolution data from this autonomous platform, combined with a routine discrete sampling program that incorporated a large battery of measurements, provided for a more complete, temporally-relevant representation of episodic events, specifically the influence of pulsed urea inputs, their links to picocyanobacteria blooms, and the significance of these blooms to ecosystem health.

4.8. Conclusions

We observed through autonomous instrumentation that anthropogenic nutrient inputs influenced phytoplankton community biodiversity in Sarasota Bay, altering the dominant plankton group. The urea data collected during this study suggests that the seasonal fertilizer application ban in Sarasota County may have potentially increased the flux of urea into Sarasota Bay. These pulses of N, in the form of urea, combined with changes in geomorphology and nutrient inputs caused by the construction of extensive “finger canal” networks, may have resulted in increased nutrient storage within Sarasota Bay. Pulsed nutrient inputs into the Bay were observed during the study following anomalies in the region’s normal wet-dry seasons. With the predicted climate changes to Florida’s typical wet-dry seasons in the coming decades, phytoplankton community compositional shifts, such as we observed in Sarasota Bay, may become more frequent and lead to environmental conditions in which more toxic and longer lasting HABs occur. Regional resource managers should consider the role that alterations in N- versus urea-based fertilizers have played and will play in Sarasota Bay as the region undergoes further climatic anomalies that create conditions in which ecosystem-disruptive phytoplankton species can thrive.
As with any scientific endeavor, this study raised as many questions as it answered regarding phytoplankton dynamics in Sarasota Bay. Through this temporally limited study, physical drivers such as wind, temperature, and rainfall had a large influence on the phytoplankton community. A better understanding is needed of the localized effects of these drivers over an extended time period. Conducting research, such as that described here, over the course of several seasons within Sarasota Bay and other impaired tropical, urban lagoonal waters (e.g., Tampa Bay and Florida Bay) would provide the opportunity to examine how seasonal and climatic changes are influencing plankton community dynamics, especially since it has been noted by other researchers [33,114,115] that seasonal availability of N constituents can be a driver of population changes. A more detailed understanding of the role of both organic and inorganic N within shallow, subtropical bays is needed for management purposes. In Sarasota Bay, is urea a primary driver of the observed species composition shift, or just an indicator of higher DON concentrations? What species are involved in this shift in phytoplankton diversity? Is the observed shift becoming more common? All of these questions have implications for coastal water quality as well as ecosystem management, but they cannot be answered with the one season of data explored here. This study supports the need for high temporal resolution autonomous water quality data over a long monitoring period. Start up and maintenance costs are higher with autonomous water quality monitoring platforms compared to less frequent, less automated monitoring traditionally used by water quality monitoring programs. However, high resolution temporal sampling provides data on the influence of ephemeral events on the physical, chemical, and biological aspects of water quality that are crucial when making current and future resource management decisions, yielding a high return on investment.

Author Contributions

J.E.I. and C.A.H., designed the study. J.E.I., J.L.W., S.M.M., J.A.B., and A.A.P. conducted the field work and laboratory analyses. J.E.I. and C.A.H. analyzed the data. J.E.I., J.L.W., and C.A.H., prepared the original manuscript. All authors have read and agree to the published version of the manuscript.

Funding

Funding for this research was provided by the Florida Department of Environmental Protection, Florida Coastal Management Program through grants from the National Oceanic and Atmospheric Administration [NOAA] Office of Ocean and Coastal Resource Management Awards NA10NOS4190178, NA11NOS4190073 and NA19NOS4780183 to C.A.H. and Award NA06NOS4780246 to C.A.H. and J.E.I. C.A.H. would like to thank the Economous and Barancik Foundations for their generous support of the Red Tide Institute at Mote Marine Laboratory during the completion of this manuscript.

Acknowledgments

The authors are grateful for the assistance of the entire FWRI HAB group, especially April Granholm for her assistance with the field work, and John Ryan and Jon Perry of the Sarasota County Government for providing valuable datasets. We also thank Dave Millie and Gary Weckman for the time spent working with us on this grant. We especially appreciate the efforts of all the local residents who “monitored” the MARVIN platform during its deployment in Sarasota Bay. Two anonymous reviewers are acknowledged for thoughtful comments that helped to improve this paper. All data collected were under the auspices of the Florida Fish and Wildlife Research Institute which is under the government of the State of Florida. All data are subject to Florida Sunshine Law requests.

Conflicts of Interest

The authors declare no conflict of interest.

References

  1. Nixon, S.W. Coastal marine eutrophication: A definition, social causes, and future concerns. Ophelia 1995, 41, 199–219. [Google Scholar] [CrossRef]
  2. Bricker, S.B.; Clement, C.G.; Pirhalla, D.E.; Orlando, S.P.; Farrow, D.R.G. National Estuarine Eutrophication Assessment: Effects of Nutrient Enrichment in the Nation’s Estuaries; US National Oceanographic and Atmospheric Administration, National Ocean Service, Special Projects Office and the National Center for Coastal Ocean Science: Silver Spring, MD, USA, 1999; p. 71. [Google Scholar]
  3. Howarth, R.W. Coastal nitrogen pollution: A review of sources and trends globally and regionally. Harmful Algae 2008, 8, 14–20. [Google Scholar] [CrossRef]
  4. Bricker, S.B.; Longstaff, B.; Dennison, W.; Jones, A.; Boicourt, K.; Wicks, C.; Woerner, J. Effects of nutrient enrichment in the nation’s estuaries: A decade of change. Harmful Algae 2009, 8, 21–32. [Google Scholar] [CrossRef]
  5. Paerl, H.W.; Hall, N.S.; Peierls, B.L.; Rossignol, K.L. Evolving paradigms and challenges in estuarine and coastal eutrophication dynamics in a culturally and climatically stressed world. Estuaries Coasts 2014, 37, 243–258. [Google Scholar] [CrossRef]
  6. Howarth, R.; Anderson, D.; Cloern, J.; Elfring, C.; Hopkinson, C.; Lapointe, B.; Malone, T.; Marcus, N.; McGlathery, K.; Sharpley, A.; et al. Nutrient pollution of coastal rivers, bays, and seas. Issues Ecol. 2000, 7, 1–15. [Google Scholar]
  7. Smil, V. Enriching the Earth. In Transformation of World Food Production; Haber, F., Bosch, C., Eds.; The MIT Press: Cambridge, UK, 2001; p. 358. [Google Scholar]
  8. Anderson, D.M.; Burkholder, J.M.; Cochlan, W.P.; Glibert, P.M.; Gobler, C.J.; Heil, C.A.; Kudela, R.; Parsons, M.L.; Rensel, J.E.; Townsend, D.W.; et al. Harmful algal blooms and eutrophication: Examining linkages from selected coastal regions of the United States. Harmful Algae 2008, 8, 39–53. [Google Scholar] [CrossRef] [Green Version]
  9. Gowen, R.J.; Tett, P.; Bresnan, E.; Davidson, K.; McKinney, A. Anthropogenic nutrient enrichment and blooms of harmful phytoplankton. Oceanogr. Mar. Biol. 2012, 50, 65–126. [Google Scholar]
  10. Cloern, J.E. Our evolving conceptual model of the coastal eutrophication problem. Mar. Ecol. Prog. Ser. 2001, 210, 223–253. [Google Scholar] [CrossRef]
  11. Anderson, D.M.; Glibert, P.M.; Burkholder, J.M. Harmful algal blooms and eutrophication: Nutrient sources, composition, and consequences. Estuaries 2002, 25, 704–726. [Google Scholar] [CrossRef]
  12. Glibert, P.M.; Seitzinger, S.; Heil, C.A.; Burkholder, J.M.; Parrow, M.W.; Codispoti, L.A.; Kelly, V. The role of eutrophication in the global proliferation of harmful algal blooms: New perspectives and approaches. Oceanography 2005, 18, 196–207. [Google Scholar] [CrossRef] [Green Version]
  13. Glibert, P.M.; Trice, T.M.; Michael, B.; Lane, L. Urea in the tributaries of the Chesapeake and coastal bays of Maryland. Water Air Soil Pollut. 2005, 160, 229–243. [Google Scholar] [CrossRef]
  14. Burkholder, J.M.; Tomasko, D.A.; Touchette, B.W. Seagrasses and eutrophication. J. Exp. Mar. Biol. Ecol. 2007, 350, 46–72. [Google Scholar] [CrossRef]
  15. Paerl, H.W.; Otten, T.G. Harmful cyanobacterial blooms: Causes, consequences, and controls. Microb. Ecol. 2013, 65, 995–1010. [Google Scholar] [CrossRef] [PubMed]
  16. Berdalet, E.; Fleming, L.E.; Gowen, R.; Davidson, K.; Hess, P.; Backer, L.C.; Moore, S.K.; Hoagland, P.; Enevoldsen, H. Marine harmful algal blooms, human health and wellbeing: Challenges and opportunities in the 21st century. J. Mar. Biol. Assoc. UK 2015. [Google Scholar] [CrossRef] [PubMed] [Green Version]
  17. Glibert, P.M.; Harrison, J.; Heil, C.; Seitzinger, S. Escalating worldwide use of urea–a global change contributing to coastal eutrophication. Biogeochemistry 2006, 77, 441–463. [Google Scholar] [CrossRef]
  18. Switzer, T. Urea loading from a spring storm—Knysna estuary, South Africa. Harmful Algae 2008, 8, 66–69. [Google Scholar] [CrossRef]
  19. Cozzi, S.; Mistaro, A.; Sparnocchia, S.; Colugnati, L.; Bajt, O.; Toniatti, L. Anthropogenic loads and biogeochemical role of urea in the Gulf of Trieste. Sci. Total Environ. 2014, 493, 271–281. [Google Scholar] [CrossRef]
  20. Antia, N.J.; Harrison, P.J.; Oliveira, L. The role of dissolved organic nitrogen in phytoplankton nutrition, cell biology and ecology. Phycologia 1991, 30, 1–89. [Google Scholar] [CrossRef]
  21. Berman, T.; Bronk, D.A. Dissolved organic nitrogen: A dynamic participant in aquatic ecosystems. Aquat. Microb. Ecol. 2003, 31, 279–305. [Google Scholar] [CrossRef]
  22. Heil, C.A.; Revilla, M.; Glibert, P.M.; Murasko, S. Nutrient quality drives differential phytoplankton community composition on the southwest Florida Shelf. Limnol. Oceanogr. 2007, 52, 1067–1078. [Google Scholar] [CrossRef]
  23. Killberg-Thoreson, L.; Mulholland, M.R.; Heil, C.A.; Sanderson, M.P.; O’Neil, J.M.; Bronk, D.A. Nitrogen uptake kinetics in field populations and cultured strains of Karenia brevis. Harmful Algae 2014, 38, 73–85. [Google Scholar] [CrossRef]
  24. Lomas, M.W.; Trice, T.M.; Glibert, P.M.; Bronk, D.A.; McCarthy, J.J. Temporal and spatial dynamics of urea uptake and regeneration rates, and concentrations in Chesapeake Bay. Estuaries 2002, 25, 469–482. [Google Scholar] [CrossRef]
  25. Beman, J.M.; Arrigo, K.R.; Matson, P.A. Agricultural runoff fuels large phytoplankton blooms in vulnerable areas of the ocean. Nature 2005, 434, 211–214. [Google Scholar] [CrossRef] [PubMed]
  26. Obreza, T.A.; Alva, A.K.; Calvert, D.V. Citrus Fertilizer Management on Calcareous Soils; Report CIR1127; Cooperative Extension Service, University of Florida: Gainesville, FL, USA, 1993; p. 8. [Google Scholar]
  27. Paramasivam, S.; Alva, A.K. Leaching of nitrogen forms from controlled-release nitrogen fertilizers. Commun. Soil Sci. Plant Anal. 1997, 28, 1663–1674. [Google Scholar] [CrossRef]
  28. Glibert, P.M.; Heil, C.A.; Hollander, D.; Revilla, M.; Hoare, A.; Alexander, J.; Murasko, S. Evidence for dissolved organic nitrogen and phosphorus uptake during a cyanobacterial bloom in Florida Bay. Mar. Ecol. Prog. Ser. 2004, 280, 73–83. [Google Scholar] [CrossRef]
  29. Crandall, J.B.; Teece, M.A. Urea is a dynamic pool of bioavailable nitrogen in coral reefs. Coral Reefs 2012, 31, 207–214. [Google Scholar] [CrossRef]
  30. McCarthy, J.J. The uptake of urea by natural populations of marine phytoplankton. Limnol. Oceanogr. 1972, 17, 738–748. [Google Scholar] [CrossRef]
  31. McCarthy, J.J. The uptake of urea by marine phytoplankton. J. Phycol. 1972, 8, 216–222. [Google Scholar] [CrossRef]
  32. Twomey, L.J.; Piehler, M.F.; Paerl, H.W. Phytoplankton uptake of ammonium, nitrate and urea in the Neuse River Estuary, NC. Hydrobiologia 2005, 533, 123–134. [Google Scholar] [CrossRef]
  33. Collos, Y.; Jauzein, C.; Ratmaya, W.; Souchu, P.; Abadie, E.A.; Vaquer, A. Comparing diatom and Alexandrium catenella/tamarense blooms in Thau lagoon: Importance of dissolved organic nitrogen in seasonally N-limited systems. Harmful Algae 2014, 37, 84–91. [Google Scholar] [CrossRef] [Green Version]
  34. Solomon, C.M.; Collier, J.L.; Berg, G.M.; Glibert, P.M. Role of urea in microbial metabolism in aquatic systems: A biochemical and molecular review. Aquat. Microb. Ecol. 2010, 59, 67–88. [Google Scholar] [CrossRef]
  35. Solomon, C.M.; Glibert, P.M. Urease activity in five phytoplankton species. Aquat. Microb. Ecol. 2008, 52, 149–157. [Google Scholar] [CrossRef]
  36. Davidson, K.; Gowen, R.J.; Harrison, P.J.; Fleming, L.; Hoagland, P.; Moschonas, G. Anthropogenic nutrients and harmful algae in coastal waters. J. Environ. Manag. 2014, 146, 206–216. [Google Scholar] [CrossRef] [PubMed] [Green Version]
  37. Donald, D.B.; Bogard, M.J.; Finlay, K.; Leavitt, P.R. Comparative effects of urea, ammonium, and nitrate on phytoplankton abundance, community composition, and toxicity in hypereutrophic freshwaters. Limnol. Oceanogr. 2011, 56, 2161–2175. [Google Scholar] [CrossRef]
  38. Glibert, P.M.; Terlizzi, D.E. Cooccurrence of elevated urea levels and dinoflagellate blooms in temperate estuarine aquaculture ponds. Appl. Environ. Microbiol. 1999, 65, 5594–5596. [Google Scholar] [CrossRef] [Green Version]
  39. Glibert, P.M.; Magnien, R.; Lomas, M.W.; Alexander, J.; Fan, C.; Haramoto, E.; Trice, T.M.; Kana, T.M. Harmful algal blooms in the Chesapeake and Coastal Bays of Maryland, USA: Comparison of 1997, 1998, and 1999 events. Estuaries 2001, 24, 875–883. [Google Scholar] [CrossRef]
  40. Fan, C.; Glibert, P.M.; Burkholder, J.M. Characterization of the nitrogen uptake kinetics of Prorocentrum minimum in natural blooms and laboratory cultures. Harmful Algae 2003, 2, 283–299. [Google Scholar] [CrossRef]
  41. Fan, C.; Glibert, P.M.; Alexander, J.M.; Lomas, M.W. Characterization of urease activity in three marine phytoplankton species, Aureococcus anophagefferens, Prorocentrum minimum, and Thalassiosira weissflogii. Mar. Biol. 2003, 142, 949–958. [Google Scholar] [CrossRef]
  42. Kudela, R.M.; Lane, J.Q.; Cochlan, W.P. The potential role of anthropogenically derived nitrogen in the growth of harmful algae in California, USA. Harmful Algae 2008, 8, 103–110. [Google Scholar] [CrossRef]
  43. Brody, S.D.; Carrasco, V.; Highfield, W.E. Measuring the adoption of local sprawl reduction planning policies in Florida. J. Plan. Educ. Res. 2006, 25, 294–310. [Google Scholar] [CrossRef] [Green Version]
  44. Kahrl, A.W. The Sunbelt’s sandy foundation: Coastal development and the making of the modern South. South. Cult. 2014, 20, 24–42. [Google Scholar] [CrossRef]
  45. Bronk, D.A.; Sanderson, M.P.; Mulholland, M.R.; Heil, C.A.; O’Neil, J.M. Organic and inorganic nitrogen uptake kinetics in field populations dominated by Karenia brevis. In Harmful Algae 2002; Steidinger, K.A., Landsberg, J.H., Tomas, C.R., Vargo, G.A., Eds.; Florida Fish and Wildlife Conservation Commission, IOC-UNESCO: St Petersburg, FL, USA, 2004; pp. 80–82. [Google Scholar]
  46. Lindall, W.N., Jr.; Fable, W.A., Jr.; Collins, L.A. Additional studies of the fishes, macroinvertebrates, and hydrological conditions of upland canals in Tampa Bay, Florida. Fish. Bull 1975, 73, 81–85. [Google Scholar]
  47. Ma, S.; Whereat, E.; Luther III, G.W. Shift of algal community structure in dead end lagoons of the Delaware Inland Bays during seasonal anoxia. Aquat. Microb. Ecol. 2006, 44, 279–290. [Google Scholar] [CrossRef] [Green Version]
  48. Lewitus, A.J.; Brock, L.B.; Burke, M.K.; DeMattio, K.A.; Wilde, S.B. Lagoonal stormwater detention ponds as promoters of harmful algal blooms and eutrophication along the South Carolina coast. Harmful Algae 2008, 8, 60–65. [Google Scholar] [CrossRef]
  49. Phlips, E.J.; Badylak, S.; Christman, M.; Wolny, J.; Brame, J.; Garland, J.; Hall, L.; Hart, J.; Landsberg, J.; Lasi, M.; et al. Scales of temporal and spatial variability in the distribution of harmful algae species in the Indian River Lagoon, Florida, USA. Harmful Algae 2011, 10, 277–290. [Google Scholar] [CrossRef]
  50. LaPointe, B.E.; Herren, L.W.; Debortoli, D.D.; Vogel, M.A. Evidence of sewage-driven eutrophication and harmful algal blooms in Florida’s Indian River Lagoon. Harmful Algae 2015, 43, 82–102. [Google Scholar] [CrossRef]
  51. Bullerjahn, G.S.; McKay, R.M.; Davis, T.W.; Baker, D.B.; Boyer, G.L.; D’Anglada, L.V.; Doucette, G.J.; Ho, J.C.; Irwin, E.G.; Kling, C.L.; et al. Global solutions to regional problems: Collecting global expertise to address the problem of harmful cyanobacterial blooms. A Lake Erie Case Study. Harmful Algae 2016, 54, 223–238. [Google Scholar] [CrossRef] [Green Version]
  52. Reidmiller, D.R.; Avery, C.W.; Easterling, D.R.; Kunkel, K.E.; Lewis, K.L.M.; Maycock, T.K.; Stewart, B.C. Impacts, Risks, and Adaptation in the United States: Fourth National Climate Assessment; U.S. Global Change Research Program: Washington, DC, USA, 2018; p. 1526. [Google Scholar] [CrossRef]
  53. Śliwińska-Wilczewska, S.; Pniewski, F.; Latała, A. Allelopathic interactions between Synechococcus sp. and Nodularia spumigena under different light conditions. Allelopath. J. 2016, 37, 241–252. [Google Scholar]
  54. Śliwińska-Wilczewska, S.; Maculewicz, J.; Barreiro, A.; Latała, A. Allelopathic and bloom-forming picocyanobacteria in a changing world. Toxins 2018, 10, 48. [Google Scholar] [CrossRef] [Green Version]
  55. Ellison, R.M.; Bendis, B. Keeping constant watch on harmful algal blooms: Environmental use a pontoon-mounted autonomous monitoring system in Florida waters. Sea Technol. 2007, 48, 10–14. [Google Scholar]
  56. Millie, D.F.; Weckman, G.R.; Young, W.A.; Ivey, J.E.; Fries, D.P.; Ardjmand, E.; Fahnenstiel, G.L. Coastal ‘Big Data’ and nature-inspired computation: Prediction potentials, uncertainties, and knowledge derivation of neural networks for an algal metric. Estuar. Coast. Shelf Sci. 2013, 125, 57–67. [Google Scholar] [CrossRef]
  57. Rahmatullah, M.; Boyd, T.R.C. Improvements in the determination of urea using diacetyl monoxime; methods with and without deproteinization. Clin. Chim. Acta 1980, 107, 3–9. [Google Scholar] [CrossRef]
  58. Glibert, P.M.; Kelly, V.; Alexander, J.; Codipoti, L.A.; Boicourt, W.C.; Trice, T.M.; Michael, B. In situ nutrient monitoring: A tool for capturing nutrient variability and the antecedent conditions that support algal blooms. Harmful Algae 2008, 8, 175–181. [Google Scholar] [CrossRef]
  59. Heil, C.A.; Steidinger, K.A. Monitoring, management and mitigation of Karenia blooms in the eastern Gulf of Mexico. Harmful Algae 2009, 8, 611–617. [Google Scholar] [CrossRef]
  60. Corcoran, A.A.; Wolny, J.; Leone, E.; Ivey, J.; Murasko, S. Drivers of phytoplankton dynamics in Old Tampa Bay, FL (USA), a subestuary lagging in ecosystem recovery. Estuar. Coast. Shelf Sci. 2017, 185, 130–140. [Google Scholar] [CrossRef]
  61. Wehr, J.D.; Sheath, R.G. (Eds.) Freshwater Algae of North America; Academic Press: New York, NY, USA, 2003; p. 917. [Google Scholar] [CrossRef]
  62. Tomas, C.R. (Ed.) Identifying Marine Phytoplankton; Academic Press: San Diego, CA, USA, 1997; p. 858. [Google Scholar]
  63. Steidinger, K.A.; Wolny, J.L.; Haywood, A.J. Identification of Kareniaceae (Dinophyceae) in the Gulf of Mexico. Nova Hedwigia 2008, 133, 269–284. [Google Scholar]
  64. Marshall, H.G. Autotrophic picoplankton distribution and abundance in Chesapeake Bay, U.S.A. Mar. Nat. 1995, 4, 33–42. [Google Scholar]
  65. Affronti, L.F.; Marshall, H.G. Diel abundance and productivity patterns of autotrophic picoplankton in the lower Chesapeake Bay. J. Plankton Res. 1993, 15, 1–8. [Google Scholar] [CrossRef]
  66. Holm-Hansen, O. Determination of microbial biomass in ocean profiles. Limnol. Oceanogr. 1969, 14, 740–747. [Google Scholar] [CrossRef]
  67. Solozano, L.; Sharp, J.H. Determination of total dissolved phosphorus and particulate phosphorus in natural waters. Limnol. Oceanogr. 1980, 25, 756–760. [Google Scholar]
  68. Bronk, D.A.; Lomas, M.W.; Glibert, P.M.; Schukert, K.J.; Sanderson, M.P. Total dissolved nitrogen analysis: Comparisons between the persulfate, UV and high temperature oxidation methods. Mar. Chem. 2000, 69, 163–178. [Google Scholar] [CrossRef]
  69. Paasche, E. Silicon content of five marine plankton diatom species measured with a rapid filter method. Limnol. Ocean. 1980, 25, 474–480. [Google Scholar] [CrossRef]
  70. Koroleff, F. Determination of Urea. In Methods of Seawater Analysis; Grasshoff, K., Ehrhardt, M., Kremling, K., Eds.; Weinheim Verlag Chemie: Deerfield Beach, FL, USA, 1983; pp. 158–162. [Google Scholar]
  71. Solomon, C.M.; Alexander, J.A.; Glibert, P.M. Measuring urease activity in aquatic environmental samples. Limnol. Oceanogr. Methods 2007, 5, 280–288. [Google Scholar] [CrossRef]
  72. Cleveland, W.S. Robust locally weighted regression and smoothing scatterplots. J. Am. Stat. Assoc. 1979, 74, 829–836. [Google Scholar] [CrossRef]
  73. Davey, M.; Tarran, G.A.; Mills, M.M.; Ridame, C.; Geider, R.J.; LaRoche, J. Nutrient limitation of picophytoplankton photosynthesis and growth in the tropical North Atlantic. Limnol. Oceanogr. 2008, 53, 1722–1733. [Google Scholar] [CrossRef] [Green Version]
  74. Moore, L.R.; Ostrowski, M.; Scanlan, D.J.; Feren, K.; Sweetsir, T. Ecotypic variation in phosphorus-acquisition mechanisms within marine picocyanobacteria. Aquat. Microb. Ecol. 2005, 39, 257–269. [Google Scholar] [CrossRef] [Green Version]
  75. Lin, S.; Litaker, R.W.; Sunda, W.G. Phosphorus physiological ecology and molecular mechanisms in marine phytoplankton. J. Phycol. 2016, 52, 10–36. [Google Scholar] [CrossRef]
  76. Berg, G.M.; Glibert, P.M.; Jørgensen, N.O.G.; Balode, M.; Purina, I. Variability in inorganic and organic nitrogen uptake associated with riverine nutrient input in the Gulf of Riga, Baltic Sea. Estuaries 2001, 24, 204–214. [Google Scholar] [CrossRef]
  77. Glibert, P.M.; Berg, G.M. Nitrogen form, fate and phytoplankton composition. In Enclosed Experimental Ecosystems and Scale: Tools for Understanding and Managing Coastal Ecosystems; Petersen, J.E., Kennedy, V.S., Dennison, W.C., Kemp, W.M., Eds.; Springer: New York, NY, USA, 2009; pp. 183–189. [Google Scholar]
  78. Caraccia, K.S. A Preliminary Assessment of the Effects of Treated Sewer Discharge on the Phytoplankton Communities of Whitaker Bayou and Adjoining Sarasota Bay; technical report; Mote Marine Laboratory: Sarasota, FL, USA, 1981; p. 17. [Google Scholar]
  79. Millie, D.F.; Schofield, O.; Kirkpatrick, G.J.; Johnsen, G.; Tester, P.A.; Vinyard, B.T. Phytoplankton pigments and absorption spectra as potential biomarkers for harmful algal blooms: A case study of the Florida red-tide dinoflagellate, Gymnodinium breve. Limnol. Ocean. 1997, 42, 1240–1251. [Google Scholar] [CrossRef] [Green Version]
  80. Hicks, D.B.; Cavinder, T.R.; Raschke, R.L.; Murphy, P.M. Finger-Fill Canal Studies Florida and North Carolina; USEPA 904/9-76-017; National Technical Information Service: Springfield, VA, USA, 1975; p. 446. [Google Scholar]
  81. Zieliński, P.; Górniak, A.; Piekarski, M.K. The effect of hydrological drought on chemical quality of water and dissolved organic carbon concentrations in lowland rivers. Pol. J. Ecol. 2009, 57, 217–227. [Google Scholar]
  82. Vargo, G.A.; Heil, C.A.; Fanning, K.A.; Dixon, L.K.; Neely, M.B.; Lester, K.; Ault, D.; Murasko, S.; Havens, J.; Walsh, J.; et al. Nutrient availability in support of Karenia brevis blooms on the central West Florida Shelf: What keeps Karenia blooming? Cont. Shelf Res. 2008, 28, 73–98. [Google Scholar] [CrossRef]
  83. Southwest Florida Water Management District. Sarasota Bay Surface Water Improvement and Management (SWIM) Plan; Report VISKH 7-17; Southwest Florida Water Management District: Brooksville, FL, USA, 2002; p. 5. [Google Scholar]
  84. Sarasota Bay Conditions Report for 2010. Available online: https://www.sarasota.wateratlas.usf.edu/bay-conditions/report/1/sarasota-bay/2010/#waterchemistry (accessed on 1 June 2020).
  85. Smith, S.V. Phosphorus versus nitrogen limitation in the marine environment. Limnol. Oceanogr. 1984, 29, 1149–1160. [Google Scholar] [CrossRef] [Green Version]
  86. Sheng, Y.P.; Peene, S.; Yassuda, E. Circulation and transport in Sarasota Bay, Florida: The effect of tidal inlets on estuarine circulation and flushing quality. In Mixing in Estuaries and Coastal Seas Coastal; Pattiaratchi, C., Ed.; American Geophysical Union: Washington, DC, USA, 1996; pp. 184–210. [Google Scholar]
  87. Cannizzaro, J.; Corcoran, A.; Wolny, J.; Hu, C. Light absorption properties of algal blooms in Old Tampa Bay: Implications for management. In BASIS 6, Tampa Bay Area Scientific Information Symposium; Burke, M., Ed.; Tampa Bay Regional Planning Council: Pinellas Park, FL, USA, 2016; pp. 84–95. [Google Scholar]
  88. O’Neil, J.M.; Davis, T.W.; Burford, M.A.; Gobler, C.J. The rise of harmful cyanobacteria blooms: The potential roles of eutrophication and climate change. Harmful Algae 2012, 14, 313–334. [Google Scholar]
  89. Paerl, H.W.; Gardner, W.S.; Havens, K.E.; Joyner, A.R.; McCarthy, M.J.; Newell, S.E.; Qin, B.; Scott, J.T. Mitigating cyanobacterial harmful algal blooms in aquatic ecosystems impacted by climate change and anthropogenic nutrients. Harmful Algae 2016, 54, 213–222. [Google Scholar] [CrossRef] [PubMed] [Green Version]
  90. Gobler, C.J.; Doherty, O.M.; Hattenrath-Lehmann, T.K.; Griffith, A.W.; Kang, Y.; Litaker. R.W. Ocean warming since 1982 has expanded the niche of toxic algal blooms in the North Atlantic and North Pacific oceans. Proc. Natl. Acad. Sci. USA 2017, 114, 4975–4980. [Google Scholar] [CrossRef] [PubMed] [Green Version]
  91. Trainer, V.L.; Moore, S.K.; Hallegraeff, G.; Kudela, R.M.; Clement, A.; Mardones, J.I.; Cochlan, W.P. Pelagic harmful algal blooms and climate change: Lessons from nature’s experiments with extremes. Harmful Algae 2020, 91, 101591. [Google Scholar] [CrossRef] [PubMed]
  92. Butler, M.J.; Hunt, J.H.; Herrnkind, W.F.; Childress, M.J.; Bertelsen, R.; Sharp, W.; Matthews, T.; Field, J.M.; Marshall, H.G. Cascading disturbances in Florida Bay, USA: Cyanobacteria blooms, sponge mortality, and implications for juvenile spiny lobsters Panulirus argus. Mar. Ecol. Prog. Ser. 1995, 129, 119–125. [Google Scholar] [CrossRef]
  93. Glibert, P.M.; Heil, C.A.; Rudnick, D.T.; Madden, C.J.; Boyer, J.N.; Kelly, S. Florida Bay: Water quality status and trends, historic and emerging algal bloom problems. Contrib. Mar. Sci. 2009, 38, 5–17. [Google Scholar]
  94. Hall, M.O.; Durako, M.J.; Fourqurean, J.W.; Zieman, J.C. Decadal changes in seagrass distribution and abundance in Florida Bay. Estuaries 1999, 22, 445–459. [Google Scholar] [CrossRef]
  95. Fourqurean, J.W.; Robblee, M.B. Florida Bay: A history of recent ecological changes. Estuaries 1999, 22, 345–357. [Google Scholar] [CrossRef]
  96. Bronk, D.A.; See, J.H.; Bradley, P.; Killberg, L. DON as a source of bioavailable nitrogen for phytoplankton. Biogeoscience 2007, 4, 283–296. [Google Scholar] [CrossRef] [Green Version]
  97. Bronk, D.A.; Glibert, P.M.; Malone, T.C.; Banahan, S.; Sahlsten, E. Inorganic and organic nitrogen cycling in Chesapeake Bay: Autotrophic versus heterotrophic processes and relationships to carbon flux. Aquat. Microb. Ecol. 1998, 15, 177–189. [Google Scholar] [CrossRef]
  98. Hochmuth, G.; Nell, T.; Sartain, J.; Unruh, J.B.; Martinez, C.; Trenholm, L.; Cisar, J. Urban Water Quality and Fertilizer Ordinances: Avoiding Unintended Consequences: A Review of the Scientific Literature; Report SL 283; Cooperative Extension Service, University of Florida: Gainesville, FL, USA, 2011; p. 25. [Google Scholar]
  99. Hochmuth, G.; Nell, T.; Unruh, J.B.; Trenholm, L.; Sartain, J. Potential unintended consequences associated with urban fertilizer bans in Florida—A scientific review. Horttechnology 2012, 22, 600–616. [Google Scholar] [CrossRef] [Green Version]
  100. Dillon, K.S.; Chanton, J.P. Nutrient transformations between rainfall and stormwater runoff in an urbanized coastal environment: Sarasota Bay, Florida. Limnol. Oceanogr. 2005, 50, 62–69. [Google Scholar] [CrossRef]
  101. Dillon, K.S.; Chanton, J.P. Nitrogen stable isotopes of macrophytes assess stormwater nitrogen inputs to an urbanized estuary. Estuaries Coasts 2008, 31, 360–370. [Google Scholar] [CrossRef]
  102. PBS&J. EMC Monitoring in Support of Pollutant Load Modeling, Prepared for Sarasota County; Atkins Company: Tampa, FL, USA, 2010; p. 31. [Google Scholar]
  103. Wdowinski, S.; Bray, R.; Kirtman, B.P.; Wu, Z. Increasing flooding hazard in coastal communities due to rising sea level: Case study of Miami Beach, Florida. Ocean. Coast. Manag. 2016, 126, 1–8. [Google Scholar] [CrossRef]
  104. Lewitus, A.J.; Scmidt, L.B.; Mason, L.J.; Kempton, J.W.; Wilde, S.B.; Wolny, J.L.; Williams, B.J.; Hayes, K.C.; Hymel, S.N.; Keppler, C.J.; et al. Harmful algal blooms in South Carolina residential and golf course ponds. Popul. Environ. 2003, 24, 387–413. [Google Scholar] [CrossRef]
  105. Mwashote, B.M.; Murray, M.; Burnett, W.C.; Chanton, J.; Kruse, S.; Forde, A. Submarine groundwater discharge in the Sarasota Bay system: Its assessment and implications for the nearshore coastal environment. Cont. Shelf Res. 2013, 53, 63–76. [Google Scholar] [CrossRef]
  106. Konarzewska, Z.; Śliwińska-Wilczewska, S.; Barreiro Felpeto, A.; Vasconcelos, V.; Latała, A. Assessment of the allelochemical activity and biochemical profile of different phenotypes of picocyanobacteria from the genus Synechococcus. Mar. Drugs 2020, 18, 179. [Google Scholar] [CrossRef] [Green Version]
  107. Karjalainen, M.; Engström-Öst, J.; Korpinen, S.; Peltonen, H.; Pääkkönen, J.P.; Rönkkönen, S.; Suikkanen, S.; Viitasalo, M. Ecosystem consequences of cyanobacteria in the Northern Baltic Sea. AMBIO 2007, 36, 195–202. [Google Scholar] [CrossRef]
  108. Dickman, E.M.; Newell, J.M.; Gonzalez, M.J.; Vanni, M.J. Light, nutrients, and food-chain length constrain planktonic energy transfer efficiency across multiple trophic levels. Proc. Natl. Acad. Sci. USA 2008, 105, 18408–18412. [Google Scholar] [CrossRef] [PubMed] [Green Version]
  109. Wetz, M.S.; Paerl, H.W.; Taylor, J.C.; Leonard, J.A. Environmental controls upon picophytoplankton growth and biomass in a eutrophic estuary. Aquat. Microb. Ecol. 2011, 63, 133–143. [Google Scholar] [CrossRef] [Green Version]
  110. Glibert, P.M. Long-term changes in nutrient loading and stoichiometry and their relationships with changes in the food web and dominant pelagic fish species in the San Francisco Estuary, California. Rev. Fish. Sci. 2010, 18, 211–232. [Google Scholar] [CrossRef]
  111. McClenachan, L. Recreation and the “Right to Fish” movement: Anglers and ecological degradation in the Florida Keys. Environ. Hist. 2013, 18, 76–87. [Google Scholar] [CrossRef]
  112. Camp, E.; Garlock, T.; Anderson, J. Opportunities and Obstacles to Aquaculture in Florida; University of Florida: Gainesville, FL, USA, 2018; p. 6. [Google Scholar]
  113. Stauffer, B.A.; Bowers, H.A.; Buckley, E.; Davis, T.W.; Johengen, T.H.; Kudela, R.; McManus, M.A.; Purcell, H.; Smith, G.J.; Vander Woude, A.; et al. Considerations in harmful algal bloom research and monitoring: Perspectives from a consensus-building workshop and technology testing. Front. Mar. Sci. 2019, 6, 399. [Google Scholar] [CrossRef] [Green Version]
  114. Altman, J.C.; Paerl, H.W. Composition of inorganic and organic nutrient sources influences phytoplankton community structure in the New River Estuary, North Carolina. Aquat. Ecol. 2012, 46, 269–282. [Google Scholar] [CrossRef]
  115. Cira, E.K.; Paerl, H.W.; Wetz, M.S. Effects of nitrogen availability and form on phytoplankton growth in a eutrophied estuary (Neuse River Estuary, NC, USA). PLoS ONE 2016, 11, e0160663. [Google Scholar] [CrossRef]
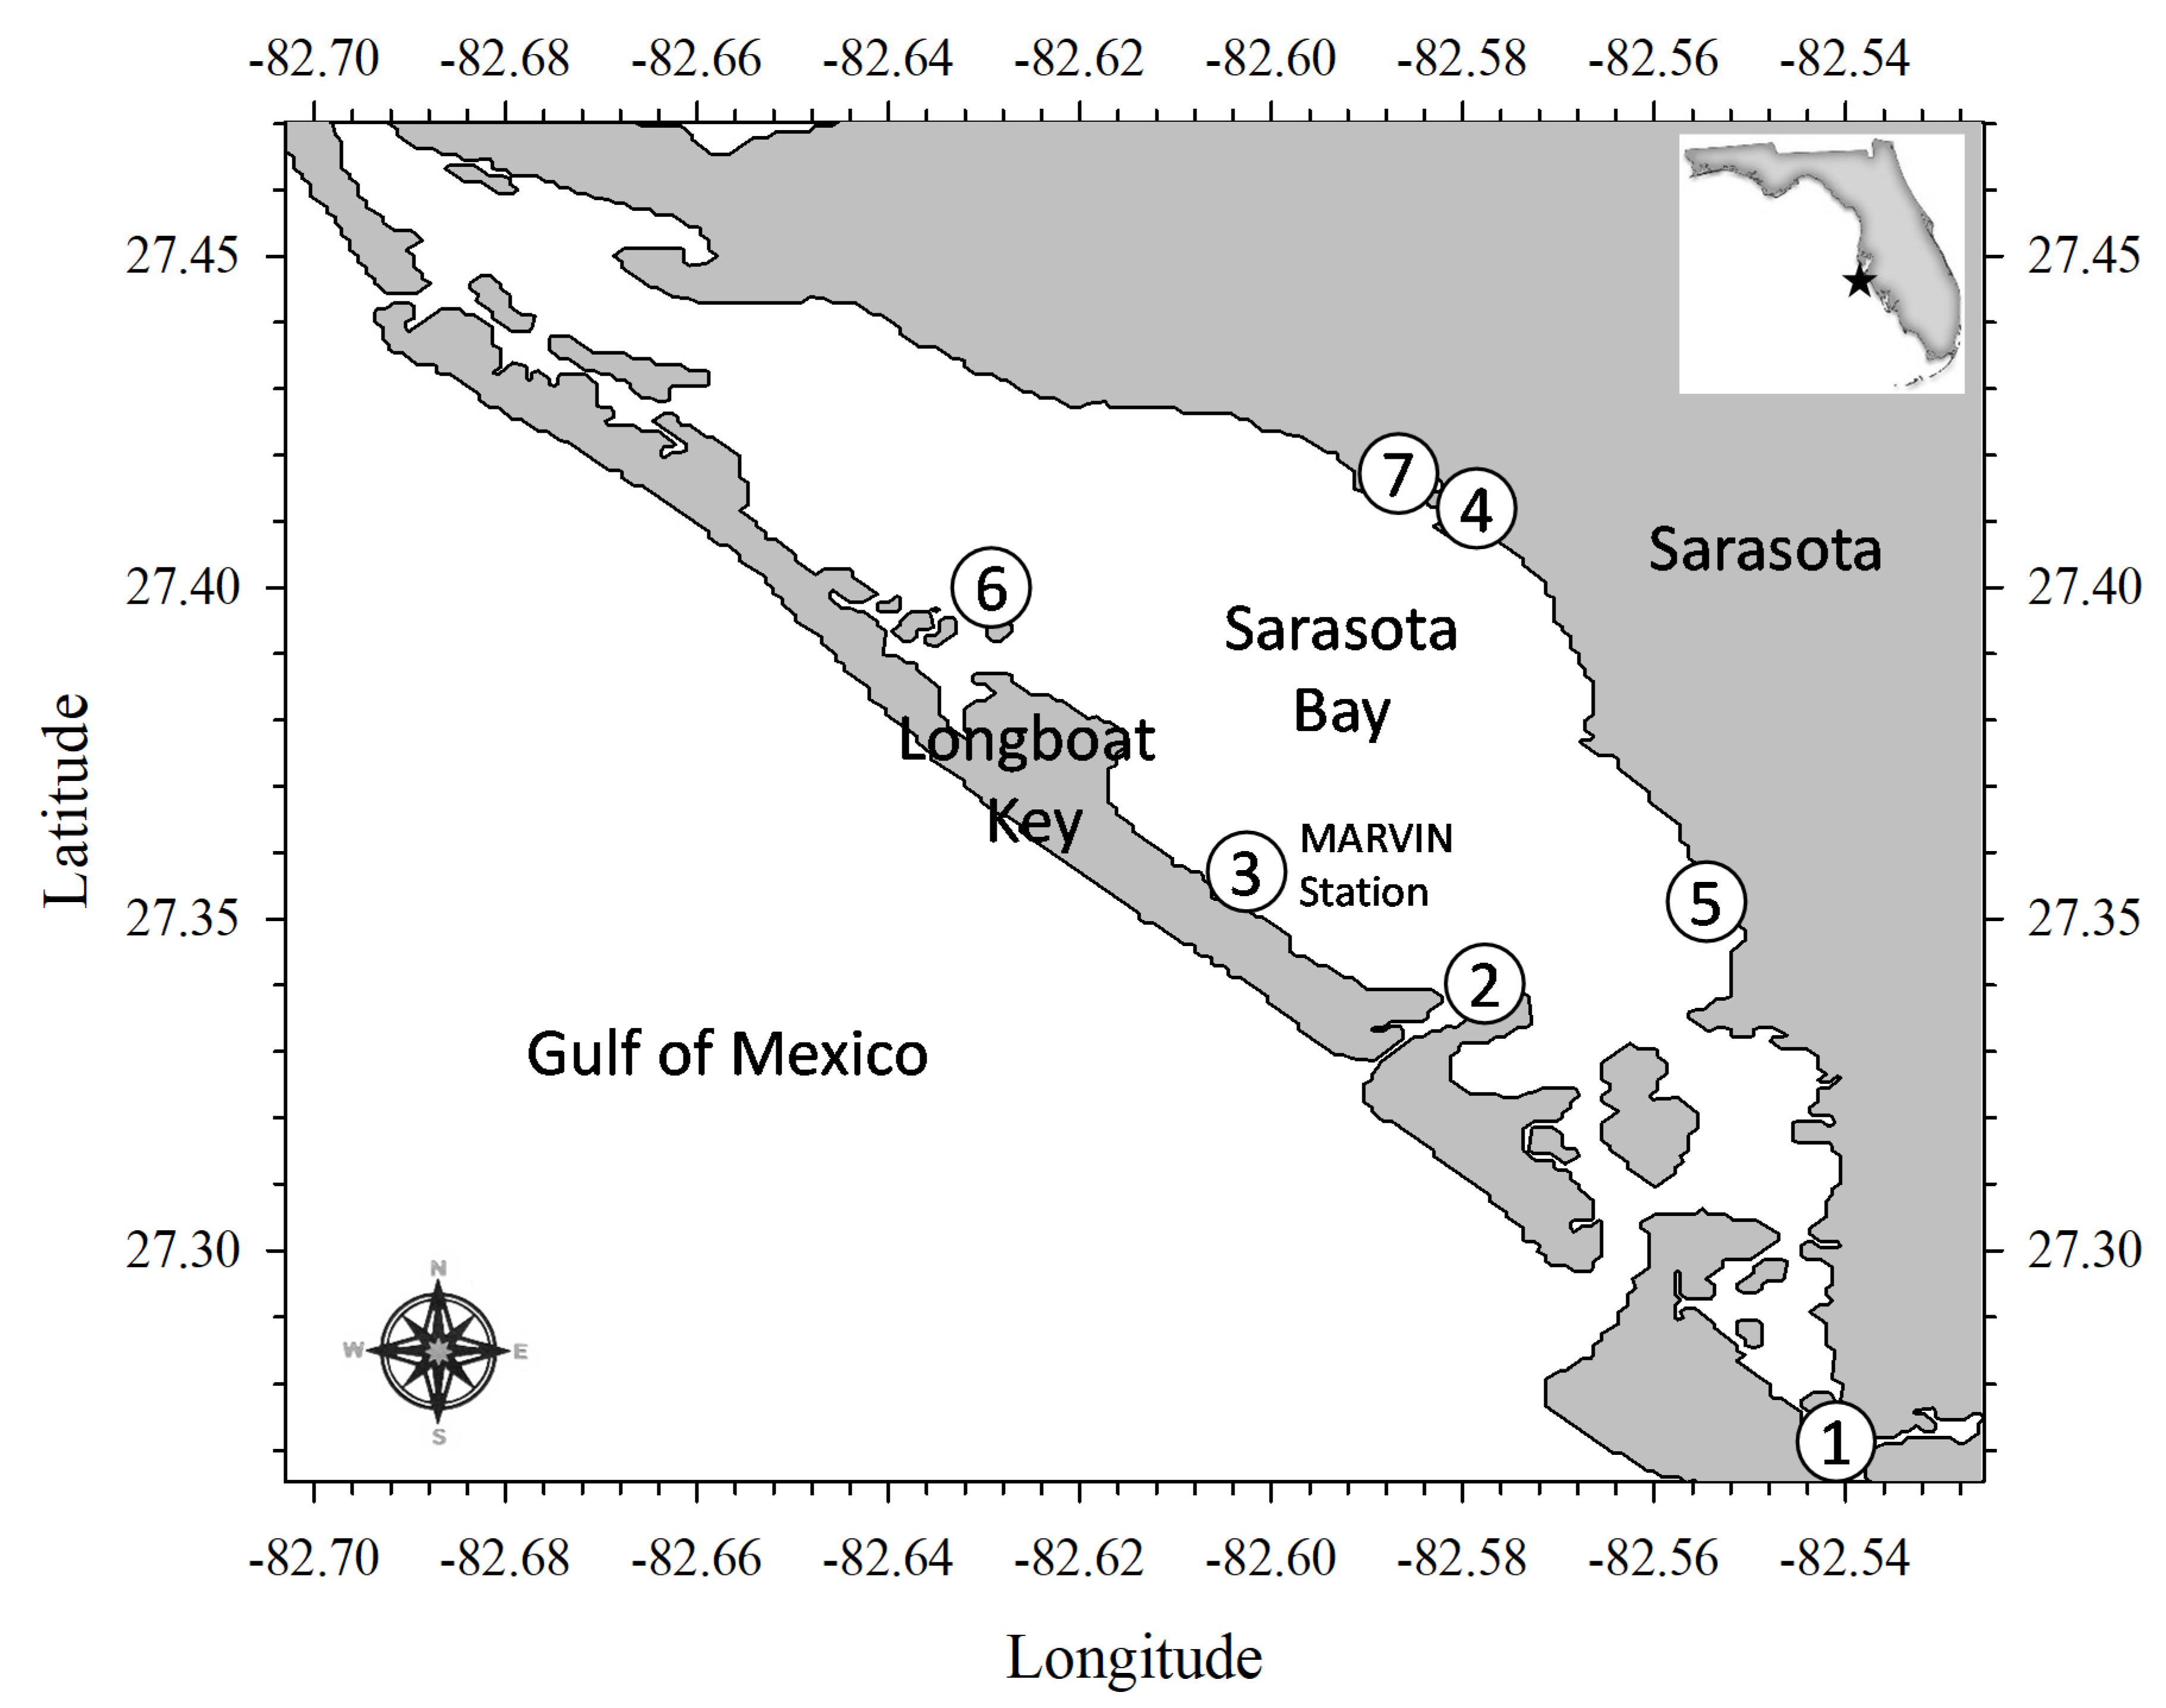
Figure 1. Map of Sarasota Bay showing the autonomous platform (MARVIN) station mooring site (Station 3) and six additional stations monitored throughout the study.
Water 12 02755 g001
Figure 2. The MERHAB Autonomous Research Vessel In-situ (MARVIN) deployed in Sarasota Bay.
Water 12 02755 g002
Figure 3. MARVIN deployment data from 29 July to 9 November 2009. Phytoplankton blooms are represented by chlorophyll-a values. Associated precipitation, urea and salinity data recorded by MARVIN sensors are also plotted. The time series data collected at Station 3, where the MARVIN platform was deployed in Sarasota Bay, indicate that several blooms occurred following rain events which altered ambient urea and salinity concentrations.
Water 12 02755 g003
Figure 4. Phytoplankton functional groups identified and enumerated using a modified Utermöhl microscopy technique. Picoplankton concentrations are based on enumeration of cells in optical fields using epifluorescent microscopy.
Water 12 02755 g004
Figure 5. Growth of picocyanobacteria and picoeukaryote algae in different size-fractionated water samples during a three-day bioassay. Station 3 water samples, collected on 2 October 2009 during a picoplankton bloom, were amended with 1 µM urea additions.
Water 12 02755 g005
Figure 6. The time series of chlorophyll concentrations and phycocyanin fluorescence from the MARVIN platform compared to values determined in discrete size-fractionated samples.
Water 12 02755 g006
Figure 7. MARVIN sensor data showing the relationship of temperature, chlorophyll a and urea concentrations. Urease measurements were made on discrete water samples collected biweekly.
Water 12 02755 g007
Figure 8. Chlorophyll-a data from the MARVIN deployment with associated particulate N:P ratio. The red line indicates the Redfield Ratio value of 16.
Water 12 02755 g008
Figure 9. Compass diagram showing the urea concentration (green dots) and associated prevailing wind direction, in relation to the MARVIN platform and Sarasota Bay bathymetry during the summer and fall 2009 deployment. Quadrant of prevailing wind direction is indicated in red. Black arrow indicates a line heading of 133°. Background image, Google Earth 2009.
Water 12 02755 g009
Figure 10. Compass diagram showing the urea concentration (green dots) and associated water current direction, in relation to the MARVIN platform, measured during the 2009 deployment. The red hemisphere represents all the current directions away from the shore. Background image, Google Earth 2009.
Water 12 02755 g010
Table 1. Instruments, with associated parameters measured, final output, and sampling depth, installed on the MARVIN platform during the 2009 Sarasota Bay deployment.
InstrumentMeasurementFinal OutputSample Location
YSI 6600 Data SondeChlorophyll-aµg L−1Surface, Bottom
SalinityPSUSurface, Bottom
Temperature °CSurface, Bottom
pHpHSurface, Bottom
Phycocyanincells L−1Surface, Bottom
Dissolved Oxygenmg L−1Surface, Bottom
Dissolved OxygenPercent saturationSurface, Bottom
TurbidityNephloid Turbidity UnitsSurface, Bottom
YSI 9600 Nitrateµg L−1Surface, Bottom
Envirotech Ureaµg L−1Bottom
Vaisala WXT-520Wind Speedm s−14 m above surface
Temperature°C4 m above surface
Precipitationinches h−14 m above surface
Barometric Pressureinches hg4 m above surface
Relative Humiditypercent4 m above surface
Licor LI-190Downwelling PARµeinsteins m−2 s−14 m above surface
Licor LI-192Downwelling PARµeinsteins m−2 s−1Surface, 1 m
Sontek ADCPCurrent Flowsm s−1horizontal X and Y
Current Flowsm s−1vertical
Water depthmWater column
Table 2. Analysis of nutrients from discrete water samples collected from the MARVIN site (Station 3) during the 2009 deployment in Sarasota Bay. Missing data for 30 September were due to equipment failure.
Date SampledTN µMTC µMTP µMUrea µM N/LNO3 µMNO2 µMSi µMNH4 µMPO4- µMTDN uMDON µMTDP µMDOP µMBiogenic Si µMUrease N µg−1 Chl-a−1 h−1
6/16/200915.01121.580.941.190.440.026.300.290.0524.8124.060.540.5017.80
6/23/200912.5499.231.000.440.640.014.240.480.0423.5122.370.410.3722.5158.71
7/8/200910.8578.270.781.820.640.017.280.270.0122.5321.610.450.4412.2954.99
7/13/200910.0669.330.720.810.650.0110.340.290.0122.0321.071.061.0613.04259.01
7/27/200911.6379.840.730.210.660.1415.921.420.0323.5121.300.420.396.3382.18
8/10/200911.7486.590.630.330.650.0220.910.340.0623.0322.020.450.393.88295.08
8/25/200911.57113.190.730.510.660.0220.910.210.0423.4822.590.410.367.86464.09
9/8/200911.9593.780.771.110.640.0329.790.470.0526.9725.830.650.603.33241.23
9/22/200913.03115.550.850.210.630.0223.660.070.0324.8024.070.610.584.570.80
9/30/200918.45149.750.321.15 30.70 0.09
10/6/200918.64171.310.190.520.640.0236.070.070.0424.7424.020.090.052.090.00
10/22/20099.4474.220.630.230.660.022.290.290.1321.3220.350.730.6012.9718.06
11/3/200911.5199.700.710.920.660.146.660.450.0530.7429.490.630.5813.1624.17
11/17/20099.3467.680.610.640.690.038.400.390.08 0.390.317.630.23
Average 12.55101.430.690.720.630.0414.830.390.0524.7823.230.500.489.80124.88
Standard Deviation2.9230.590.220.470.060.0510.630.340.033.002.520.250.236.11152.17