Article

Chivor’s Life Extension Project (CLEP): From Sediment Management to Development of a New Intake System

by
David A. del Río
1,2,
Hugo Moffett
1,2,
César Nieto-Londoño
3,*,
Rafael E. Vásquez
3 and
Ana Escudero-Atehortúa
3
1
South America Strategic Business Unit, AES Corporation, Santiago de Chile 7550000, Chile
2
AES Colombia, Calle 100 No 19-54 Of 901, Bogotá 110111, Colombia
3
School of Engineering, Universidad Pontificia Bolivariana, Medellín 050031, Colombia
*
Author to whom correspondence should be addressed.
Water 2020, 12(10), 2743; https://doi.org/10.3390/w12102743
Submission received: 29 August 2020 / Revised: 21 September 2020 / Accepted: 28 September 2020 / Published: 30 September 2020
(This article belongs to the Special Issue Sediment Management: Hydropower Improvement and Habitat Evaluation)

Abstract

:
Sedimentation is an important issue that has been studied for the watershed of reservoirs, since it increases operational costs of hydropower installations, reduces the life expectancy, and compromises the generation capacity due to volume reduction. This work addresses the implementation of Chivor’s Life Extension Project (CLEP), developed in order to extend the life of La Esmeralda reservoir, which is used for power generation in Colombia. Sediment dynamics studies are first described and connected to the need of the AES Corporation to extend the life expectancy of the Chivor Hydropower Project. The geotechnical and hydraulic designs are described and the main considerations and tools for the execution of such a project are addressed. The construction of the new intake system was developed under favorable geomorphological, geological, and hydrogeological conditions, and the project is being developed without affecting the current operation. Such an innovative project is the first of its class in Colombia and goes from studies of sediment transport and sediment management strategies in the watershed to the design and construction of new intakes, in order to extend the life of an existing 1000-MW (6% of Colombia’s demand) powerplant for 50 more years, contributing to a sustainable energy supply for the future.

1. Introduction

The world’s population is growing, as described in the United Nation’s report [1], at a pace of more than 1% per year, and so does the demand for several fuels. The International Energy Agency [2] reported that energy demand rose 2.3% in 2018, being the fastest pace in the last decade. Aligned to such a population growth, the United Nations [3] defined within the 2030 Agenda for Sustainable Development, the 7th Sustainable Development Goal (SDG) as “Ensure access to affordable, reliable, sustainable, and modern energy for all”. This will require a rapid increase in energy productivity, better management strategies for our energy systems, an integrated approach that uses centralized and decentralized sources, and a greater share of renewables in the mix [4].
Meeting such a growing energy demand requires developing, renovating, or adapting different power generation projects, depending on the resources that are available. For instance, Su et al. [5] reported that there are a large number of in-service water resources and hydropower plants in the aging stage, and they proposed a methodology for the assessment and prediction for service life of water resources and hydropower engineering. Stoll et al. [6] stated that hydropower facilities are important assets for the electric power sector and represent a key source of flexibility for electric grids with high penetrations of variable generation and as variable renewable generation sources grow, understanding the capabilities and limitations of the flexibility from hydropower resources is important for grid planning [6]. As identified by the World Bank [7], it is expected that the role of hydropower will continue to expand, especially in developing countries.
Sedimentation is one of the main issues that has been studied for the watershed of reservoirs around the world [8], since it can increase operational costs of hydropower installations because of the reduction of the generation capacity due to the volume reduction of the reservoir, and problems caused by the sediments such as obstruction of intakes and abrasive effects over several devices, including turbines, generators, and structures, among others. During the 3rd World Water Forum, held in Kyoto, Japan, sediment management was defined as an important issue to be addressed in order to guarantee sustainable energy for the future [9]. Some priority tasks were defined for hydro power engineering: (i) Increasing knowledge about sediment behavior in reservoirs, (ii) measuring sedimentation in rivers and reservoirs (watershed) to confirm estimates, (iii) developing strategies for sediment management based on known models such as RESCON (suggested by the World Bank), and (iv) implementing infrastructure modifications to ease problems in reservoirs with high-sedimentation rates. Such tasks need to be included in decision-making processes [10,11] since sedimentation results mainly in the loss of reservoir storage and reduced usable life.
Consequently, sedimentation processes in reservoir watersheds is an issue that has been studied in several places in the world because it is of critical importance in achieving the Sustainable Development Goals [3,4,8]. Regarding this matter, Annandale et al. [12] developed a report at the beginning of the 21st century in order to promote the sustainability of water storage assets worldwide from an economic angle. From a technical point of view in sediment management, one can find several works carried out for reservoirs around the world: Costa Rica [13], Switzerland [14,15], United States [16], Nigeria [17], South Korea [18], Austria [19], and Malaysia [20,21], among others. More recently, Hauer et al. [22] presented a comprehensive review to describe the state of the art, shortcomings, and future challenges for global sediment management in terms of hydropower use, and Morris [23] presented a comprehensive classification of proactive and adaptive strategies to deal with reservoir sedimentation.
Recent works can be found in the literature regarding studies that are being performed in reservoirs and hydropower projects for decision-making processes related to modifications to infrastructure and proposed solutions sedimentation problems. Su et al. [5] proposed a systematic approach for assessment and prediction regarding the service life of water resources and hydropower engineering, which is considered a comprehensive research topic that needs to integrate many theories, methods, and techniques to solve key problems. Annandale et al. [11] developed, with the support of the World Bank, a manual to help extend the life of reservoirs through sustainable sediment management plans for dams and hydropower projects. Bermúdez et al. [24] presented numerical and physical model studies conducted on the lower intake-outlet of Belesar III power station in Northwest Spain in order to provide guidance in the application of hydraulic modeling procedures to locate and design intake-outlet structures in existing lakes or reservoirs. Gabl et al. [19] evaluated two geometry options for the trash rack support structure during the redesign of the head race intake for a high head power plant in the Austrian Alps using numerical tools that led to a successful adaptation of the intake structure. González-Zeas et al. [25] developed a methodological framework based on the Pareto frontier analysis for optimizing trade-offs between water withdrawal and ecological indicators, applied to a mountainous Ecuadorian headwater river network that is used to provide portable water to the city of Quito.
Colombia’s energy demand is of course growing as well, at a pace of more than 3% per year [26] and around 70% of the country’s demand is being met with hydropower generation [27], which makes the case of modifying existing infrastructure relevant and of interest for the country. Hydropower dominance is the result of low costs and high hydro potential however, the construction of new dams yields a significant environmental footprint since reservoirs modify the river’s ecosystem [28]. Energy security has been defined as the uninterrupted availability of energy sources at an affordable price [29], which can be at risk since hydropower plants are the base of the Colombian energy matrix [30,31] due to the fact that weather conditions and events can affect operations. Therefore, more projects to guarantee sustainable energy development are needed in order to decrease fossil fuel dependency, providing environmental benefits through the reduction of greenhouse gas emissions and reducing the influence of weather events by diversifying the mix, thus enabling developing countries to control energy prices in the long term, improving supply reliability.
Although sedimentation in Colombian reservoirs has not generated difficulties for the operation of hydropower plants yet, companies are required to take action in order to guarantee energy supply in the future. For instance, AES Corporation estimated that by 2017 La Esmeralda reservoir would lose more than 20% of its initial volume and they have been spending more than USD$300.000 per year in maintenance (including electromechanical equipment and infrastructure) due to sediment transport effects. This work addresses the implementation of Chivor’s Life Extension Project (CLEP), developed by the AES Corporation in order to extend the life of La Esmeralda reservoir, which is used for power generation at the Chivor Powerplant (AES Chivor). Such an innovative project is the first of its class in Colombia and goes from studies of sediment transport and sediment management strategies in the watershed to the design and construction of new intakes that are being developed without affecting the current operation, in order to extend the life of an existing 1000-MW (6% of Colombia’s demand) powerplant for 50 more years, contributing to sustainable energy supply for the future.

2. Materials and Methods

2.1. Chivor Hydropower Project

The Chivor hydropower plant is owned by AES Corporation and has a capacity of 1000 MW (eight 125-MW Pelton turbines) divided into two stages: Chivor I entered into service in 1977 and Chivor II in 1982. The initial life expectancy of this hydropower project was set to 50 years (roughly until 2025). This plant is located at Santa María, Boyacá, 160 km from Bogotá (northeast). This project uses water contained in a main reservoir, La Esmeralda (watershed area estimated in 2420 km 2 ), and two additional small reservoirs, Río Negro and Tunjita. It was built to take advantage of the potential of Batá river (flow rate: Average 60 m 3 /s, min. historical 2.8 m 3 /s, and max. historical 1500 m 3 /s registered in 1970). La Esmeralda has a capacity of 769 Mm 3 and the AES Corporation has estimated that its dead storage capacity will be overloaded by 2027. Chivor has a 237 m height crest, located at 1288 m.a.s.l. and the maximum level of the reservoir is 1277 m.a.s.l. (to mitigate potential rising of the rivers, the maximum level is 1278 m.a.s.l.). The current intakes are 165 ton steel/concrete structures located at 1195 m.a.s.l. Water is conducted through two independent valve chambers to the powerhouse by two seven-meter-high tunnels, named Chivor I and II conduction (headrace tunnels) and water discharges to the adjacent river Lengupá at 464 m.a.s.l. (more than 700 m of total head). See Figure 1.

2.2. Sediment Dynamics of La Esmeralda Reservoir

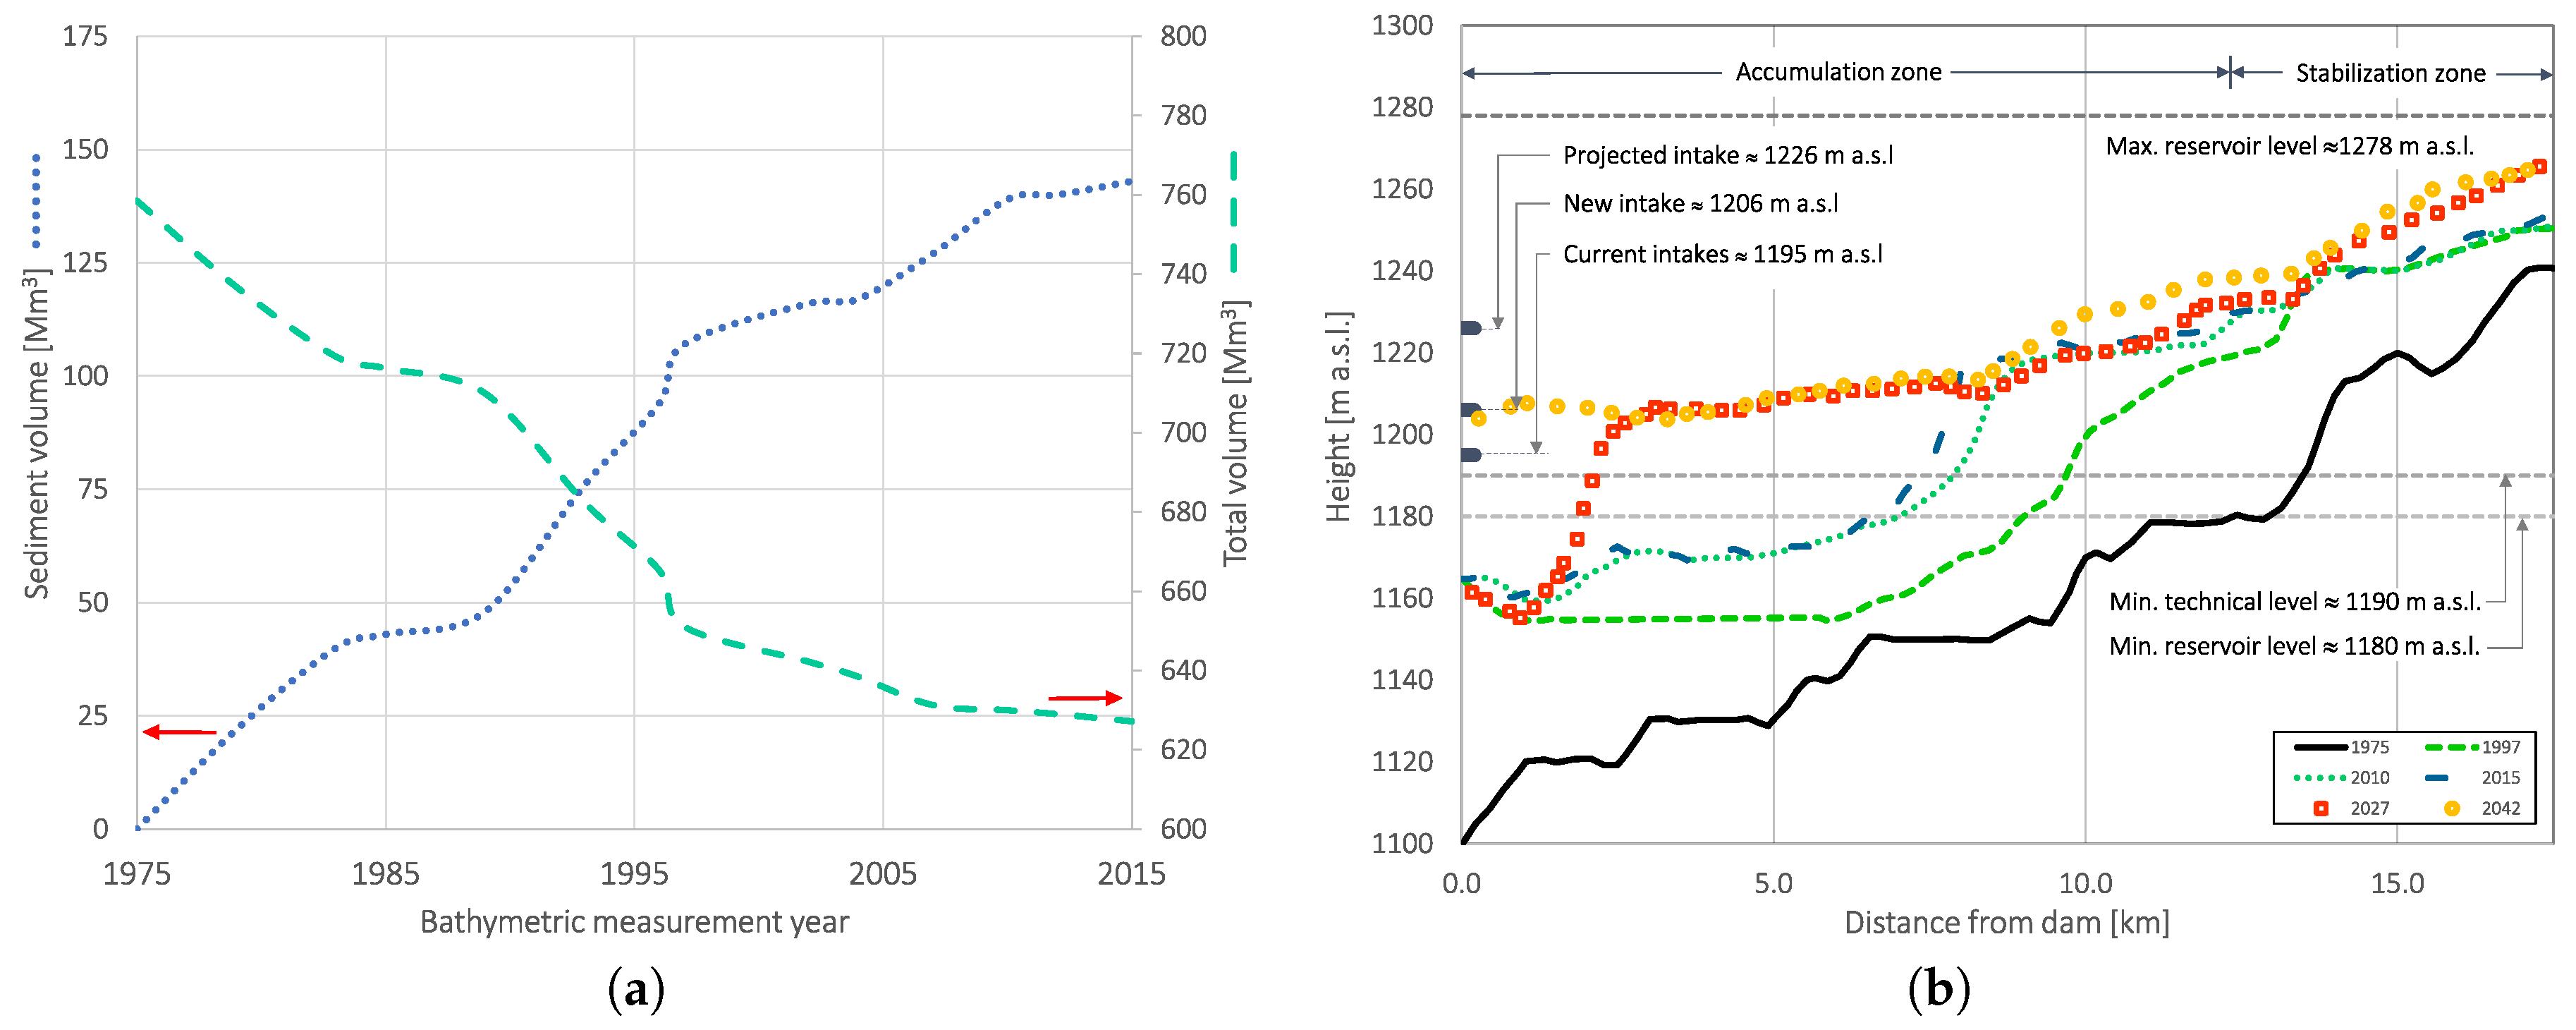
Sedimentation in Colombian reservoirs has not generated difficulties for the operation of hydropower plants yet. However, considering that around 70% of the energy demand is met with hydro, companies are required to take action to guarantee energy supply in the future. For instance, the AES Chivor (owned by the AES Corporation) estimated that by 2017 La Esmeralda reservoir had lost more than 20% of its initial volume, and they have been spending more than USD $300,000 per year in maintenance (including electro-mechanical equipment and infrastructure) due to sediment transport effects. In agreement with the proposed tasks for the current century, and since La Esmeralda reservoir’s life expectancy was estimated to end around 2027, AES included several years ago bathymetric measurements among its maintenance and monitoring plans. In this regard, a complete characterization of sediment behavior through the reservoir and critical points, including actual intakes and principal affluent, have been performed periodically. The mean sedimentation rate per year has been determined since 1975, as 3.1 Mm 3 and is shown in Figure 2a. The increase in sediment volume was conducted to a reduction in the total reservoir volume from 769 to 630 Mm 3 . On the other hand, the average concentration by 2007 of sediments discharged was in the order of 198 mg/L.
Subsequently, in 2012 the AES started to determine the detailed profile of the sediment column, Figure 2b. In addition to the bathymetry campaigns, simulations were run to complete the sediment column evolution. Hydrological information corresponding to daily water level and flow data (from 1977 to 2006) was used for setting up a one-dimensional model. It also included the baseline geometry of the reservoir from a digitized model. Results in Figure 2b shows that by 2019 there is a high probability that sediments will reach the base level of the current intakes. The model indicates that from that year on, discharge concentration increases from values of the order of 274 mg/L to values of 1600 mg/L. A first attempt to avoid the effect of sedimentation on the reservoir operation started in 2015 by retarding the delta advance towards gradually raising the reservoir’s minimum operating level. Several adaptive strategies have been reported to mitigate and prevent sedimentation impacts [23]. In this regard, the minimum level rose to 1210 m, being continuously increased at a rate of 0.5 m per year and focusing new deposits onto the top of the delta.
Excessive sedimentation in La Esmeralda reservoir has increased AES Chivor maintenance cost and interventions in the power plant due to the wear of needle valves of the turbines. Figure 3 shows how a high sediment content in the water that goes into the powerhouse affects equipment and makes evident the importance of sediment management plans and infrastructure intervention [32]. This excessive sediment load has effects over the intakes of the reservoir and over the generation units, as it has been shown for valves in Figure 3, but also for turbines and other mechanical components. No further studies have been conducted on the effect of sediments over electrical equipment. Regarding the reported sediment concentration of 2007, the model predicted an average concentration of 273.6 mg/L (i.e., with a percentage difference of 38.18%). In the case of sediment transport models variations up to 50% are acceptable [10]. Additionally, it was determined that most of the particles entering the intake are of small sizes (silts and clays) being transported in suspension. However, a small percentage of fine sands was predicted close to the water intakes.
Based on such a profile, the AES made evident the need for a strategy to mitigate sediment accumulation near the current intakes of the hydropower plant. In this sense, activities listed in this work have been developed, including the development of monitoring and control processes allowing to consolidate the information related to the sediment transport history.

2.3. Chivor’s Life Extension Project

AES Corporation proposed and is executing the Chivor’s Life Extension Project (CLEP) based on the described sedimentation analysis for La Esmeralda reservoir’s watershed. The project was set up in order to extend the life expectancy of the Chivor Hydropower project for at least 50 years. As briefly described by Río et al. [32], AES conformed a panel of international experts in order to brainstorm ideas to extend the life of the Chivor hydropower plant, based on such sedimentation studies. Subsequently, AES requested permission from the Colombian National Agency for Environmental Licenses (ANLA in Spanish) in order to generate energy by using the Chivor Powerplant, which was granted for 50 more years, starting in 2019.
As described in [32], AES evaluated the construction of sediment-retention barriers upstream the dam, the construction of a sediment transit system through pipes and discharge channel, mechanical sediment extraction, soil improvement and reforestation of watersheds, and the modification of intakes, in order to extend the life expectancy of the reservoir. It was concluded, after considering technical, environmental, and financial aspects, that the last option of building new intakes at La Esmeralda reservoir could reduce the environmental impact and decrease the lost of profit due to the fact that the construction process could be carried out without affecting the regular operation of the powerplant. Three options for the project that began in 2015, are addressed and described in [32].

2.3.1. Chivor’s New Intake System

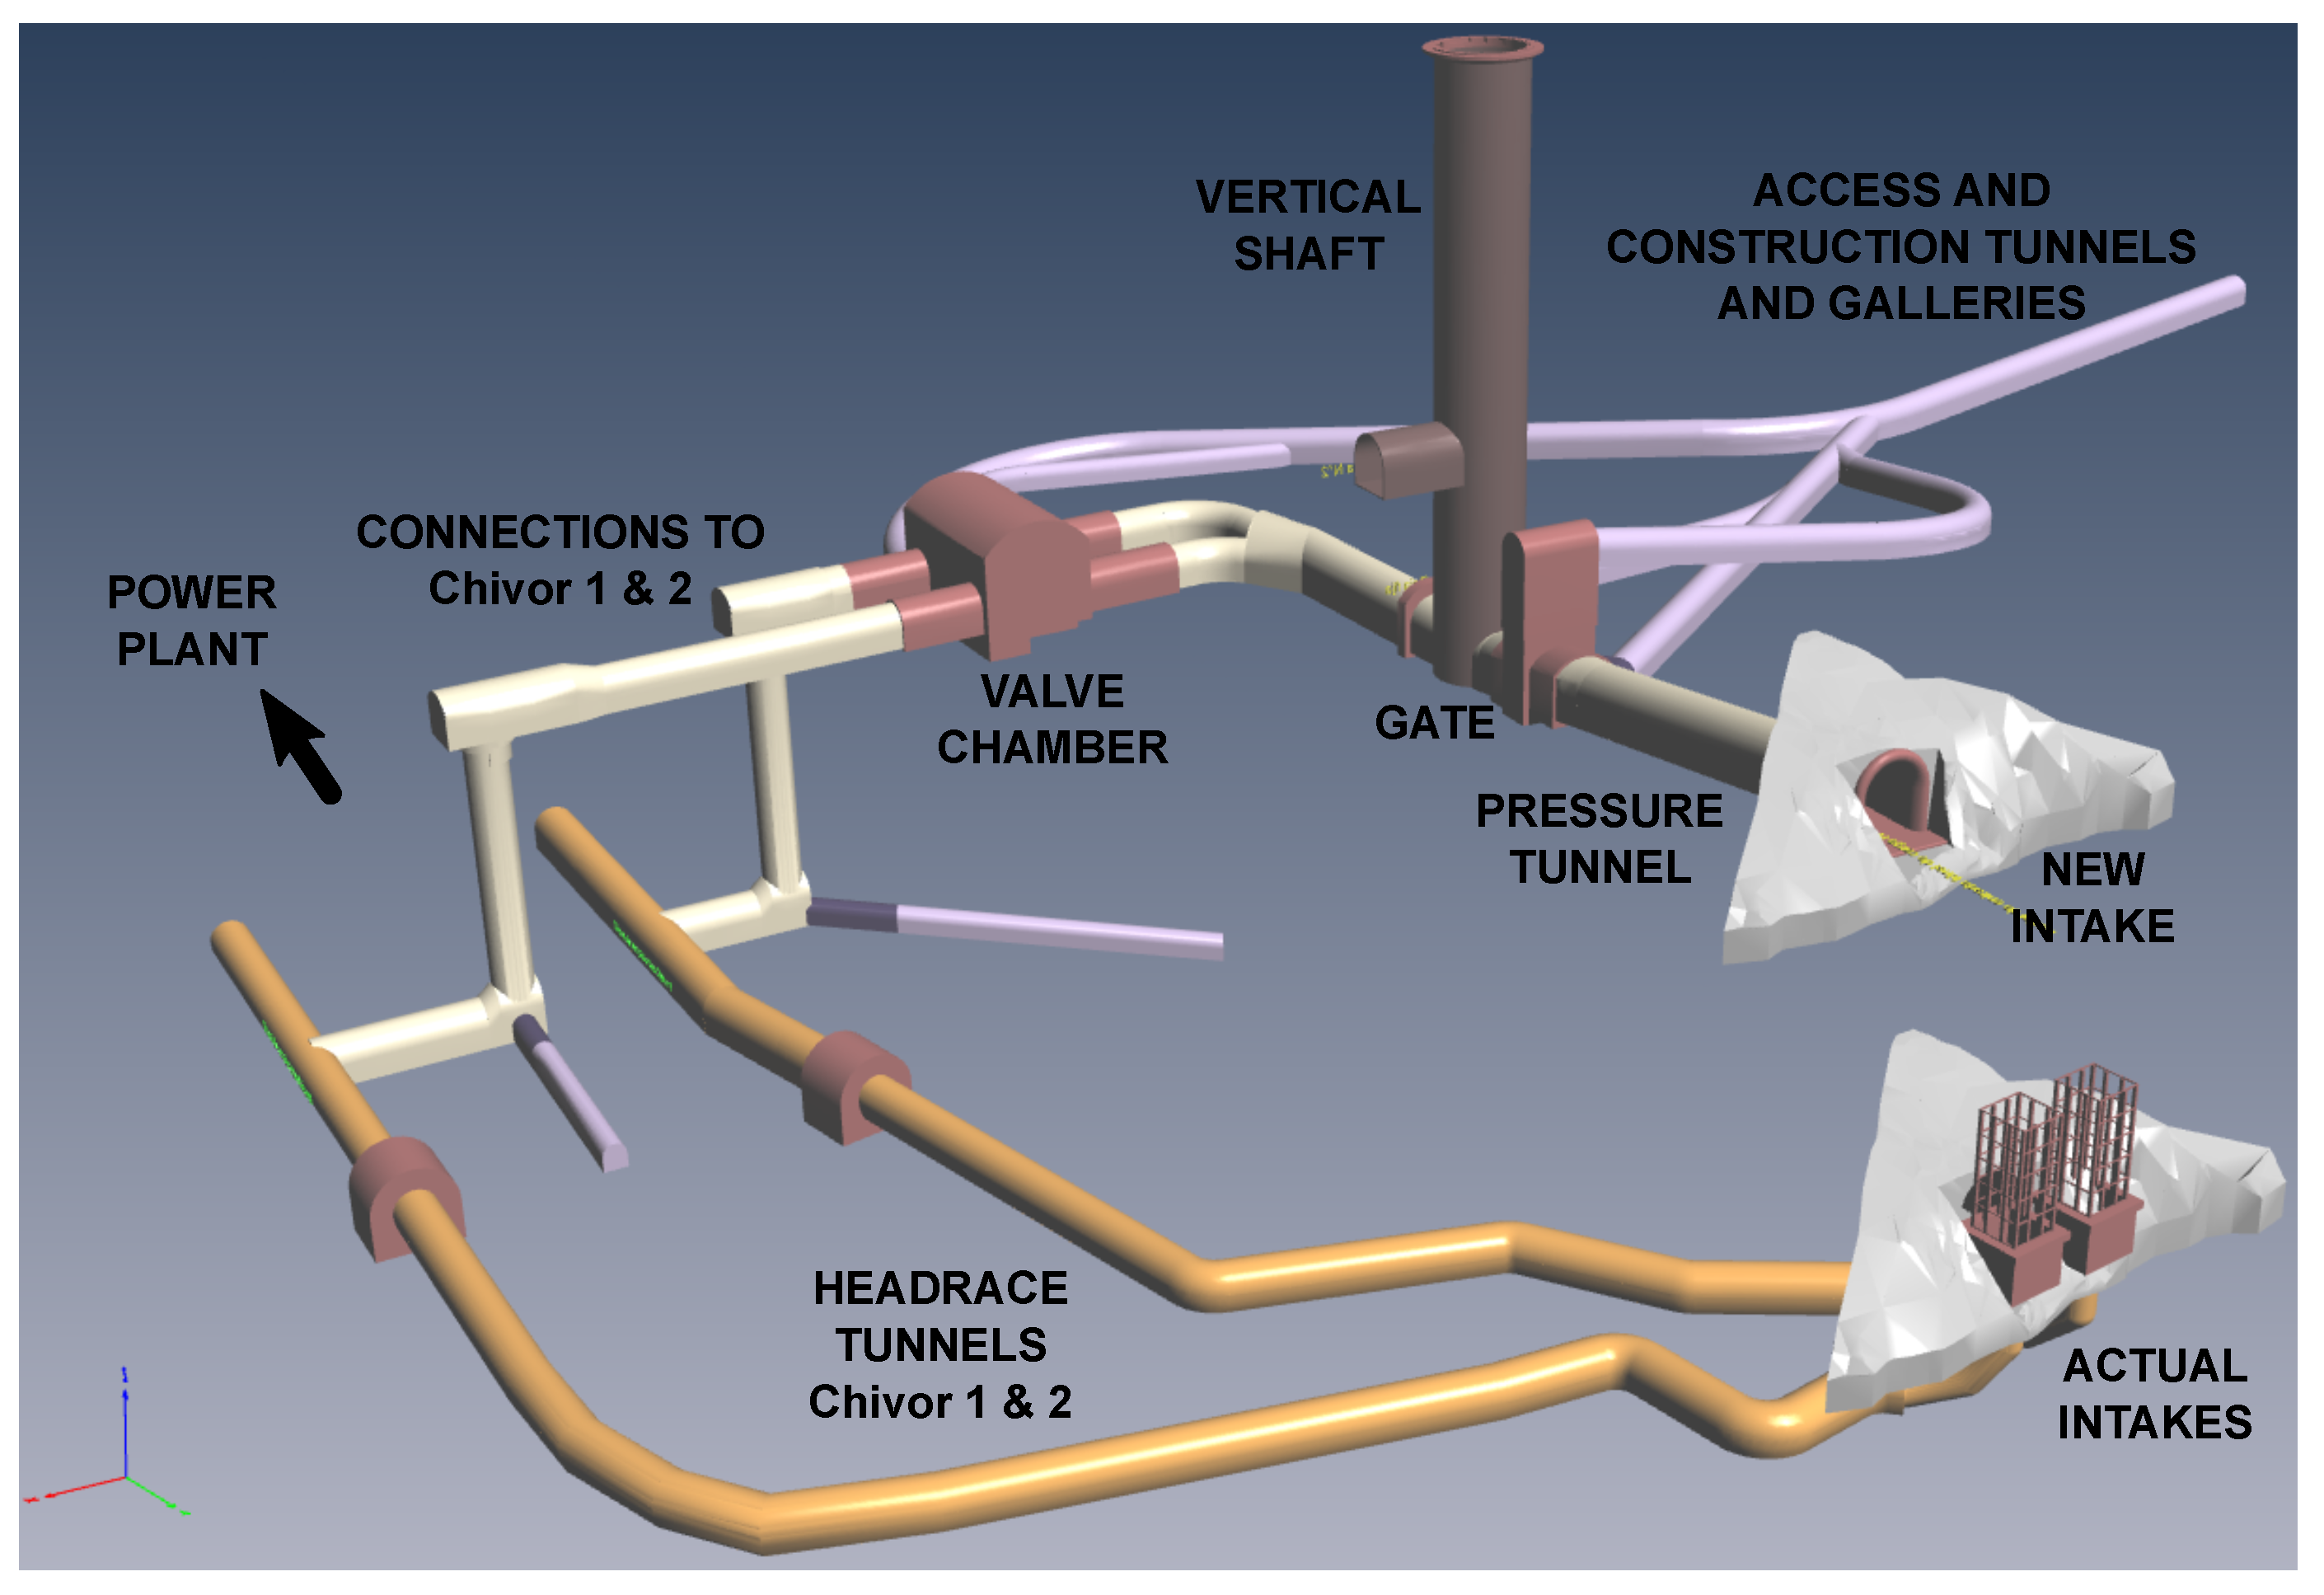
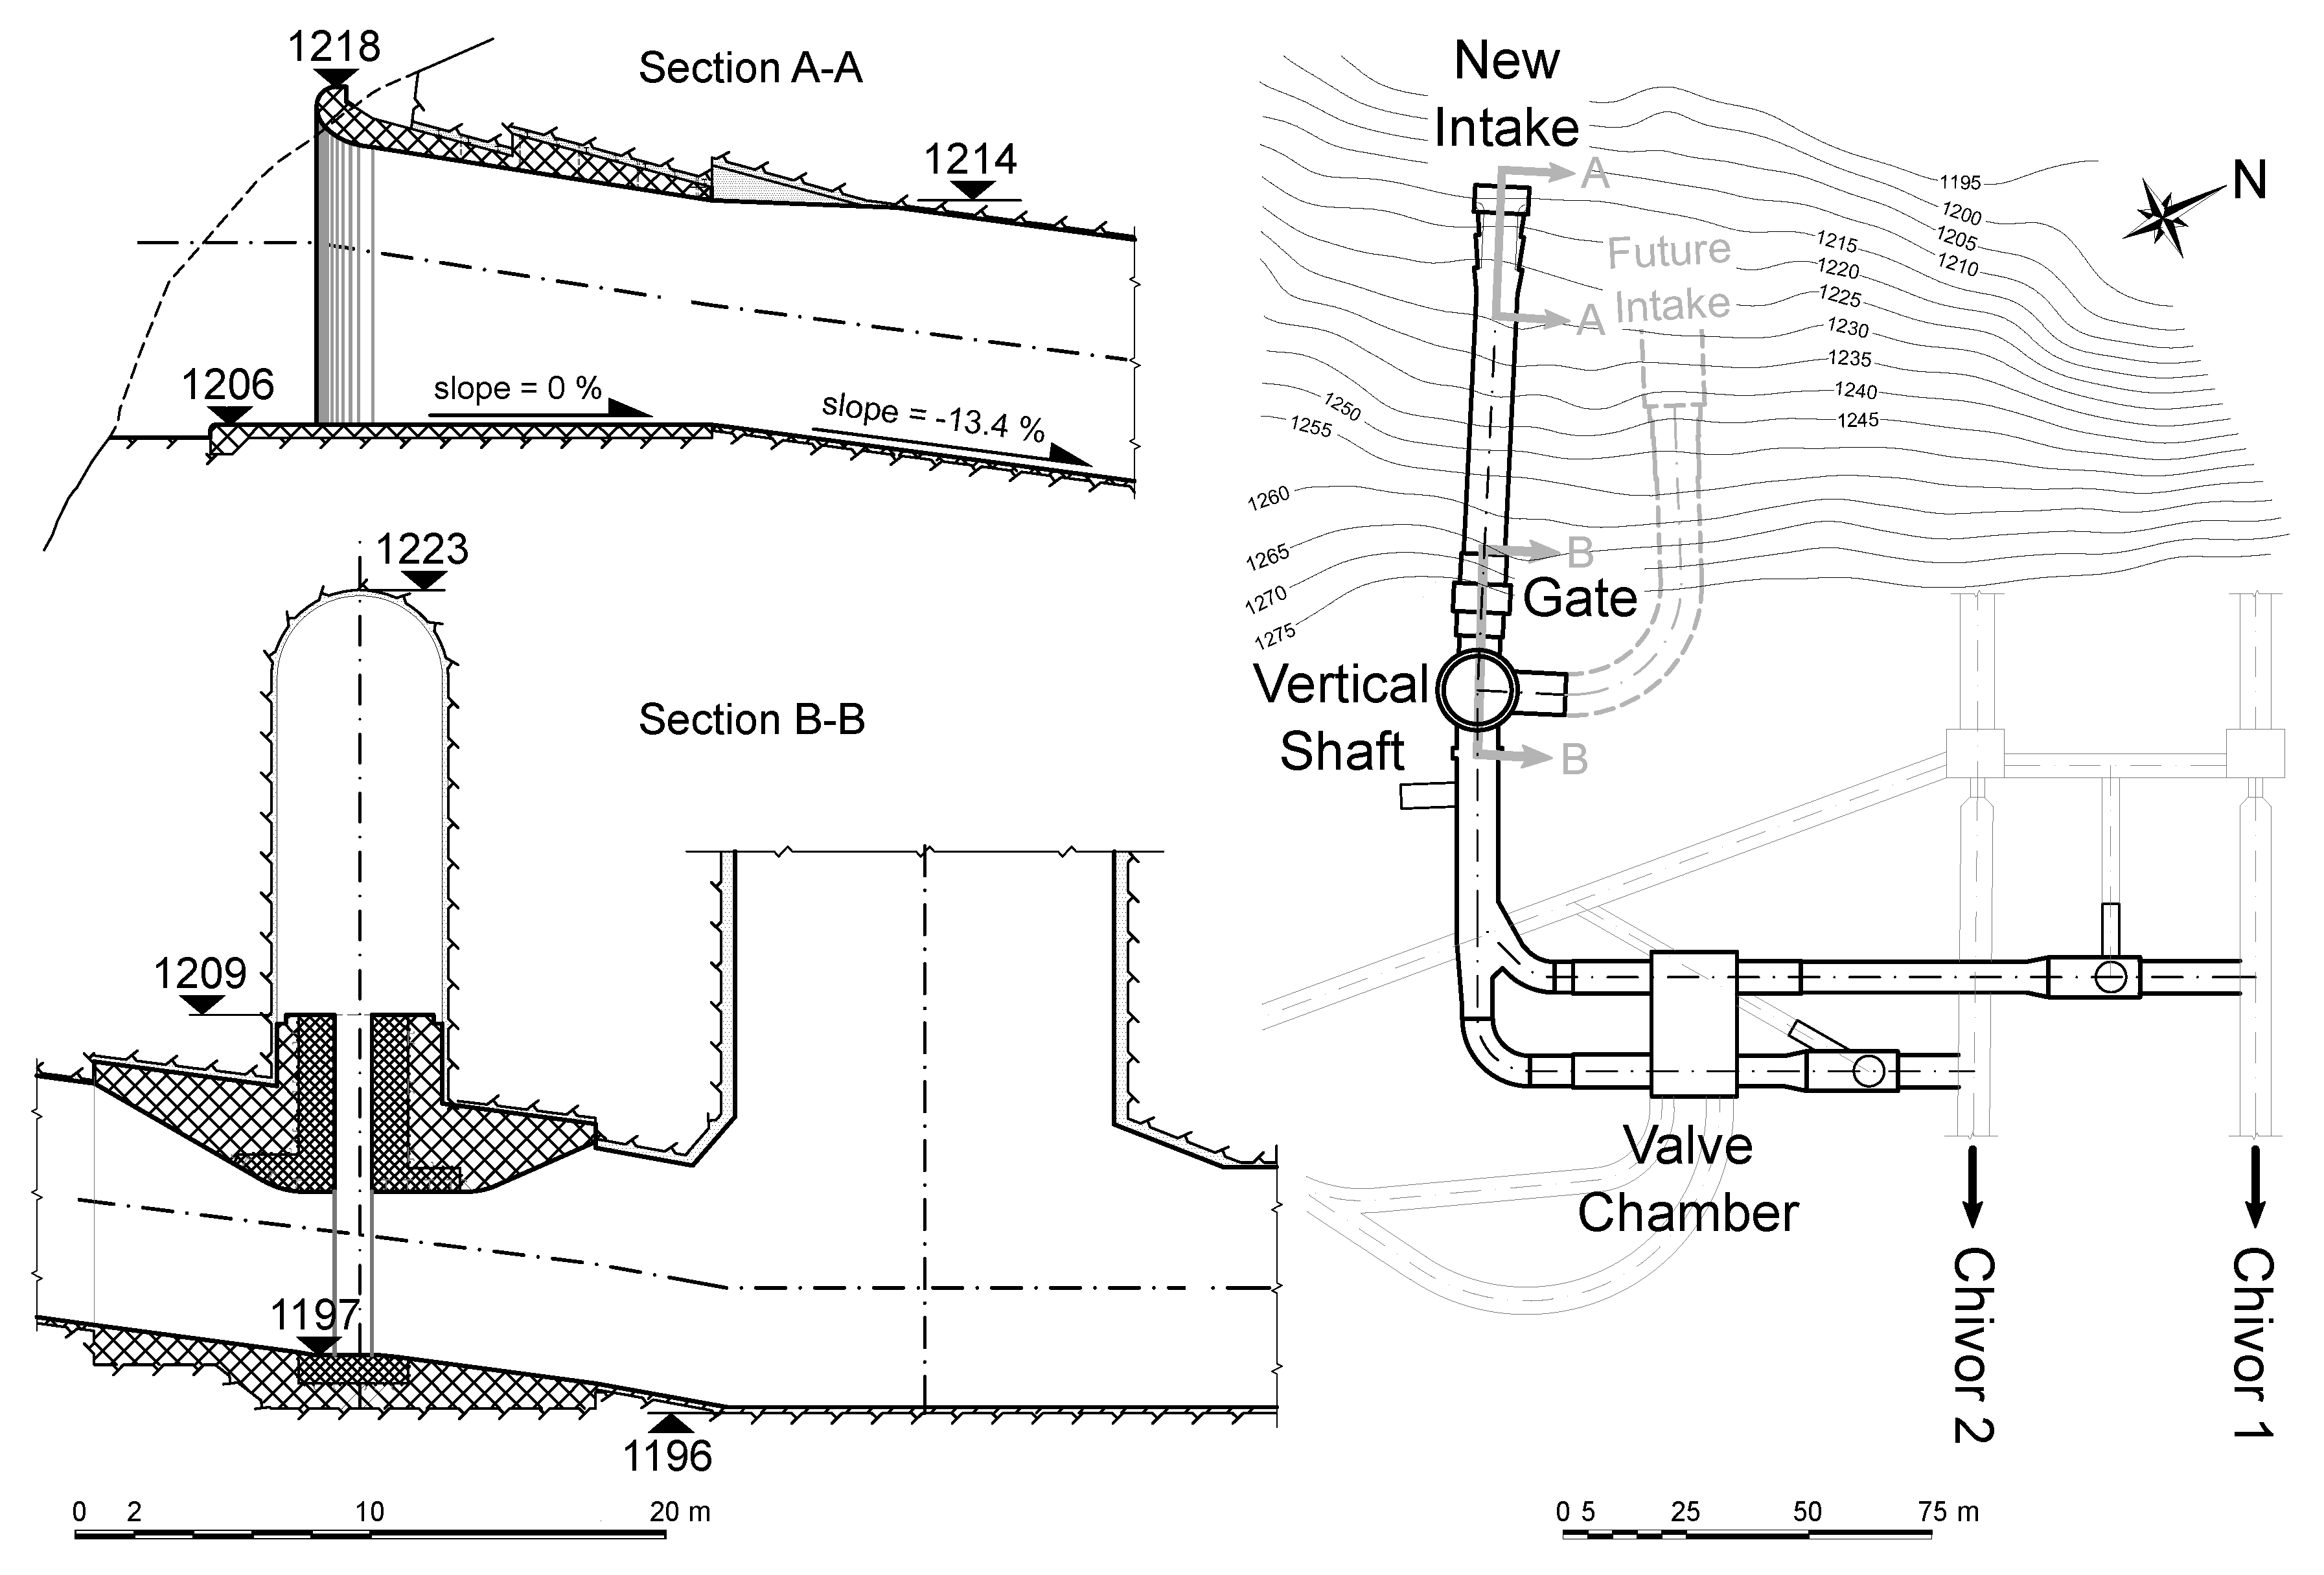
CLEP consists of the design and construction of new intakes at La Esmeralda reservoir, placed at higher levels than the existing ones, whose operation will be compromised in a few years (by 2027) by the increasing sediment level in the reservoir, Figure 4. The intakes (1206 m.a.s.l.) are connected to a 92 m-height vertical shaft with ϕ = 13.8 m through a 93 m long D-shaped pressure tunnel with a 8.5 × 8.5 m section, which ends at 1196 (m.a.s.l.). This vertical shaft will be used to connect future intakes, when sedimentation level will increase due to sediment dynamics not as a surge tank to absorb sudden rises of pressure. Then, the vertical shaft is connected through another D-shaped pressure tunnel with a 8.5 × 8.5 m section that is divided into two 6.3 × 6.3 m D-shaped pressure tunnels. Such two branches have a circular section with a diameter that varies between 4 m and 5.4 m, are shielded with steel, and are connected to the valve chamber, which consists of two 4 m-diameter butterfly valves for flow control. Finally, these branches are connected to the existent headrace tunnels (Chivor 1 & Chivor 2) through two vertical shafts that have a circular section with ϕ = 6.3 m, and that are 41 and 44 m long, respectively. From the hydraulic point of view, the geometry of the inlet intake includes a curved transition favoring the flow and preventing formation vortices at the inlet zone. Additionally, the minimum operation level is determined to be at 1220.34 m.a.s.l. regarding the topological conditions that ensure a 10 m inlet headwater, reducing the formation of an asymmetric approach flow.

2.3.2. Geo-Technical Design

The geotechnical design for the construction of the new intake system at La Esmeralda reservoir included a detailed geological analysis at different scales. The Chivor hydroelectric project is located at the eastern flank of the Eastern Andes Cordillera, which is characterized by the appearance of folded and deformed sedimentary sequences [33,34]. Several studies were performed to characterize the rocky mass in order to design the tunnels and to define appropriate construction methods for such underground structures. The studies include several geotechnical design methodologies, site visits, rock mass surveys, on-site drilling, and secondary geological information consulted from the design and construction of the hydropower project that were carried out back in the 1970s. This methodology allowed the designers to identify characteristics of the discontinuities for the classification of the rocky mass, including the appearance, geometry, type, and characteristics of the materials, the faults, and their influence on the fracturing of surrounding areas.
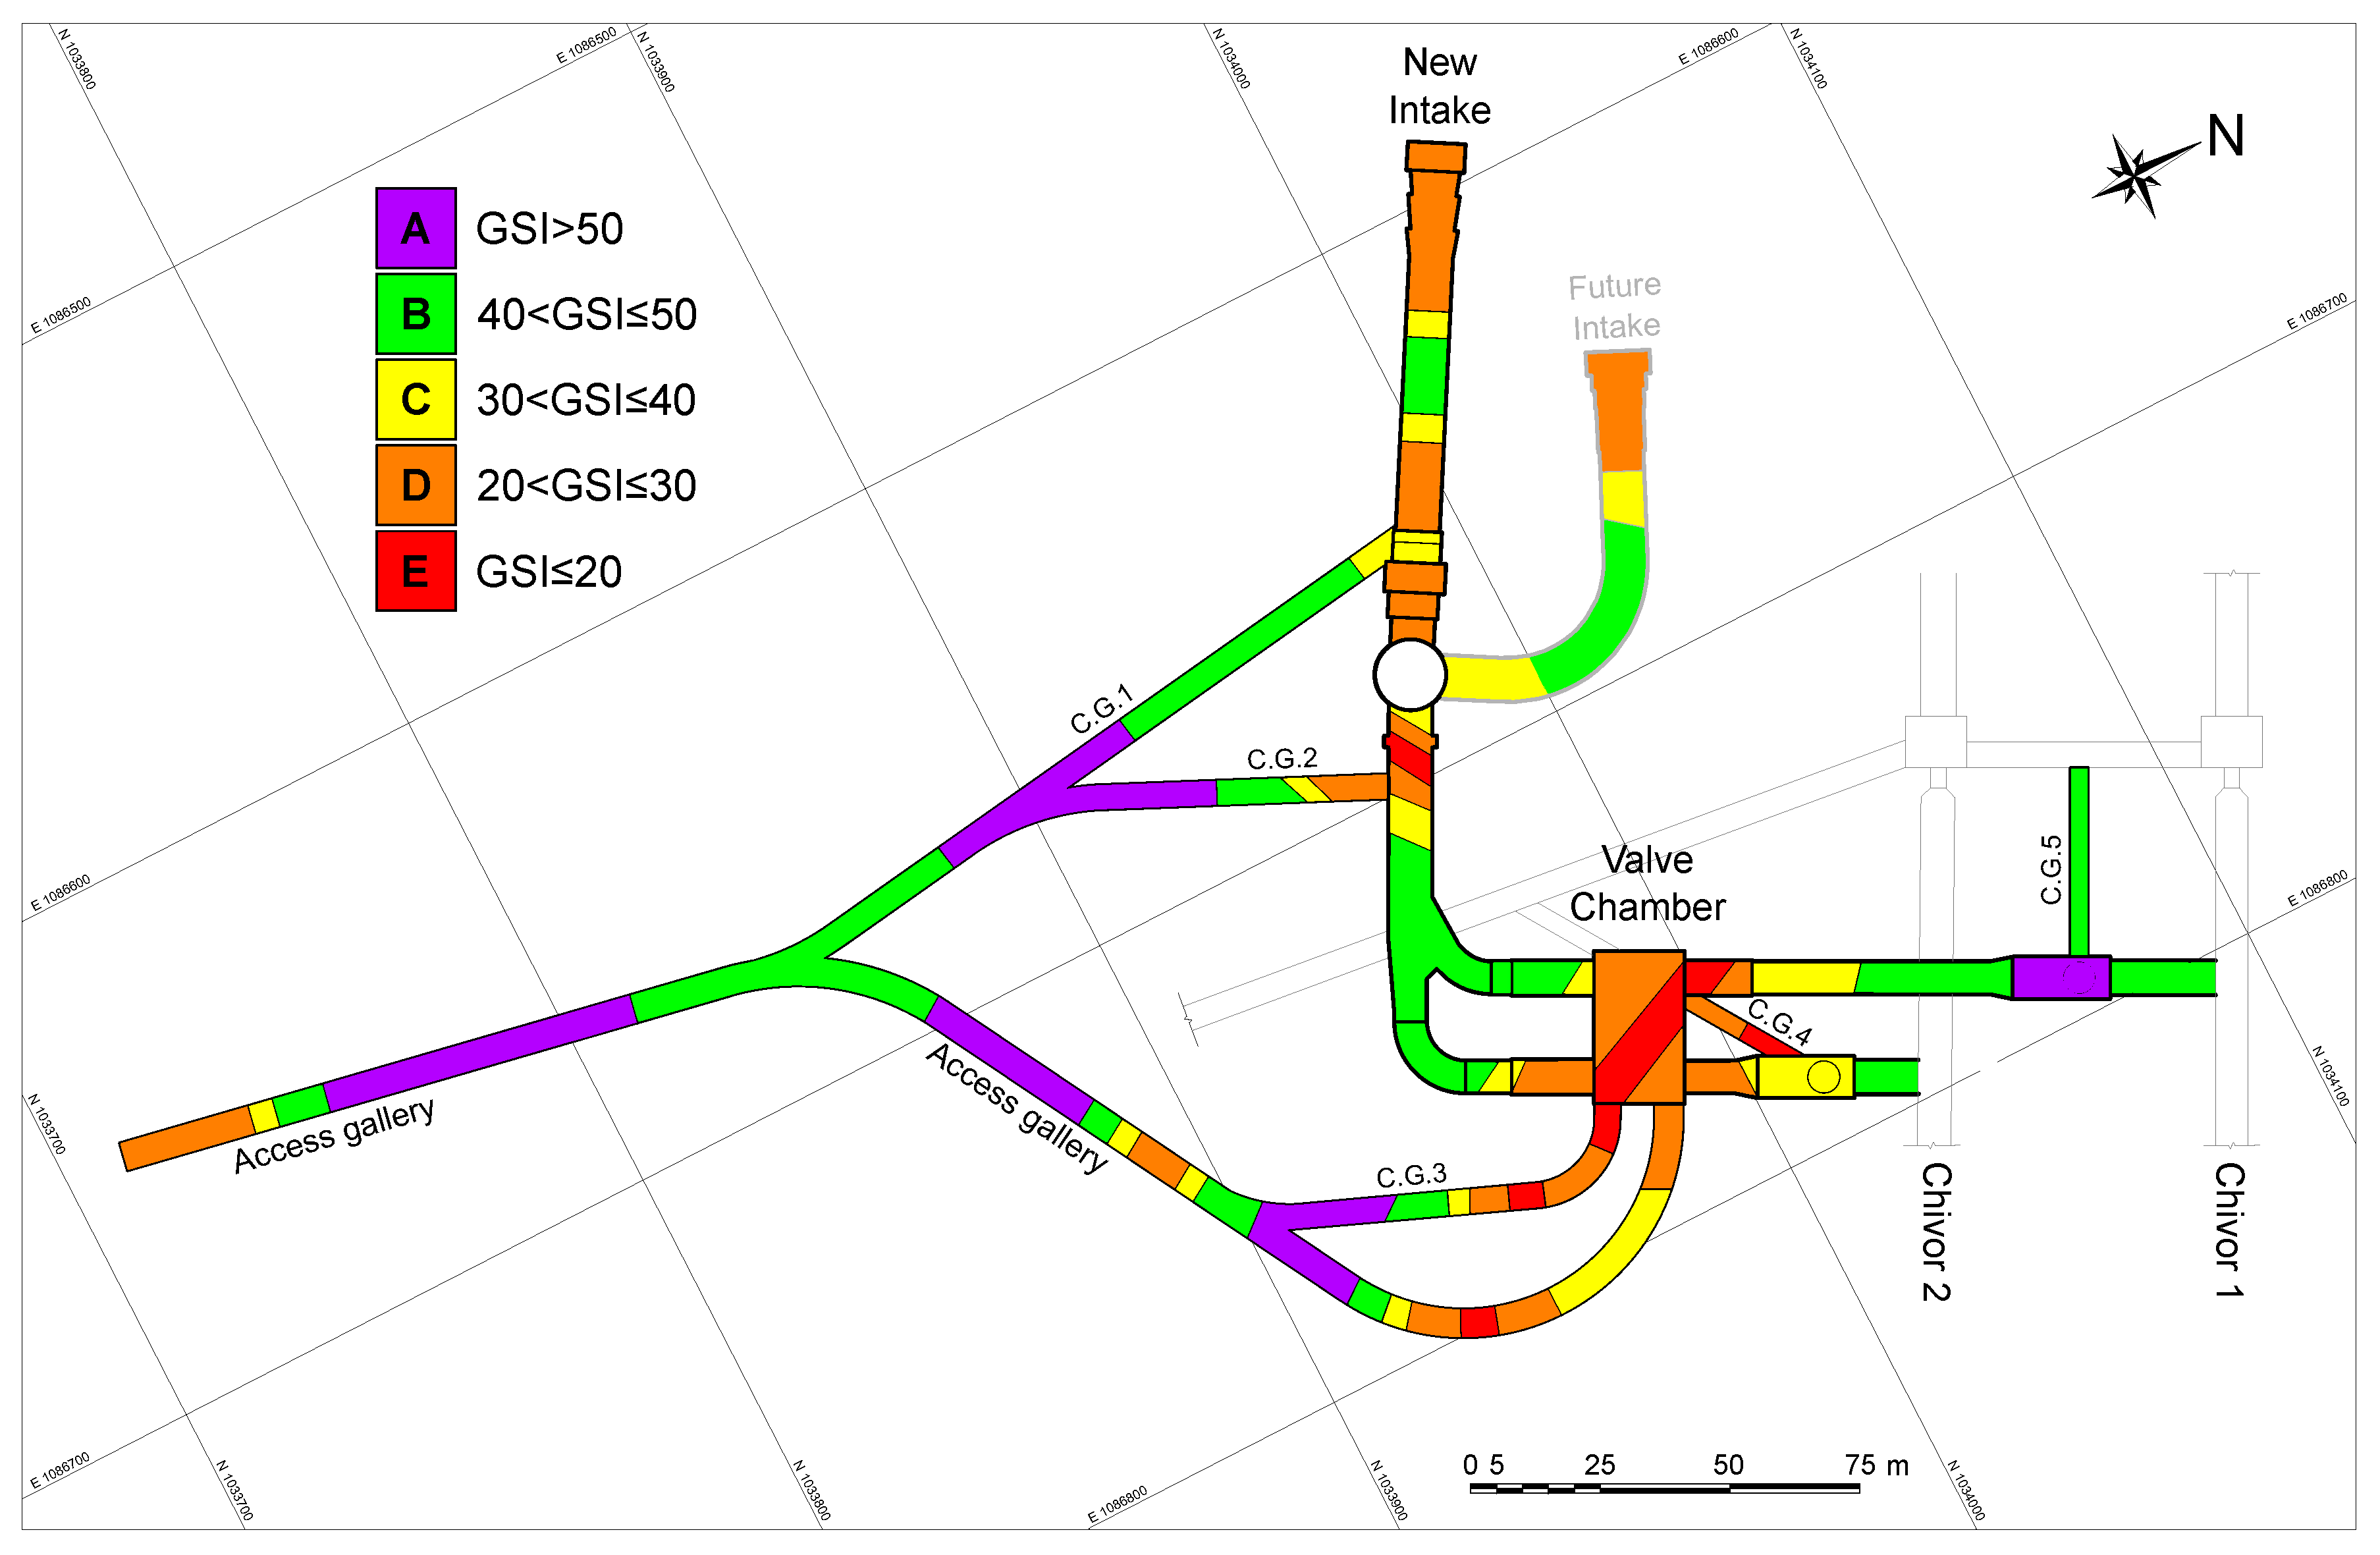
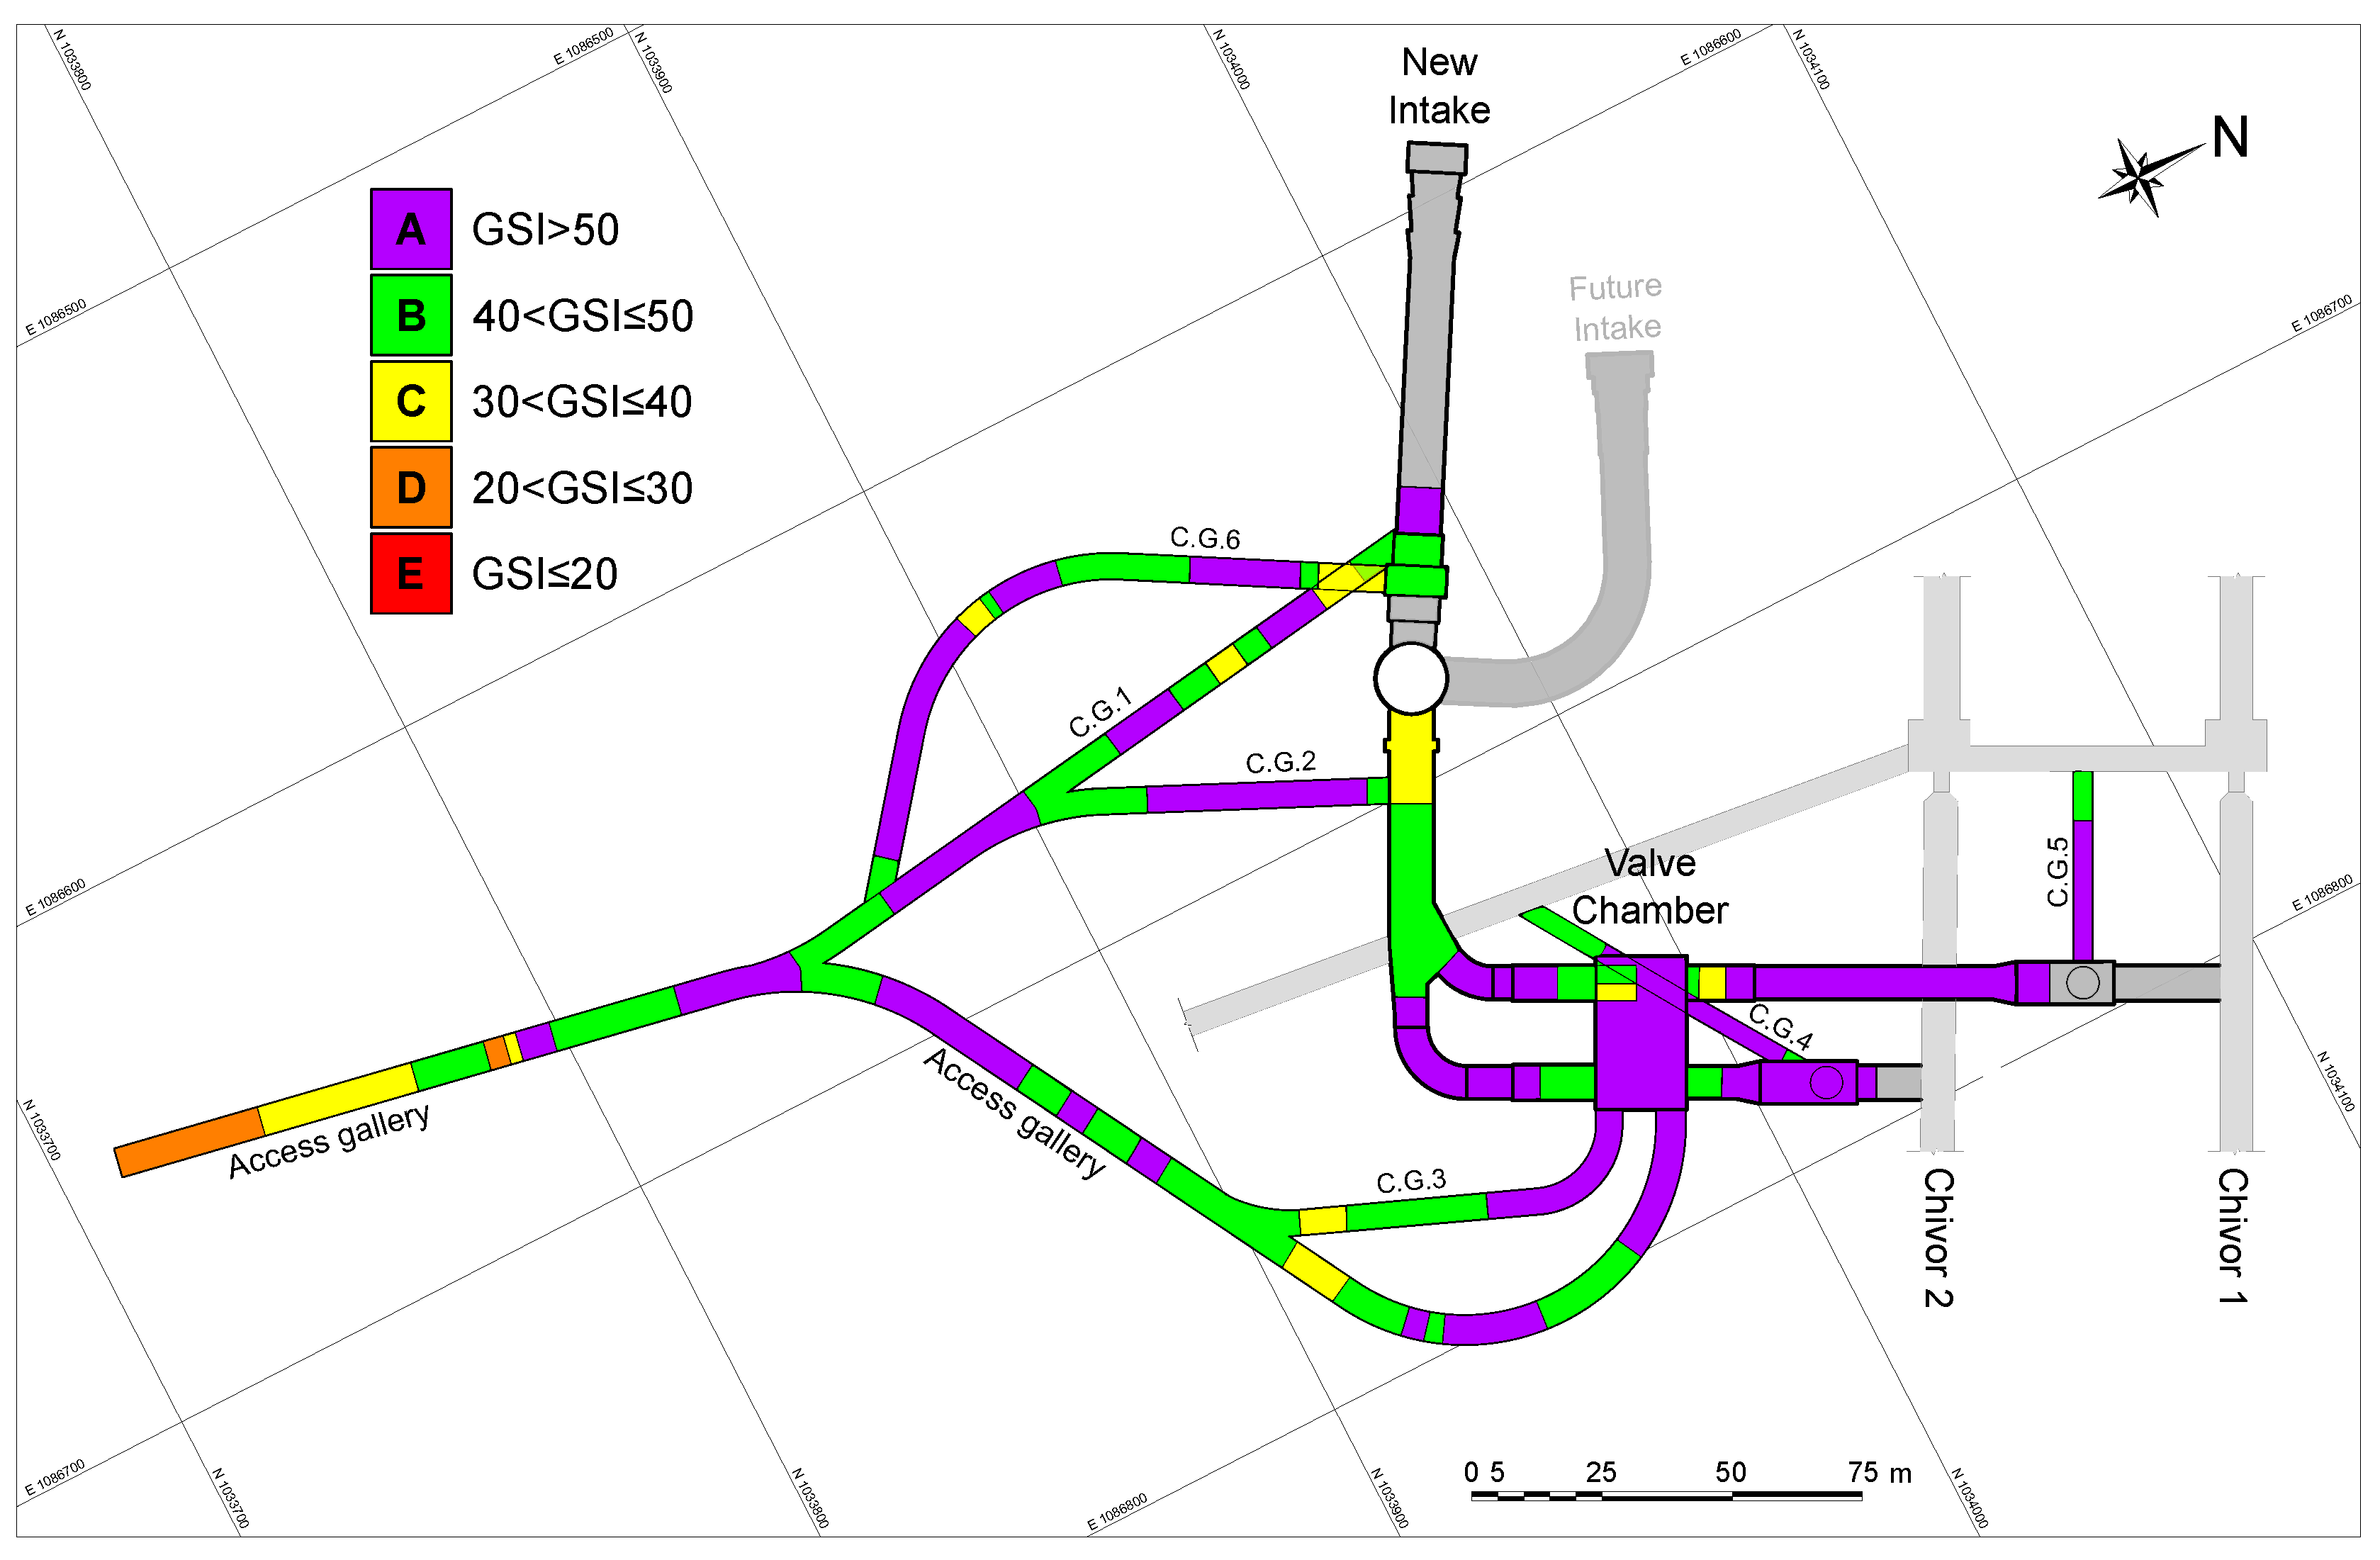
This information lead to a geological sectorization for all the underground and surface works considered in the CLEP. The characterization is based on the estimation of the Geological Strength Index (GSI) for the rocky mass [35]. Figure 5 shows the estimated geological characterization used for the design and construction of the underground structures. Five different zones were defined:
  • A: GSI > 50. Healthy, massive, hard rock;
  • B: 40 < GSI ≤ 50. Moderately fractured, partially deformed;
  • C: 30 < GSI ≤ 40. Moderately fractured, deformed, and/or affected by localized shear zones;
  • D: 20 < GSI ≤ 30. Strongly fractured, deformed, and/or affected by localized shear zones;
  • E: GSI ≤ 20. Very fractured, deformed, and/or affected by fault zones.
Initially, the pressure tunnels were designed with a horseshoe shape and together with all necessary calculations, a finite element analysis was performed using Phase 2 ® for each tunnel and rock class sector of the mass. Figure 6 shows an example for a section of the pressure tunnel, downstream the new intake, where the surrounding rock mass is classified as B-type.

2.3.3. Tunnel Linings

The tunnels are the conducts which bring the water from the intake to the powerhouse. The water transport shall occur preventing, or strongly limiting, possible seepages and water losses. Consequently, the final lining has the purpose to assure a durable stability of the tunnel as well as a durable support against the long-term rock loads and the external water pressure during the dewatering of the tunnels for the periodical inspections and maintenance works. In fact, during the dewatering process, a differential pressure between the internal and external water pressure will be built up. This critical condition is normally limited, defining a maximal dewatering rate (in the order of 1 m/h), which allows the external water pressure enough time to decrease together with the internal water pressure, providing the tunnels with drainage holes, which facilitate and speed up the decrease of the external water pressure acting on the tunnel. During the regular operation, the internal water pressure is considered equal to the external one, which is usually determined by the level of the water in the reservoir or at the intake. The final lining of the tunnel also has to protect the initial support and rock from erosion, corrosion, and leakage, in case of low groundwater level, reduced rock cover, high rock-mass permeability, or soluble rock.
These aspects were considered for the choice and sizing of the final lining, together with a consideration of the initial investment and maintenance costs. The most common types of lining for water tunnels are:
  • No lining;
  • Reinforced shotcrete lining;
  • Cast concrete lining;
  • Reinforced concrete lining, and
  • Steel lining.
The choice between the different types of lining was made considering both the operational characteristics of the plant and conditions of the rock in which the water tunnels were excavated, specifically relating the increase of the internal water pressure in the tunnel system between the intake and powerhouse, with the geomorphological, geological, and hydrogeological conditions along the considered water tunnel.

2.3.4. Hydraulic Design

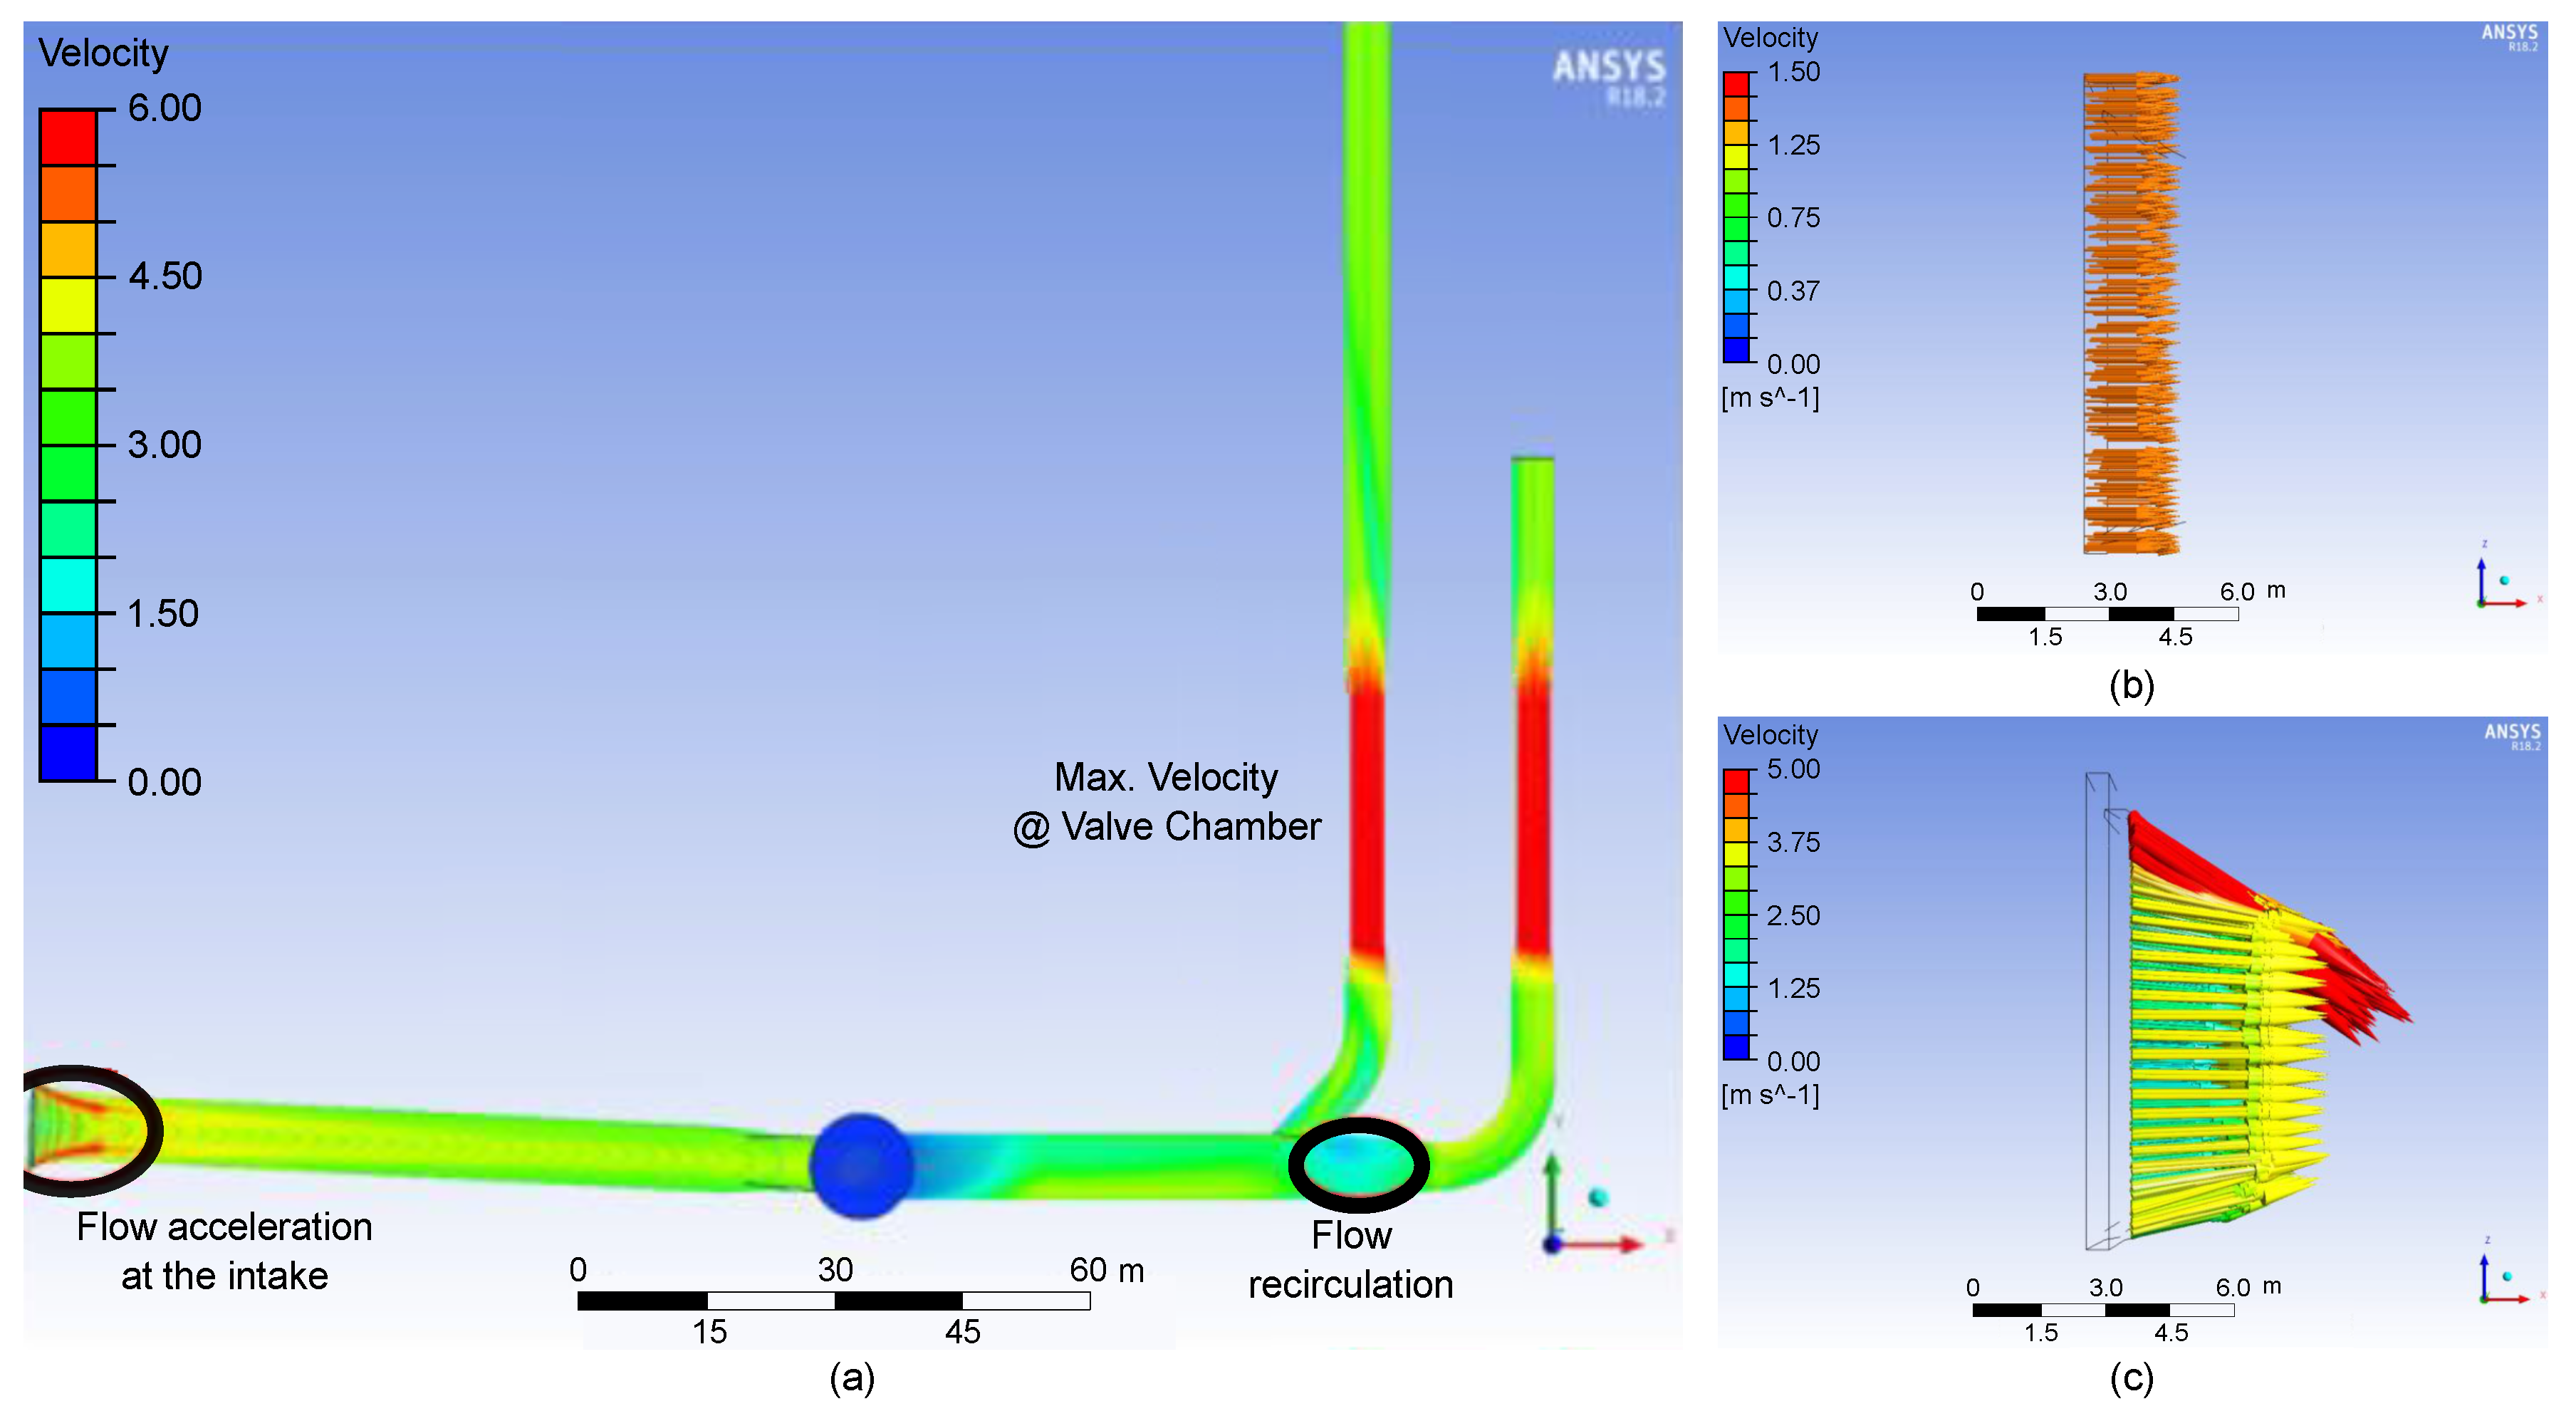
For the design of the pipeline cross sections, the main criterion considered is the permissible speed. This speed, as recommended in [36] has a value, depending on the material used for lining each corresponding section. For this new intake system, a design flow rate Q d = 160 m 3 /s has been defined. This value, and the maximum allowable speed permits to find the area of the section for which the restriction is met. Then, with such an area, the dimensions of the geometric shape of the tunnel are found. The initial design of the CLEP hydraulic system did not consider a gate upstream the vertical shaft. Such a gate was added in order to allow the construction project without stopping the operation of the hydropower plant. Initial estimates of the maximum speed for each section of the intake system were computed using both traditional equations addressed within several references and numerical computations using ANSYS® Fluent®, as shown in Figure 7. The numerical simulation scenario included the following characteristics:
  • Operation conditions. Simulations only considered steady-state behavior, and internal single-phase constant flow equal to the design flow Q d = 160 m 3 /s; water density was assumed as 1000 kg/m 3 and viscosity 1 × 10 3 Pas; and the hydrostatic input pressure was set corresponding to the minimal operation level of the reservoir at 1223.6 m.a.s.l.
  • Geometry. Figure 7 shows that the simulation geometry included the intake, pressure tunnel, bifurcation, valve chamber, and connections outlets to Chivor 1 and 2.
  • Discretization. The sizing method was used to generate the mesh, which is appropriated for complex geometries. In such a complex geometry, tetrahedral elements with low skewness are found; the maximum skewness was 0.88 in only 100 cells (less than 0.005% of the elements), and the average value was 0.18. The mesh comprised 1,711,774 elements and 490,139 nodes, with 0.5 m as the maximum size of the cell.
  • Numerical parameters. Convergence residuals were set to 1 × 10 4 and a minimum 2000 iterations was chosen; the simulation was set up for turbulent flow and the RANS (Reynolds Average Navier-Stokes equations) method was used with k-epsilon-RNG for turbulence estimation. RANS models are used extensively for the study of various components in hydroelectric plants [37]. Among that, the model is robust, requires less computational resources, and has reasonable precision for a wide range of turbulent flows [38].
  • Boundary conditions. The input boundary condition to the pressure tunnel was selected as “mass flow inlet” with a mass flow of 160,000 kg/s. Hydraulic losses were calibrated in order to determine the output energy and equally distribute the flow through the two branches of the valve chamber that are connected to Chivor 1 and 2. The output boundary condition (at the connection to Chivor 1 and 2) was set as “pressure outlet”. In this case the hydro-static pressure was specified, equivalent to the difference between the inlet and outlet levels, the dynamic pressure, and the hydraulic losses in the system. Frictions and geometry hydraulic energy losses were calculated between the new intake and the junction site with the existing pipelines. Minimal, maximum, and nominal values of the Manning’s roughness coefficients used to evaluate pressure losses were, respectively 0.012, 0.016, and 0.014 for the concrete lining. For the steel-lined sections, the Manning’s roughness coefficients used were 0.010, 0.014, and 0.012, respectively. Other boundaries were considered as no-slip walls.
Table 1 shows the maximum speed for each part of the intake system, considering the hydraulic section (area) and the lining type allowable speed as recommended in [36], and the presence of the new gate added after the initial design.
CFD simulations were used in this project to validate the limits defined in terms of maximum velocities within different sections of the pipeline, and not to provide an optimized design or changes in geometry. Also, the pressure losses in the proposed design were evaluated and compared with theoretically estimated values for lower and higher losses. CFD results obtained for both the velocity and the pressure drop are well adjusted concerning design and theoretical values used. Hydraulic calculations included the computation of distributed losses due to friction using the Darcy–Weisbach equation [39,40] and localized losses due to elements (elbows, bifurcations, etc.) as indicated in [40] for the design flow Q d = 160 m 3 /s. Table 2 shows the summary of the losses computed for the new intake system, which are low compared to the total head of the hydropower plant.
It is worth mentioning that all numerical simulations were settled under steady-state conditions allowing the evaluation of the intake design performance under nominal operation mass flow rate. Among that, the main parameters governing mass oscillations within a hydraulic system are the flow velocity, the moving water volume, and the surge cross-section area. The vertical shaft and its cross-section area were not modified. Verification of the mass oscillation within the vertical shaft due to the new intakes under a pressure surge event (e.g., fluid velocity alteration due to handling or failure of hydraulic devices, changes in water demand, human errors, etc.) showed no significant transient critical variations in respect to the original design operation.

3. Results

From a geological and hydrogeological point of view, the rock mass found during the construction process of the underground structures can be considered as sound and favorable, and with good to very good geotechnical characteristics, as shown in Figure 8. The inspection of the exposed rock during the excavation works and of the existing access tunnels and valve caverns confirmed this judgment. In fact, none of the existing access tunnels at Chivor is lined despite the length of time passed from construction in the 1970s and, in some cases, the very unfavorable geometry, the tunnels are stable. No recent instability can be observed nor has been reported over the operation period. In addition, the valve chamber have been lined only with shotcrete, despite the important dimensions of such an important structure.
The principal aspects considered for choosing the type of lining after the considerations listed in the design section are:
  • Rock mass resistance: Sound rock was detected in the area of the underground works. An evidence of this favorable condition is that more than 85% of the excavation was classified as type A or B, which represents the better rock quality on a scale from A to E. No rock class D or E was encountered along the hydraulic tunnel and shaft, as it can be seen in Figure 8;
  • Water table and rock mass permeability: The rock mass permeability is low in the area of the underground works and the water table is equal or slightly higher than the internal water pressure. Therefore, uncontrolled leakages can be excluded;
  • Rock stability: The rock mass present in the area is not susceptible to dissolution, swelling, or karst phenomena.
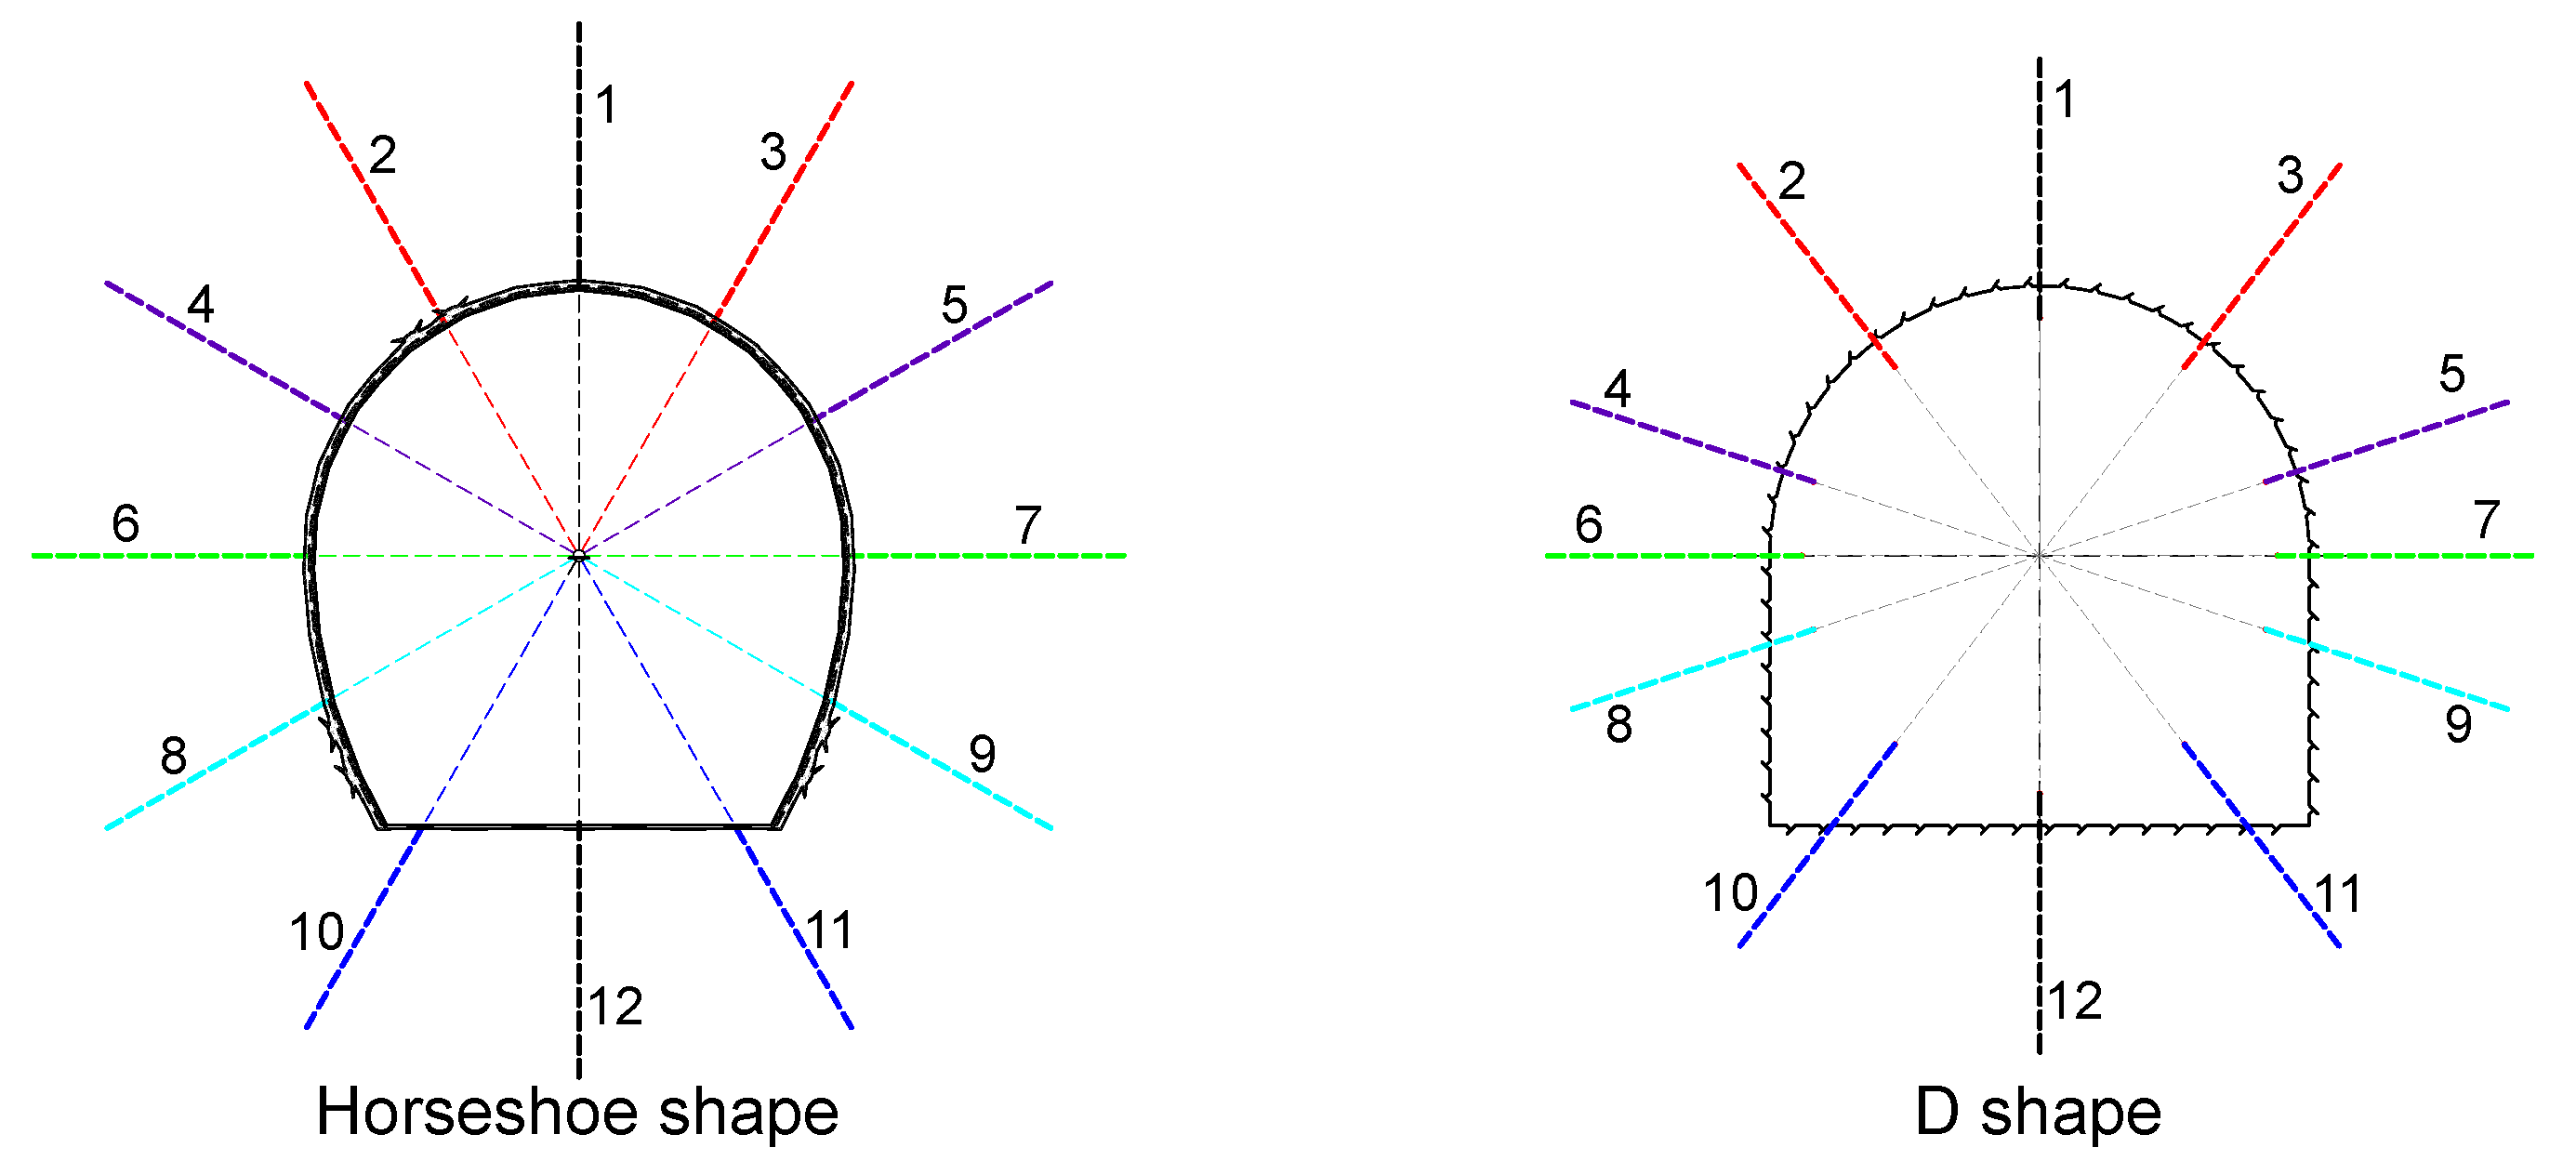
Considering the good rock quality found and in order to facilitate the construction works, the typical cross section of the tunnels changed (from the original design) from a horseshoe to a D-shape, and from casted concrete to shotcrete lining, Figure 9. This change increases the final tunnel section approximately by 5%, but limits the head losses due to the higher roughness of the shotcrete compared to the one of the cast concrete.
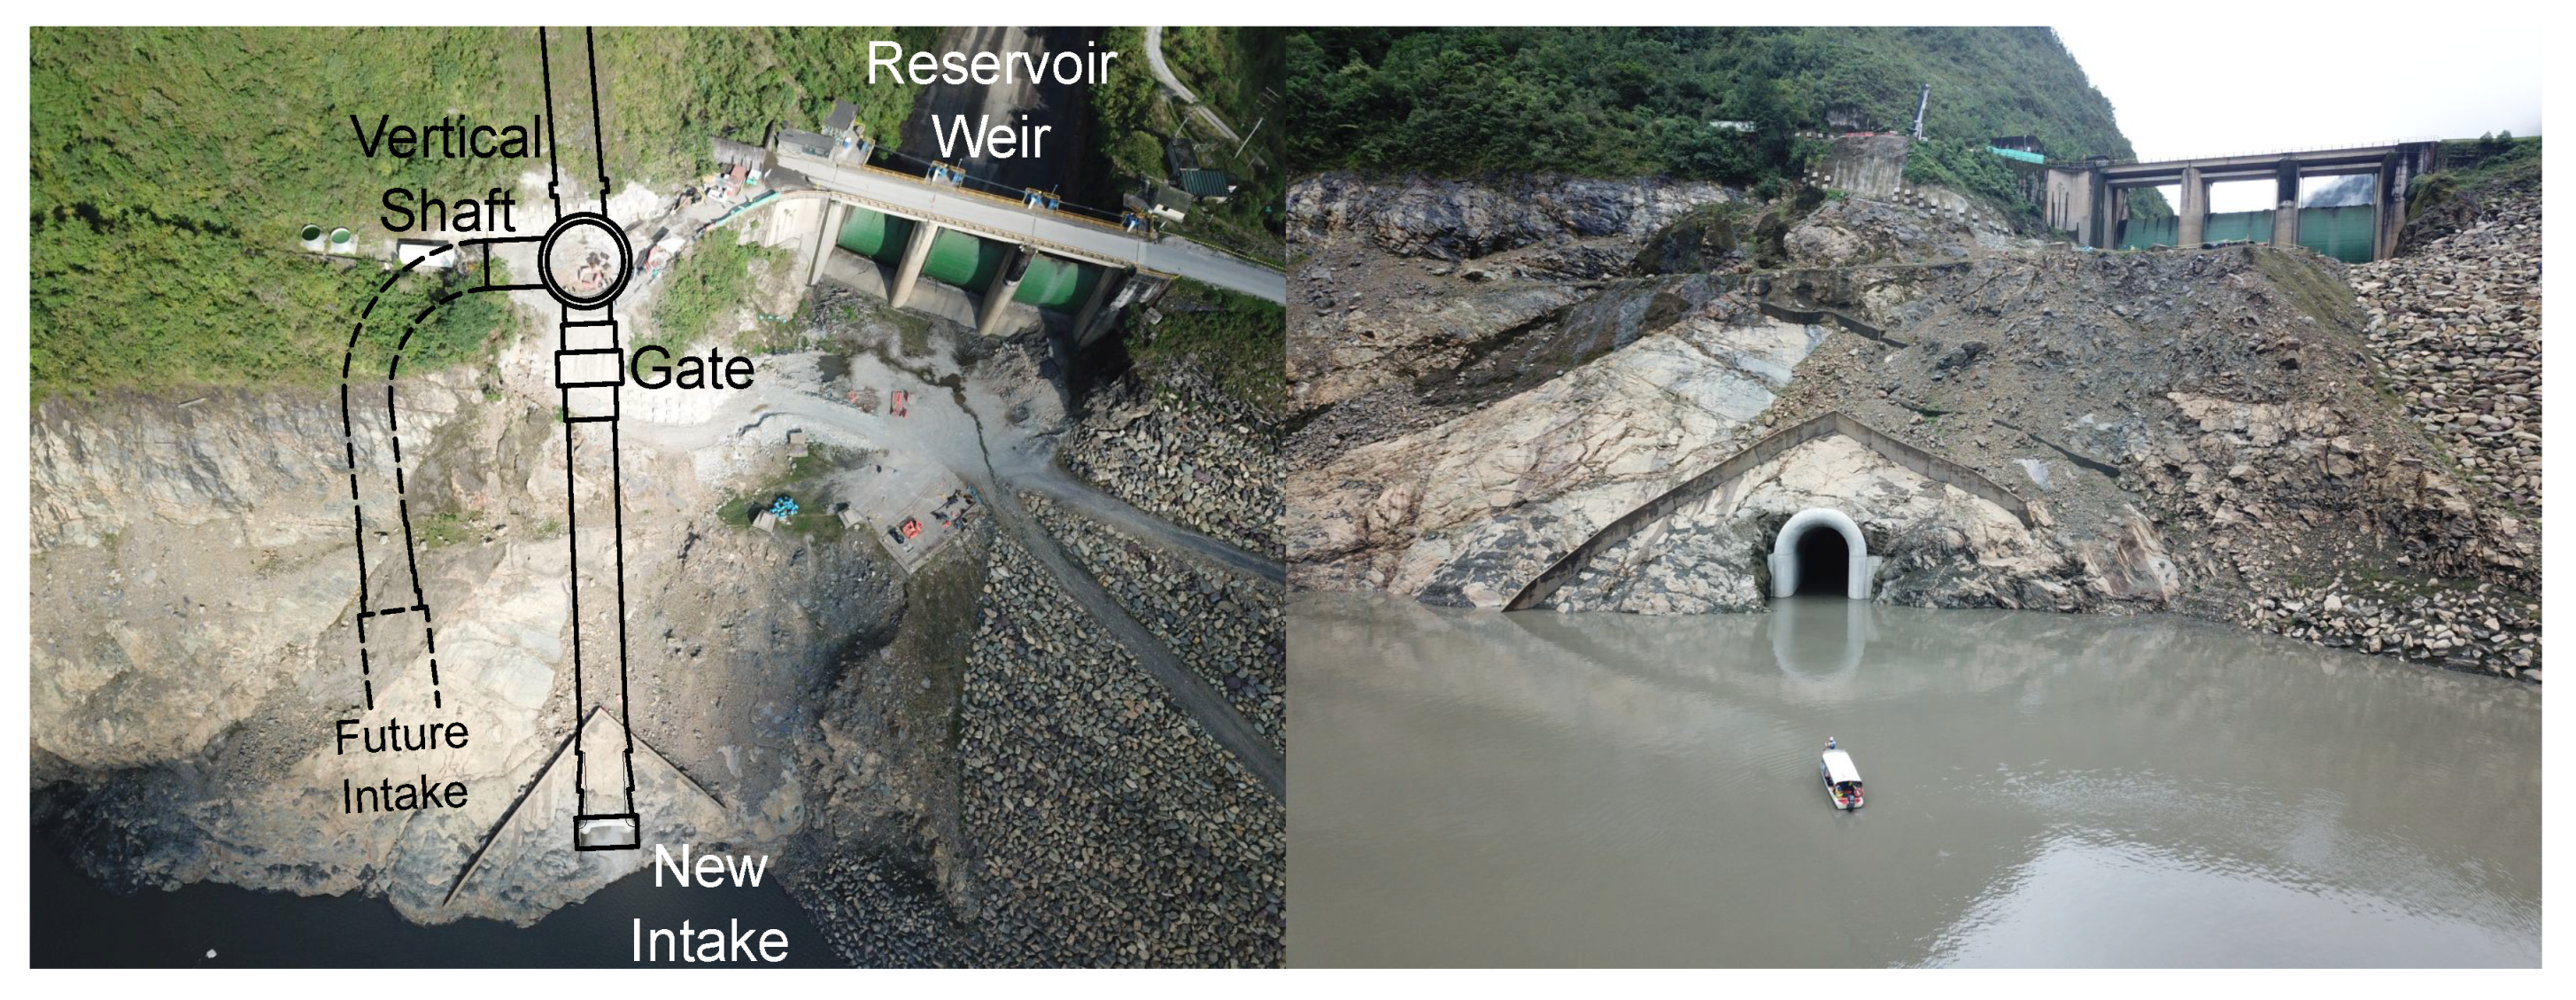
Figure 10 shows simplified design details of the new intake, the gate, and connections of the new intake systems to the existing headrace tunnels (Chivor 1 & 2). Figure 11 shows the new intake as seen at La Esmeralda reservoir.

4. Discussion

4.1. Design Process

Sediment management strategies and data analysis from La Esmeralda reservoir have been key components for the development of the CLEP. Sedimentation studies not only provide information on the condition of several components of the hrydropower plant (such as in Figure 3), but for the appropriate selection of the levels at which the new intakes are located, see Figure 2.
Major changes, such as changes in geometry, for the design of the new intakes were addressed in [32]. This work addresses part of the minor changes that AES conducted during detailed design and construction processes in order to appropriately find the dimension of the underground structures for such a new intake system. As mentioned in the results section, the quality of the rock that was found during the construction allowed changing details in order to avoid over-design of the lining, leading to a more robust support within the geotechnical frame. The fact that no low-class rock (D or E) was encountered, confirms this evaluation to justify such design changes. It must be underlined that the new design is supported by a large amount of information and experience related to the Chivor Hydropower project, compared to most hydroelectric and underground projects in general. The access to all data gathered during the construction of the existing plant since the 1970s, the availability of 1 to 1 scale, long standing geological exploration galleries (existing access and water tunnels operating for 50 years), and data coming from monitoring systems, resulted in an adequate and safe design for the new underground works of the Chivor Life Extension Project.

4.2. Construction Process

A key factor for the execution of CLEP was that all the construction has been done while the hydropower plant is still operating. This condition was achieved thanks to the final design characteristics that considered the construction of a bureau-type gate, in the pressure tunnel (Figure 4), that will be closed after the new intake is built, allowing the underground works to continue while the level of the reservoir rises again following its regular cycle. This gate will be operated as needed in a few years when the hydropower project will stop using the original intakes and the new intake system will enter into regular operation.
Considering the favorable geotechnical and hydrogeological conditions of the Chivor Powerplant, the adoption of a shotcrete lining for the water underground infrastructure of the plant represents a durable, stable, and cost-effective solution, which also allows reducing the construction time. The fact that the existing access tunnels do not have any kind of support and that part of the presently operating water tunnels is already lined with shotcrete, without any major problem reported during the almost 50-year long operation time of the plant, confirms the suitability of the proposed solution. It is important to note that it is not the type of lining itself which provides more or less reliability to the tunnel construction/operation, but the criteria of selection, the knowledge of the geological and hydrogeological component of the project, the design considerations, and the experience of the designers and builders.

4.3. Impact of CLEP on Colombia’s Energy Market

In 2015, the Colombian energy mix comprised [41] 56 generators, 12 transmitters, 31 distributors, 93 traders, and an installed capacity of the National Interconnection System of 16436 MW [27], with the possibility of supplying 98% of the total demand. Hydroelectric production represents 70%, while 29% is provided from thermal power plants. At the end of 2015, nine of the primary generation projects (five hydro and four thermal plants) were under construction. The generation capacity of these projects will be up to 2442 MW. The Colombian expansion plan for 2029 [41] establishes that by 2020 the energy demand will exceed the supply and an additional installed capacity between 4208.3 MW and 6675.5 MW will be required to ensure the reliability of the electric system. Colombian annual energy consumption in 2015 was 65816 GWh with a growing demand of 4.1% compared to 2014. Sectors responsible for this increase were the manufacturing industry with 43.6%, and mining with 22.6% [26].
In the most diverse scenario, where hydropower is not the dominant energy source, it is mandatory to incorporate conventional and non-conventional energy sources for electricity generation, including mostly wind and thermoelectric plants [42]. However, it is necessary to guarantee the operation of existing plants, preserving their capacity and function over time and most importantly, ensuring the reliability of the supply system when large amounts of electricity will be obtained from non-conventional sources. In this sense, the strategies identified in this work for the management of sediments may be implemented in other existing hydropower plants to ensure their operation over time, not only in Colombia but worldwide. The average Colombian electricity demand grew near to 3% during the last decade, which makes evident the need to develop this type of projects. Additionally, an eventual transit to a market of more than 40 billion dollars, as a result of the free trade agreements with the USA and European Union, a greater demand for energy driven by sectors such as mining, oil and manufacturing industry, is foreseeable.

5. Conclusions

This paper addressed the successful implementation of Chivor’s Life Extension Project (CLEP), developed by AES Corporation to extend the life of La Esmeralda reservoir, in order to prolong the life of an existing 1000-MW (6% of Colombia’s energy demand) powerplant for 50 more years, contributing to the sustainable energy supply for the future as stated in the 7th SDG: “Ensure access to affordable, reliable, sustainable and modern energy for all”.
The project was carried out by starting from sediment dynamics studies, considering geotechnical, hydraulic, and construction constraints for the development of a new intake system that will maintain the generation capacity, even with the volume reduction due to sedimentation in the reservoir, for at least 50 more years. Such an innovative project is the first of its class in Colombia and represents a case of study for the renovation of a large number of in-service water resources and hydropower plants that are in the aging stage.
As stated recently by Morris [23], most reservoirs worldwide have been designed using a 50–100 year planning horizon, with no further considerations. Hence, in order to make decisions towards the sustainable use of current reservoirs, managers need to consider first the implementation of sediment management plans, either dealing with the sediment balance or adapting infrastructure, as reported in this work. The successful implementation of a hydropower plant life-extension project needs to include, additionally, a detailed analysis of the status of all the infrastructure and components of the plant, including intakes, headrace tunnels, penstoke, valves, generators, transformers, among others.

Author Contributions

Conceptualization, H.M., D.A.d.R., C.N.-L., R.E.V. and A.E.-A.; methodology, H.M. and D.A.d.R.; validation, H.M., D.A.d.R., C.N.-L., R.E.V. and A.E.-A.; formal analysis, C.N.-L., R.E.V. and A.E.-A.; investigation, H.M., D.A.d.R., C.N.-L., R.E.V. and A.E.-A.; writing—original draft preparation, C.N.-L., R.E.V. and A.E.-A.; writing—review and editing, C.N.-L., R.E.V. and A.E.-A.; supervision, C.N.-L., R.E.V. and A.E.-A. All authors have read and agreed to the published version of the manuscript.

Funding

This work was developed with the funding of AES Corporation (AES Chivor) and is partially registered in the Colombian Ministry of Science, Technology, and Innovation (Minciencias) as a technological development project “Implementación de estrategias en operación y desarrollo de infraestructura para el manejo adecuado de sedimentos que permitan extender la vida útil operativa del embalse la esmeralda”, as allowed by the National Tax Benefits Council, Project 5520-786-65264.

Acknowledgments

The authors would like to thank AES Corporation and all the teams that have participated within Chivor’s Life Extension Project.

Conflicts of Interest

The authors declare no conflict of interest.

References

  1. United Nations. World Population Prospects 2019: Highlights; Technical Report ST/ESA/SER.A/423; United Nations, Department of Economic and Social Affairs, Population Division: New York, NY, USA, 2019. [Google Scholar]
  2. IEA. World Energy Outlook 2019; Technical Report WEO-2019; International Energy Agency: Paris, France, 2019. [Google Scholar]
  3. United Nations. The Sustainable Development Goals Report 2020; Technical Report; United Nations Publications: New York, NY, USA, 2020. [Google Scholar]
  4. International Energy Agency (IEA); The World Bank. Sustainable Energy for All 2017—Progress Toward Sustainable Energy (Summary); Technical Report; License: Creative Commons Attribution CC BY 3.0 IGO; World Bank: Washington, DC, USA, 2017. [Google Scholar]
  5. Su, H.; Hu, J.; Yang, M.; Wen, Z. Assessment and prediction for service life of water resources and hydropower engineering. Nat. Hazards 2015, 75, 3005–3019. [Google Scholar] [CrossRef]
  6. Stoll, B.; Andrade, J.; Cohen, S.; Brinkman, G.; Martinez-Anido, C.B. Hydropower Modeling Challenges; Technical Report NREL/TP-5D00-68231; Prepared under Task No. WFGX.1040; National Renewable Energy Laboratory: Denver, CO, USA, 2017. [Google Scholar]
  7. Malovic, D.; Engelmann-Pilger, H.; Arsenijevic, N.; Gassner, K.B.; Merle-Beral, E.; Monti, G.; Pooley, J.; Inouye, L.K.; Levin, J.; Kellenberg, J. Hydroelectric Power: A Guide for Developers and Investors; Technical Report 99392; World Bank Group: Washington, DC, USA, 2015. [Google Scholar]
  8. Kondolf, G.M.; Gao, Y.; Annandale, G.W.; Morris, G.L.; Jiang, E.; Zhang, J.; Cao, Y.; Carling, P.; Fu, K.; Guo, Q.; et al. Sustainable sediment management in reservoirs and regulated rivers: Experiences from five continents. Earth’s Future 2014, 2, 256–280. [Google Scholar] [CrossRef]
  9. World Water Council. Analysis of the 3rd World Water Forum; Technical Report; World Water Council: Marseille, France, 2003. [Google Scholar]
  10. Morris, G.L. Modern Water Resources Engineering. In Handbook of Environmental Engineering; Chapter Sediment Management and Sustainable Use of Reservoirs; Humana Press: Totowa, NJ, USA, 2014; Volume 15, pp. 279–337. [Google Scholar] [CrossRef]
  11. Annandale, G.W.; Morris, G.L.; Karki, P. Extending the Life of Reservoirs: Sustainable Sediment Management for Dams and Run-of-River Hydropower; Directions in Development; License: Creative Commons Attribution CC BY 3.0 IGO; World Bank: Washington, DC, USA, 2016. [Google Scholar] [CrossRef]
  12. Annandale, G.W.; Dinar, A.; Palmieri, A.; Shah, F. Reservoir Conservation: Economic and Engineering Evaluation of Alternative Strategies for Managing Sedimentation in Storage Reservoirs: RESCON Approach; Technical Report 34954; World Bank: Washington, DC, USA, 2003. [Google Scholar]
  13. Haun, S.; Kjærås, H.; Løvfall, S.; Olsen, N.R.B. Three-dimensional measurements and numerical modelling of suspended sediments in a hydropower reservoir. J. Hydrol. 2013, 479, 180–188. [Google Scholar] [CrossRef]
  14. Gabbud, C.; Lane, S.N. Ecosystem impacts of Alpine water intakes for hydropower: The challenge of sediment management. WIREs Water 2016, 3, 41–61. [Google Scholar] [CrossRef]
  15. Schleiss, A.J.; Franca, M.J.; Juez, C.; Cesare, G.D. Reservoir sedimentation. J. Hydraul. Res. 2016, 54, 595–614. [Google Scholar] [CrossRef]
  16. Alighalehbabakhani, F.; Miller, C.J.; Selegean, J.P.; Barkach, J.; Abkenar, S.M.S.; Dahl, T.; Baskaran, M. Estimates of sediment trapping rates for two reservoirs in the Lake Erie watershed: Past and present scenarios. J. Hydrol. 2017, 544, 147–155. [Google Scholar] [CrossRef]
  17. Adeogun, A.G.; Sule, B.F.; Salami, A.W. Cost effectiveness of sediment management strategies for mitigation of sedimentation at Jebba Hydropower reservoir, Nigeria. J. King Saud Univ. Eng. Sci. 2018, 30, 141–149. [Google Scholar] [CrossRef] [Green Version]
  18. Kim, H.Y.; Fontane, D.G.; Julien, P.Y.; Lee, J.H. Multiobjective Analysis of the Sedimentation behind Sangju Weir, South Korea. J. Water Resour. Plan. Manag. 2018, 144, 05017019. [Google Scholar] [CrossRef]
  19. Gabl, R.; Gems, B.; Birkner, F.; Hofer, B.; Aufleger, M. Adaptation of an Existing Intake Structure Caused by Increased Sediment Level. Water 2018, 10, 1066. [Google Scholar] [CrossRef] [Green Version]
  20. Razad, A.A.; Abbas, N.; Sidek, L.M.; Alexander, J.; Jung, K. Sediment Management Strategies for Hydropower Reservoirs in Active Agricultural Area. Int. J. Eng. Technol. 2018, 7, 228–233. [Google Scholar] [CrossRef] [Green Version]
  21. Jansen, L. Sediment Management Strategies-Case Study on Hydropower Reservoirs in Malaysia. In ICDSME 2019; Springer: Singapore, 2020; pp. 417–430. [Google Scholar] [CrossRef]
  22. Hauer, C.; Wagner, B.; Aigner, J.; Holzapfel, P.; Flödl, P.; Liedermann, M.; Tritthart, M.; Sindelar, C.; Pulg, U.; Klösch, M.; et al. State of the art, shortcomings and future challenges for a sustainable sediment management in hydropower: A review. Renew. Sustain. Energy Rev. 2018, 98, 40–55. [Google Scholar] [CrossRef]
  23. Morris, G. Classification of Management Alternatives to Combat Reservoir Sedimentation. Water 2020, 12, 861. [Google Scholar] [CrossRef] [Green Version]
  24. Bermúdez, M.; Cea, L.; Puertas, J.; Conde, A.; Martín, A.; Baztán, J. Hydraulic model study of the intake-outlet of a pumped-storage hydropower plant. Eng. Appl. Comput. Fluid Mech. 2017, 11, 483–495. [Google Scholar] [CrossRef]
  25. González-Zeas, D.; Rosero-López, D.; Walter, T.; Flecker, A.; Lloret, P.; De Bièvre, B.; Condom, T.; Osorio, R.; Dangles, O. Designing Eco-Friendly Water Intake Portfolios in a Tropical Andean Stream Network. Water Resour. Res. 2019, 55, 6946–6967. [Google Scholar] [CrossRef]
  26. DNP. Energy Demand Situation in Colombia; Technical Report; Departamento Nacional de Planeación: Bogotá, Colombia, 2017. [Google Scholar]
  27. DNP. Energy Supply Situation in Colombia; Technical Report; Departamento Nacional de Planeación: Bogotá, Colombia, 2017. [Google Scholar]
  28. REN21. Renewables 2018 Global Status Report. In A Comprehensive Annual Overview of the State of Renewable Energy; Technical Report GSR2018; REN21 Secretariat: Paris, France, 2018. [Google Scholar]
  29. Paredes, J.R.; Ramírez, J.J. Variable Renewable Energies and Their Contribution to Energy Security: Complementarity in Colombia; Technical Report IDB-MG-497; Iteramerican Development Bank, Energy Division: Washington, DC, USA, 2017. [Google Scholar]
  30. Montoya-Ramírez, R.D.; Cuervo, F.I.; Rico, C.A.M. Technical and financial valuation of hydrokinetic power in the discharge channels of large hydropower plants in Colombia: A case study. Renew. Energy 2016, 99, 136–147. [Google Scholar] [CrossRef]
  31. Arango-Aramburo, S.; Turner, S.W.; Daenzer, K.; Ríos-Ocampo, J.P.; Hejazi, M.I.; Kober, T.; Álvarez-Espinosa, A.C.; Romero-Otalora, G.D.; van der Zwaan, B. Climate impacts on hydropower in Colombia: A multi-model assessment of power sector adaptation pathways. Energy Policy 2019, 128, 179–188. [Google Scholar] [CrossRef]
  32. Del Río, D.; Moffett, H.; Nieto-Londoño, C.; Vásquez, R.E.; Escudero-Atehortua, A. Extending life expectancy of La Esmeralda reservoir: A bet to support Colombia’s future energy demand. In Proceedings of the ASME 2020 28th International Conference on Nuclear Engineering Joint with the ASME 2020 Power Conference ICONE28-POWER2020, Anaheim, CA, USA, 2–6 August 2020; American Society of Mechanical Engineers ASME: New York, NY, USA, 2020; p. 6, in press. [Google Scholar]
  33. Horton, B.K. Sedimentary record of Andean mountain building. Earth-Sci. Rev. 2018, 178, 279–309. [Google Scholar] [CrossRef]
  34. Horton, B.K.; Parra, M.; Mora, A. The Geology of Colombia; Servicio Geológico, Colombiano; Paleogene-Neogene, Chapter Construction of the Eastern Cordillera of Colombia: Insights from the Sedimentary Record; Publicaciones Geológicas Especiales: Bogota, Colombia, 2020; Volume 3, pp. 1–22. [Google Scholar] [CrossRef]
  35. Hoek, E.; Brown, E. The Hoek-Brown failure criterion and GSI—2018 edition. J. Rock Mech. Geotech. Eng. 2019, 11, 445–463. [Google Scholar] [CrossRef]
  36. U.S. Army Corps of Engineers. Engineering and Design of Tunnels and Shafts in Rock; Technical Report EM1110-2901; Department of the Army—U.S. Army Corps of Engineers: Washington, DC, USA, 1997.
  37. Yaseen, Z.M.; Ameen, A.M.S.; Aldlemy, M.S.; Ali, M.; Abdulmohsin Afan, H.; Zhu, S.; Sami Al-Janabi, A.M.; Al-Ansari, N.; Tiyasha, T.; Tao, H. State-of-the Art-Powerhouse, Dam Structure, and Turbine Operation and Vibrations. Sustainability 2020, 12, 1676. [Google Scholar] [CrossRef] [Green Version]
  38. Velísková, Y.; Chára, Z.; Schügerl, R.; Dulovičová, R. CFD simulation of flow behind overflooded obstacle. J. Hydrol. Hydromech. 2018, 66, 6. [Google Scholar] [CrossRef] [Green Version]
  39. Brown, G.O. The History of the Darcy-Weisbach Equation for Pipe Flow Resistance, In Environmental and Water Resources History; American Society of Civil Engineers ASCE: Washington, DC, USA, 2002; pp. 34–43. [Google Scholar] [CrossRef] [Green Version]
  40. Bishwakarma, M.B. Computation of Head Losses in Hydro Power Tunnels. Dam Eng. 2012, 23, 71. [Google Scholar]
  41. Nieves, M.T.; Hernández, A. Colombia Energy Investment Report; Technical Report; Energy Charter Secretariat: Brussels, Belgium, 2016. [Google Scholar]
  42. UPME. Plan Energético Nacional 2020–2050; Technical Report PEN50; Unidad de Planeación Minero Energética, Ministerio de Minas y Energía: Bogotá, DC, USA, 2019. [Google Scholar]
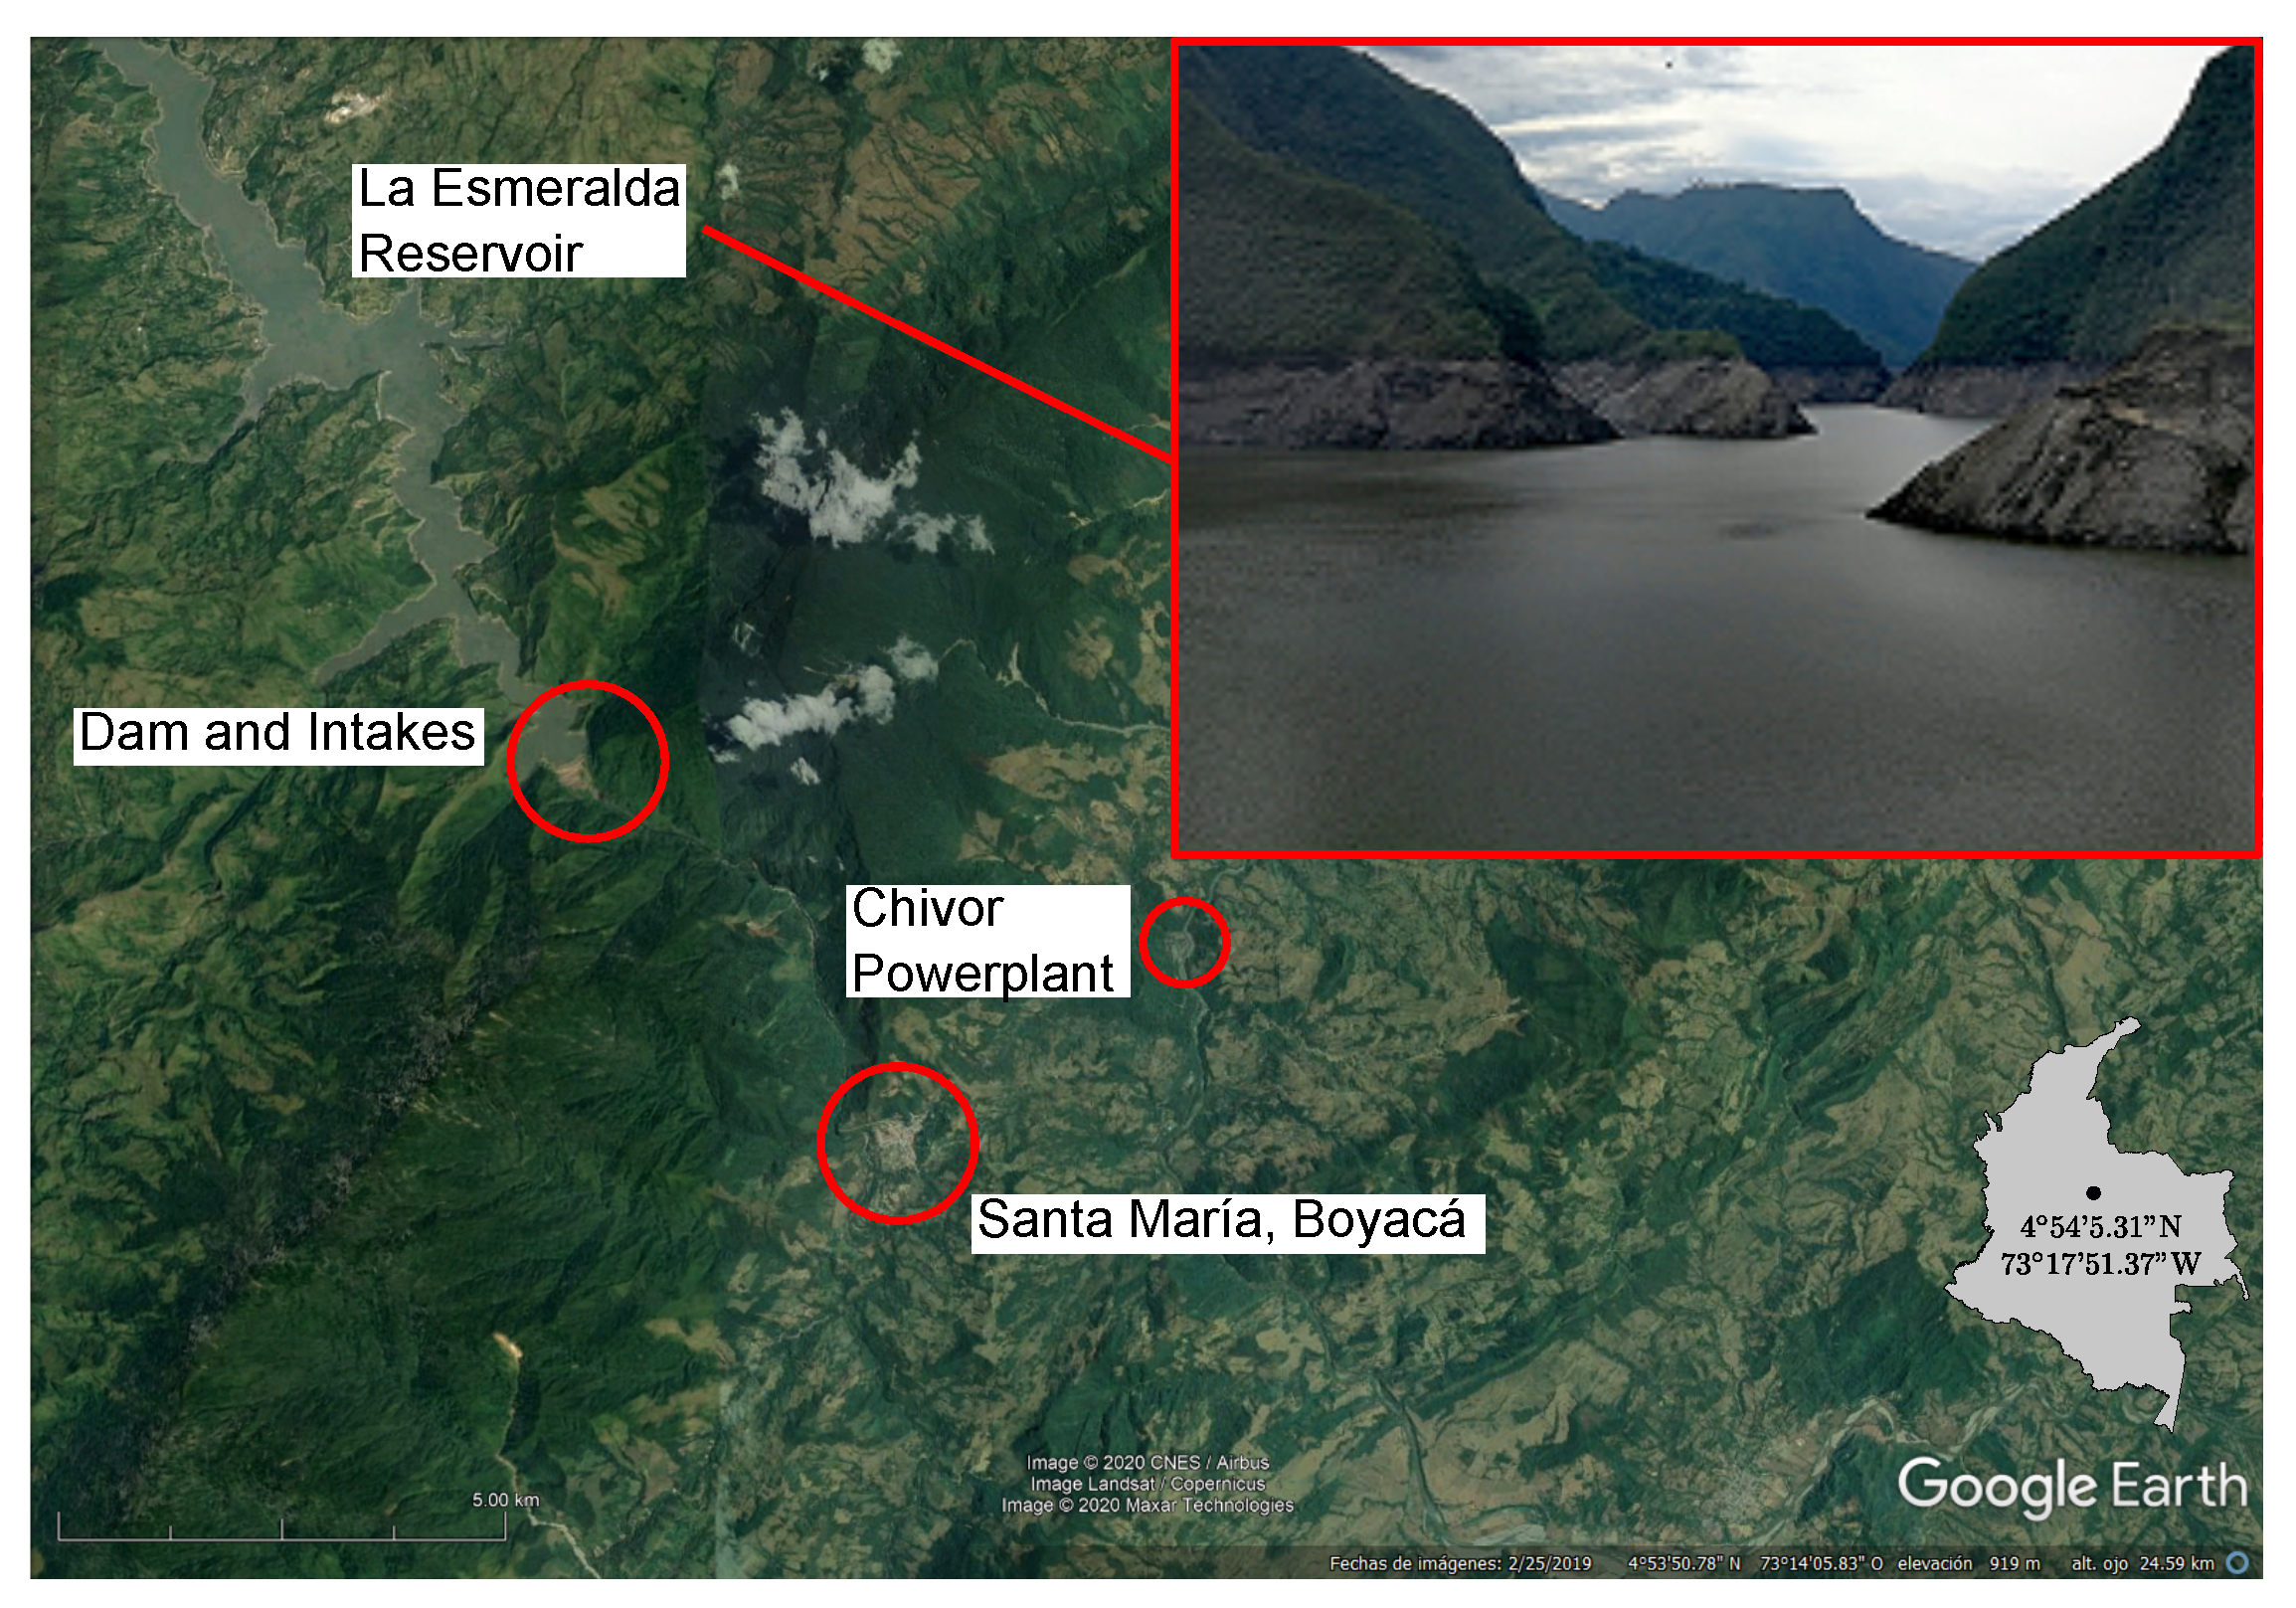
Figure 1. AES Chivor hydropower project. Contains the localization of the reservoir, the dam and intakes, the powerplant, and the town of Santa María, Boyacá. Adapted from Google Earth mapping service.
Water 12 02743 g001
Figure 2. Sediment evolution of La Esmeralda reservoir, 1975–2015. (a) Sediment and total volume and (b) bathymetric measurement and projection.
Water 12 02743 g002
Figure 3. Needle valve wear status. (a) 0 h operation; (b) 9000 h operation with low sediment load; and (c) 1 h operation with high sediment load. Reported by the authors in [32].
Water 12 02743 g003
Figure 4. Chivor intake system.
Water 12 02743 g004
Figure 5. Chivor’s Life Extension Project (CLEP) initial geological characterization. Rocky mass estimation for underground structures.
Water 12 02743 g005
Figure 6. Load tunnel finite element analysis performed in Phase 2 ®. The left image shows displacements and the right shows yield elements for a B-type rocky mass.
Water 12 02743 g006
Figure 7. Simulations performed in ANSYS® Fluent®. (a) Flow from the new intake to headrace connection. (b) Velocity vectors at the input. (c) Velocity vectors at the intake.
Water 12 02743 g007
Figure 8. Chivor geological characterization during construction. Excavation progress as of October 2019.
Water 12 02743 g008
Figure 9. Tunnel sections were modified from a horseshoe shape to D-shape.
Water 12 02743 g009
Figure 10. Chivor new intake system. Details are shown for the intakes and the gate connection with the vertical shaft.
Water 12 02743 g010
Figure 11. New intake at La Esmeralda reservoir.
Water 12 02743 g011
Table 1. Maximum speed for each part of the intake system.
Part of the Intake SystemHydraulic Section [m 2 ]Speed [m/s]Lining TypeMax. Speed [m/s]
Intake48.63.29Casted concrete6.0
Pressure tunnel57.52.78Shotcrete3.0
Gate41.23.88Casted concrete6.0
Vertical shaft1201.32Shotcrete3.0
Main tunnel57.52.78Shotcrete3.0
Connection branches30.32.64Shotcrete3.0
Shielded branches (valve chamber)12.66.37Steel≥6
Connection tunnels26.43.00Shotcrete3.0
Table 2. Head losses for the new intake system.
Part of the SystemLoss [m]%
Losses due to components (local)3.3481%
Losses due to friction in tunnels0.7619%
Total4.11100%