Article

Impacts of Climate and Land-Use Changes on the Hydrological Processes in the Amur River Basin

1
Aerospace Information Research Institute, Chinese Academy of Sciences, Beijing 100094, China
2
University of Chinese Academy of Sciences, Beijing 100049, China
3
Northeast Institute of Geography and Agroecology, Chinese Academy of Sciences, Changchun 130102, China
*
Author to whom correspondence should be addressed.
The first two authors contributed equally to this work and should be considered as co-first authors.
Water 2020, 12(1), 76; https://doi.org/10.3390/w12010076
Submission received: 24 November 2019 / Revised: 14 December 2019 / Accepted: 20 December 2019 / Published: 24 December 2019
(This article belongs to the Section Hydrology)

Abstract

:
Under the joint effects resulted from different changes of climate and land-use regimes, spatial-temporal variations of hydrological processes took place in certain principles. Identifying the impact of changes in individual land-use types/climatic factors on hydrological processes is significant for water management and sustainability of watersheds. In this study, seven simulation scenarios were developed using the soil and water assessment tool (SWAT) model to distinguish the impacts of climate and land-use changes on the hydrological processes in the Amur River Basin (ARB) for four periods of 1980–1990, 1991–1999, 2000–2006, and 2007–2013, respectively. Based on the multi-period simulation scenario data, partial least squares regression and ridge regression analyses were performed to further evaluate the effects of changes in individual land-use types/climatic factors on hydrologic components. The results suggested that summer precipitation and summer average temperature were the dominant climatic factors, and crops and wetlands were the principal land-use types contributing to the hydrological responses. In addition, the drastic changes in crop and wetland areas and a clear decline in summer precipitation between the periods of 1991–1999 and 2000–2006 may account for the highest-intensity impacts of climate and land-use changes on the runoff at the outlet (−31.38% and 16.17%, respectively) during the four periods.

1. Introduction

Anthropogenic activities and climate changes are two major factors that directly affect hydrological processes [1,2,3]. Global changes, such as the redistribution of precipitation, global warming, and accelerated urbanization [4,5,6], have altered the hydrological cycle and runoff generation patterns, had significant impacts on the spatial and temporal distributions of water [7], and led to major challenges in the management and protection of water resources [8,9,10,11,12,13,14,15,16].
As the 10th largest river basin in the world and the largest in the Russian Far East, the Amur River Basin (ARB) is one of the most vulnerable areas to climate change and human activities in the world [17]. In recent decades, the annual average maximum temperature, minimum temperature, mean temperature, and annual precipitation in the ARB have exhibited generally increasing trends [18,19,20,21]. Moreover, significant regional, seasonal, and interannual variations in temperature and precipitation have been investigated in portions of the ARB [1,7,22,23,24,25]. Furthermore, driven by the different policies, regional characteristics, and economic development statuses in China, Russia, and Mongolia, the land-use types in the ARB have undergone significant regional transformations in recent decades [24,26]. With the rapid development of agriculture and the expansion of farmland, the areas of wetlands and forests have decreased significantly [6,7,20,24,27,28]. However, agricultural development and wetland protection coexist in this region [21,29]. In the context of such remarkable global changes, several studies conducted in the basin have documented dramatic changes in the hydrological processes and water resources in some sub-basins in the study region [1,7,30,31]. However, the characteristics and extent to which climatic variations and land-use changes individually affect the water cycle throughout the ARB remain poorly understood. In particular, the specific contributions of individual climatic factors/land-use types to the variations in the hydrologic components and the unstable fluctuations in hydrological factors among different periods remain unclear. This information is critical for water management and land-use planning due to increased water demands for irrigation in the ARB [32].
The non-static interactions among climatic factors, land-use changes, and hydrologic components limit the analyses of the effects of individual climate variability and land-use changes on water cycle [2,5,33], especially for international river basins because the hydrology and underlying conditions in these basins are highly complicated. Numerous studies in recent decades have discussed the application of hydrological models for quantifying and separating the effects of climate and land-use changes on hydrology [12,34,35,36,37,38,39,40]. The statistical regression method is another common approach used to investigate the relationships between global changes and hydrological processes and to rank the driving forces behind the variations in hydrologic components [41,42,43,44]. Previous studies have proved that hydrological simulations in association with multivariate statistic approach could provide a better understanding on the hydrological responses to the variations of a single climate factor/land use class [14,45]. Thus far, however, there has been little discussion about the fluctuations in the degree and direction of the impacts of climate change and human activities on hydrological processes during different periods, especially the contributions of a single climate factor/land-use type to the variations in the hydrological variables that might remain relatively consistent during various periods. In this paper, the simulation period was divided into multiple periods according to the actual geographical situation of the basin to separate the effects of climate and land-use changes on hydrology and eliminate interfering factors for further assessment. In addition, statistical results based on scenario simulations during multiple periods would make the analytical results of the hydrological responses to variations in a single factor more stable throughout the study period and reduce the uncertainty of the study.
This paper presents the results of applying a semi-distributed hydrological model, the soil and water assessment tool (SWAT), and multivariate statistics to simulate the impacts of climate and land-use changes on hydrologic components during four periods (1980–1990, 1991–1999, 2000–2006, and 2007–2013) based on meteorological data, remote sensing information and multisite runoff data. The aim of this study is to enhance the understanding of the individual impacts of changes in climatic factors and land-use types on the hydrological processes in the ARB. The specific objectives of this study are as follows:
1.
Analyze the unstable variations in the climatic factors and the land-use transfer ratio in the study region between the different periods.
2.
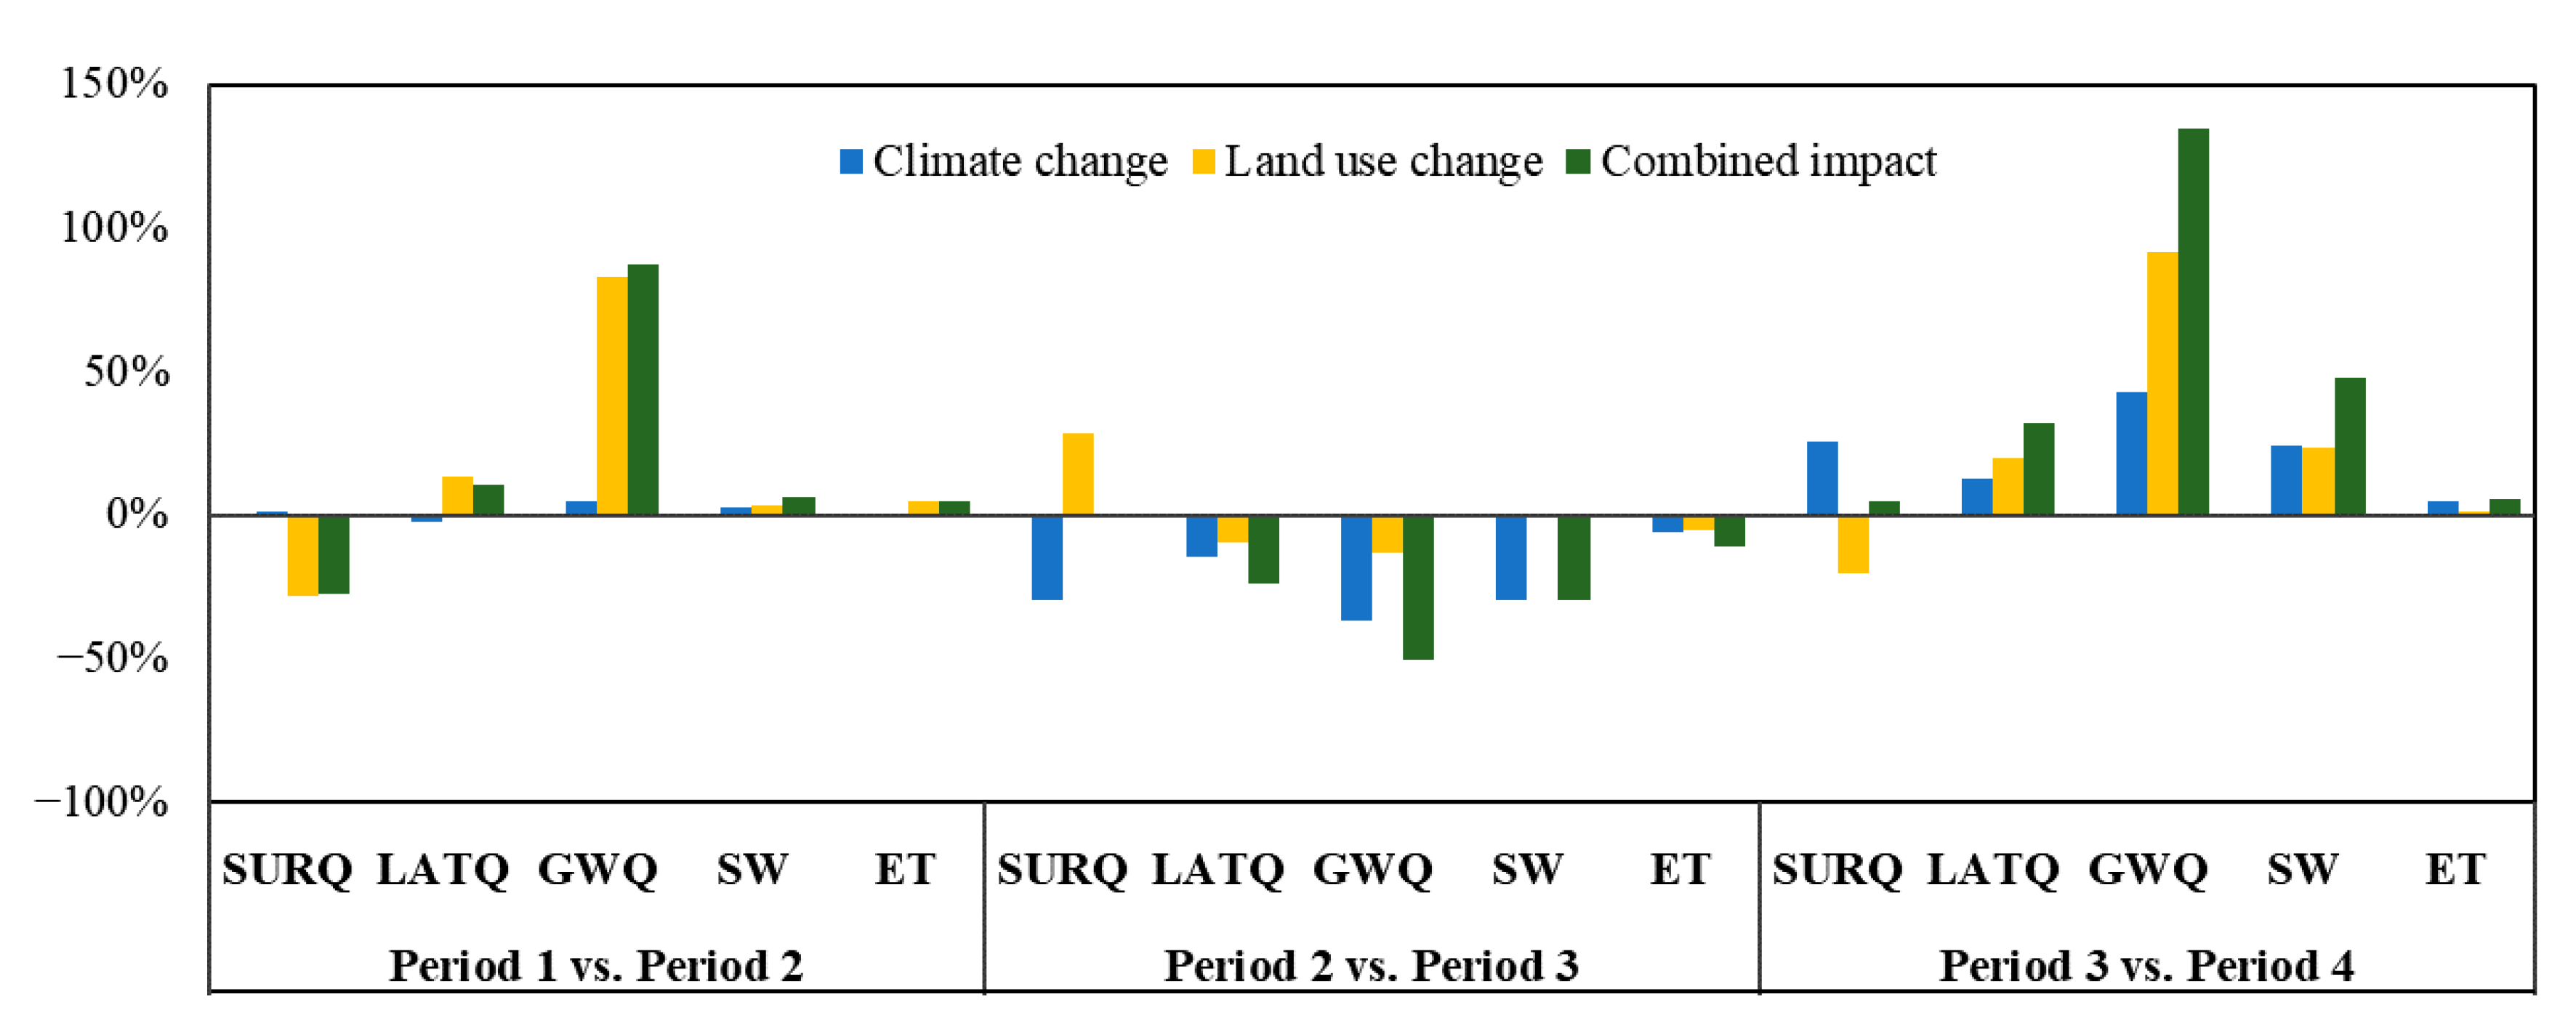
Develop seven simulation scenarios to separate the impacts of climatic variations and land-use changes on the river runoff, surface runoff (SurQ), groundwater flow (GWQ), soil water (SW), lateral flow (LATQ), and evapotranspiration (ET) in the ARB and identify the different extents and directions of their effects over several time periods.
3.
Utilize partial least squares regression (PLSR) and ridge regression (RR) to evaluate further the effects of changes in the individual land-use types or climatic factors on the hydrologic components (SurQ, GWQ, and LATQ) based on separate impact modeling scenario results.
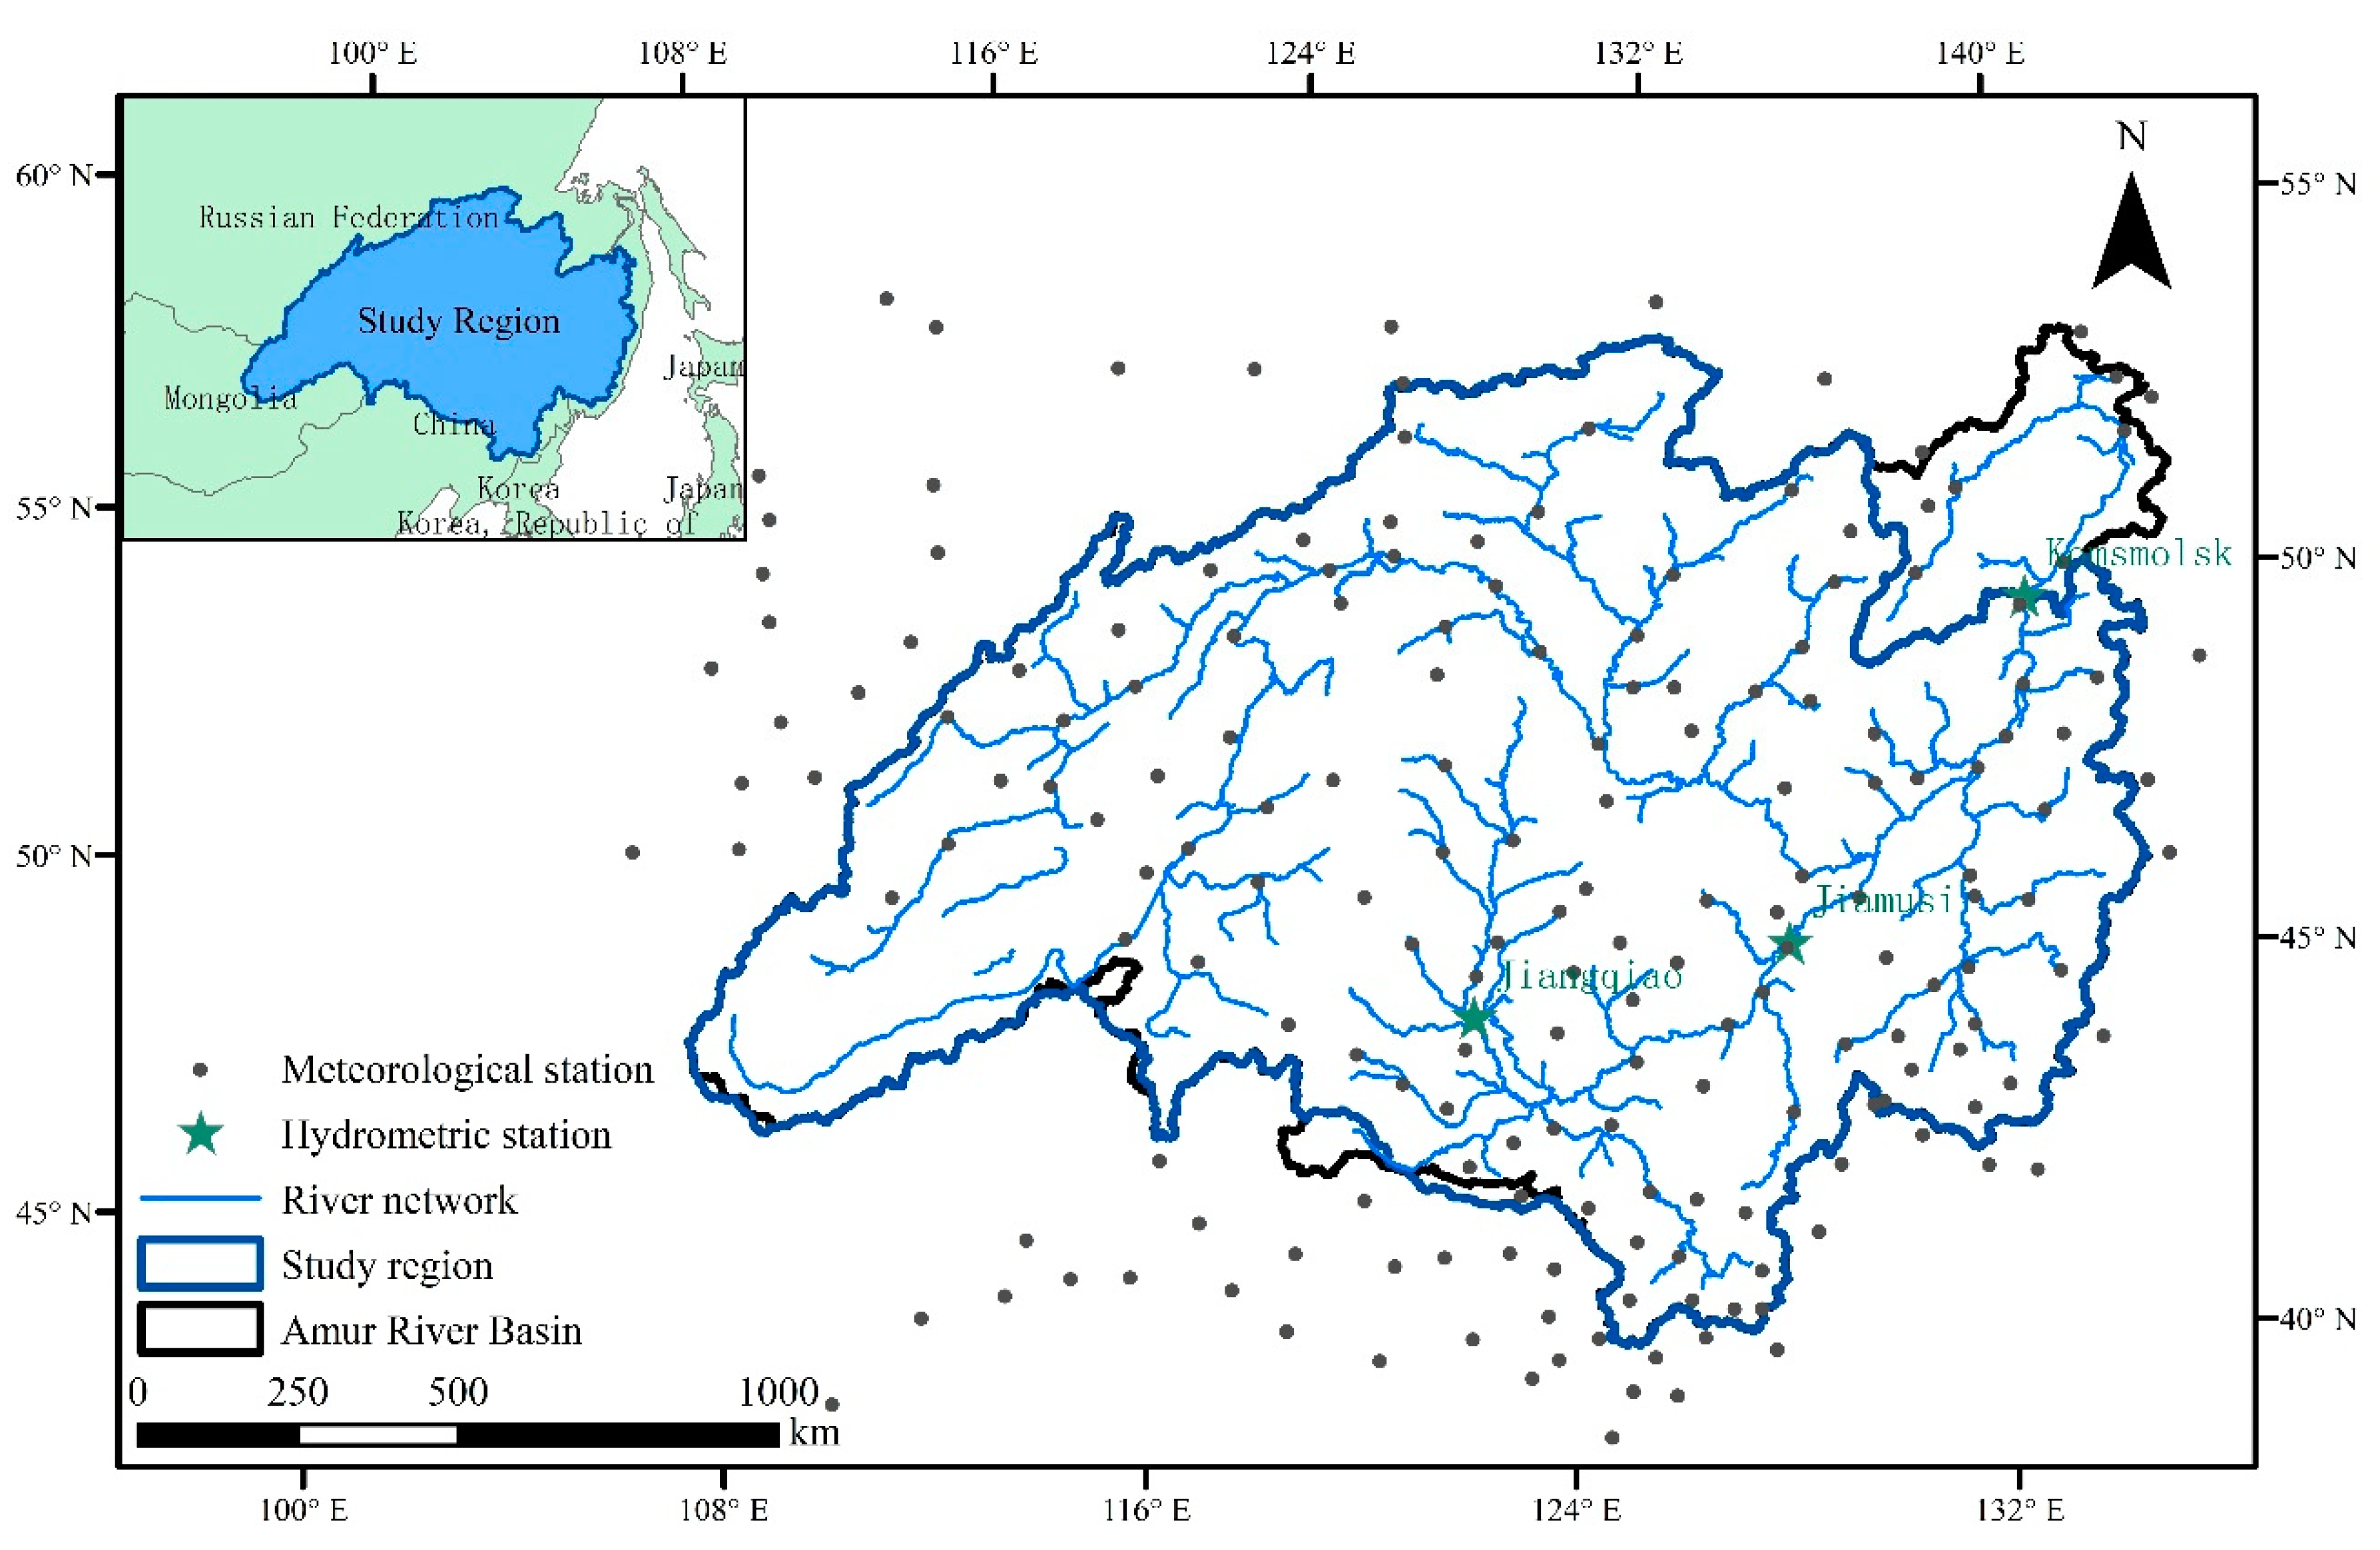
2. Study Area

This study was conducted in the ARB (41°–56° N, 107°–142° E). The ARB, located in northeastern Asia, is the 10th largest river basin in the world, and has an area of approximately 2 million km2, covering parts of Mongolia, Russia, and China [17,18,21,26]. Due to data limitations, the study region (Figure 1) covered 94% of the ARB with the Komsomolsk station as the outlet.
Although the climatic variations and land-use changes in the ARB have followed general trends, such as global warming and farmland expansion, respectively, obvious differences have been observed in the changes in different regions and periods during recent decades [17,18,24,29]. The China portion of the ARB, which occupies the major agricultural lands of the study basin [46], has been particularly affected by human activities. In the 1980s, after the implementation of China’s reform and opening-up policy, the area of agricultural reclamation in the basin increased sharply with improvements in agricultural mechanization, and most of the wetlands, forests and pastures were converted to cultivation. Subsequently, driven by the “auctioning five wastes” policy in the 1990s, which transferred the land-use rights of “five wastes” (abandoned mountains, waste slopes, wastelands, deserted beaches, and wastewater) to users for a paid and limited period in the form of a public auction to promote the land resources utilization for increase of food production [21,47,48]. Some land-use types, such as wetlands, were further developed, and a large amount of abandoned land was reclaimed, resulting in significant fragmentation of the remaining wetlands [27,29,49]. After major flooding in the ARB in 1998, the Chinese government placed more importance on forests and wetlands. Alongside the continuous cultivation of farmland in the 21st century, large amounts of manpower and material resources were invested into the protection of forests and wetlands, achieving remarkable results [1,21,29]. Given the demands for water for agricultural and industrial development, a comprehensive understanding of the hydrological processes in the ARB under climate changes and anthropogenic activities in recent decades was necessary to provide decision-makers with information about land-use planning and water management.

3. Materials and Methods

3.1. Datasets

Land-use maps, a soil map linked to a soil characteristics database, climate meteorological data, digital elevation model (DEM) data, and hydrological data were prepared as forcing inputs to drive the SWAT model. The detailed information is summarized in Table 1. Monthly river runoff data from the Komsomolsk station (1980–1990 and 2000–2006), Jiamusi station (1980–2013), and Jiangqiao station (1980–2013) were used to calibrate and validate the SWAT model in the study region based on the data availability of each station. The land-use of the ARB during four historical periods (1980s, 1990s, 2005, and 2010) used in the study—which were the combination of Chinese land-use maps and global land-use maps at similar times for each period—were the inputs for the model representing the land-use changes during the four simulation periods (1980–1990, 1991–1999, 2000–2006, and 2007–2013). Due to the limitation of land-use data availability for the Russia and Mongolia regions of the study basin, where there were relatively lower human activities intensity and rates of land-use conversion (especially before 2000) [24,46], the datasets that were as close as possible to the simulation phase were chosen for use in the paper.
In addition, the monthly land surface evapotranspiration (ET) product produced by Zhang, et al. [50] based on the advanced very high-resolution radiometer (AVHRR) data, the monthly MOD16 global evapotranspiration dataset [51] based on moderate resolution imaging spectroradiometer (MODIS) data from 2000 to 2013, and the total water storage changes (TWSCs) [52,53] from May 2002 to December 2006 derived from the Gravity Recovery and Climate Experiment (GRACE) products [52,54,55], were used for model calibration and validation to reduce the model uncertainty caused by the limited streamflow data [56,57,58,59,60]. The GRACE products used in this study were the monthly surface mass change data based on the RL05 spherical harmonics from the University of Texas Center for Space Research (CSR), the Jet Propulsion Laboratory (JPL), and the German Research Center for Geosciences (GFZ)(data from June 2002 to July 2002 and from June 2003 are missing) [61,62,63].

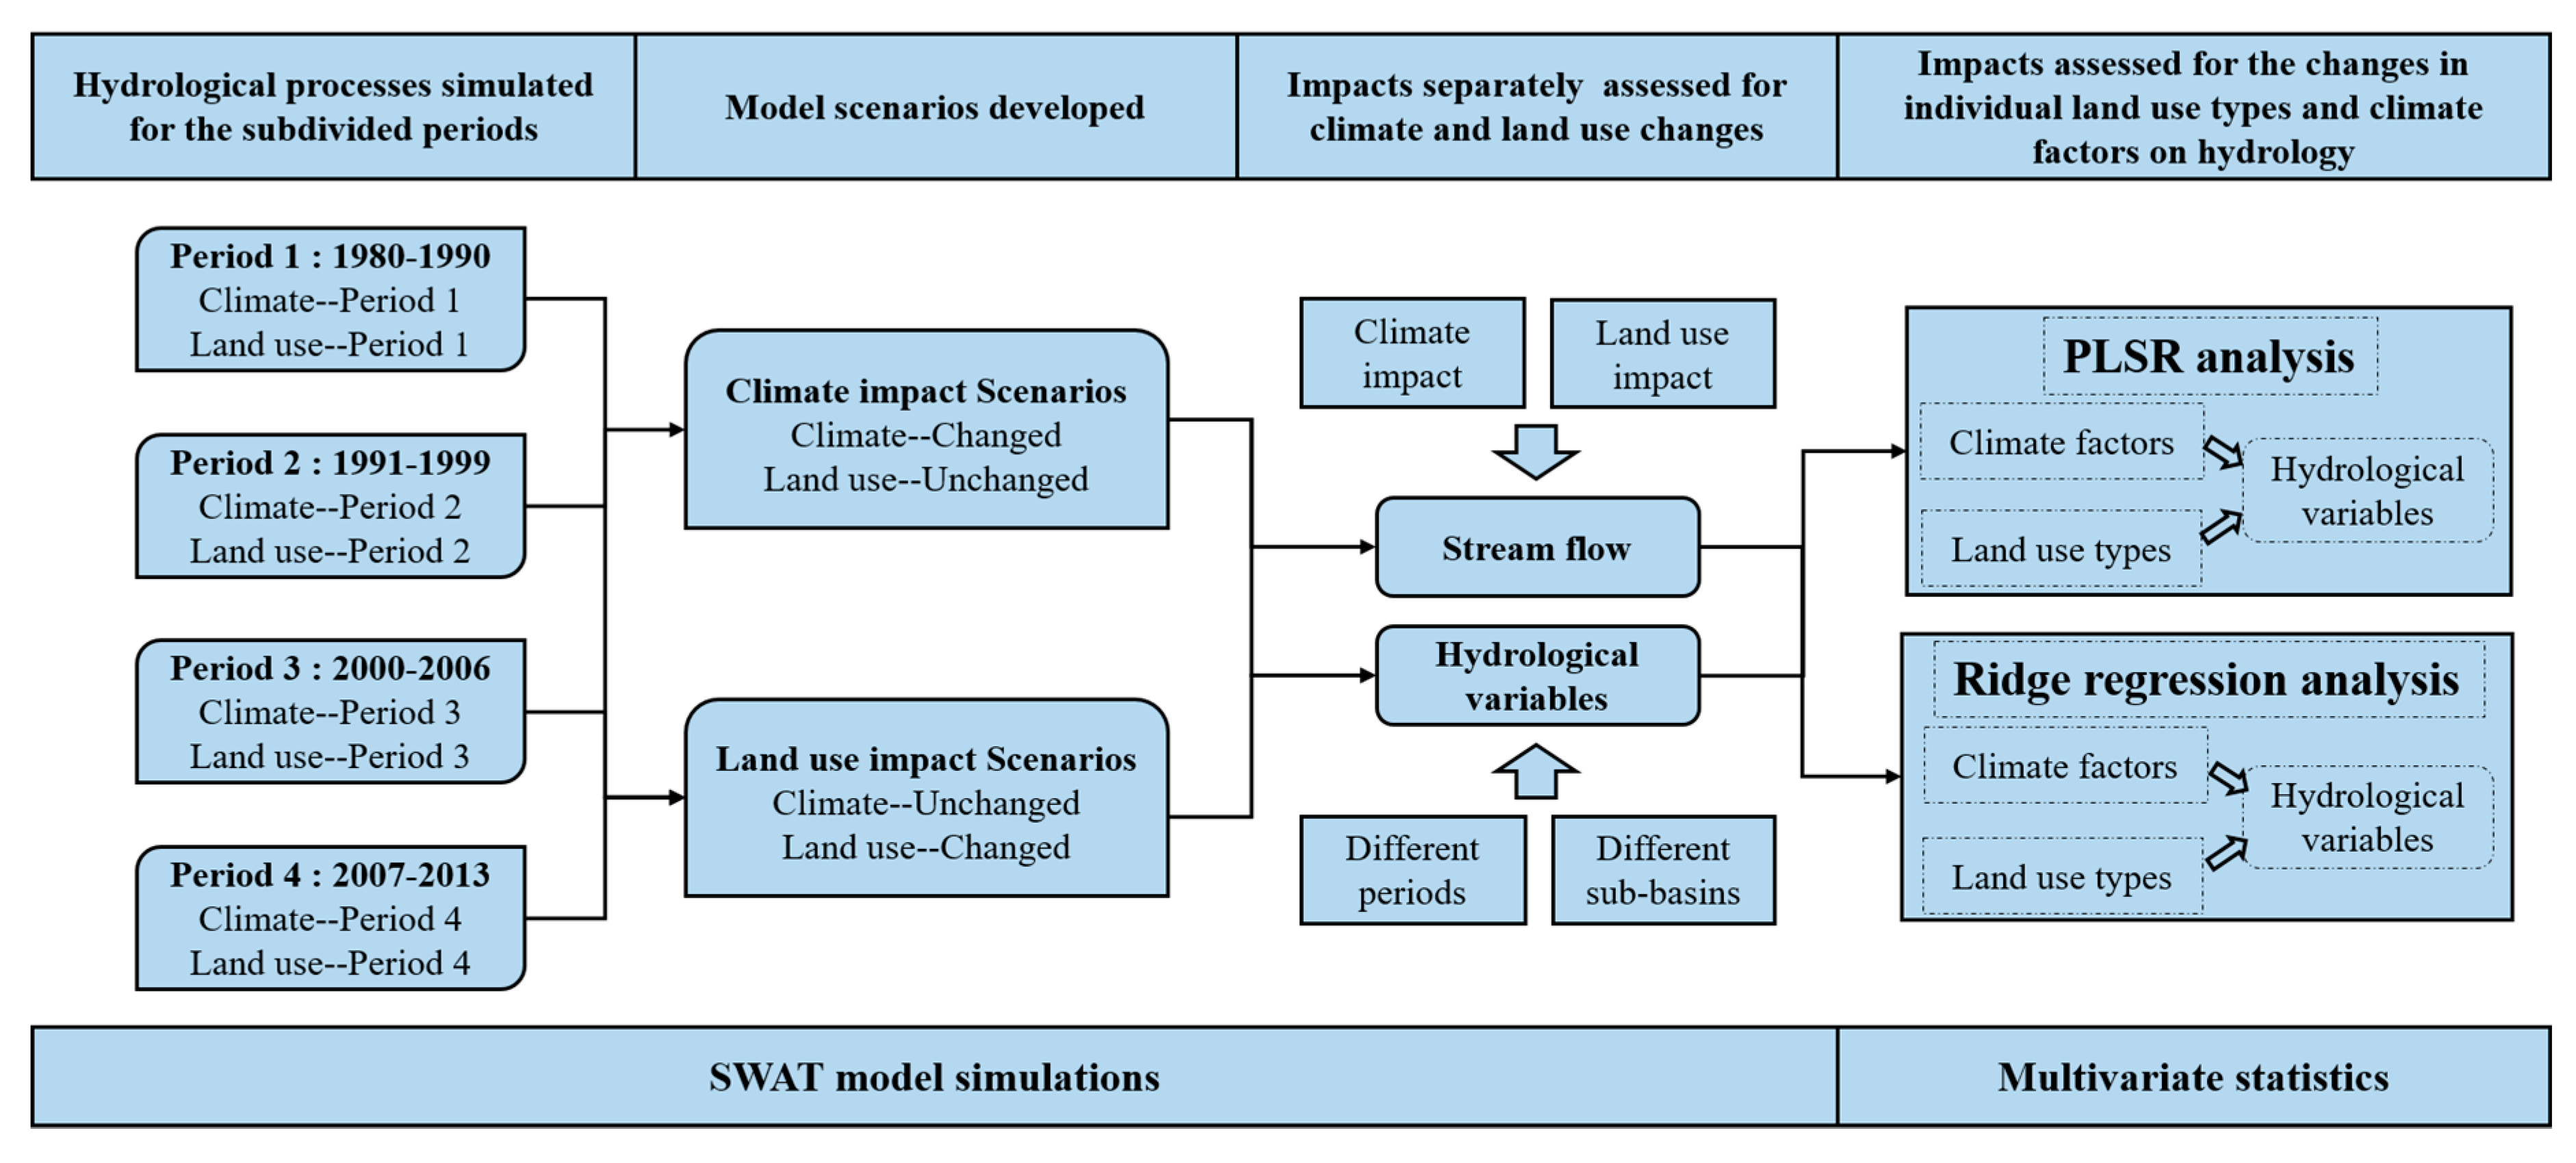
3.2. Analytical Strategy

The impact analysis process consisted of four steps: Hydrological process simulations for the four periods, model scenario development, separate impact assessments for climatic variations, land-use changes, and impact assessments of changes in the individual land-use types and climatic factors on the hydrologic components, as shown in Figure 2. The first three tasks were dependent on the SWAT model simulation, and based on the separate impact modeling scenario results, the last task was completed using PLSR and RR to further assess the contributions of changes in individual land-use types and climatic factors to the hydrologic components. The methods used in this paper were introduced in more detail in the following subsections step by step.

3.2.1. Simulation Period Division

The key to this study was identifying the different magnitudes and directions of the impacts of climate variability and land-use changes on the hydrological variables over the last several decades and further assessing the relationships between the individual climatic factors/land-use types and the hydrologic components. To identify the variations in the impacts, the authors divided the simulation periods according to the historical land-use changes reported in the literature mentioned in the study area section [17,18,24,27,29,49] and the characteristic analytical results of the climate and land-use changes.
The Mann–Kendall trend test [64] and linear regression analysis were applied to analyze the time series trends of precipitation and temperature, and the sequential version of the Mann–Kendall test [65] was used as an indicator to determine periods of abrupt climate changes. The presentation of the sequential Mann–Kendall test in a graphical format allows for the detection of the starting point of abrupt changes at the intersection point of the test statistic’s forward UFk and backward UBk curves. The null hypothesis is accepted at the α significance level if | U F k | > U 1 a / 2 If the intersection point is significant, the critical point of the abrupt change is between the critical values of the confidence interval (±1.96 corresponding to α = 0.05) [66,67,68]. The land-use transfer ratio was the main method used to assess the land-use changes during the studied periods.
Due to the complex changes in climate elements and land-use types during the sub-periods from 1980 to 2013 in the ARB, the simulation period was subdivided into the following four periods based on the approximate temporal characteristics of the changes: 1980–1990, 1991–1999, 2000–2006 and 2007–2013, respectively.

3.2.2. Hydrological Modeling

The SWAT model is a semi-distributed hydrological model that was developed by the United States Department of Agriculture-Agricultural Research Service (USDA-ARS) in the 1990s [35,69,70]. This model has been used worldwide for analyses of the impacts of land management and climate on hydrology [36,37,71,72]. The simulation of the ARB using the SWAT model was run with a monthly time step from 1980 to 2013. The model area in this study was 195.45 million ha, and the entire study region was divided into 134 sub-basins and approximately 3703 hydrologic response units (HRUs). Then, the simulations of the four periods were performed using ArcSWAT software (USDA-ARS, Washington, DC, USA and Texas A&M University, College Station, TX, USA) with a three-year warming-up, and the sensitivity analysis and calibration processes were based on the SWAT-CUP program using the Sequential Uncertainty Fitting version 2 (SUFI-2) algorithm [73,74]. For each period, the monthly observed and remotely sensed information during the first half of the period (rounded by years) were used for model calibration, and the data from the other half of the period were used for validation. The SWAT performance was evaluated using the Nash–Sutcliffe efficiency coefficient (NSE), coefficient of determination (R2), and percent bias (PBIAS), as recommended by Moriasi et al. [75].
N S E = 1 i = 1 n ( Q o b s i Q s i m i ) 2 i = 1 n ( Q o b s i Q o b s ¯ ) 2
R 2 = [ i = 1 n ( Q o b s i Q o b s ¯ ) ( Q s i m i Q s i m ¯ ) ] 2 [ i = 1 n ( Q o b s i Q o b s ¯ ) 2 ] [ i = 1 n ( Q s i m i Q s i m ¯ ) 2 ]
P B I A S = i = 1 n ( Q o b s i Q s i m i ) 100 i = 1 n Q o b s i
where Q o b s i and Q s i m i are the i-th observed and simulated stream flows, respectively; Q o b s ¯ and Q s i m ¯ are the mean of the observed and simulated data; and n is the total number of observations [75]. In addition, the TWSC data and ET data were used to complement the discharge data and provide confidence in the water partitioning of the simulation, and the correlation coefficient (R) and root-mean-square error (RMSE) were used to evaluate the simulation.

3.2.3. Climate and Land-Use Scenarios

To determine the temporal trends of the separate contributions of climate and land-use changes to the hydrological processes, 7 scenarios were developed based on the approach of one factor being changed at a time [2,34,38,76]. After calibration and validation were conducted based on the long-term historical data, the SWAT model was run for each of the 7 combinations of climate data, model parameters, and land-use maps (Table 2). The 1980s, 1990s, 2005, and 2010 land-use maps and meteorological data for the four periods were applied to represent the land-use and climatic variations, respectively, for 1980–2013. The contributions of the land-use change and climatic variations to the hydrological changes in each period were quantified by comparing the model outputs of the hydrologic components under the 7 scenarios.

3.2.4. Statistical Analysis

The degrees and trends of the impacts from climate changes and human activities on the hydrologic components in the ARB fluctuated with time, but the hydrological responses to variations in individual climate elements/land-use types should remain consistent during the various periods. Therefore, multivariate regression analyses based on the multiperiod scenario simulation results that distinguished the impacts from climate and land-use change could eliminate part of the influence from interference factors and indicated the relatively stable impacts of individual climatic factors/land-use types on hydrological processes. The final task of this study was to assess the impacts of changes in the individual land-use types and climatic factors on the hydrologic components by ranking the influences of the land-use types/climatic factors on the hydrologic components and identifying the factors most relevant to the hydrological variations. Multivariate statistical analyses were applied to investigate the relationship between the changes in land-use types/climatic factors and the hydrologic components. Considering the high collinearity among the dependent variables (hydrological variables) and independent variables (climate and land-use factors), PLSR [77,78] and RR [79,80] analyses were performed using IBM SPSS Statistics software. The independent variables constituted the changes in the areas of 7 land-use classes (crop, wetland, forest, water, residential, pasture, and range) and the variations in the climatic factors, while the dependent variables comprised the changes in 3 hydrologic components (surface runoff, groundwater flow, and lateral flow) that were determined by the separate impact scenario modeling. The R2 and adjusted R2 (a modified version of R2 that has been adjusted for the number of independent variables and sample size in the model) [81,82] values were applied to evaluate the regression model validity and reliability.

4. Results

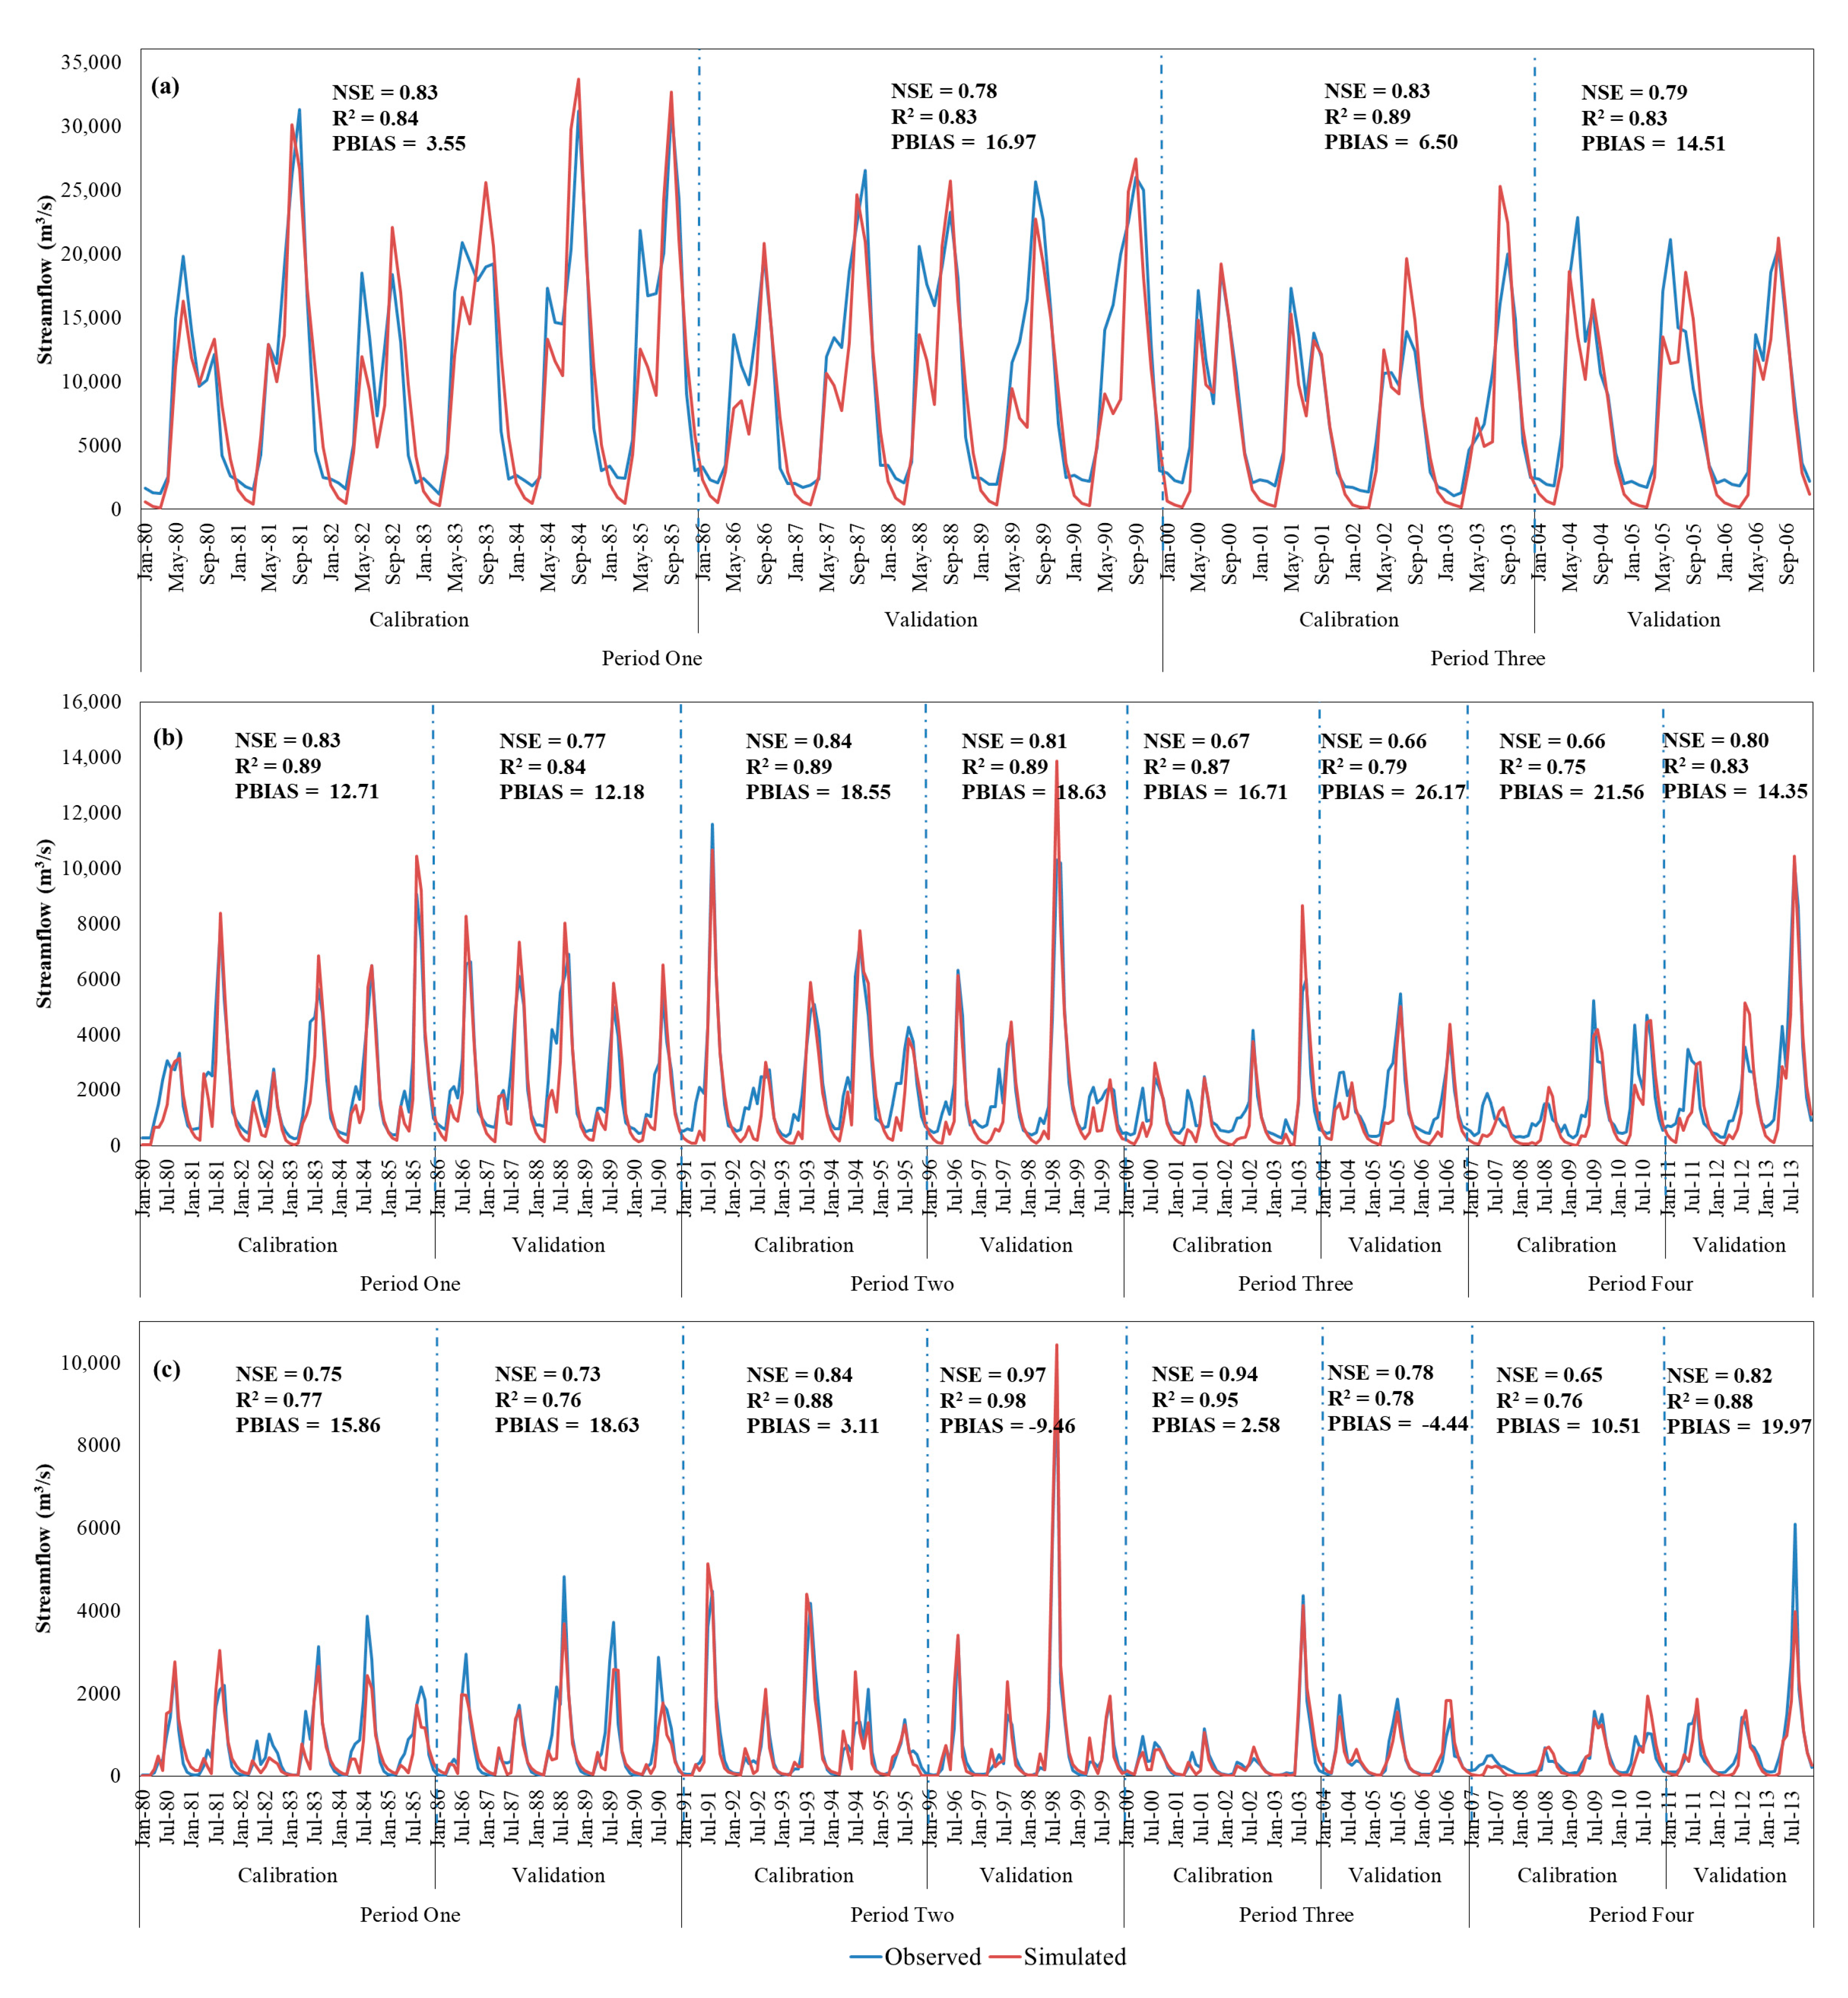
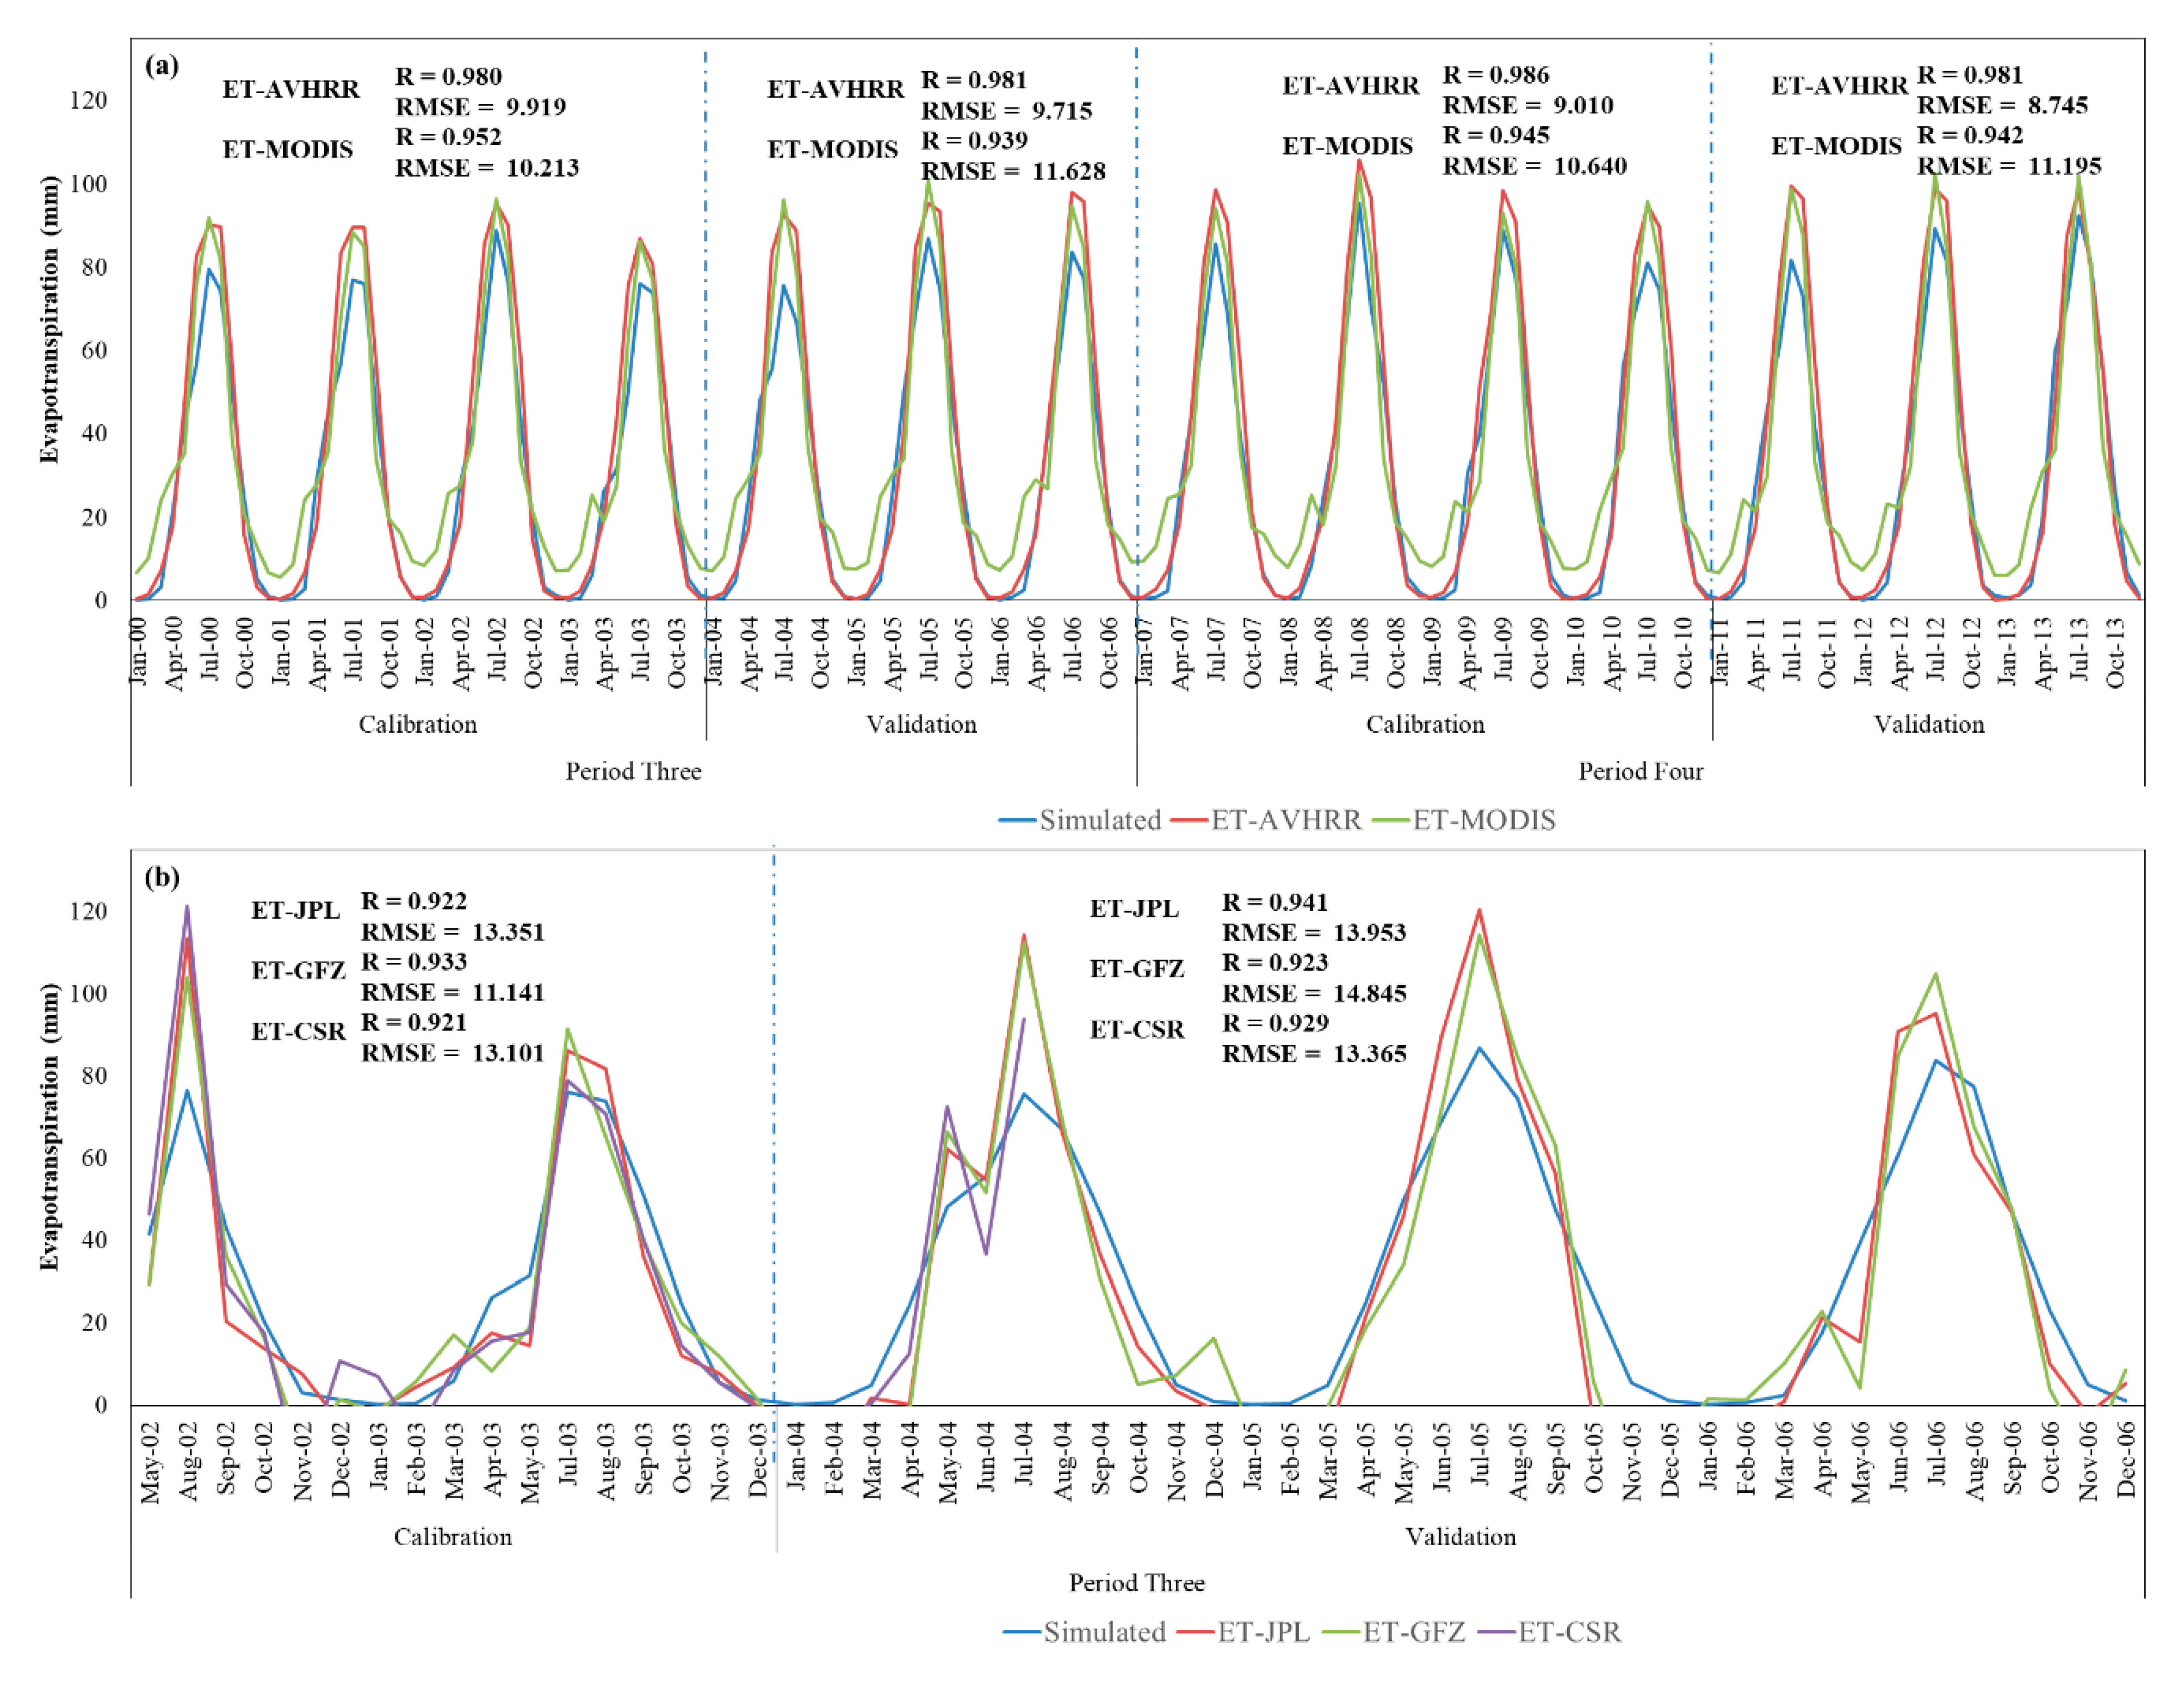
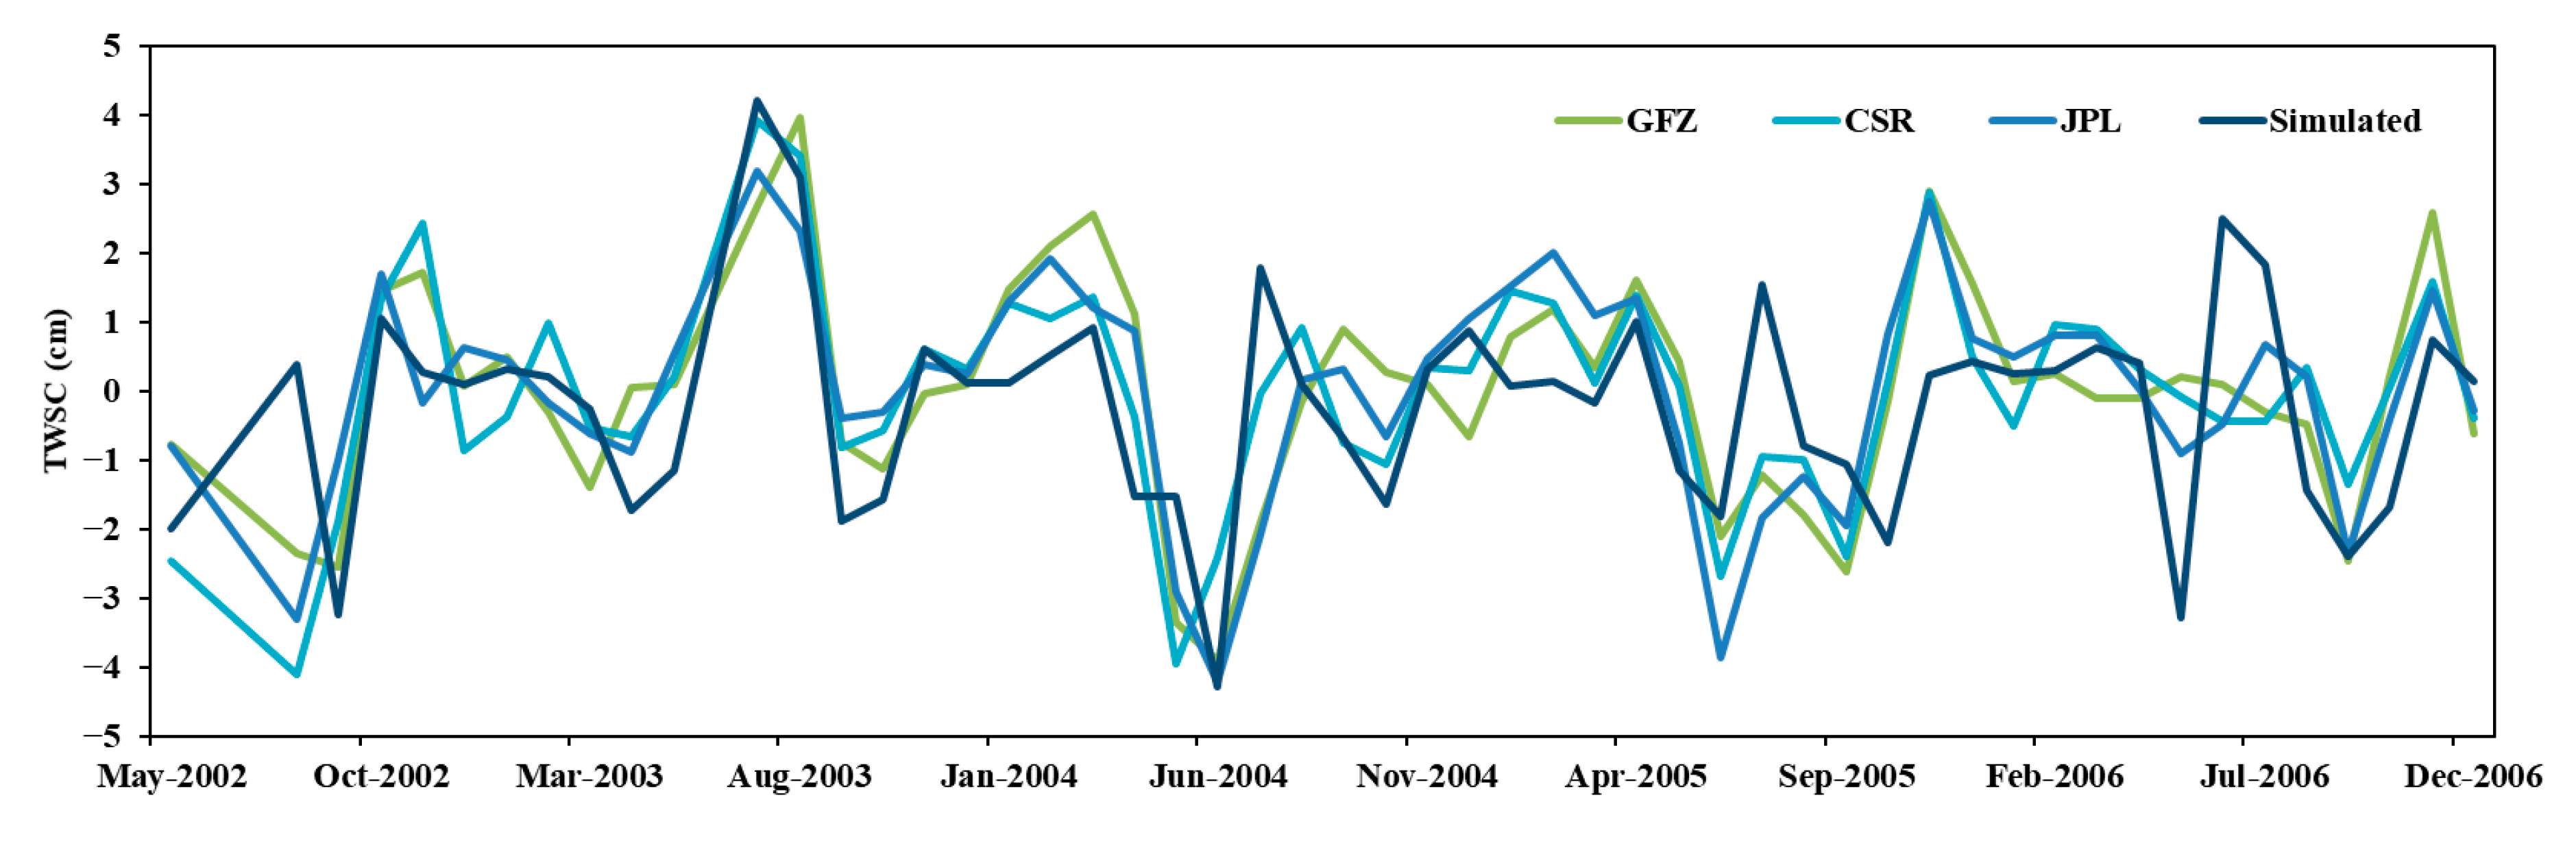
4.1. Model Calibration and Validation

The model results based on the selected performance indicators for discharge are shown in Figure 3. The results showed good agreement between the modeled discharge time series and the measured values, and the performance indicators for the four simulation periods satisfied the model simulation requirements according to Moriasi et al. [75]. The NSE was 0.83 for the calibration period and 0.78–0.79 for the validation period for the catchment outlet at Komsomolsk. The PBIAS values were 3.55–6.50 and 14.51–16.97 for the calibration and validation periods, respectively. The model performance for discharge for the calibration and validation periods at the different sites revealed that although the peak values of the runoff process simulated by the SWAT model matched the measured values well, the base flow in winter was mostly underestimated during the four periods. Moreover, the peak flow was simulated more accurately during summer than that in spring, which suggested the simulation uncertainty in the snowmelt processes. The increase in the difficulty of ground flow simulation due to complex changes in groundwater in the ARB and the limitations of the SWAT model in groundwater simulation also explained the relatively poor model performance in the base flow simulation in winter.
The comparison of the monthly average evapotranspiration in the study region derived from the model output and the ET products is presented in Figure 4, and the inter-monthly average TWSCs of the study region derived from the SWAT simulation and GRACE product data from May 2002 to December 2006 are presented in Figure 5. The two model performance indicators in Figure 4 present that the simulated evapotranspiration matched reasonably well with the data estimated from the AVHRR, MODIS, and GRACE products and the results in Figure 5 show that the simulated TWSC data and the measured data also had consistent trends. The model performance for the different hydrological variables indicated that the SWAT model was successfully applied to the ARB and was suitable for the analysis of hydrological processes under climate changes and human activities.

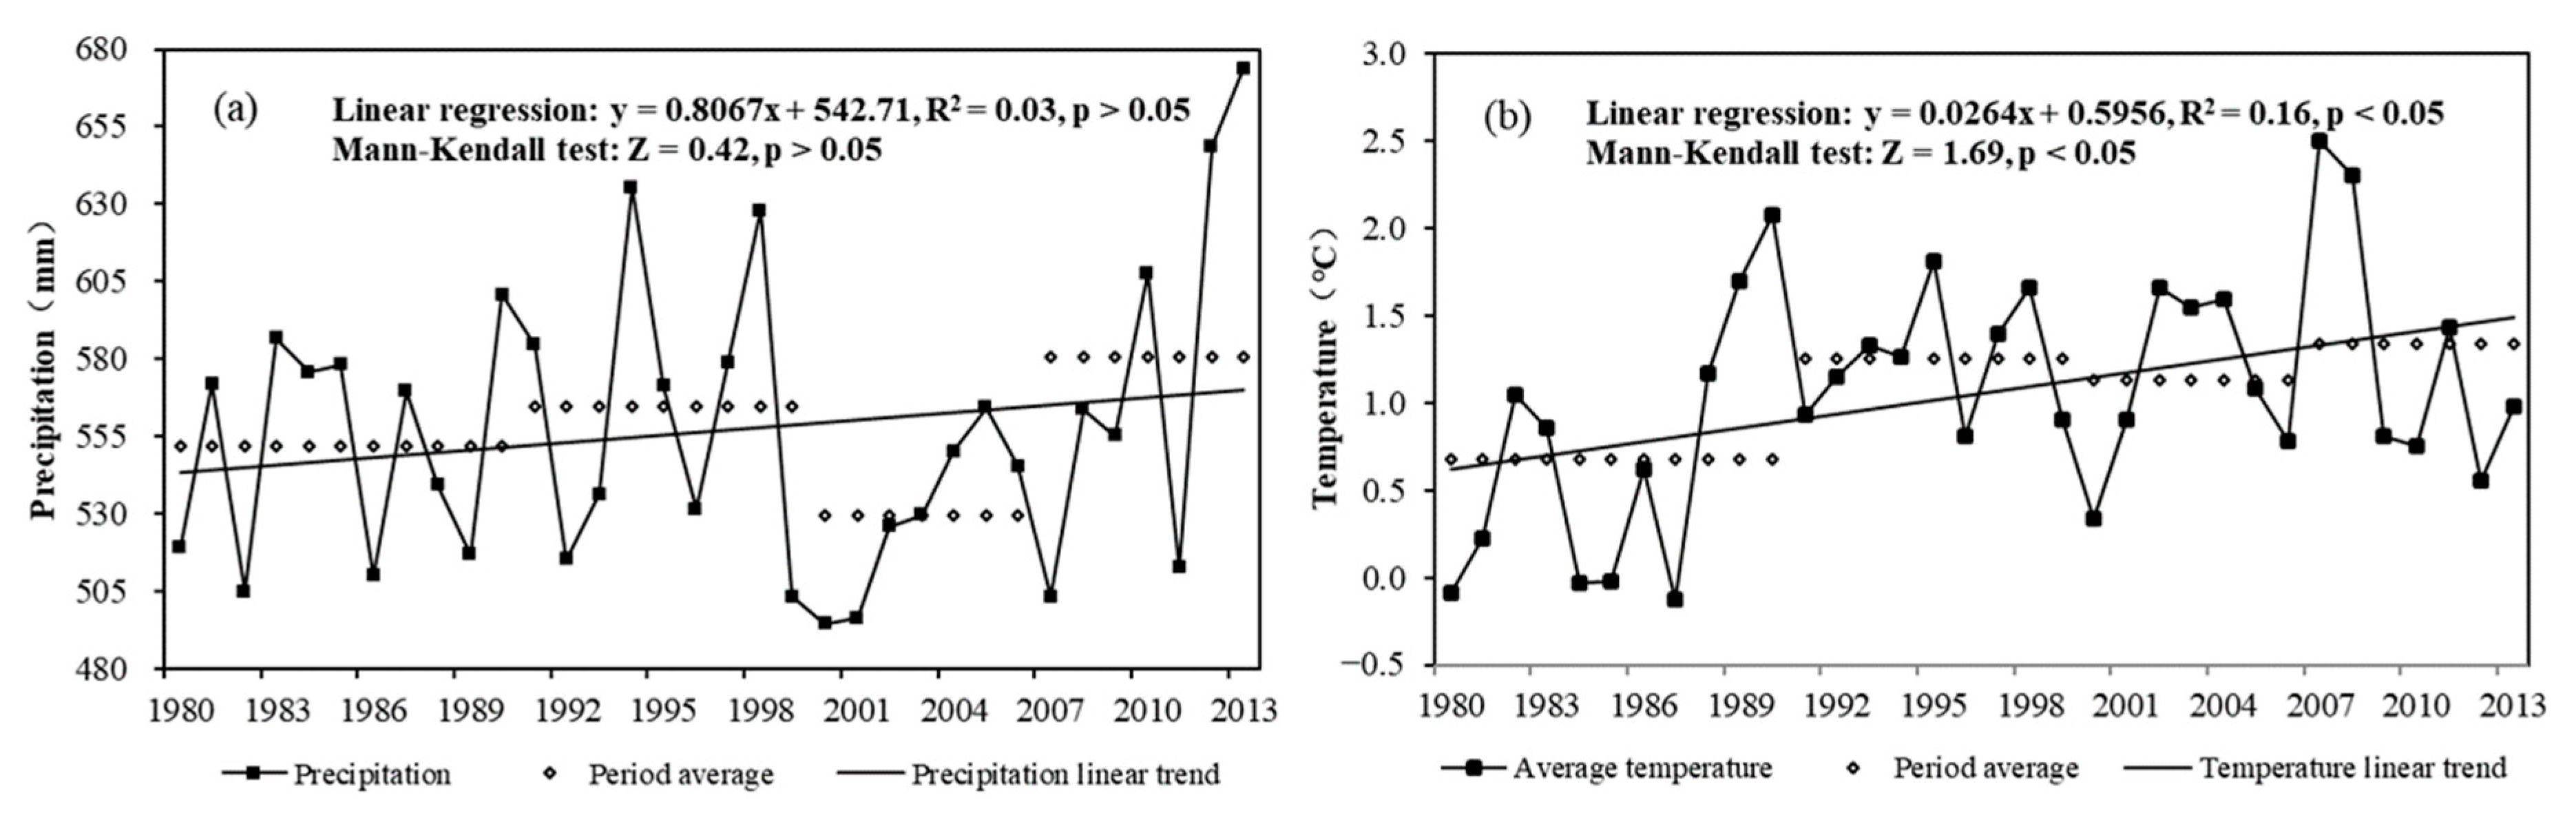
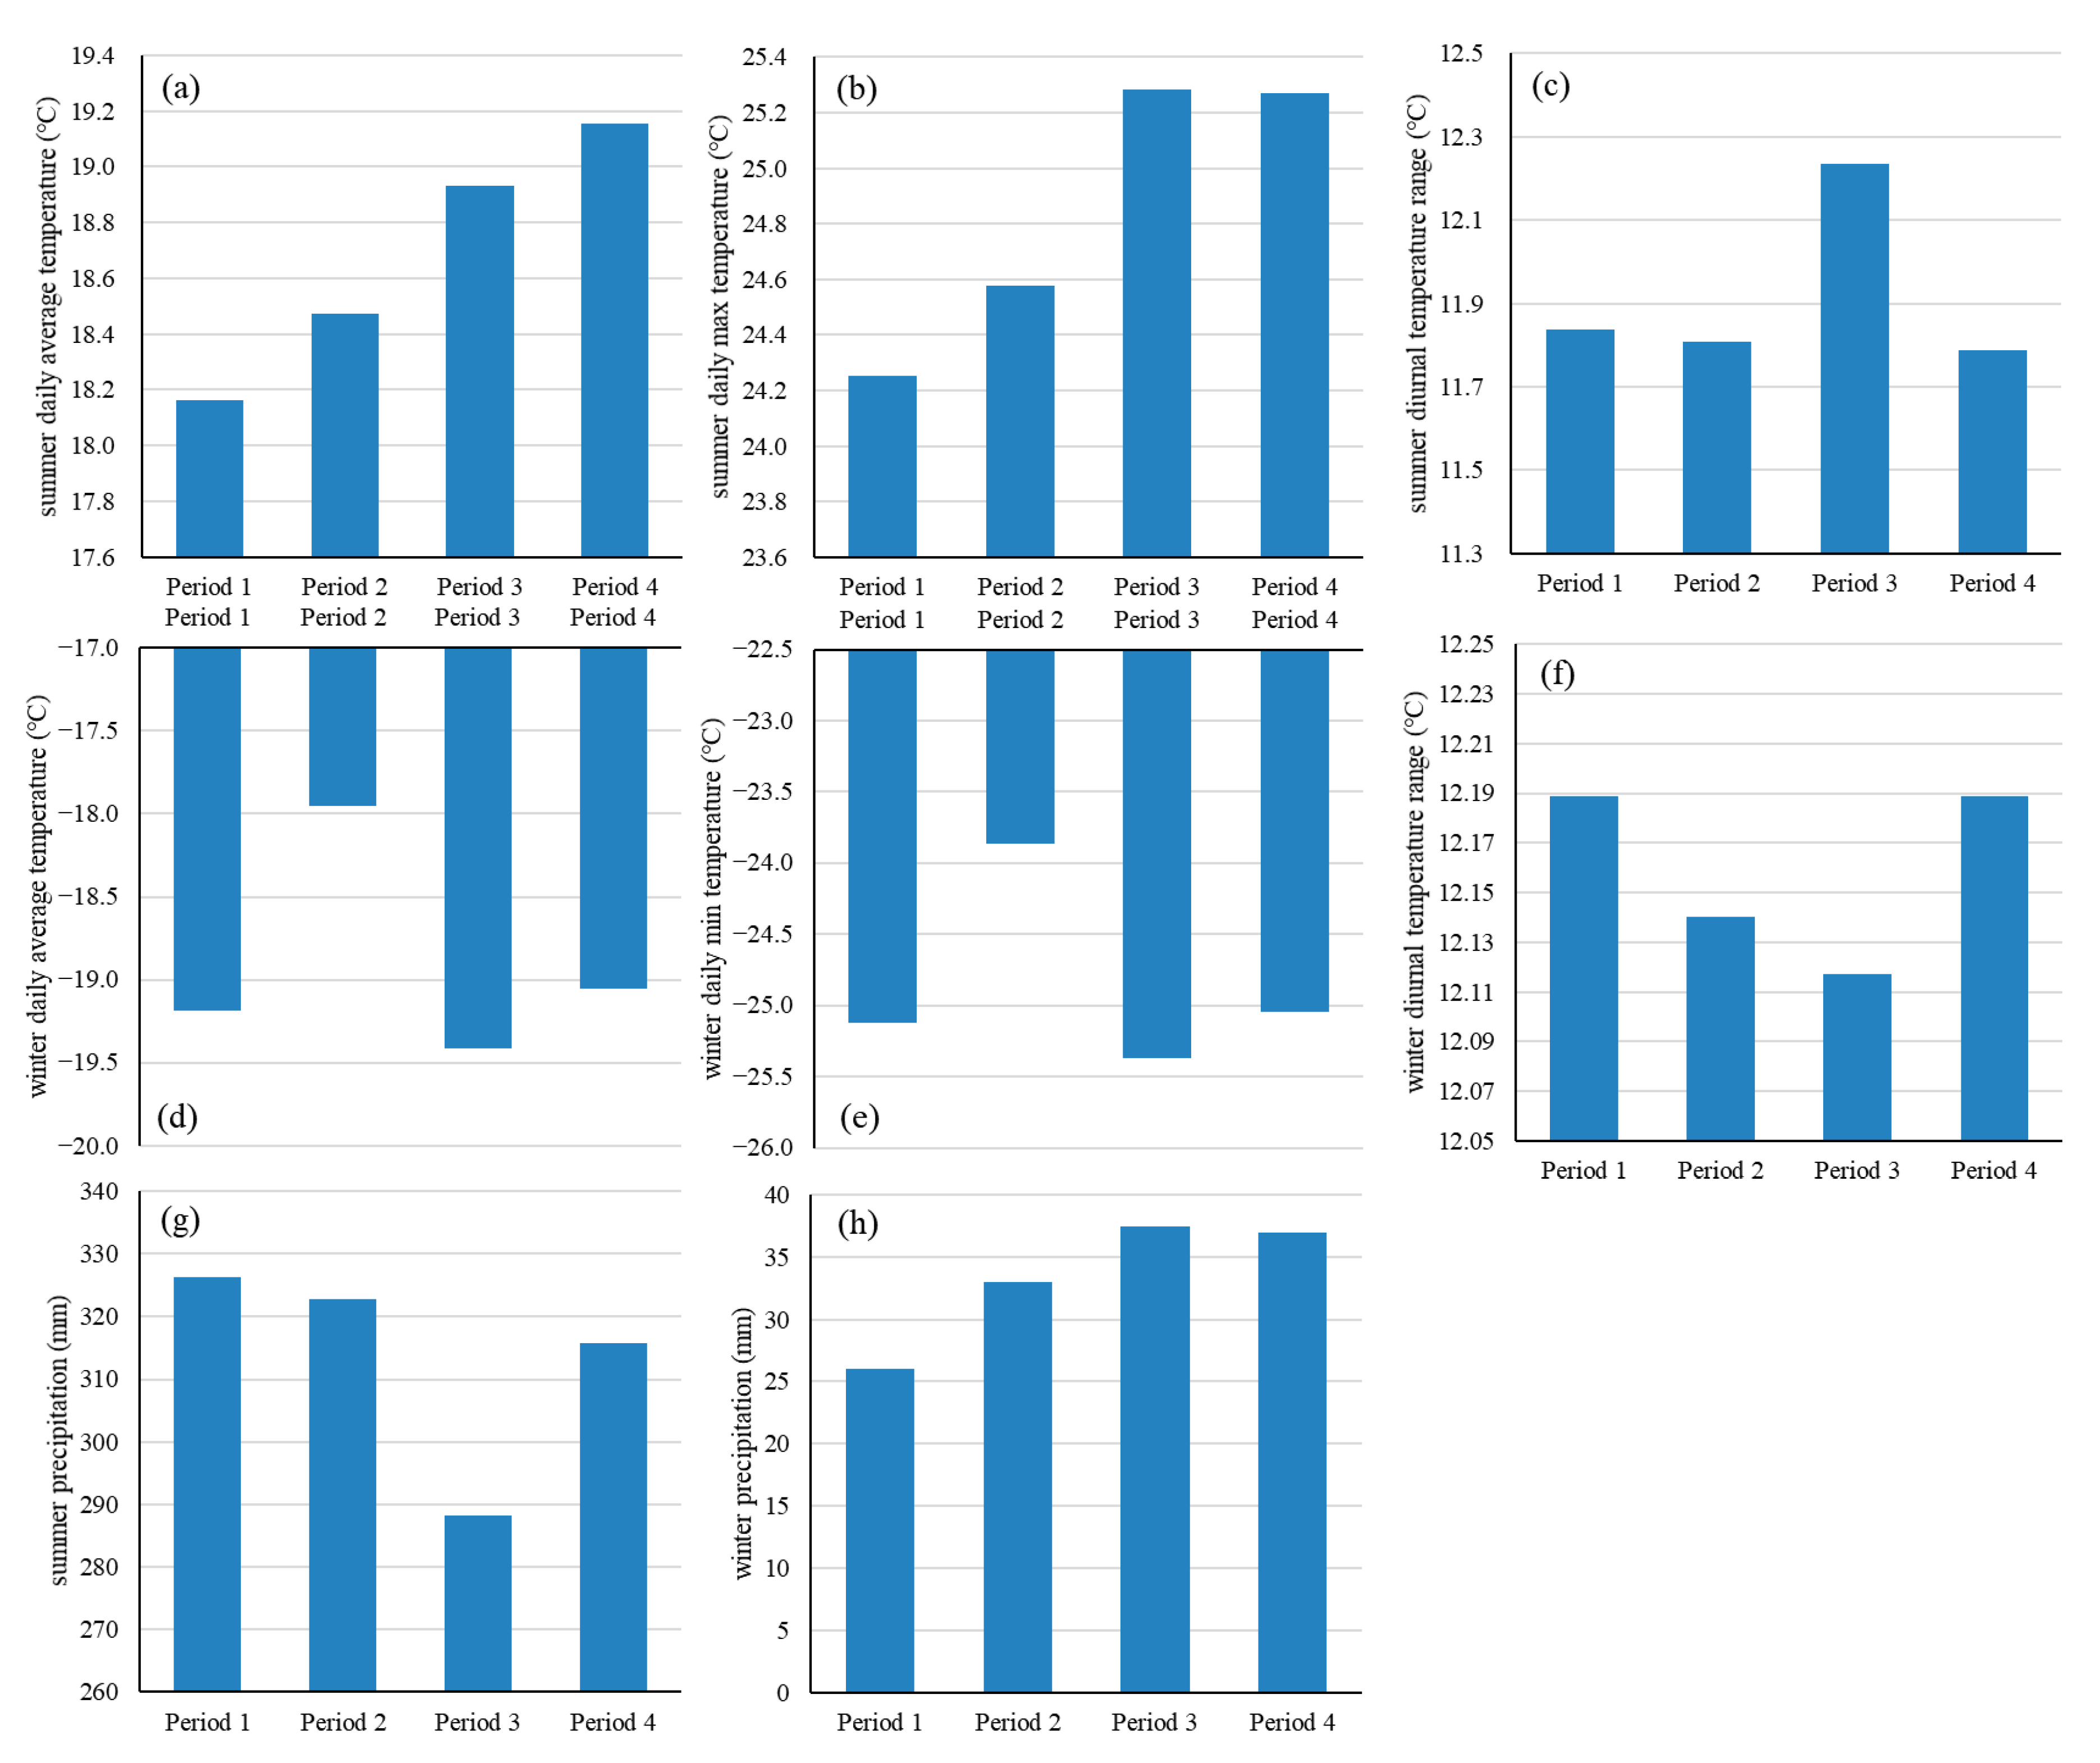
4.2. Climate Variability

The sequential Mann–Kendall tests for the annual precipitation and average temperature with a forward-trend UFk and backward-trend UBk (Figure 6) showed a significant increase in temperature after 1990 and an obvious abrupt change in temperature from 1983–1986. In addition, abrupt changes in precipitation occurred in the study area from 1996–1998. Based on the abrupt change analysis in this study and the significant land-use changes reported by other studies conducted in the ARB (see Section 2, study area), the simulation period was divided into four parts. Additional period-based climate analyses and land-use change analyses described below also demonstrated significant variations in climate and land-use among the different periods.
Figure 7 shows the annual precipitation, annual average temperature, and the trends and period averages of these data in the ARB. During the 1980–2013 period, the annual precipitation in the study region ranged between a minimum of 494.73 mm in 2000 and a maximum of 673.66 mm in 2013. With a mean value of 556.83 mm, the average annual precipitation during the four periods was 552.20 mm, 564.96 mm, 529.64 mm, and 580.84 mm, and the magnitudes of the changes between the periods were 2.31% between Period 1 and Period 2 (comparison of the two periods before and after 1991), −6.25% between Period 2 and Period 3 (the two periods before and after 2000), and 9.67% between Period 3 and Period 4 (the two periods before and after 2006). The annual average temperature in the study region varied from a minimum of −0.13 °C in 1987 to a maximum of 2.51 °C in 2007. The annual average temperatures of Periods 1–4 were 0.68 °C, 1.25 °C, 1.13 °C and 1.34 °C, respectively, and the magnitudes of the changes between the periods were 85.30% between Period 1 and Period 2, −9.58% between Period 2 and Period 3 and 18.09% between Period 3 and Period 4.
Based on the linear regression analysis and the Mann–Kendall trend test, the rates of increase in annual precipitation and annual mean temperature were 8 mm/10 years (not significant at α = 0.05) and 0.3 °C/10 years (significant at α = 0.05), respectively, and the Z values were 0.42 (not significant at α = 0.05) and 1.69 (significant at α = 0.05), respectively. Despite the general increasing trends in precipitation and temperature during the whole study period of 1980–2013, the results illustrated the unstable temporal variations in the climatic factors among these time slices, which led to differences in the directions of their impacts on hydrological processes. The period average values of the summer precipitation (SP), winter precipitation (WP), summer daily average temperature (STA), winter daily average temperature (WTA), summer daily maximum temperature (STM), winter daily minimum temperature (WTM), summer diurnal temperature range (DS), and winter diurnal temperature range (DW) among the four periods in the ARB were calculated and analyzed to further investigate the complex regional and seasonal climate changes (Figure 8).
The variations in the eight climate factors during these four periods showed strong fluctuations and clear seasonal diversity. The average and extreme temperatures during the different seasons showed similar trends during the four periods. The summer average temperature and maximum temperature generally increased, while the average temperature and minimum temperature in winter changed greatly in Period 2 (the average temperature increased by 6.4% after 1990 based on a comparison between Period 1 and Period 2, and decreased by 8.1% after 2000 based on a comparison between Period 2 and Period 3). The precipitation in winter generally increased during the study period, whereas the SP exhibited a significant abrupt change after Period 2 (−10.7%), which was consistent with the trend analysis and abrupt change analysis results presented above.

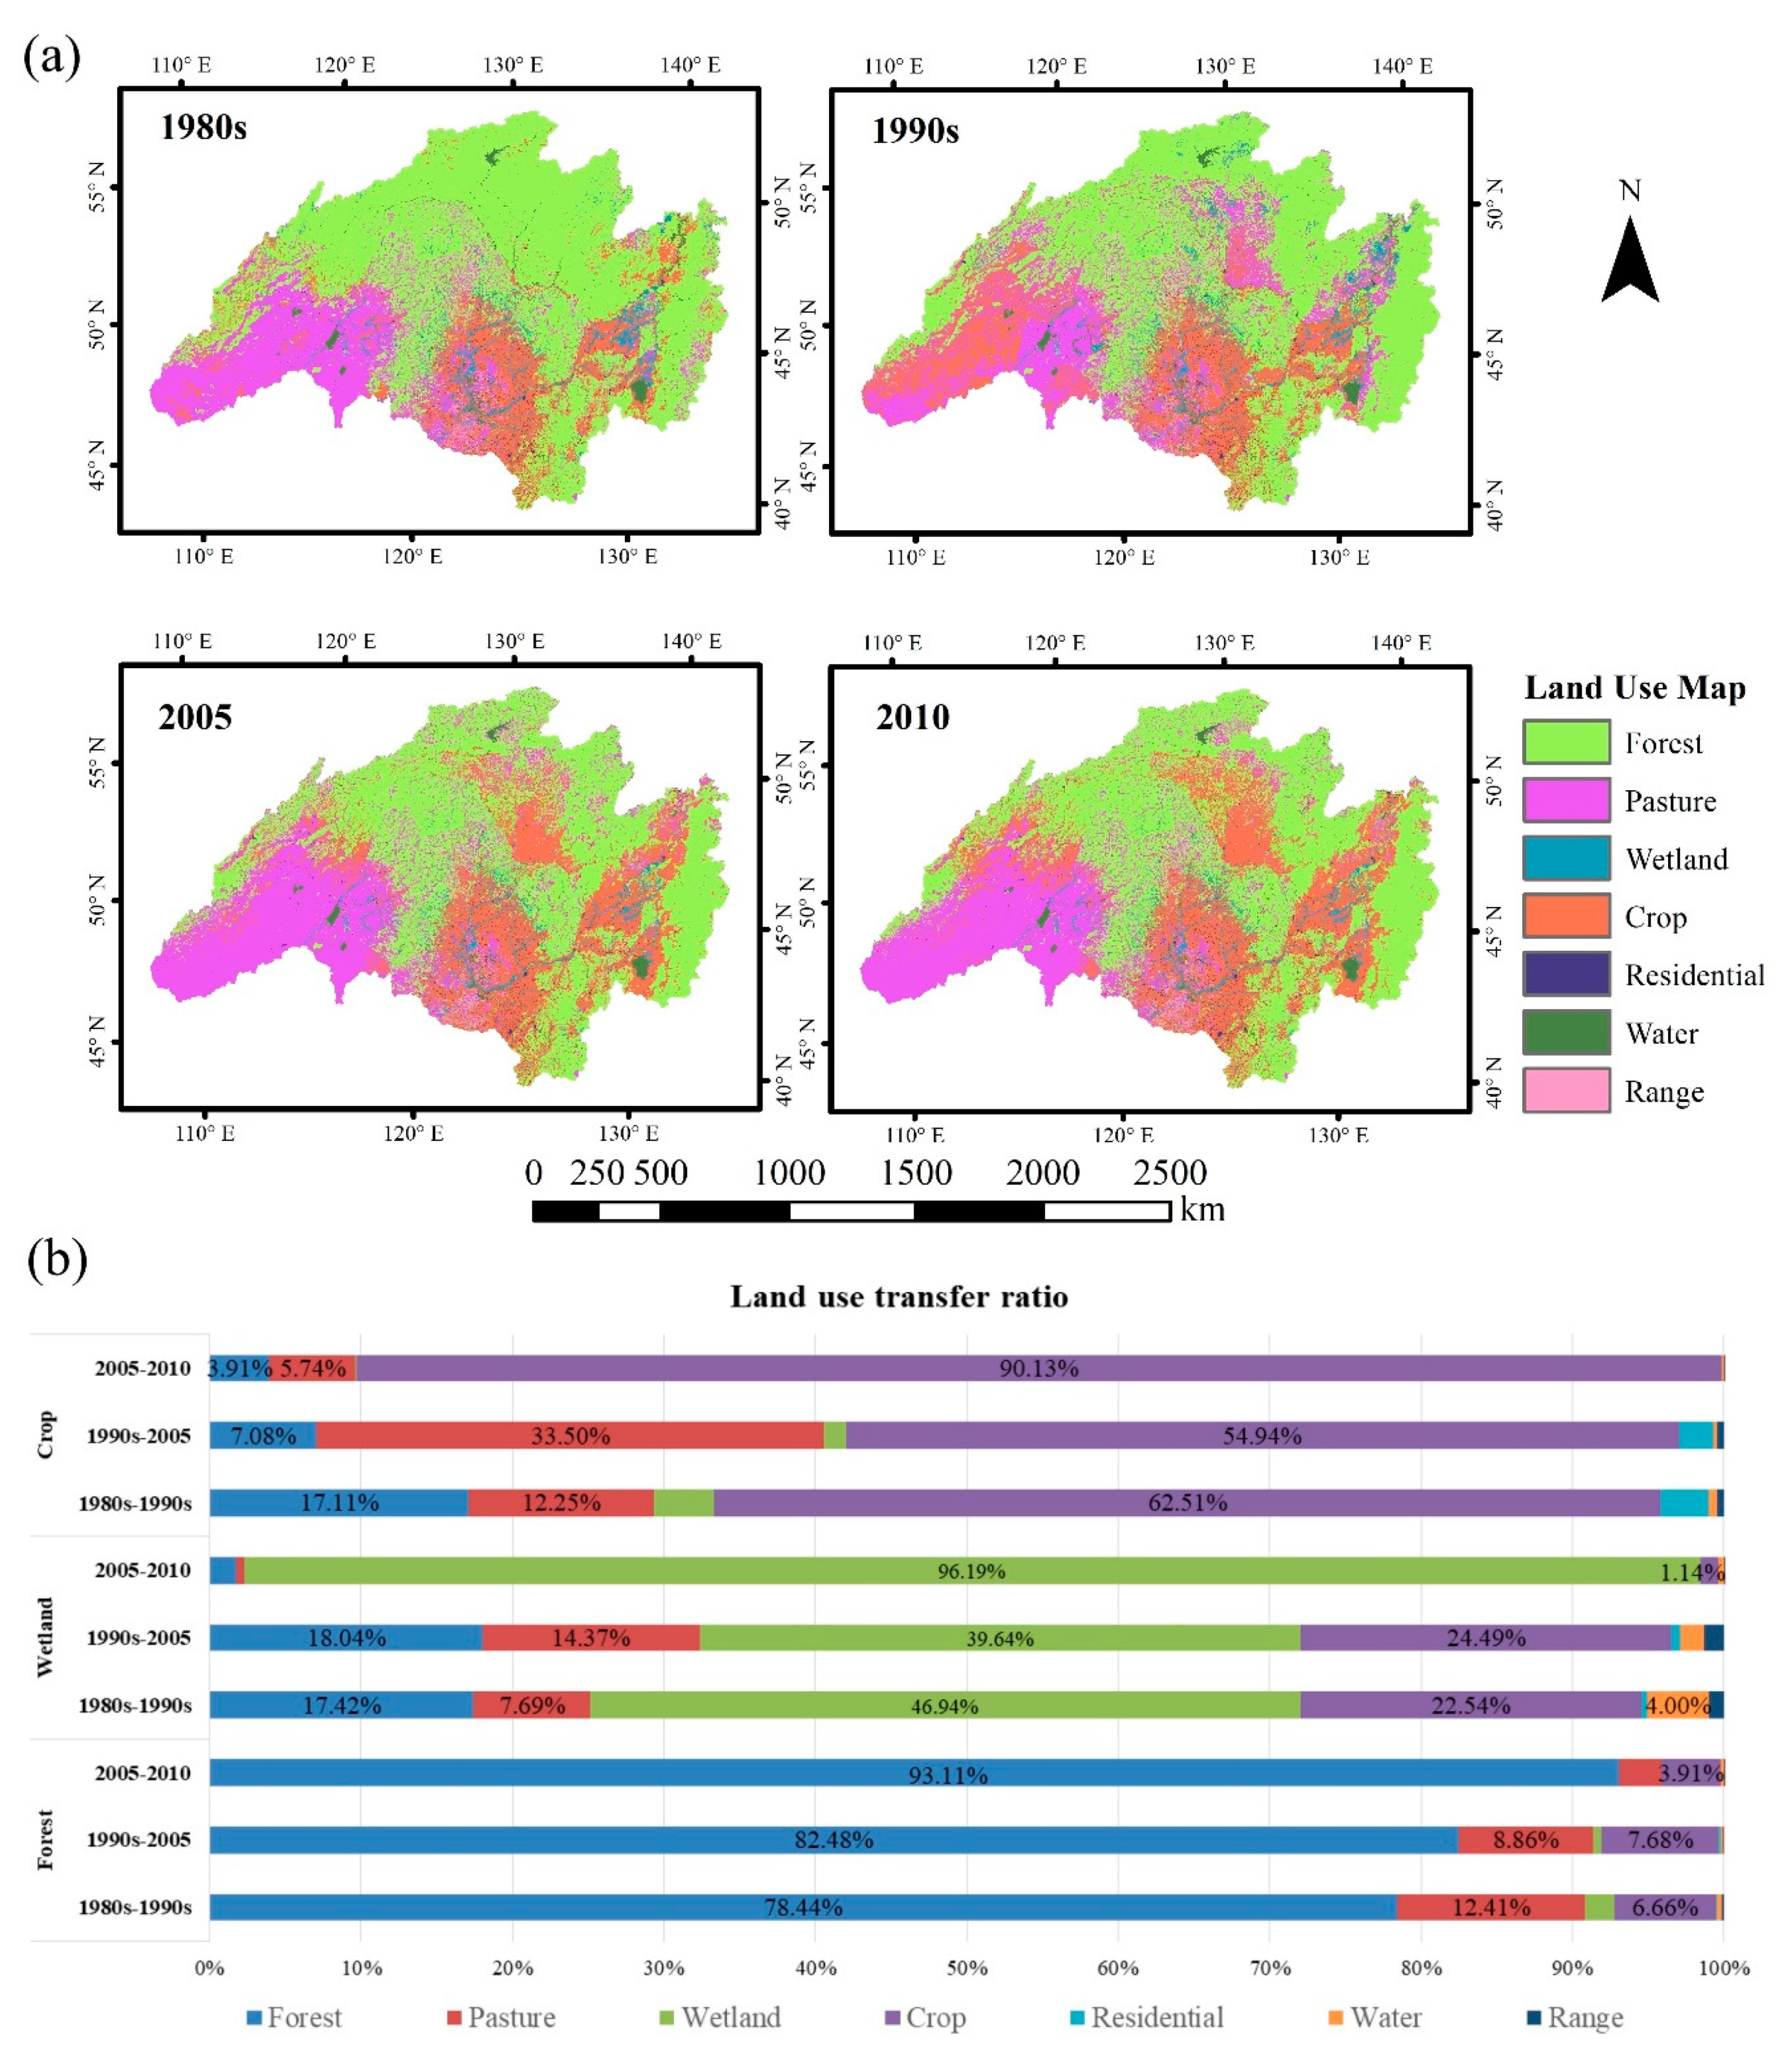
4.3. Land-Use Change

The land-use in the ARB has experienced dramatic changes in recent decades [16,24]. The areas of the different land-use types varied to different degrees during the simulation periods. Figure 9 shows the land-use maps for each period and the land-use transfer ratios of several of the main land-use types in the study region between the 1980s and 1990s, between the 1990s and 2005, and between 2005 and 2010.
Figure 9 shows that the major changes in land-use in the ARB occurred in the forest areas, and frequent conversions among forests, crops, wetlands, and pastures were observed during the whole simulation period. The wetland area decreased greatly after 2000 (based on the comparison between Period 2 and Period 3), and 24.49% of wetlands were converted to crops. Throughout the study period, the area of forest decreased, and a majority of this area was converted for agricultural uses (the conversion percentages among the four periods were 6.66%, 7.68%, and 3.91%). Consequently, the crop areas significantly increased with obvious conversions from forest, pasture, and wetland areas due to intense agricultural development.

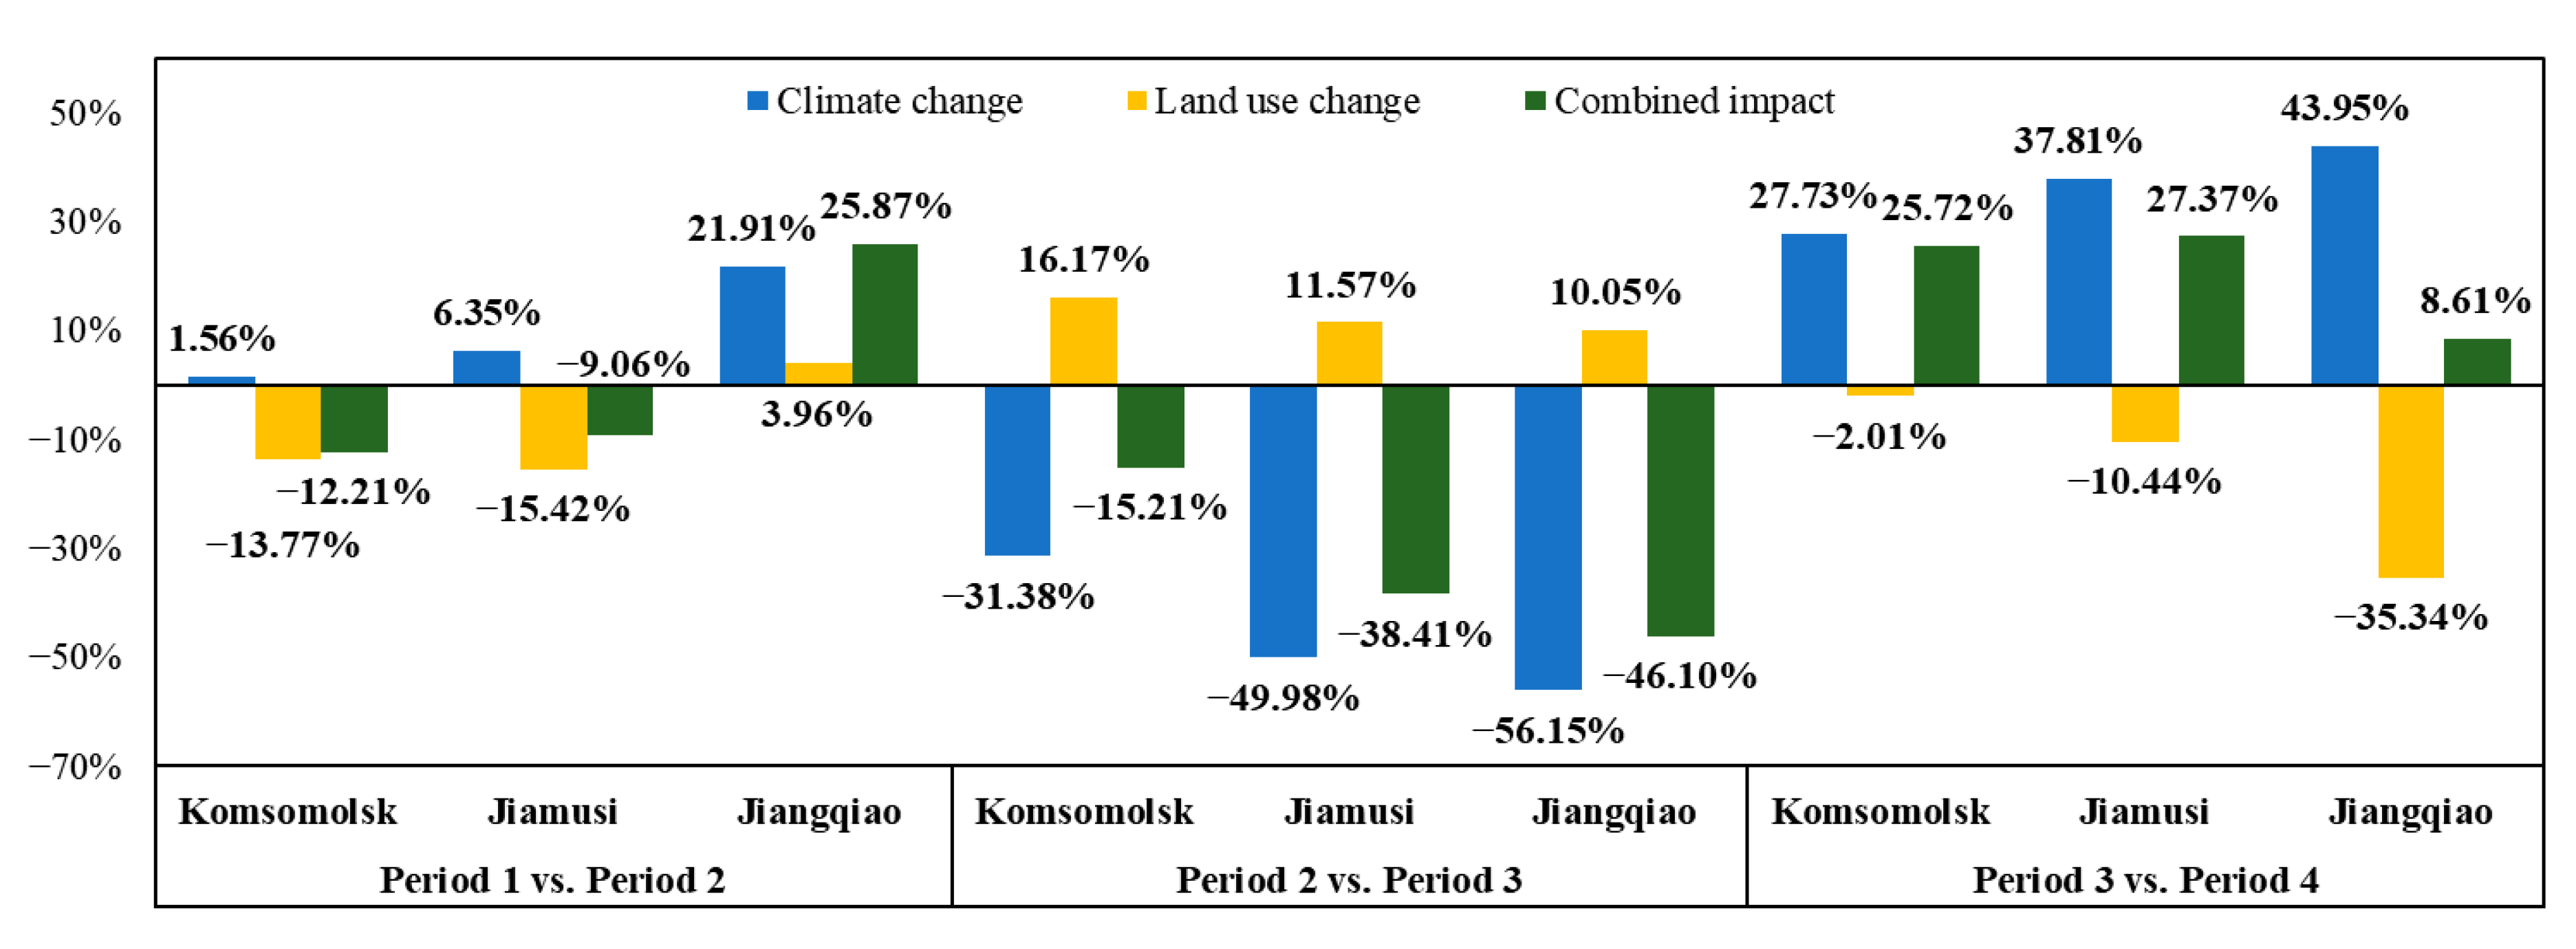
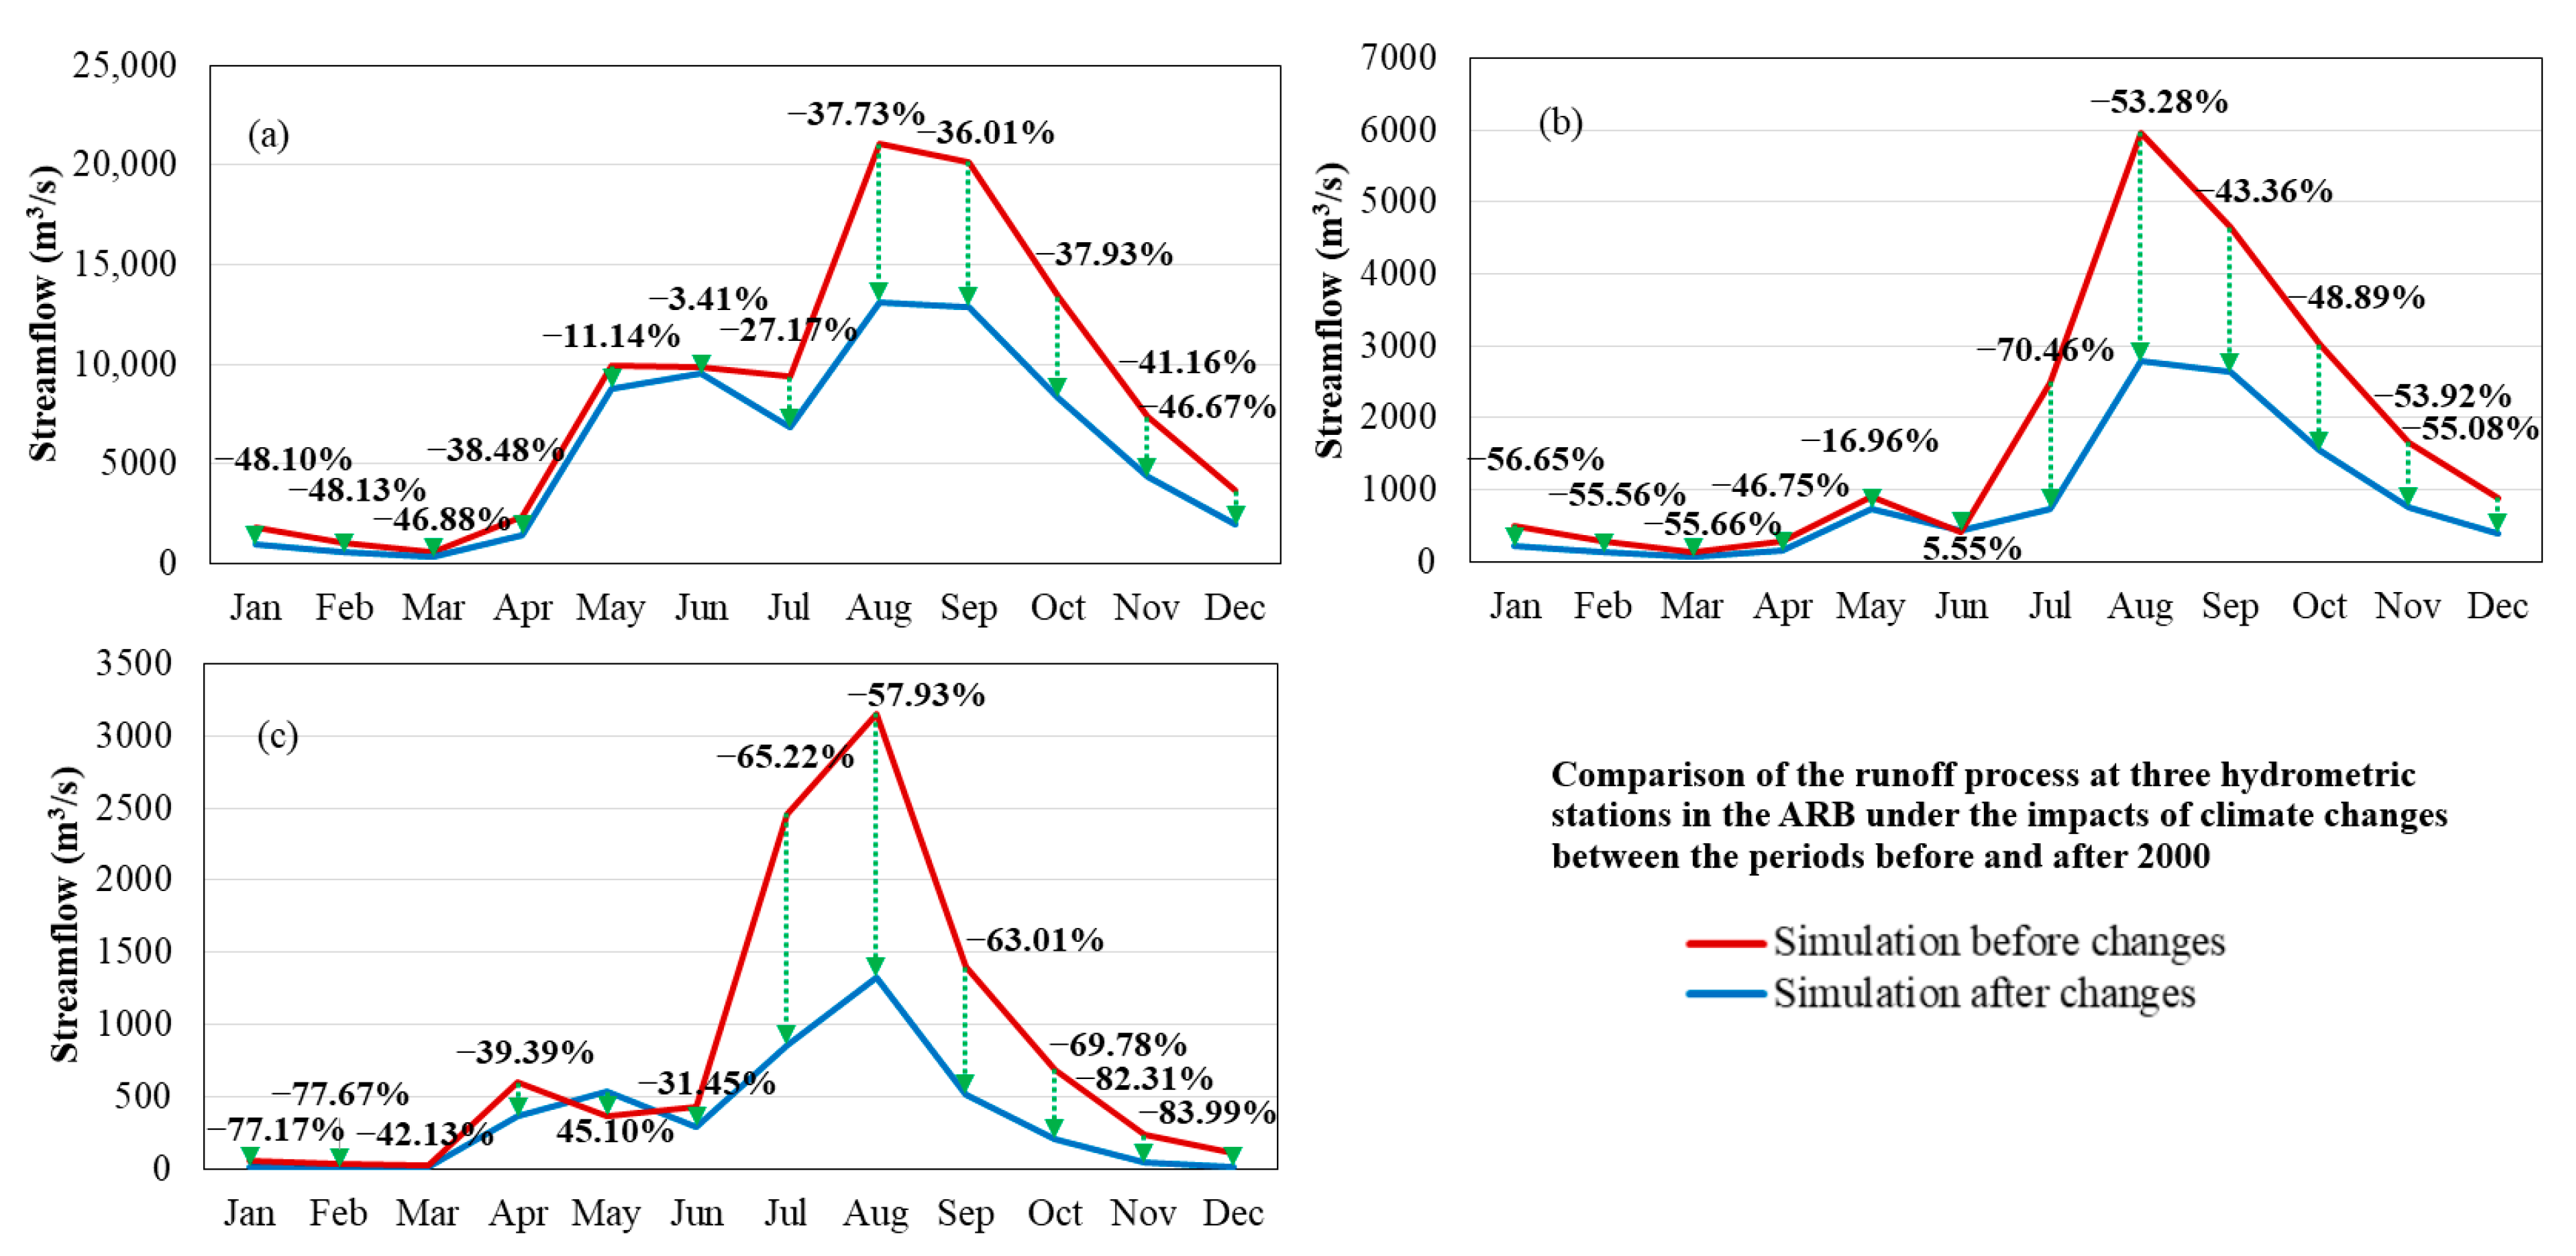
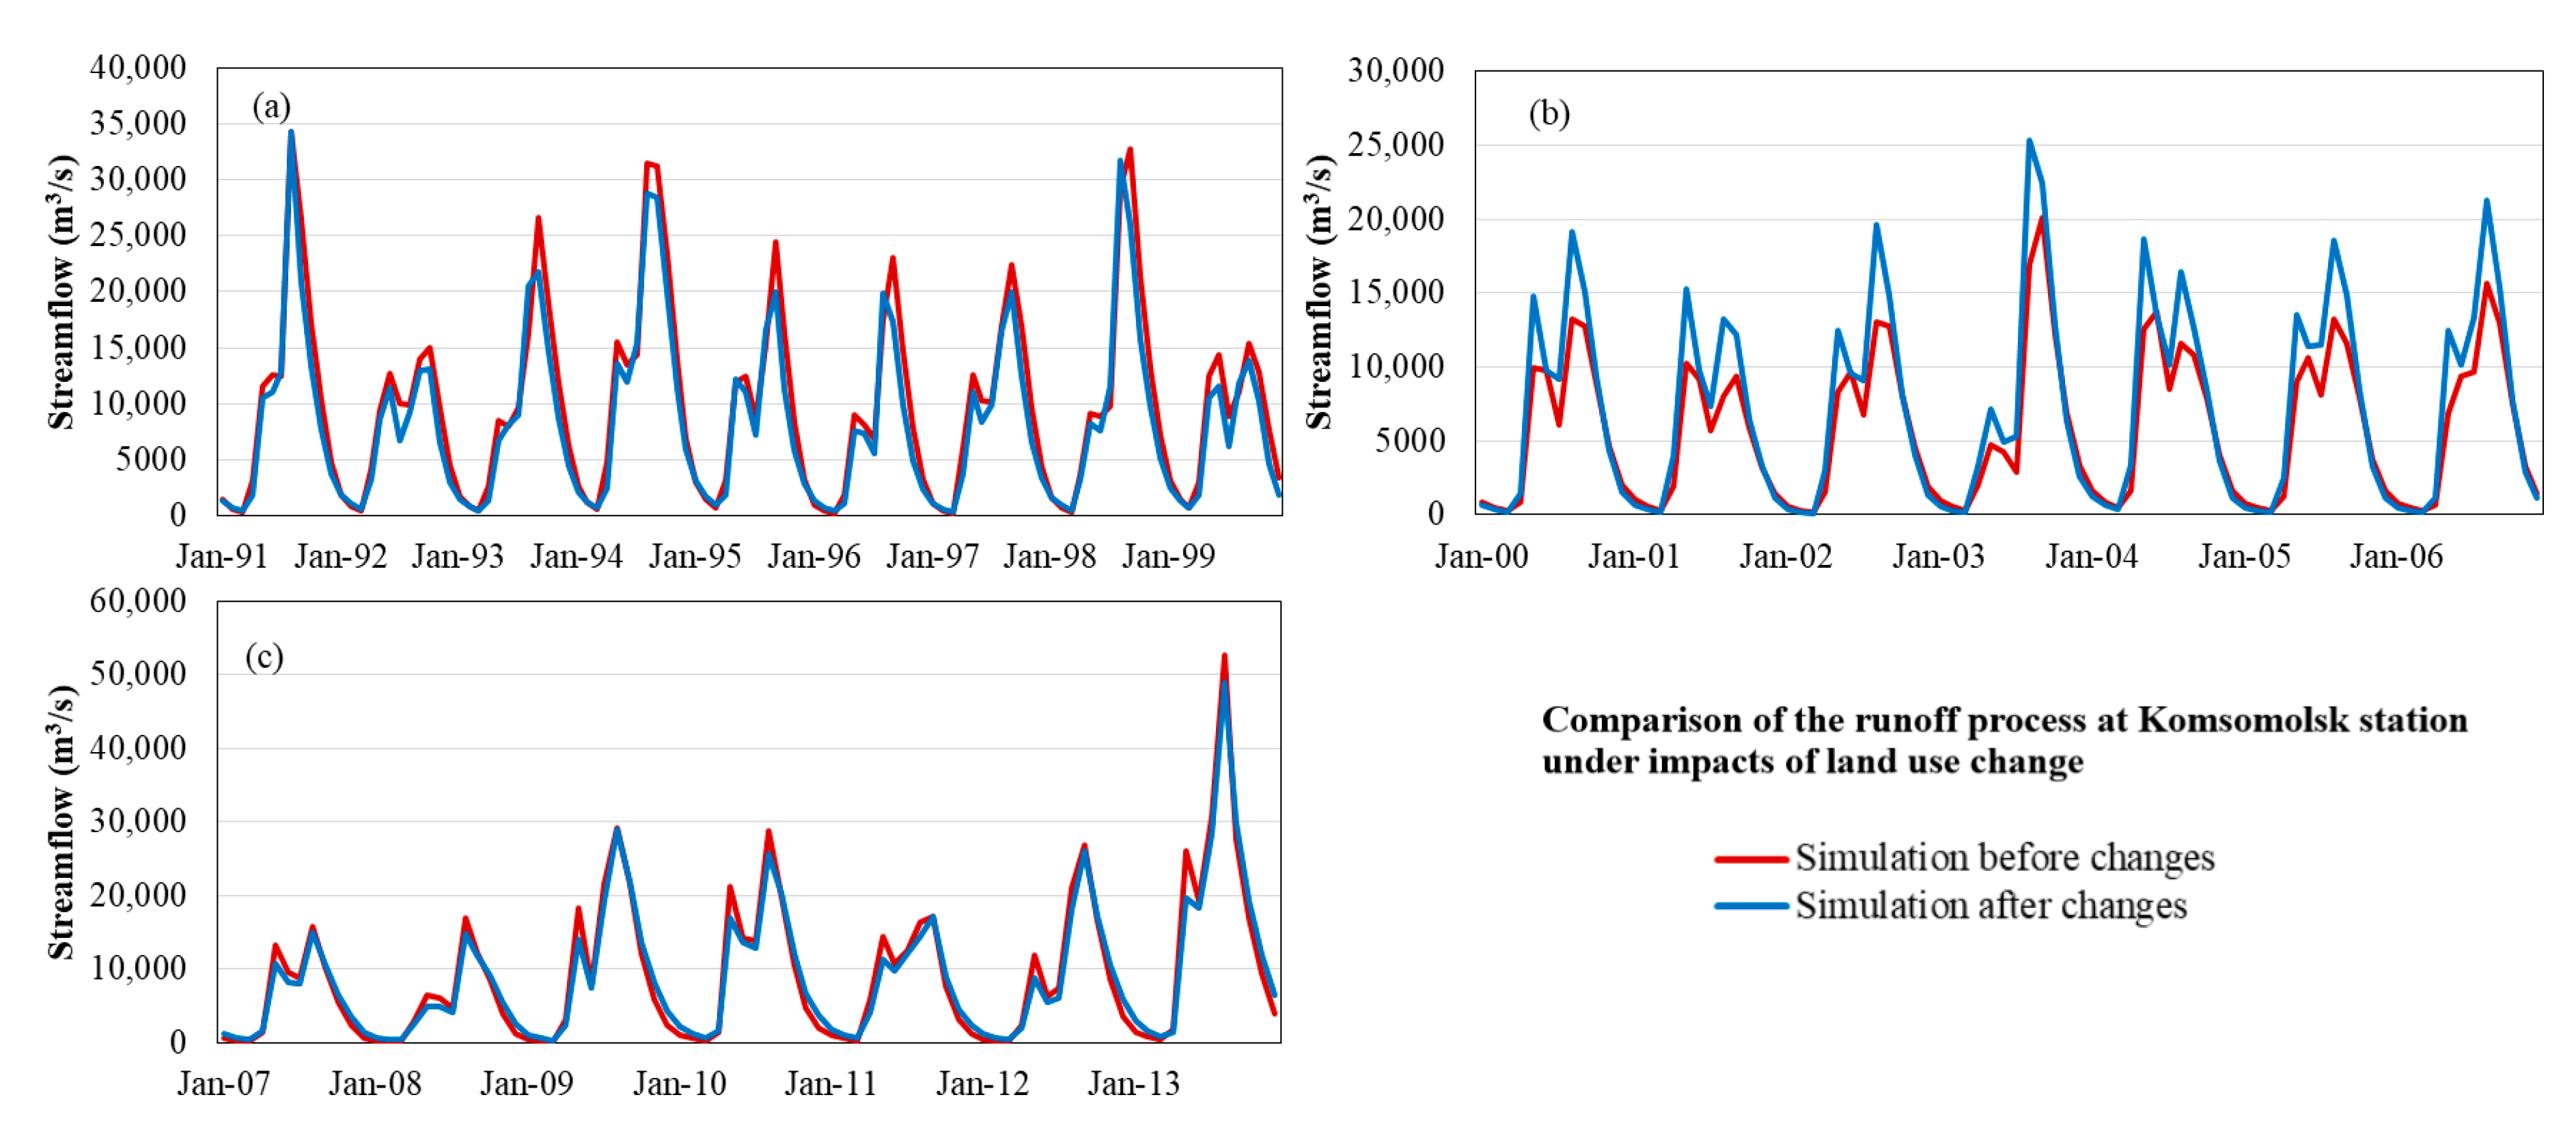
4.4. Impacts of Climate and Land-Use Changes on River Runoff at Different Sites over the Four Periods

The annual mean runoff responses to different land-uses and climate conditions at different hydrometric stations in the ARB were simulated by the SWAT model using simulation scenarios, as shown in Figure 10. The intensity of climate change impacts on the runoff increased significantly after 2000 and decreased slightly after 2007, although the impact directions differed. The contributions of climate change to runoff at the Komsomolsk site among the four periods were 1.56%, −31.38%, and 27.73%. The dramatic changes in the intensity and direction of the climate impact after 2000 were consistent with the period average (clear decline after Period 2) and the abrupt changes (period of abrupt change during 1996–1998) in precipitation determined in Section 4.2, which showed the close relationship between precipitation and runoff.
The impact analyses of 1980–1999 and 1991–2006 showed that the total runoff in the basin (Komsomolsk site) was greatly affected by the land-use (−13.77% based on a comparison between Period 1 and Period 2 and 16.17% based on a comparison between Period 2 and Period 3), and then the magnitude of the impact decreased (−2.01%) after 2007. At the Komsomolsk site, which was the outlet of the study region, the land-use changes and climate variability influenced the river runoff most strongly (16.17% and −31.38%, respectively) between the periods before and after 2000.
The runoff trends at the different sites in the basin were generally consistent under the influences of climate changes and human activities. The Jiangqiao basin, which is the smallest of the three studied sub-basins along the river, was most affected by both climate variability and land-use changes: The highest impact intensities reached up to −56.15% and −35.34%, respectively. Land-use variations played a large role in runoff changes in the ARB before 2000 based on a comparison between the periods of 1980–1990 and 1991–1999. A comparison of the three periods from 1991–2013 showed that climate changes made a greater contribution than did land-use variations to the river runoff in the overall ARB and the two sub-basins. However, the impacts of land-use changes simulated by the SWAT model were strongly reflected by the influence of vegetation changes caused by land-use changes, and additional transnational statistical data were needed to assess the variations in urban, industrial, and agricultural water uses caused by the land-use transformation. Therefore, the impact intensity of the land-use changes simulated in this study might be lower than the actual conditions.
Figure 11 shows a comparison of the runoff processes at three hydrometric stations in the ARB under the impacts of climate changes between the periods before and after 2000, and Figure 12 shows a comparison of the runoff processes at the Komsomolsk site in the ARB under the impacts of land-use changes. The results demonstrate that the impacts of climate and land-use changes on runoff at the hydrometric stations played a key role in the spring snowmelt and summer rainfall-runoff processes, which correspond to the peaks in the runoff processes. Combined with the analysis of climate changes presented above, the large-scale decrease in summer rainfall in the basin between the two phases before and after 2000 may be the main reason for the decrease at the peak of runoff. In addition, climatic variations not only affected the magnitude of snowmelt runoff but also altered the timing of the snowmelt in the spring. The delay of the snowmelt at the Jiangqiao station simulated under the climate change scenarios (Figure 11c) may be attributed to temperature variations in the river basin.

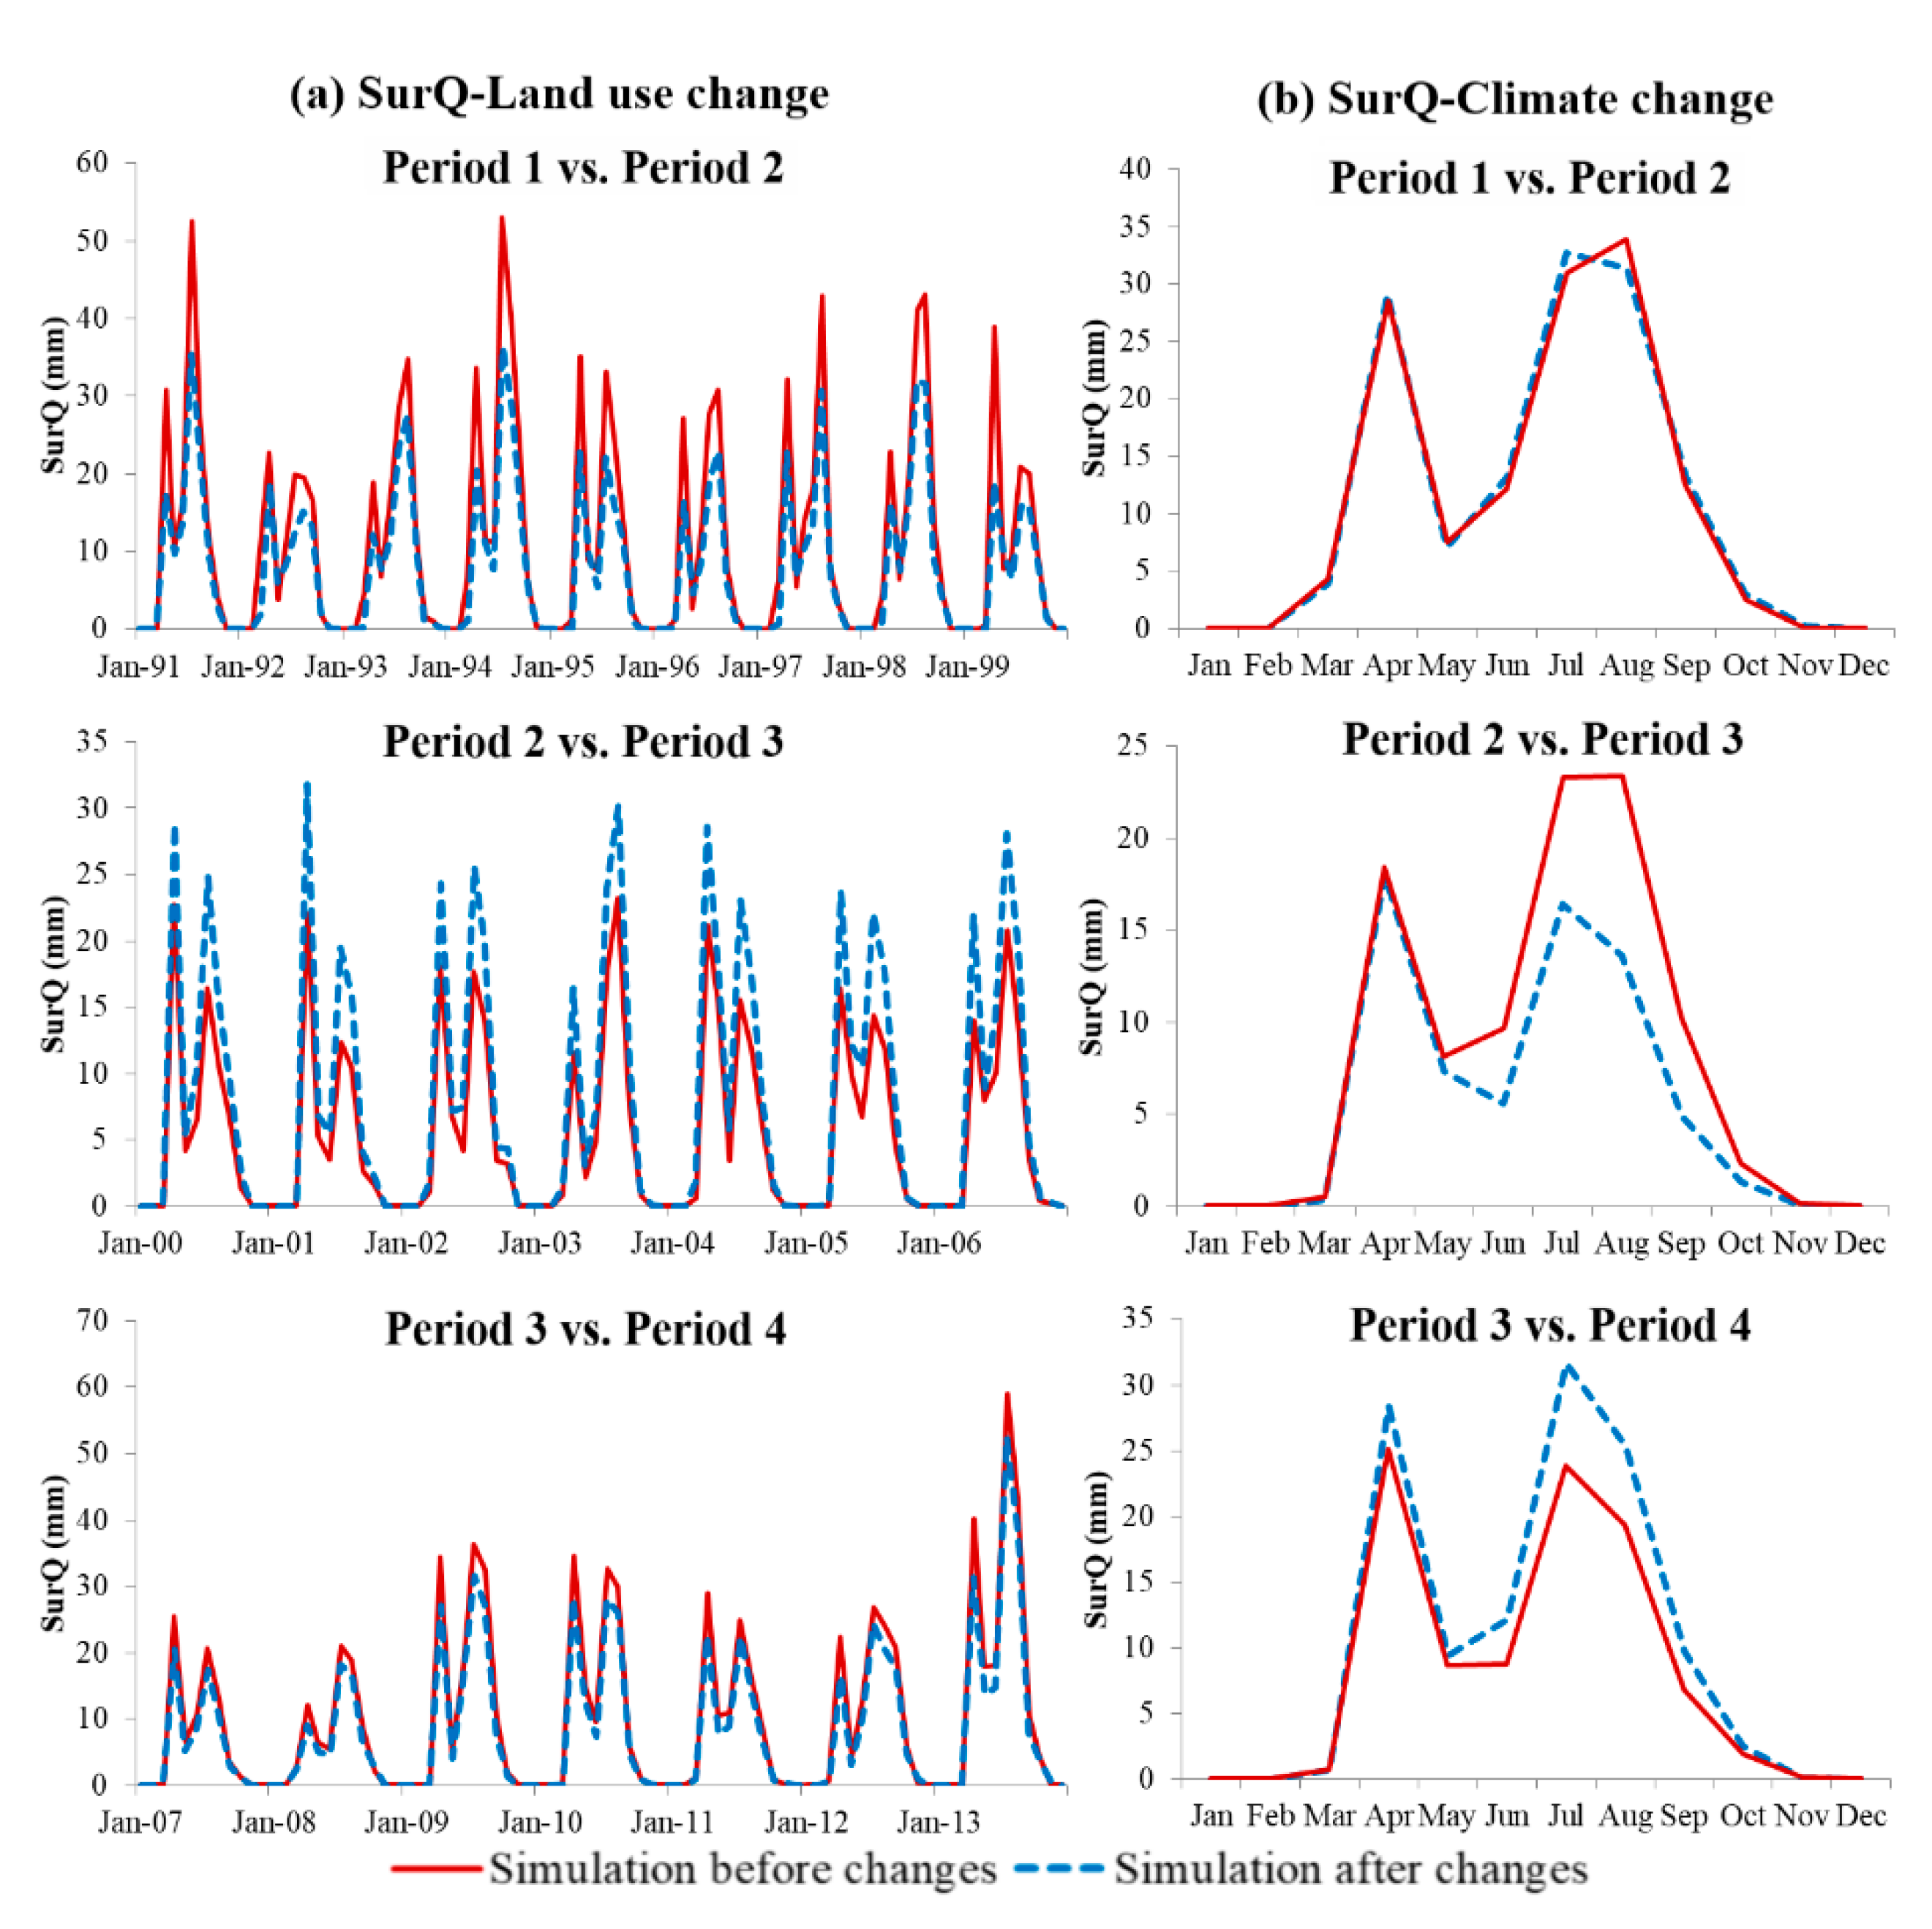
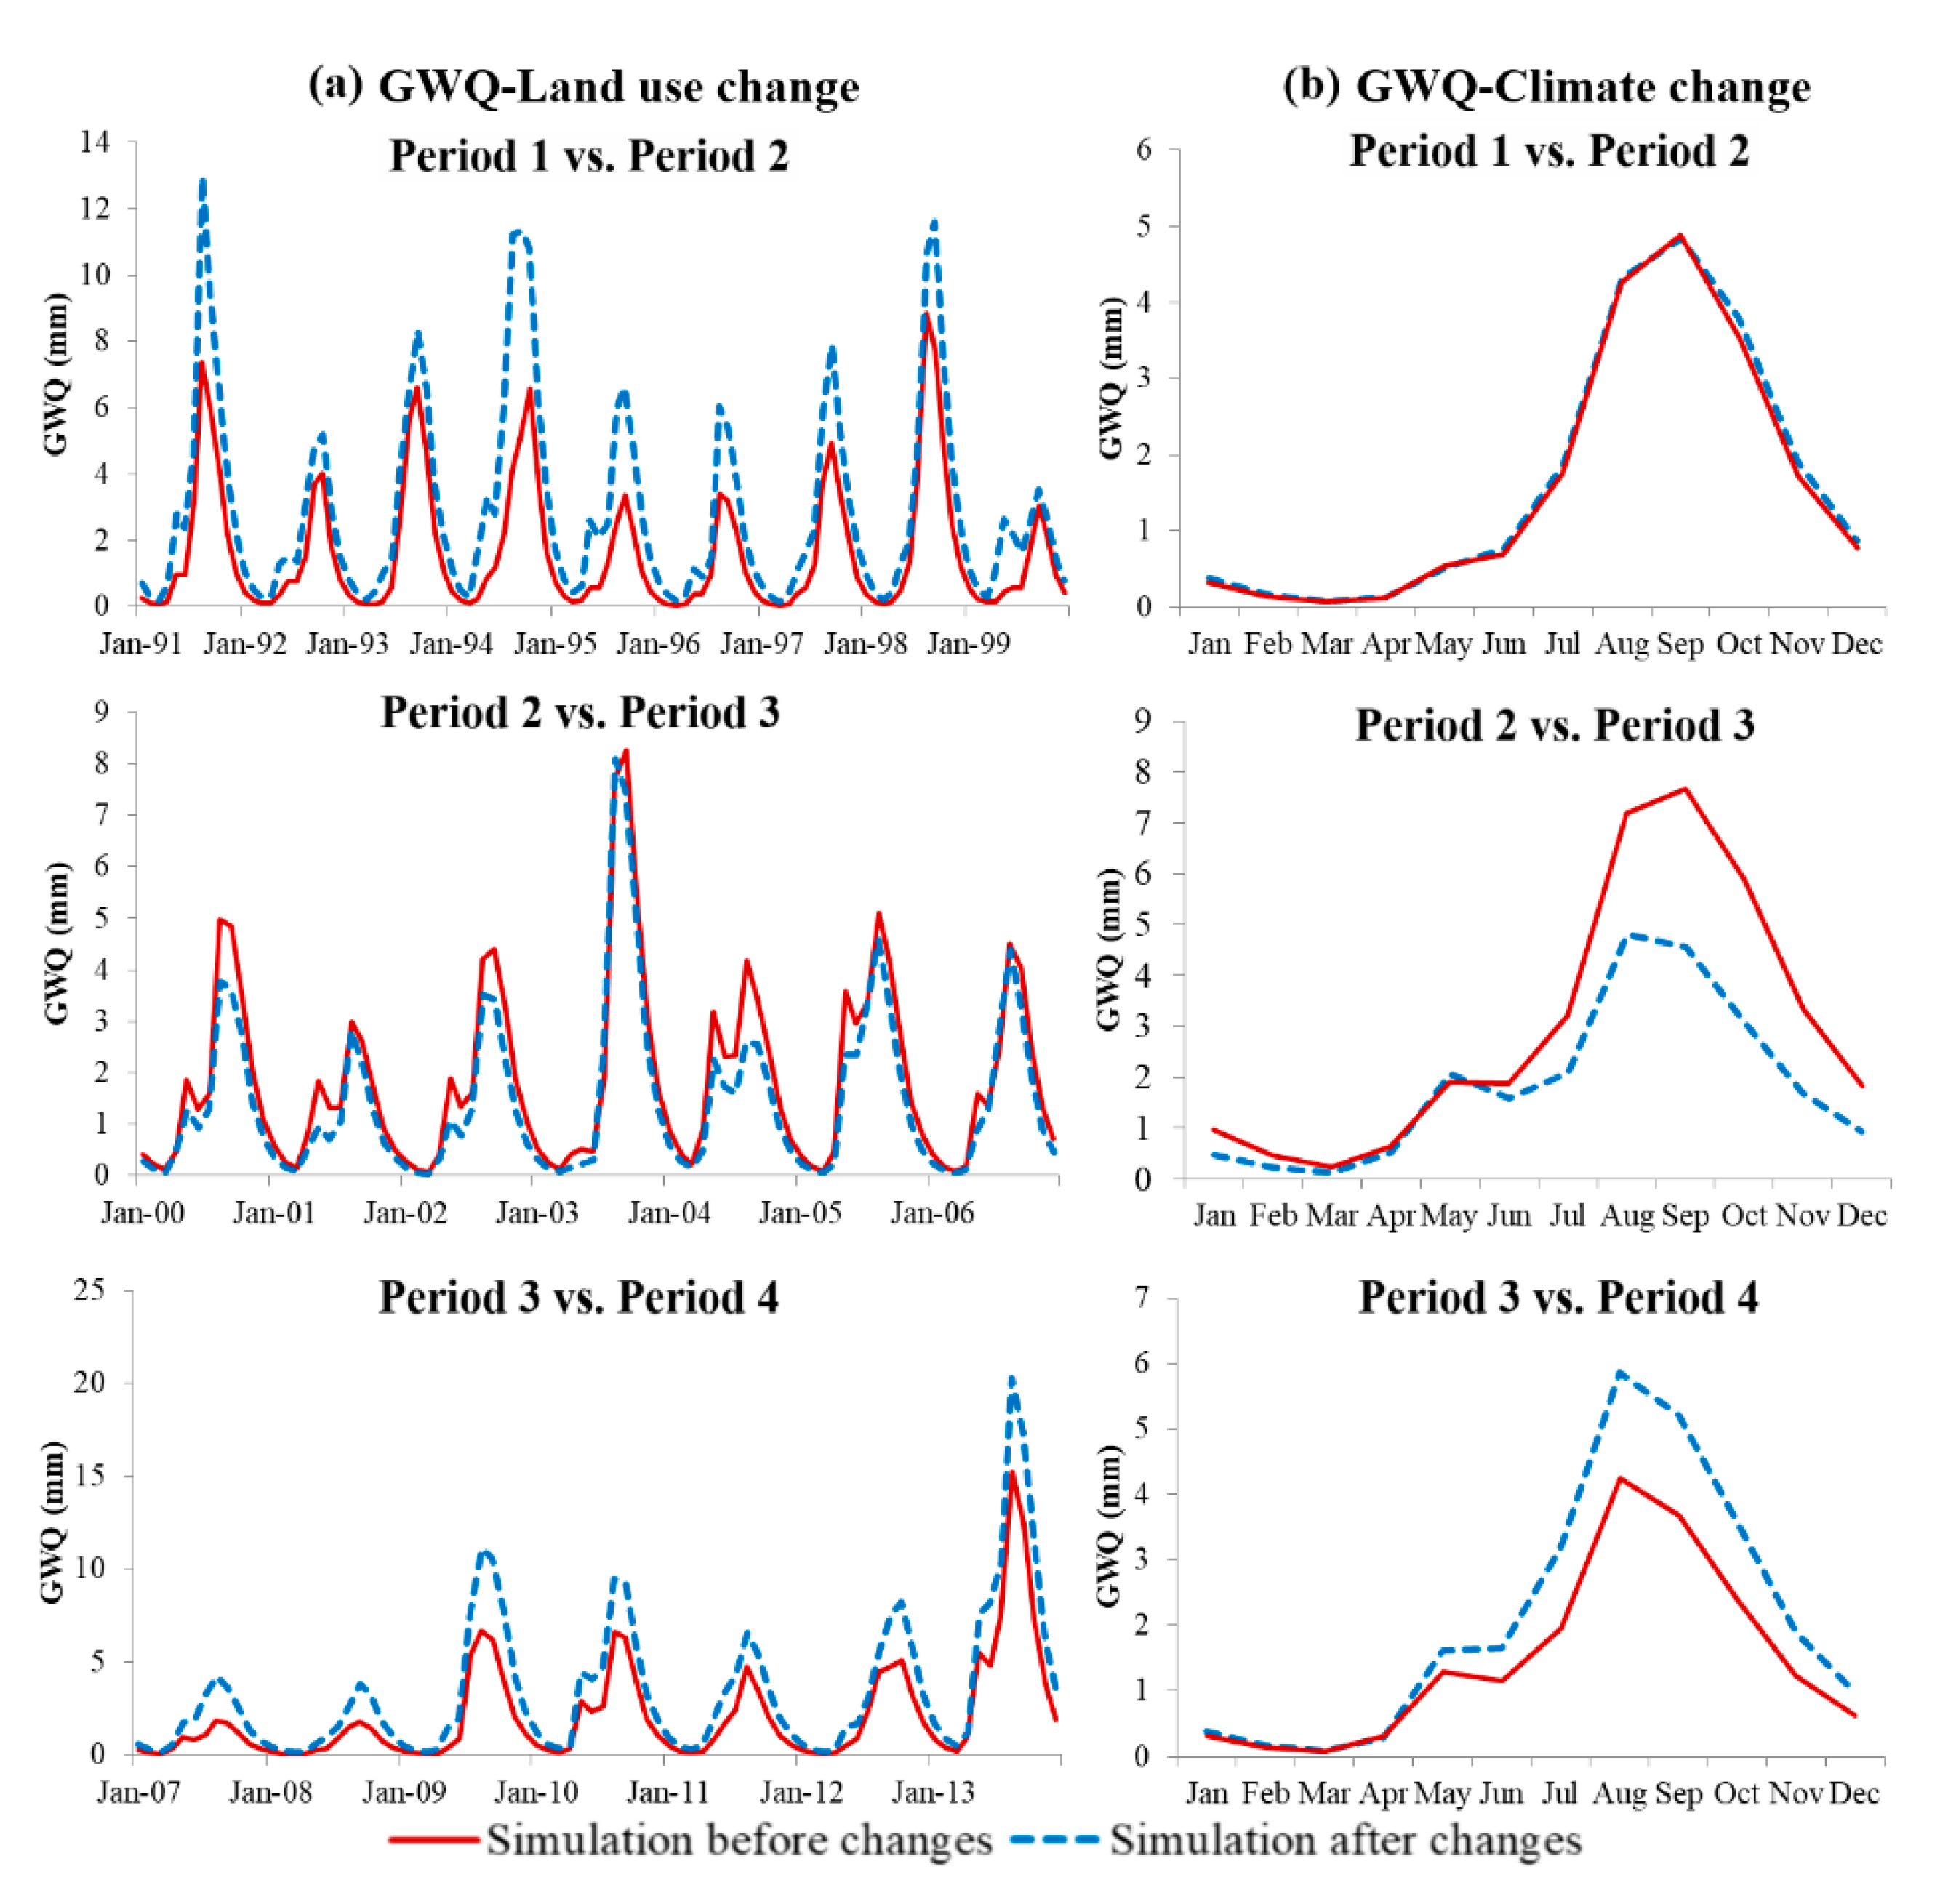
4.5. Impacts of Climate and Land-Use Changes on Five Hydrological Variables over the Four Periods

The responses of five hydrological variables in the ARB, including the surface runoff, groundwater flow, soil water, lateral flow and evapotranspiration, under climate and land-use changes are provided in Figure 13. The impacts of climate change and human activities on these five hydrological variables differed greatly, and the largest fluctuations occurred in the groundwater flow. Land-use changes provided a greater contribution to groundwater flow than did climate variability, and the impacts of land-use changes reached 91.84% after 2007 (based on a comparison between Period 3 and Period 4).
Figure 14 and Figure 15 shows comparisons of the surface runoff and groundwater flow in the ARB under different simulation scenarios. The results indicated that the impacts of climate changes on the amounts of surface runoff and groundwater flow generally occurred in the summer. Although land-use changes affected the peak groundwater flow, it could also accelerate or delay the process of groundwater flow, especially during spring snowmelt.
Based on the spatial information of the changes in the hydrological variables affected by climate variations, which were separated and evaluated by the SWAT simulation scenarios over the four periods and the spatial analysis of eight climatic factors (SP, WP, STA, WTA, STM, WTM, DS, and DW), the impacts of the changes in individual climatic factors on the hydrological responses at the sub-basin level were examined via PLSR and RR. The sub-basins with areas greater than 30,000 km2 were considered.
For the RR analysis, when the parameter k was greater than approximately 0.02, the coefficients of the equations tended to be relatively stable. The corresponding detailed information about the regression equations is shown in Table 3. A summary of the PLSR model for climatic factors is provided in Table 4. The results indicated that both the RR and PLSR models constructed for the hydrological variables in the ARB were strong (adjusted R2 was 0.6–0.8, and sig <0.005), and there was strong similarity between the impact directions and importance of climatic factors derived by the equation variables in both models.
As shown in Table 5, the importance of the independent variables in the model projection (VIP) values illustrated that the precipitation factors had stronger correlations with the hydrological variables than did the temperature factors. Among these factors, SP and STA were the major contributors to the variations in the hydrological processes (VIP >1). The factors for the different seasons showed different directions and extents of the impacts on the hydrologic components. An increase in SP would lead to increases in SurQ, LATQ, and GWQ, whereas an increase in WP may lead to decreases in LATQ and GWQ.
Based on these scenario model outputs of the changes in the hydrological variables over the four periods and the changes in the land-use areas in each studied sub-basin (forest, pasture, wetland, crop, residential, water, and range), the impacts of the changes in the individual land-use types on the hydrologic responses at the sub-basin level were examined via PLSR and RR. The sub-basins with areas greater than 30,000 km2 were considered.
The ridge trace of each land-use type in the RR analysis between the land-use and SurQ, LATQ, or GWQ demonstrated that the coefficients of the equations tended to be relatively stable when the parameter k was greater than approximately 0.03. The corresponding detailed information about the regression equations is shown in Table 6. A summary of the PLSR model for land-use changes is provided in Table 7. The results indicated that both the RR and PLSR models constructed for the changes in land-use type and hydrologic components in the ARB were strong (adjusted R2 > 0.8 and sig < 0.005), and the equation variables showed that the impact directions and importance of the changes in land-use type were relatively equivalent in both models.
The VIP values of the independent variables are shown in Table 8. The most significant predictors that explained the LATQ, GWQ, and SurQ values were crops and wetlands. Crops and wetlands negatively influenced SurQ, while forests positively affected SurQ, as indicated by the regression coefficients. The decrease in wetlands after 2000 may have led to an increase in GWQ, which may have been caused by the reduction in the water storage function of the wetlands. The highest VIP values were obtained for crops, followed by wetlands, which demonstrated that changes in crops and wetlands had the greatest influences on the hydrological variables.

5. Discussion

By analyzing the characteristics of climate variations and land-use changes, this paper indicated that the ARB was experiencing intense agricultural development and climate changes from 1980 to 2013. The conversion of different land-use types occurred in various directions and to different degrees during the four periods. For example, the wetland area decreased greatly after 2000, and 24.49% of wetlands were converted to croplands. In addition, the variations in the eight climate factors during these four periods showed strong fluctuations and clear seasonal diversity. The SP exhibited a significant abrupt change after Period 2 (−10.7%). These highlighted period differences in individual land-use types/climatic factors would undoubtedly lead to fluctuations in the hydrological processes, which was also confirmed in subsequent impact analyses.
According to the scenario analysis, land-use variations played a large role in runoff changes in the ARB before 2000. Afterward, climate changes made a greater contribution to changes of the river runoff (the highest impact intensities of climate and land-use changes on runoff for the study basin both occurred after 2000 based on a comparison between Period 2 and Period 3). In addition, climate variability and land-use changes always had the opposite effects on runoff during the same period, resulting in a combined effect that reduced the overall impact on runoff. The model simulation indicated that the groundwater flow in the study region was the hydrological variable most sensitive to global changes, and that land-use changes provided a greater contribution to the groundwater flow than did climatic variations. A comparison of the simulated hydrological processes under different scenarios revealed that climate variability and land-use changes not only affected the magnitude of runoff but also possibly altered the timing of snowmelt in the spring.
The PLSR and RR analyses based on the multi-period scenario simulation results demonstrated that among the climatic factors, SP and STA were the major contributors to the variations in SurQ, GWQ, and LATQ. The factors for the different seasons showed different directions and extents of the impacts on the hydrologic components. For land-use changes, the regression coefficients and VIP values suggested that crops and wetlands were the principal land-use types contributing to the hydrological responses. Based on the PLSR and RR models and considering the above-mentioned analyses of climate and land-use changes and their impacts during different periods, the decrease in runoff under the influence of climate changes after 2000 may be associated with the large reduction in summer rainfall in the basin during this period. Moreover, the intense changes in the crop and wetland areas (e.g., large-scale wetland reclamation) observed between the periods before and after 2000 may have played a vital causal role in the drastic variations in the basin runoff under changes in land-use as indicated in Figure 10 (See Section 4.4). The coexistence of forest and wetland protection and agricultural development in the 21st century may also partially explain the decline in the impact intensity of land-use changes after 2007, as simulated above. Therefore, in terms of water sustainability, the wetland reclamation area should be limited to a reasonable level to reduce the associated impact on hydrological processes.
The findings in this paper demonstrated that in the case of unstable changes in environmental factors, the fluctuations in the hydrological impacts of certain environmental factors may be ignored when performing common long-term runoff simulations of an entire basin. Therefore, further studies regarding the diverse extents and directions of the impacts of climatic variations and land-use changes on hydrological variables between several time periods would be worthwhile.
Uncertainties of the research results can arise from the combination of the hydrological model and multivariate statistics. Multi-source remote sensing data (GRACE, MODIS, etc.) were collected and used in the calibration and validation of the SWAT model to supplement the runoff data to further reduce the simulation uncertainty and improve the simulation accuracy of the hydrologic components. In addition, the PLSR and RR models of climatic factors/land-use types were built in parallel, and the similar results were derived from the two different methods for the uncertainty reduction. In this paper, according to the actual geographical conditions of the ARB, the whole research period was divided into several stages, and the PLSR and RR models were built based on separate impact modeling scenario results during all four periods. Therefore, the results would eliminate part of the influence from interference factors in the subsequent multivariate statistics concerning the hydrological responses of individual climate factors/land-use types, and the influence of a single factor on the hydrological processes provided by these models was more stable during the whole research period, which reduced the uncertainty. However, the uncertainty of the results still needs further researches and reduction. The limitations of the hydrological model, such as the simulation uncertainty in snowmelt processes, which are significant at mid and high latitudes and sensitive to global changes, still influenced the quantitative hydrologic analysis. Moreover, the land-use data used in the hydrological model represented the underlying surface conditions and the intensity of human activity, and the data accuracy was directly related to the accuracy of the simulation. However, a series of long-term, high-accuracy land-use datasets produced by the same classification method were not available for the ARB. The combination of different land-use datasets increased the uncertainty of the analysis. Therefore, more studies should be undertaken to investigate the effects of the accuracy and consistency of the series of land-use datasets on the results of land-use impact analysis in future research. Using remote sensing data to monitor the land-use condition of the entire ARB and producing a series of high-accuracy datasets would be difficult tasks to undertake.

6. Conclusions

In this study, based on calibration and validation with data from multiple sources, the SWAT model was successfully applied to the ARB for assessing the impacts of climatic variations and land-use changes on hydrological processes. The results of this study indicated that the land-use and climate in the ARB experienced dramatic temporal changes during the four periods of 1980–1990, 1991–1999, 2000–2006, and 2007–2013. Summer precipitation and summer average temperature were the dominant climatic factors affecting the surface runoff, groundwater flow, and lateral flow. Crops and wetlands were the principal land-use types contributing to the hydrological responses. Among the hydrological variables, groundwater flow was most affected by land-use changes (91.84% after 2007). In addition, the highest-intensity impacts of climate and land-use changes on the runoff at the basin outlet reached −31.38% and 16.17%, respectively, between the periods of 1991–1999 and 2000–2006, and the intense changes in the crop and wetland area (e.g., large-scale wetland reclamation driven by agricultural demand in the ARB) and the obvious decline in summer precipitation during this period may account for these drastic variations in the runoff affected by land-use/climate changes.
These results provide important insights into the effects of changes in specific land-use types/climatic factors on the hydrological cycle, which may explain the significant variations in the hydrological processes of the ARB under large-scale wetland reclamation. The application of quantitative separate impact analyses using model scenarios combined with multivariate statistics to rank the influences of specific factors is recommended for assessing the impacts of climate and land-use changes on hydrology. To address the lack of hydrological response studies in the ARB, the results of this paper provide vital information that can be useful for decision-makers.

Author Contributions

W.Z. initiated and conceived this research. S.Z. collected the input data for the model, designed and implemented the method, performed the simulations and data analysis, interpreted results and wrote the manuscript under the guide of W.Z. W.Z. modified the manuscript. Y.G. contributed to the collection of model input data and data processing. All authors have read and agreed to the published version of the manuscript.

Funding

This research was funded by the National Key R&D Program of China, grant number [2016YFA0602302] and [2018YFB0605603-04].

Acknowledgments

Open discussions in weekly seminars with the graduate students in Wanchang Zhang’s group are acknowledged.

Conflicts of Interest

The authors declare no conflicts of interest.

References

  1. Li, F.; Zhang, G.; Xu, J.Y. Separating the Impacts of Climate Variation and Human Activities on Runoff in the Songhua River Basin, Northeast China. Water 2014, 6, 3320–3338. [Google Scholar] [CrossRef] [Green Version]
  2. Li, Z.; Liu, W.-Z.; Zhang, X.-C.; Zheng, F.-L. Impacts of land use change and climate variability on hydrology in an agricultural catchment on the Loess Plateau of China. J. Hydrol. 2009, 377, 35–42. [Google Scholar] [CrossRef]
  3. Whitehead, P.G.; Wilby, R.L.; Butterfield, D.; Wade, A.J. Impacts of climate change on in-stream nitrogen in a lowland chalk stream: An appraisal of adaptation strategies. Sci. Total Environ. 2006, 365, 260–273. [Google Scholar] [CrossRef]
  4. Dong, L.; Xiong, L.; Yu, K.; Li, S. Research advances in effects of climate change and human activities on hydrology. Adv. Water Sci. 2012, 23, 278–285. (In Chinese) [Google Scholar] [CrossRef]
  5. Dong, L.; Zhang, G. Review of the impacts of climate change on wetland ecohydrology. Adv. Water Sci. 2011, 22, 429–436. (In Chinese) [Google Scholar]
  6. Dong, L.; Zhang, G. The dynamic evolvement and hydrological driving factors of marsh in Nenjiang River basin. Adv. Water Sci. 2013, 24, 177–183. (In Chinese) [Google Scholar] [CrossRef]
  7. Li, F.; Zhang, G.; Xu, Y.J. Spatiotemporal variability of climate and streamflow in the Songhua River Basin, northeast China. J. Hydrol. 2014, 514, 53–64. [Google Scholar] [CrossRef]
  8. Guse, B.; Kail, J.; Radinger, J.; Schroder, M.; Kiesel, J.; Hering, D.; Wolter, C.; Fohrer, N. Eco-hydrologic model cascades: Simulating land use and climate change impacts on hydrology, hydraulics and habitats for fish and macroinvertebrates. Sci. Total Environ. 2015, 533, 542–556. [Google Scholar] [CrossRef]
  9. Liu, X.-F.; Ren, L.; Yuan, F.; Singh, V.; Fang, X.; Yu, Z.; Zhang, W. Quantifying the effect of land use and land cover changes on green water and blue water in northern part of China. Hydrol. Earth Syst. Sci. 2009, 13, 735–747. [Google Scholar] [CrossRef] [Green Version]
  10. Putro, B.; Kjeldsen, T.R.; Hutchins, M.G.; Miller, J. An empirical investigation of climate and land-use effects on water quantity and quality in two urbanising catchments in the southern United Kingdom. Sci. Total Environ. 2016, 548–549, 164–172. [Google Scholar] [CrossRef] [PubMed] [Green Version]
  11. Serpa, D.; Nunes, J.; Santos, J.; Sampaio, E.; Jacinto, R.; Veiga, S.; Lima, J.; Moreira, M.; Corte-Real, J.; Keizer, J. Impacts of climate and land use changes on the hydrological and erosion processes of two contrasting Mediterranean catchments. Sci. Total Environ. 2015, 538, 64–77. [Google Scholar] [CrossRef] [PubMed] [Green Version]
  12. Trang, N.T.T.; Shrestha, S.; Shrestha, M.; Datta, A.; Kawasaki, A. Evaluating the impacts of climate and land-use change on the hydrology and nutrient yield in a transboundary river basin: A case study in the 3S River Basin (Sekong, Sesan, and Srepok). Sci. Total Environ. 2017, 576, 586–598. [Google Scholar] [CrossRef] [PubMed]
  13. Wang, D.; Hejazi, M. Quantifying the relative contribution of the climate and direct human impacts on mean annual streamflow in the contiguous United States. Water Resour. Res. 2011, 47. [Google Scholar] [CrossRef] [Green Version]
  14. Woldesenbet, T.A.; Elagib, N.A.; Ribbe, L.; Heinrich, J. Hydrological responses to land use/cover changes in the source region of the Upper Blue Nile Basin, Ethiopia. Sci. Total Environ. 2017, 575, 724–741. [Google Scholar] [CrossRef] [PubMed]
  15. Xu, Z. Hydrological models: Past, Present and Future. J. Beijing Norm. Univ. (Nat. Sci.) 2010, 46, 278–289. (In Chinese) [Google Scholar]
  16. Zhang, A.J.; Zhang, C.; Chu, J.G.; Fu, G.B. Human-Induced Runoff Change in Northeast China. J. Hydrol. Eng. 2015, 20, 13. [Google Scholar] [CrossRef]
  17. Dai, C.; Wang, S.; Li, Z.; Zhang, Y.; Gao, Y.; Li, C. Review on hydrological geography in Heilongjiang River Basin. Acta Geogr. Sin. 2015, 70, 1823–1834. (In Chinese) [Google Scholar] [CrossRef]
  18. Yan, B.; Xia, Z.; Huang, F.; Guo, L.; Zhang, X. Climate Change Detection and Annual Extreme Temperature Analysis of the Amur River Basin. Adv. Meteorol. 2016, 2016, 1–14. [Google Scholar] [CrossRef]
  19. Novorotskii, P. Climate changes in the Amur River basin in the last 115 years. Russ. Meteorol. Hydrol. 2007, 32, 102–109. [Google Scholar] [CrossRef]
  20. Ganzei, S.S.; Yermoshin, V.V.; Mishina, N.V. The dynamics of land use within the Amur basin in the 20th century. Geogr. Nat. Res. 2010, 31, 18–24. [Google Scholar] [CrossRef]
  21. Cui, M. Status quo of Wetlands of Heilongjiang River Valley and the Protection. For. Inventory Plan. 2006, 1, 75–78. (In Chinese) [Google Scholar] [CrossRef]
  22. Ismaiylov, G.K.; Fedorov, V. Analysis of long-term variations in the Volga annual runoff. Water Res. 2001, 28, 469–477. [Google Scholar] [CrossRef]
  23. Ogi, M.; Tachibana, Y. Influence of the annual Arctic Oscillation on the negative correlation between Okhotsk Sea ice and Amur River discharge. Geophys. Res. Lett. 2006, 33. [Google Scholar] [CrossRef] [Green Version]
  24. Haruyama, S.; Shiraiwa, T. Environmental Change and the Social Response in the Amur River Basin; Springer: Berlin/Heidelberg, Germany, 2014; Volume 5. [Google Scholar]
  25. Wei, Z.; Jin, H.J.; Zhang, J.M.; Yu, S.P.; Han, X.J.; Ji, Y.J.; He, R.X.; Chang, X.L. Prediction of permafrost changes in Northeastern China under a changing climate. Sci. China-Earth Sci. 2011, 54, 924–935. [Google Scholar] [CrossRef]
  26. Chu, H.; Venevsky, S.; Wu, C.; Wang, M. NDVI-based vegetation dynamics and its response to climate changes at Amur-Heilongjiang River Basin from 1982 to 2015. Sci. Total Environ. 2019, 650, 2051–2062. [Google Scholar] [CrossRef] [PubMed]
  27. Pan, X.F.; Yan, B.X.; Muneoki, Y. Effects of land use and changes in cover on the transformation and transportation of iron: A case study of the Sanjiang Plain, Northeast China. Sci. China-Earth Sci. 2011, 54, 686–693. [Google Scholar] [CrossRef]
  28. Wang, X.W.; Zhu, Y.; Chen, Y.N.; Zheng, H.L.; Liu, H.N.; Huang, H.B.; Liu, K.; Liu, L. Influences of forest on MODIS snow cover mapping and snow variations in the Amur River basin in Northeast Asia during 2000–2014. Hydrol. Process. 2017, 31, 3225–3241. [Google Scholar] [CrossRef]
  29. Zou, Y.C.; Wang, L.Y.; Xue, Z.S.; E, M.J.; Jiang, M.; Lu, X.G.; Yang, S.D.; Shen, X.J.; Liu, Z.M.; Sun, G.Z.; et al. Impacts of Agricultural and Reclamation Practices on Wetlands in the Amur River Basin, Northeastern China. Wetlands 2018, 38, 383–389. [Google Scholar] [CrossRef]
  30. Mokhov, I.I. Hydrological anomalies and tendencies of change in the basin of the Amur River under global warming. Dokl. Earth Sci. 2014, 455, 459–462. [Google Scholar] [CrossRef]
  31. Chen, H.; Zhang, W.C.; Shalamzari, M.J. Remote detection of human-induced evapotranspiration in a regional system experiencing increased anthropogenic demands and extreme climatic variability. Int. J. Remote. Sens. 2019, 40, 1887–1908. [Google Scholar] [CrossRef]
  32. Mu, X.M.; Li, Y.; Gao, P.; Shao, H.B.; Wang, F. The Runoff Declining Process and Water Quality in Songhuajiang River Catchment, China under Global Climatic Change. Clean-Soil Air Water 2012, 40, 394–401. [Google Scholar] [CrossRef]
  33. Luan, Z.; Cao, H.; Zhou, D.; Deng, W. Impact of Human Activities on the Hydrological Regime of Bielahong River Watershed. Wetl. Sci. 2008, 6, 258–263. (In Chinese) [Google Scholar]
  34. Leavesley, G.H. Modeling the Effects of Climate Change on Water resources—A Review. In Assessing the Impacts of Climate Change on Natural Resource Systems; Frederick, K.D., Rosenberg, N.J., Eds.; Springer: Dordrecht, The Netherlands, 1994; pp. 159–177. [Google Scholar]
  35. Licciardello, F.; Toscano, A.; Cirelli, G.L.; Consoli, S.; Barbagallo, S. Evaluation of sediment deposition in a Mediterranean reservoir: Comparison of long term bathymetric measurements and SWAT estimations. Land Degrad. Dev. 2017, 28, 566–578. [Google Scholar] [CrossRef]
  36. Montecelos-Zamora, Y.; Cavazos, T.; Kretzschmar, T.; Vivoni, E.R.; Corzo, G.; Molina-Navarro, E. Hydrological Modeling of Climate Change Impacts in a Tropical River Basin: A Case Study of the Cauto River, Cuba. Water 2018, 10, 1135. [Google Scholar] [CrossRef] [Green Version]
  37. Nilawar, A.P.; Waikar, M.L. Impacts of climate change on streamflow and sediment concentration under RCP 4.5 and 8.5: A case study in Purna river basin, India. Sci. Total Environ. 2019, 650, 2685–2696. [Google Scholar] [CrossRef]
  38. Jothityangkoon, C.; Sivapalan, M.; Farmer, D.L. Process controls of water balance variability in a large semi-arid catchment: Downward approach to hydrological model development. J. Hydrol. 2001, 254, 174–198. [Google Scholar] [CrossRef]
  39. Mourato, S.; Moreira, M.; Corte-Real, J. Water Resources Impact Assessment Under Climate Change Scenarios in Mediterranean Watersheds. Water Resour. Manag. 2015, 29, 2377–2391. [Google Scholar] [CrossRef]
  40. López-Moreno, J.I.; Zabalza, J.; Vicente-Serrano, S.M.; Revuelto, J.; Gilaberte, M.; Azorin-Molina, C.; Morán-Tejeda, E.; García-Ruiz, J.M.; Tague, C. Impact of climate and land use change on water availability and reservoir management: Scenarios in the Upper Aragón River, Spanish Pyrenees. Sci. Total Environ. 2014, 493, 1222–1231. [Google Scholar] [CrossRef] [Green Version]
  41. Zhou, H.; Lin, B.R.; Qi, J.Q.; Zheng, L.H.; Zhang, Z.C. Analysis of correlation between actual heating energy consumption and building physics, heating system, and room position using data mining approach. Energy Build. 2018, 166, 73–82. [Google Scholar] [CrossRef]
  42. Blöschl, G.; Ardoin-Bardin, S.; Bonell, M.; Dorninger, M.; Goodrich, D.; Gutknecht, D.; Matamoros, D.; Merz, B.; Shand, P.; Szolgay, J. At what scales do climate variability and land cover change impact on flooding and low flows? Hydrol. Process. 2007, 21, 1241–1247. [Google Scholar] [CrossRef]
  43. Zhang, T.; Zhang, X.N.; Xia, D.Z.; Liu, Y.Y. An Analysis of Land Use Change Dynamics and Its Impacts on Hydrological Processes in the Jialing River Basin. Water 2014, 6, 3758–3782. [Google Scholar] [CrossRef] [Green Version]
  44. Nie, W.M.; Yuan, Y.P.; Kepner, W.; Nash, M.S.; Jackson, M.; Erickson, C. Assessing impacts of Landuse and Landcover changes on hydrology for the upper San Pedro watershed. J. Hydrol. 2011, 407, 105–114. [Google Scholar] [CrossRef]
  45. Gyamfi, C.; Ndambuki, J.; Salim, R. Hydrological Responses to Land Use/Cover Changes in the Olifants Basin, South Africa. Water 2016, 8, 588. [Google Scholar] [CrossRef]
  46. Simonov, E.A.; Dahmer, T.D. Amur-Heilong River Basin Reader; Ecosystems Hong Kong: Hong Kong, China, 2008. [Google Scholar]
  47. Yu, H.; Yao, F. The current situation of the use right transfer of the “five wastes” resources and the consideration of the next work-the audit Investigation on the auctions of “five wastes” in Heihe City. Heihe J. 1996, 1, 38–40. (In Chinese) [Google Scholar] [CrossRef]
  48. Yu, H.; Yang, Y.; Wang, J. Auction development and management of “five wastes”-rational use of water and land resources. Water Res. Hydropower Northeast. China 1996, 12, 32–34. (In Chinese) [Google Scholar] [CrossRef]
  49. Song, K.; Wang, Z.; Liu, Q.; Liu, D.; Ermoshin, V.V.; Ganzei, S.S.; Zhang, B.; Ren, C.; Zeng, L.; Du, J. Land use/land cover (LULC) classification with MODIS time series data and validation in the Amur River Basin. Geogr. Nat. Res. 2011, 32, 9–15. [Google Scholar] [CrossRef]
  50. Zhang, K.; Kimball, J.S.; Nemani, R.R.; Running, S.W. A continuous satellite-derived global record of land surface evapotranspiration from 1983 to 2006. Water Resour. Res. 2010, 46. [Google Scholar] [CrossRef] [Green Version]
  51. Mu, Q.Z.; Zhao, M.S.; Running, S.W. Improvements to a MODIS global terrestrial evapotranspiration algorithm. Remote. Sens. Environ. 2011, 115, 1781–1800. [Google Scholar] [CrossRef]
  52. Xie, H.; Longuevergne, L.; Ringler, C.; Scanlon, B.R. Calibration and evaluation of a semi-distributed watershed model of Sub-Saharan Africa using GRACE data. Hydrol. Earth Syst. Sci. 2012, 16, 3083–3099. [Google Scholar] [CrossRef] [Green Version]
  53. Schmidt, R.; Schwintzer, P.; Flechtner, F.; Reigber, C.; Guntner, A.; Doll, P.; Ramillien, G.; Cazenave, A.; Petrovic, S.; Jochmann, H.; et al. GRACE observations of changes in continental water storage. Glob. Planet. Chang. 2006, 50, 112–126. [Google Scholar] [CrossRef]
  54. Tapley, B.D.; Bettadpur, S.; Ries, J.C.; Thompson, P.F.; Watkins, M.M. GRACE measurements of mass variability in the Earth system. Science 2004, 305, 503–505. [Google Scholar] [CrossRef] [PubMed] [Green Version]
  55. Güntner, A. Improvement of Global Hydrological Models Using GRACE Data. Surv. Geophys. 2008, 29, 375–397. [Google Scholar] [CrossRef] [Green Version]
  56. Immerzeel, W.W.; Droogers, P. Calibration of a distributed hydrological model based on satellite evapotranspiration. J. Hydrol. 2008, 349, 411–424. [Google Scholar] [CrossRef]
  57. Houser, P.R.; Shuttleworth, W.J.; Famiglietti, J.S.; Gupta, H.V.; Syed, K.H.; Goodrich, D.C. Integration of soil moisture remote sensing and hydrologic modeling using data assimilation. Water Resour. Res. 1998, 34, 3405–3420. [Google Scholar] [CrossRef] [Green Version]
  58. Boegh, E.; Thorsen, M.; Butts, M.B.; Hansen, S.; Christiansen, J.S.; Abrahamsen, P.; Hasager, C.B.; Jensen, N.O.; van der Keur, P.; Refsgaard, J.C.; et al. Incorporating remote sensing data in physically based distributed agro-hydrological modelling. J. Hydrol. 2004, 287, 279–299. [Google Scholar] [CrossRef]
  59. Isenstein, E.M.; Wi, S.; Yang, Y.C.E.; Brown, C. Calibration of a Distributed Hydrologic Model Using Streamflow and Remote Sensing Snow Data. In Proceedings of the World Environmental and Water Resources Congress 2015: Floods, Droughts, and Ecosystems, Austin, TX, USA, 17–21 May 2015; pp. 973–982. [Google Scholar]
  60. Sun, W.C.; Ishidaira, H.; Bastola, S. Calibration of hydrological models in ungauged basins based on satellite radar altimetry observations of river water level. Hydrol. Process. 2012, 26, 3524–3537. [Google Scholar] [CrossRef]
  61. Cao, Y.; Nan, Z. Applications of GRACE in Hydrology: A Review. Remote. Sens. Technol. Appl. 2011, 26, 543–553. (In Chinese) [Google Scholar]
  62. Swenson, S.; Wahr, J. Post-processing removal of correlated errors in GRACE data. Geophys. Res. Lett. 2006, 33. [Google Scholar] [CrossRef]
  63. Landerer, F.W.; Swenson, S.C. Accuracy of scaled GRACE terrestrial water storage estimates. Water Resour. Res. 2012, 48. [Google Scholar] [CrossRef]
  64. Mann, H.B. Nonparametric Tests Against Trend. Econometrica 1945, 13, 245–259. [Google Scholar] [CrossRef]
  65. Sneyers, R. Sur L’analyse Statistique des Séries D’observations; Secrétariat de L’Organisation Météorologique Mondiale: Geneva, Switzerland, 1975. [Google Scholar]
  66. Yang, Y.; Tian, F. Abrupt change of runoff and its major driving factors in Haihe River Catchment, China. J. Hydrol. 2009, 374, 373–383. [Google Scholar] [CrossRef]
  67. Moraes, J.M.; Pellegrino, G.Q.; Ballester, M.V.; Martinelli, L.A.; Victoria, R.L.; Krusche, A.V. Trends in Hydrological Parameters of a Southern Brazilian Watershed and its Relation to Human Induced Changes. Water Resour. Manag. 1998, 12, 295–311. [Google Scholar] [CrossRef]
  68. Gerstengarbe, F.W.; Werner, P.C. Estimation of the beginning and end of recurrent events within a climate regime. Clim. Res. 1999, 11, 97–107. [Google Scholar] [CrossRef] [Green Version]
  69. Arnold, J.G.; Srinivasan, R.; Muttiah, R.S.; Williams, J.R. Large area hydrologic modeling and assessment Part I: Model development. J. Am. Water Resour. Assoc. 1998, 34, 73–89. [Google Scholar] [CrossRef]
  70. Du, J.K.; Rui, H.Y.; Zuo, T.H.; Li, Q.; Zheng, D.P.; Chen, A.L.; Xu, Y.P.; Xu, C.Y. Hydrological Simulation by SWAT Model with Fixed and Varied Parameterization Approaches Under Land Use Change. Water Resour. Manag. 2013, 27, 2823–2838. [Google Scholar] [CrossRef]
  71. Pikounis, M.; Varanou, E.; Baltas, E.; Dassaklis, A.; Mimikou, M. Application of the SWAT model in the Pinios River basin under different land-use scenarios. Glob. Nest Int. J. 2003, 5, 71–79. [Google Scholar]
  72. Wu, K.; Johnston, C.A. Hydrologic response to climatic variability in a Great Lakes Watershed: A case study with the SWAT model. J. Hydrol. 2007, 337, 187–199. [Google Scholar] [CrossRef]
  73. Abbaspour, K.C.; Johnson, C.; Van Genuchten, M.T. Estimating uncertain flow and transport parameters using a sequential uncertainty fitting procedure. Vadose Zone J. 2004, 3, 1340–1352. [Google Scholar] [CrossRef]
  74. Abbaspour, K.C.; Yang, J.; Maximov, I.; Siber, R.; Bogner, K.; Mieleitner, J.; Zobrist, J.; Srinivasan, R. Modelling hydrology and water quality in the pre-alpine/alpine Thur watershed using SWAT. J. Hydrol. 2007, 333, 413–430. [Google Scholar] [CrossRef]
  75. Moriasi, D.N.; Arnold, J.G.; Van Liew, M.W.; Bingner, R.L.; Harmel, R.D.; Veith, T.L. Model evaluation guidelines for systematic quantification of accuracy in watershed simulations. Trans. ASABE 2007, 50, 885–900. [Google Scholar] [CrossRef]
  76. Luo, K.S.; Tao, F.L.; Moiwo, J.P.; Xiao, D.P. Attribution of hydrological change in Heihe River Basin to climate and land use change in the past three decades. Sci. Rep. 2016, 6, 12. [Google Scholar] [CrossRef] [PubMed] [Green Version]
  77. Cramer, R.D. Partial Least Squares (PLS): Its strengths and limitations. Perspect. Drug Discov. Des. 1993, 1, 269–278. [Google Scholar] [CrossRef]
  78. Wold, S.; Martens, H.; Wold, H. The multivariate calibration problem in chemistry solved by the PLS method. In Matrix Pencils; Springer: Berlin/Heidelberg, Germany, 1983; pp. 286–293. [Google Scholar]
  79. Hoerl, A.E.; Kennard, R.W. Ridge Regression: Biased Estimation for Nonorthogonal Problems. Technometrics 1970, 12, 55–67. [Google Scholar] [CrossRef]
  80. Hoerl, A.E.; Kennard, R.W. Ridge Regression: Applications to Nonorthogonal Problems. Technometrics 1970, 12, 69–82. [Google Scholar] [CrossRef]
  81. Figueiredo Filho, D.B.; Júnior, J.A.S.; Rocha, E.C. What is R2 all about? Leviathan (São Paulo) 2011, 3, 60–68. [Google Scholar] [CrossRef] [Green Version]
  82. Heinzl, H.; Mittlböck, M. Adjusted R2 Measures for the Inverse Gaussian Regression Model. Comput. Stat. 2002, 17, 525–544. [Google Scholar] [CrossRef]
Figure 1. The geographic location of the study region (the Amur River Basin) showing the meteorological and hydrometric stations used in this study.
Water 12 00076 g001
Figure 2. Flowchart of the modeling work.
Water 12 00076 g002
Figure 3. Model performance for discharge for the calibration and validation periods at (a) Komsomolsk station, (b) Jiamusi station, and (c) Jiangqiao station.
Water 12 00076 g003
Figure 4. Model performance for the evapotranspiration (ET) data estimated from advanced very high-resolution radiometer (AVHRR), moderate resolution imaging spectroradiometer (MODIS) (a) and gravity recovery and climate experiment (GRACE) products (b) for the calibration and validation periods.
Water 12 00076 g004
Figure 5. Inter-monthly average total water storage changes (TWSCs) of the study region derived from the SWAT simulation and GRACE products from May 2002 to December 2006.
Water 12 00076 g005
Figure 6. Sequential Mann–Kendall tests for the annual precipitation (a) and average temperature (b) with the forward-trend UFk and backward-trend UBk.
Water 12 00076 g006
Figure 7. Annual precipitation (a) and annual average temperature (b) in the ARB, along with the trends and period averages of these data.
Water 12 00076 g007
Figure 8. Variations in the mean values of eight climatic factors during four periods in the ARB: (a) STA, (b) STM, (c) DS, (d) WTA, (e) WTM, (f) DW, (g) SP and (h) WP.
Water 12 00076 g008
Figure 9. Land-use maps of the study region for each period and land-use transfer ratios of crops and wetlands between periods: (a) land-use maps and (b) land-use transfer ratios.
Water 12 00076 g009
Figure 10. Analysis of the annual mean runoff responses of the ARB at different hydrometric stations.
Water 12 00076 g010
Figure 11. Comparison of the runoff process at three hydrometric stations in the ARB under the impacts of climate changes between the periods before and after 2000: (a) Komsomolsk station, (b) Jiamusi station, and (c) Jiangqiao station.
Water 12 00076 g011
Figure 12. Comparison of the runoff process at Komsomolsk station under the impacts of land-use change: (a) 1991–1999, (b) 2000–2006, and (c) 2007–2013.
Water 12 00076 g012
Figure 13. Response analysis of five hydrological variables in the ARB.
Water 12 00076 g013
Figure 14. Comparison of the surface runoff in the ARB under different simulation scenarios: (a) Surface runoff under the impacts of climate change, (b) surface runoff under the impacts of land-use change.
Water 12 00076 g014
Figure 15. Comparison of the groundwater flow in the ARB under different simulation scenarios: (a) Groundwater flow under the impacts of climate change, and (b) groundwater flow under the impacts of land-use change.
Water 12 00076 g015
Table 1. Soil and water assessment tool (SWAT) model input data for the Amur River Basin (ARB).
Data TypeDescriptionSource
Land-useChinese land-use map (1980, 1995, 2005, and 2010) and global land-use map (1992–1993, 2000, 2005, and 2010)Chinese land-use maps from Resource and Environment Data Cloud Platform;
MODIS land cover type product from U.S. Geological Survey (USGS);
Global Land Cover Characterization (GLCC) from USGS;
and Global Land Cover 2000 database (GLC2000) from Joint Research Centre, European Commission
SoilSoil map linked to harmonized soil property data-30 arc secondsHarmonized World Soil Database (HWSD) from the Food and Agriculture Organization (FAO)
ClimateDaily precipitation, temperature, solar radiation, relative humidity, and wind speed from 1977 to 2013China Meteorological Data Network (CMA) and NOAA’s National Centers for Environmental Information (NCEI)
TopographyDigital elevation model-30 arc secondsGlobal 30 arc-second elevation (GTOPO30) from USGS
HydrologyRiver network and river basin boundaryHydrological data and maps based on Shuttle Elevation Derivatives at multiple Scales (HydroSHEDS) and Global Change Research Data Publishing and Repository
Table 2. Detailed information about the seven simulated scenarios used in this study.
ScenariosLand-UseModel ParametersClimate Data
No. 11980–19901980–19901980–1990
No. 21980–19901980–19901991–1999
No. 31991–19991991–19991991–1999
No. 41991–19991991–19992000–2006
No. 52000–20062000–20062000–2006
No. 62000–20062000–20062007–2013
No. 72007–20132007–20132007–2013
Table 3. Variables in the ridge equation for climatic factors.
Dependent VariablesStandardized Beta CoefficientR2Adjusted R2Sig
SPWTMSTMWPSTAWTADWDS
SurQ0.8000.1850.1120.0050.330−0.1010.023−0.1860.8330.7770.000
GWQ0.5421.3530.008−0.0970.419−0.7960.305−0.0130.7230.6310.000
LATQ0.7851.060−0.159−0.0050.316−0.7650.0090.3810.7030.6040.000
Table 4. Summary of the partial least squares regression (PLSR) model for climatic factors.
Latent FactorsY VarianceR2Adjusted R2
10.3470.3470.326
20.2760.6220.597
30.0470.6690.635
40.0280.6980.654
50.0080.7060.651
NOTE: LF: Latent Factor.
Table 5. Variable importance in the projection (VIP) values and beta coefficients of climatic factors in the PLSR analysis.
Independent VariablesBeta CoefficientVIP
SurQGWQLATQModelLF 1LF 2LF 3LF 4LF 5
SP0.05220.01480.00051.63612.15312.26652.21202.18732.1750
WTM0.33710.31210.00520.84041.01880.77600.77380.79140.7916
STM0.69840.42130.01060.95320.33090.85490.84360.83270.8295
WP0.0223−0.0356−0.00100.92100.96260.96941.05131.07271.0717
STA2.63511.16450.03091.10370.08231.19421.19301.16961.1659
WTA−0.15080.1909−0.00070.80900.76820.61560.59460.63560.6401
DW0.11020.1776−0.01530.52820.13230.17210.41190.41770.4677
DS−1.0021−0.1794−0.00100.84200.82190.65860.63700.65170.6525
NOTE: LF: Latent Factor.
Table 6. Variables in the ridge equation for land-use changes.
Dependent VariablesStandardized Beta CoefficientR2Adjusted R2Sig
ForestPastureWetlandCropResidentialWaterRange
SurQ0.3990.021−0.202−0.375−0.088−0.6100.1070.9810.9750.000
GWQ−0.363−0.144−0.2130.4960.4330.881−0.1700.9270.9060.000
LATQ−0.391−0.002−0.2320.3760.5291.5630.0320.9680.9590.000
Table 7. Summary of the PLSR model for land-use changes.
Latent FactorsY VarianceR2Adjusted R2
10.6410.6410.630
20.1750.8160.804
30.0770.8930.882
40.0570.9500.943
50.0260.9760.972
Table 8. VIP values and beta coefficients of the land-use PLSR analysis.
Independent VariablesBeta CoefficientVIP
SurQGWQLATQModelLF 1LF 2LF 3LF 4LF 5
Forest0.0253−0.0119−0.00010.88220.67001.03000.99000.97000.9600
Pasture−0.00510.00100.00001.03081.11000.99000.97000.98000.9700
Wetland−0.0554−0.0496−0.00041.08191.19001.06001.10001.09001.0800
Crop−0.02110.01260.00011.25331.34001.52001.46001.41001.4000
Residential−0.65051.15490.01340.79050.66000.71000.76000.82000.8100
Water−0.99110.79570.01181.03791.02000.91001.00001.14001.1800
Range0.1524−0.16380.00290.84600.79000.72000.69000.74000.7700

