Article

Willingness to Pay for Enhanced Water Security in a Rapidly Developing Shale Gas Region in China

1
School of Business and Administration, Chongqing University of Science and Technology, Chongqing 401301, China
2
Chongqing Energy Economy Research Center, Chongqing 401301, China
3
Department of Research & Development, Shaanxi Haudi Investigation Design & Consulting Company, Xi’an 710000, China
4
Scenic Area Administrative Committee of Wuwei, Guzang Road, Liangzhou District, Wuwei 733000, China
*
Author to whom correspondence should be addressed.
Water 2019, 11(9), 1888; https://doi.org/10.3390/w11091888
Submission received: 9 August 2019 / Revised: 6 September 2019 / Accepted: 6 September 2019 / Published: 11 September 2019
(This article belongs to the Section Water, Agriculture and Aquaculture)

Abstract

:
With the rapid development of shale gas exploration (SGE) in China, there is an urgent need to evaluate the public’s preferences with respect to the environmental risks that go along with the exploration, which have not yet been studied in the literature. This study aims to estimate local residents’ willingness to pay (WTP) for a water security-enhanced scenario in the Fuling shale gas field, Chongqing, China. Using the double-bounded contingent valuation method, we estimate that the annual mean WTP is 32.655 Chinese yuan per year per household, which accounts for 3.80% of the basic household gas bill. The results also show that WTP is significantly influenced by the socio-economic characteristics of the respondents, including the age of the respondent, household location, household income, and primary source of household income. Moreover, the respondents’ satisfaction with respect to the environmental impacts caused by SGE also has negative influences on the WTP. Thus, our analysis estimates the affected public’s benefits during SGE and provides insight into the relevant policymaking process.

1. Introduction

With technological advances in horizontal drilling and hydraulic fracturing, shale gas has become an economically appealing source of fossil fuel to satisfy the world’s increasing demand for energy. The exploration and utilization of shale gas not only contribute to the economic growth by creating employment opportunities, increasing tax revenues, and reducing energy costs [1,2], but also benefit the environment by reducing carbon emissions and other atmospheric contaminants from other fuel substitutions [1]. Endowed with abundant reserves [3], China has made ambitious plans to boost its shale gas exploration (SGE) since 2014, when China became the third country to successfully achieve commercial exploitation after the United States and Canada. From 2014 to 2019, China has made great progress in maintaining continued growth in gas yield, rig counts, and drilling efficiency [4]. With reasonable and efficient exploitation, China’s SGE will make a positive contribution towards coping with the nation’s increasingly challenging environmental problems, as well as achieving its energy sustainability goals.
Along with the benefits to the society generated by SGE, there are growing concerns over the associated environmental hazards to local residents living close to the development areas. With the global development of the shale gas industry, a large number of studies have reported local residents’ perceived health and safety risks posed by SGE, including air pollution, noise pollution, ecosystem degradation, geologic hazards, water shortages, and water contamination [5,6,7,8,9,10]. Among the above-mentioned environmental concerns, SGE’s impact on water security, including water quality and quantity, has emerged as the most extensively discussed and researched issue [1,11,12], and is also the main reason for many local residents being opposed to the SGE [13,14]. The large amount of water consumed by the hydraulic fracturing process of SGE will put a strain on local water supply. Particularly in water-stressed and groundwater-depleted areas, water used for SGE, typically withdrawn from nearby rivers or municipal sources, may cause production losses in irrigated agriculture and interruptions in domestic water supply [11]. Moreover, large volumes of wastewater generated by SGE, including flow-back water after hydraulic fracturing and produced water during gas production [15], add to the challenges of satisfying environmental regulations and community desires. Considering the very highly saline and toxic wastewater, wastewater management, through disposal by the public sewerage system, pumping into injection wells, or reuse as fracturing fluid [16], has raised considerable concerns from the public, social media, and government officials.
Considering the formidable water-related challenges posed by SGE, sustainable ways to alleviate these challenges are still the dominant issue debated in the literature. Based on a brief description of the SGE’s detrimental impact on surface and groundwater, Kulander [17] discussed the trends of government regulations regarding groundwater and surface water in general, as well as in particular states. By examining in several cases in Taxes, Majumdar [18] emphasized the importance of community actions in alleviating the water-related concerns caused by SGE. Holding et al. [4] summarized the regulatory framework and various management tools for enhancing water security in a water-energy nexus. Arscott et al. [19] demonstrated the use of “smart” technologies in water management to achieve multiple objectives of water use in SGE areas. Taking the US Marcellus Shale exploration region as the study area, Rahm and Riha [20] reviewed the policies and practices in managing water resources during SGE and proposed adaptive management as a way to bridge the differences in stakeholder considerations and values. In addition to the experts’ opinions, local residents’ perceived water-related risks have also been discussed in the literature analysing SGE’s impacts. For example, Thomas et al. [11] systematically reviewed 51 research articles of SGE in the United States and Canada, and found that public’s risk perceptions were related to their experience with shale development and demographic factors. Yu et al. [2] investigated public’s perceived environmental risks in China’s Sichuan Basin, and indicated that a better understanding of indigenous knowledge would be an effective way for governments to mitigate the risks and conflicts caused by SGE. Israel et al. [21] gathered the concerns from interested and affected parties from the United States to help better govern the related risks in shale gas development.
Despite the abundant literature dealing with water-related risks, few studies have focused on the benefits of enhancing water security in SGE areas. In practice, water management typically accounts for 5–15% of the overall costs of SGE [15], and a proactive water management strategy may raise costs and impede the rapid growth in production. For instance, studies by Karapataki [22] and Acharya et al. [23] demonstrated there would be a trade-off between treatment cost and water recovery regarding the technology used for water management. Thus, a major underlying issue seems to be a lack of valuation of the welfare gains from enhancing water security strategies to facilitate the cost-effectiveness analysis in the decision-making process. With respect to the benefits of water security-enhanced scenarios, only one study can be found in the literature, that by Bernstein et al. [24] evaluating the rive safety amenities in the context of Marcellus SGE areas. They conducted a contingent valuation (CV) survey to elicit residents’ willingness to pay (WTP) for eliminating watershed risks posed by SGE. The estimation results were US $ 12.00 per month per household on average and a present value of US $ 178.25 due in 25 years. However, their study can be improved in at least two aspects. One is the questionnaire, which in addition to the CV questions also inquired about respondents’ WTP for improved river access, possibly distorting the WTP estimates for improved river safety during SGE. Another is the small sample size (186 valley residents) in a relatively large watershed, which decreased the statistical power of their estimations. Besides, the prospect of SGE in China requires effective decisions on the appropriate goals for environmental management, and the public’s preferences for enhancing water security during SGE have not yet been studied in China. Thus, the public’s WTP for enhancing water security should be investigated to reflect the public opinions towards SGE, and to aid the cost-effectiveness analysis for making appropriate management decisions. There are numerous CV studies on the valuation of water quality and quantity management. One of the most prominent uses of CV in water management assessments is shown by Bishop et al. [25] who centred the valuation question on the value of recreation compared to hydropower supply. Several studies [26,27,28] systematically reviewed the use of CV in valuing water quality improvement, and other studies [29,30] found that water quantity also played a significant role in the WTP estimate. These and other CV studies not only prove the importance of water quality and quantity improvements for social welfare, but also defend the validity of using CV as a tool for the economic valuation of water.
In this practical and academic context, the purpose of this study is, therefore, to fill the research gap by investigating local residents’ WTP for enhancing water security in the Fuling shale gas field (FSGF), which is China’s first and largest SGE field, and thus to provide a practical basis for the government’s administration on the water risks posed by SGE. How many benefits can be derived from water security enhancement policies in the FSGF? What are the influencing factors of households’ WTP for water security enhancement policies? These research questions are of importance to policymaking but have not attracted much attention in the SGE literature. Using the CV method in the double-bounded dichotomous format, this study addresses the importance of investigating the public’s preferences in a rapidly developing SGE area. The remainder of this study has been organized as follows. Section 2 describes the current status of SGE in our study area, the Fuling shale gas field (FSGF). Section 3 presents the methodology framework, including the questionnaire development and the econometric specification in this study. The empirical results are reported in Section 4, and Section 5 concludes the paper.

2. Shale Gas Exploration in the FSGF

This study has chosen the Fuling shale gas field (FSGF), located mainly in the Fuling District, Nanchuan District and Wulong County, Chongqing municipality, southwest China, as our study area. This gas field is of particular interest, as it is the most iconic area in China’s SGE history. China’s first high-yield shale gas well, the Jiaoye-1H well discovered in 2012, was located in FSGF. The FSGF was China’s first commercialized large-scale SGE field, and also developed into a national demonstration area of SGE. Thus, the shale gas development in FSGF will represent the progress and achievements of SGE in China, and the study conducted in FSGF will also be representative for further SGE management.
The FSGF belongs to the eastern Sichuan Basin and is characterized by the high-quality marine shale gas with total proven reserves of 2.1 trillion cubic meters [31]. This area produced 6.02 billion cubic meters of gas in 2018, accounting for 55.3% of the nation’s total output. Since the shale gas was first discovered in 2012 in the FSGF, over 300 producing wells have been drilled, producing over 21 billion cubic meters of gas. In the long run, SGE is planned to continue in the FSGF, increasing its output. With the development, environmental side-effects in the FSGF have gradually become the public’s concern, especially with respect to the impacts on water resources. During the hydraulic fracturing operations, a large amount of water, ranging from 20,000 to 40,000 cubic meters per well [32], has been consumed, thereby intensifying the water competition among different stakeholders. In addition, large volumes of flow-back water and produced water, which dissolve elements detrimental to health, have been generated after fracturing, and the discharge of the pollutants in these wastewaters has raised local residents’ concern. It has been reported that about half (50%) of the total volumes of wastewater has been recycled for fracturing [33]. Another problem is that without effective monitoring of water resources surrounding the exploration field, it will be impossible to aid in water management for regulations, guidelines, and best practices. During the last five years, over 20 water pollution incidents involving a diesel- or milky-like smell were reported around the FSGF, and the test results indicated that the levels of anionic detergents badly exceeded the national standard [34].
Along with the rapid development of and increasing water-related risks posed by SGE, the FSGF government has decided to actively protect local water resources during exploration [33]. However, there is relatively little knowledge of local residents’ preferences for the forthcoming environmental management of SGE. As the FSGF is a densely populated area, it is most certainly of vital importance to understand the public’s preferences and for the public to be fully engaged in the debate about the formulations of relevant policies on shale gas development.

3. Methodology Framework

A variety of economic methods has been applied in valuing environmental preferences, including cost-based methods, revealed preference methods, and stated preference methods. Compared with other methods, stated preference methods, including contingent valuation (CV) and the choice experiment, are the only available techniques that can be used in non-use valuation [35]. Considering the significant proportion of non-use value, such as the bequest and existence value generated from water security enhancement activities, stated preference methods would be more appropriate for this study. In addition, we applied the CV method because it is considered more straightforward for recognition by less-educated respondents compared with the choice experiment [36], and thus is appropriate to be conducted in our studied area, with the majority proportion residents being rural.
This study adopted the double-bounded dichotomous choice (DBDC) format of the CV method. The DBDC format refers to two sequential dichotomous choice questions in which the respondents can identify their WTP by giving a binary response of a yes or no answer. The DBDC, unlike the single-bounded format, includes a follow-up choice question to narrow the range of WTP estimates [37], and thus helps improve the efficiency by reducing the variance [38,39]. In the DBDC format of this study, the respondents were randomly given an initial bid price to avoid the starting-point bias and were asked whether or not they would accept the enhanced water security scenario with the given price. If they answered “yes”, the same question was repeated using a higher bid price and vice versa. Adopting the DBDC format of the CV method, households’ WTP estimations for improved water security can be challengeable due to the unidentified biases and onerous sample selection. These challenges have been addressed in this study and described further as follows.

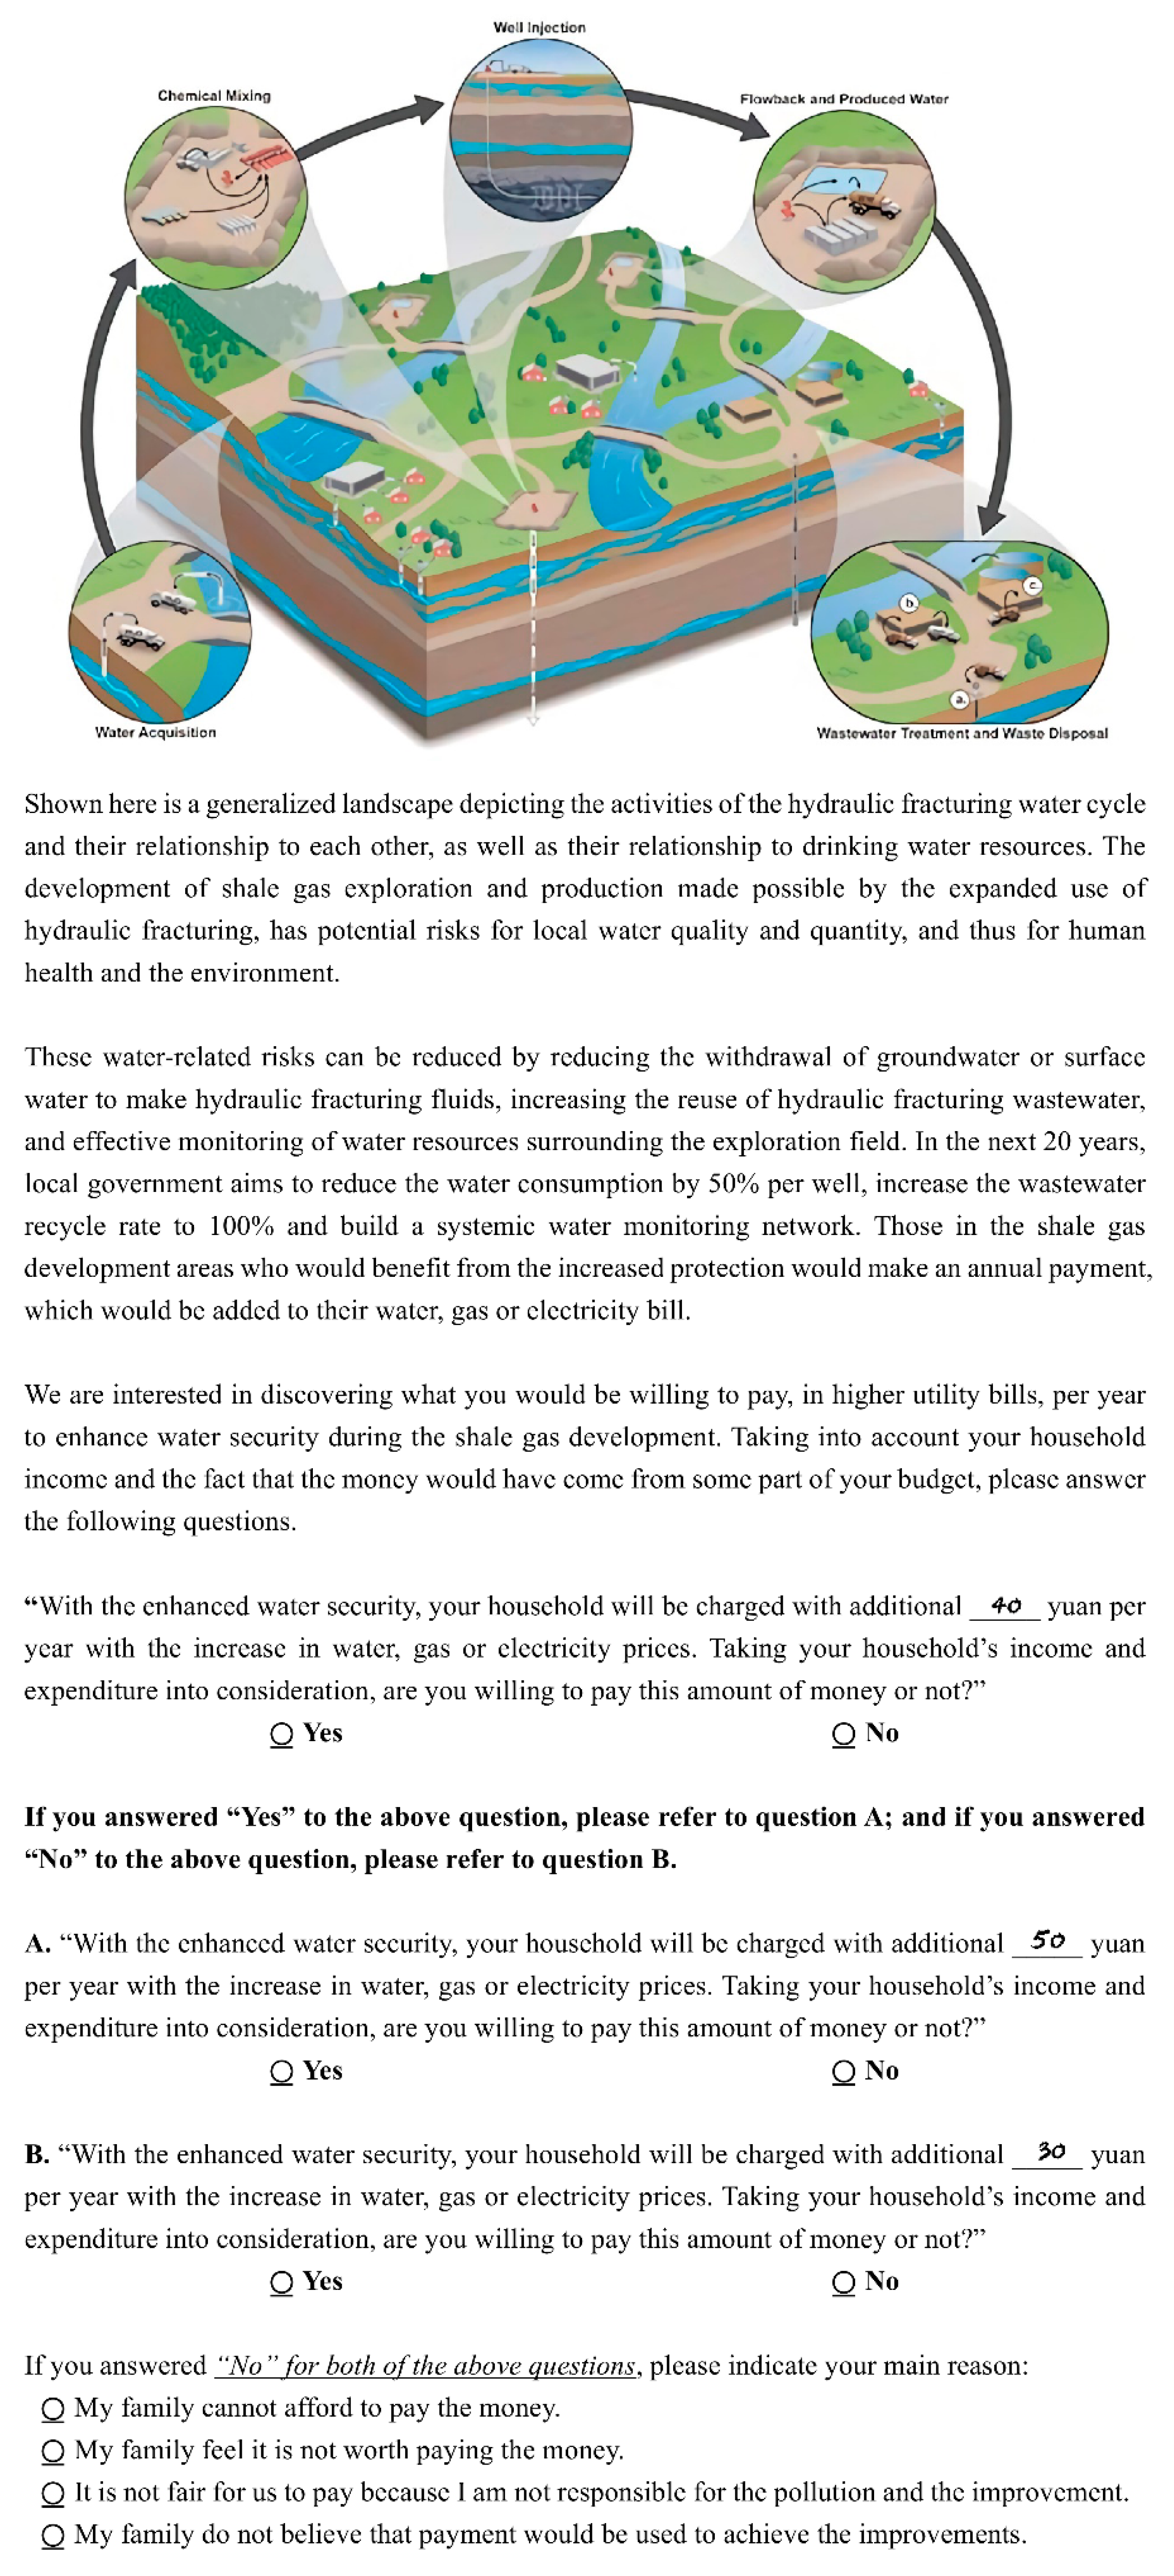
3.1. Questionnaire Development

The survey questionnaire was designed and then tested extensively based on focus groups to evaluate its validity and reliability for evaluating attendant response patterns. A pre-survey was conducted as well to examine the rationality of the bid range of households’ WTP, in addition to the other designed questions. There were three sections of the finalized CV questionnaire. Our CV questionnaire (Appendix A) was a part of a larger project, within which multiple types of analyses and hypothesis tests were proposed. Within this study, only the CV part will be discussed in detail. The first section included introductory “warm-up” questions with the purpose of making our respondents feel comfortable with the interviewers, preparing them for the subsequent WTP questions, including respondents’ perception of the economic, environmental, and social impacts of the SGE. The second part of the questionnaire contained the CV questions and questions reflecting the validity of the DBDC answers. The final section surveyed the socio-economic information of the respondents.
The DBDC format of CV questions in the third section was the core of this study. In order to establish the contingent market, the status quo, management strategies, and specific policy goals were presented in the questionnaire. For example, concerns and risks of the water-related impact from SGE were clustered in the following three aspects as mentioned above: water consumption, wastewater recycling rate, and the water monitoring system. During the survey period, 20,000–40,000 m3 water per well were consumed in SGE, 50% of the wastewater was recycled for fracturing, and a water quality monitoring network was not established in the FSGF. In the future, with technology advancement and government regulation, SGE companies in the FSGF will gradually keep up with the green technology development in the United States [40] and United Kingdom [41], reducing the impact on local water reservoirs in the next 20 years. Thus, the policy goals presented in the questionnaire included: reducing the water consumption by 50% per well, increasing the wastewater recycle rate to 100%, and building a water monitoring network.
To measure households’ WTP, the payment vehicle in this study involved the price increases for water, gas, or electricity bills. Our pre-survey proved that the respondents were familiar with our defined payment vehicle, which was also well-connected with our research purpose [42]. Since we asked each respondent’s dichotomous choices with a specific increase in the household bill, we needed to set the intervals of the bid price. In the DBDC format, the respondent was randomly presented with a bid set, (bidL, bidi, bidH). The second element of each bid set corresponded the initial bid (bidi) given to the respondent, and the respondent would be asked to whether his or her family would pay this price for the water security-enhanced program considering the associated benefits could be derived. The question was a simple yes or no question as follows:
“With the enhanced water security, your household will be charged with additional bidi yuan per year with the increase in water, gas, or electricity prices. Taking your household’s income and expenditure into consideration, are you willing to pay this amount of money or not?”
If the answer was “no”, another question was followed with a higher bid (bidH) which was the first element in the same bid set, and if the answer was “yes”, a lower bid (bidL), the third element in the same bid set, was presented. Based on our pre-study, we set the range of the bid price from 10 to 100 Chinese yuan (6.62 Chinese yuan = 1 US dollar in 2018) per year per household, and the bid sets used in this study were (10, 30, 50), (20, 40, 60), (30, 50, 70), (40, 60, 80), (50, 70, 90), and (60, 80, 100).

3.2. Sampling Method

The sampling area was chosen close to the FSGF. The SGE in FSGF was divided into two development stages: the first stage (stage 1), was the exploration mainly in Jiaoshi town, Luoyun town, and Baitao town from 2013 to 2016, including 268.2 km2 and 194 billion m3 reserves; and the second stage (stage 2), starting from 2015, was the exploration mainly in Pingqiao town, Jiangdong town, Baima town, and Zilichang town, including 291.4 km2 and 239 billion m3 reserves. Thus, we determined four survey towns around shale gas development areas, including Jiaoshi town and Baitao town representing the exploration fields in the first stage, as well as Jiangdong town and Pingqiao town representing the exploration fields in the second stage.
Next, 18 villages were randomly selected from the pre-determined four survey towns; 2–6 villages from each town according to the town population. Subsequently, based on the resident rosters provided by local governments, 50–70 households were randomly selected from each village and the sample size of each village was proportionate to the population size of the village. Thus, a total of 1260 households were selected as our respondents in this study.

3.3. Bias Handling

The survey was conducted using the face-to-face interview which was proved to be able to effectively reduce the non-response bias during the pre-survey. To avoid interviewer bias during the personal interview, the investigators had taken a two-day¡ training class before the survey and were assigned randomly to the respondents. During the investigation, investigators were asked to wear their ID card to address the academic research purposes of the research and introduce the respondents to the underlying conditions of the water-related impacts during SGE, future policies, and design policy goals about the SGE (as mentioned in Section 3.1). This helped reduce the strategic bias, information bias, and hypothetical bias in our study.
Within the questionnaire, we also had debriefing questions to examine the protest zeros after CV questions and to reflect the validity of the whole questionnaire after the interview. The questions to identify protest zeros were presented to ask the respondents’ most likely reason for giving the “no-no” answers to the two dichotomous choice questions. These reasons included: “My family cannot afford to pay the money”, “My family do not feel it is worth paying the money”, “It is not fair for us to pay because I am not responsible for the pollution and the improvement”, and “My family do not believe that payment would be used to achieve the improvements”. The respondents would be identified as protest zeros if they chose the last two choices in this question [43], which signified that they rejected the hypothetical settings in our questionnaire, and these protest zeros would be removed from the analysis. The questionnaire also included the respondents’ comments on their answers by asking whether “your family would actually pay that amount in a real purchase decision”, whether “you understand the contingent questions”, and whether “your answer can represent your family”. Only the respondents who answered “yes” to all these questions would be included for further analysis. Thus, our questionnaire design also reduced the potential biases [44] related to the WTP estimates.

3.4. Model Specification

To model the DBDC format of CV responses, the Hicksian compensating surplus has been adopted using the utility difference approach [45]. The utility of respondent n can be expressed as the observable representative part V, and the unobservable stochastic part ε:
U ( · ) = V n ( q , y , S ) + ε = α q + β y + Γ S + ε
where the q is the specific environmental condition, with q = 0 representing the status quo and q = 1 representing the improved scenario; y denotes the household income, and S is the individual characteristics of the respondent n. If the respondent is willing to pay the bid price A in the dichotomous choice question, we can derive the following utility difference function:
V n ( 1 , y A , S ) V n ( 0 , y , S ) > ε 0 ε 1 ,   or   Δ V n > Δ ε
where Δ V n is the utility increment from the status quo to the improved scenario, and Δ ε has been assumed to follow the Type I extreme value distribution. Thus, the probability that respondent n answers “yes” to the bid price A can be expressed as
Prob n ( y e s ) = 1 1 / { 1 + exp [ β ( α / β A + Γ S / β ) ] } = 1 G ( A )
where α / β and Γ / β are the WTP for general environmental improvement and the WTP variations depending on individual characteristics, respectively.
In the DBDC format, the bid set, (bidL, bidi, bidH) gives four possible outcomes with different probabilities: (1) both answers are “yes” for bidi and bidH, denoted as I i Y Y ; (2) “yes” for bidi while “no” for bidH, denoted as I i Y N ; (3) “no” for bidi while “yes” for bidL, denoted as I i N Y ; (4) both answers are “no” for bidi and bidL, denoted as I i N N . I n is the binary-valued indicator variable. Following Hanemann et al. [39], the parameters β , α / β and Γ / β can be derived by maximising the following log-likelihood function:
ln L = i = 1 N { I n Y Y ln [ 1 G ( b i d u ) ] + I i Y N ln [ G ( b i d u ) G ( b i d l ) ] + I i N Y ln [ G ( b i d l ) G ( b i d u ) ] + I i N N ln [ G ( b i d l ) ]

4. Results and Discussion

4.1. The Sample

Our formal investigation was conducted from July to August 2018. Among the 1260 selected respondents, 371 households failed to complete the questionnaire because nobody was at home during the survey or the household rejected being involved in the survey. Moreover, 65 respondents of the collected questionnaires were further excluded from the analysis as they were protest zeros or low-quality responses as described in the bias handling process. Thus, there were 825 valid questionnaires available for further analysis with the effective rate of 65.48%. The main socio-economic variables used in the modelling process were the respondent’s gender (gender), education level (education), and age (age), as well as the his/her family’s location (location), size (size), average annual per-capita income (income), and primary source of income (source). These and the choice characteristics of the valid sample are summarized in Table 1.
Table 1 shows that most of our respondents were male (88.8%) because our investigators were instructed to survey the head of a household as much as possible to represent the whole family. The average age of our respondents was 47.2, the average education level was low (1.722), and the average household size was 4.405. All these factors correspond with the official statistics [31] and the study of Yu et al. [2], and also reflect the severe ageing problem around the SGE fields, these being mostly rural areas. In total, 57.1% of our respondents were from the stage 1 development area, showing no significant difference with the household proportion of this area (54.1%) from the official statistics [31]. The average per-capita income lay in the range from 9000 to 12,000 Chinese yuan, lower than the official figure of 14,691 Chinese yuan [31], which was probably due to the respondents’ underreporting of their incomes, a common phenomenon in field surveys [46]. About two-thirds of the respondents received their households’ income mainly from off-farm activities brought by the rapid development of industrialisation and urbanisation in FSGF.
As recommended in the literature [2,11,47], the respondents’ evaluation of the environmental impacts was taken into consideration in this study. This was measured from four aspects of the respondents’ satisfaction: the overall environmental conditions (condition), effects of environmental policies (policy), volumes of water consumed by SGE (consumption), and disposal of wastewater generated by SGE (disposal). These questions were presented with associated response choices, and the individual answers (from “very dissatisfied” to “very satisfied”) were 5-scale Likert items. Table 1 shows that, on average, our respondents gave us two mid-level survey scores for the general environmental topics (3.137 and 2.990), and another two lower scores (2.524 and 2.050) for the water-related impacts posed by SGE. This indicates the water-related risks posed by SGE were of our respondents’ concern. Moreover, Table 1 also indicates that 23.5% of the respondents answered “yes” to the initial dichotomous choice question, and this percentage increased slightly to 29.9% to the second dichotomous choice question.

4.2. Model Estimation Results

In this paper, using the user-generated doubleb command in Stata 15.0 software [48], the parameters have been estimated by maximizing the log-likelihood function of Equation (4). The results are shown in Table 2, including the constant-only model (Model 1) and model with covariates (Model 2). Moreover, after removing the non-significant predictors in Model 2 one by one, the estimation results of the model with only significant covariates (Model 3) are presented in the last column of Table 2.
Since the doubleb Stata command directly estimates the Γ / β in Equation (3), the coefficients presented in Table 2 are the WTP for each variable. The results of Model 1 show that the only parameter is statistically significant at the 1% level, which means, the respondents are willing to pay 32.459 Chinese yuan in general for enhancing the water security. To identify the effects of individual variables on the WTP, the respondents’ socio-economic characteristics and perceived environmental impacts, which have been described in Table 1, are included as covariates for model estimation. Models with covariates, including Model 2 and Model 3, improve the log-likelihood significantly based on the Wald tests. For the covariates, Model 2 shows that the estimation results of the respondents’ gender, education, family size, and the environmental satisfaction of current condition and policy implementation are found to be not significant. After removing the non-significant covariates, Model 3 shows that the significance and magnitude of each variable did not changed much compared with Model 2, which verifies the robustness of the statistical model. Based on the LR test, we found that Model 3 did not change the overall significance, and had a smaller degree of freedom. Thus, Model 3 has a better performance on the information criteria than Model 2.
Among the respondents’ socio-economic characteristics, gender, education, and family size have no significant influence on the WTP, and similar results can also be found in other CV studies implemented on China’s water-related issues [49,50,51]. Moreover, age, location, income, and source of income influence the WTP significantly. Age has a positive influence on WTP, which means that the old respondents’ WTP is higher than that of young respondents. The possible reason is that, old households have less opportunity to migrate from the areas being polluted, and are more dependent on the agricultural production [49] which competes for natural resources with SGE. Therefore, the old respondents’ have a greater reliance on water security and thus higher WTP than the young respondents. Households from the stage 1 development area have a higher WTP than that from the stage 2 development area, which might be the reason that households from the stage 2 development area are less troubled by water-related impacts due to the experience accumulation and technology development of SGE. As expected, and similarly to other CV studies [50,51], respondents with higher income have a higher WTP as they have a greater ability to pay. Meanwhile, respondents who claimed the primary source of their income is from agricultural activities have a higher WTP than those who are more dependent on off-farm income, similarly to He et al. [49] who found households with their income mainly from non-farm would be less affected by local environmental hazards. In our case, the possible reason is that areas around the FSGF are also famous for producing pickled tubers, and agriculture is an essential source of livelihood. Thus, the competition for water resources between the agriculture sector and SGE increases the WTP of respondents whose primary source of income was been farm income. Among the respondents’ respondents’ evaluation of the environmental impacts, the satisfaction with the general environment has no significant influence on the WTP, while the satisfaction of the water-related environmental impacts posed by SGE is negatively related with the WTP. This means that the general satisfaction of the environmental impacts, compared with the specific satisfaction of the SGE’s environmental impacts are less related with the WTP, and respondents who are less satisfied with the water-related environmental impacts have a higher WTP. Thus, local residents’ perceived that impacts of the SGE are of importance to their welfare improvement, as indicated by Yu et al. [2]. A possible reason is that respondents with a negative valuation on the SGE’s environmental impacts have a strong desire to improve it, and thus are more willing to be engaged in enhancing water security.

4.3. WTP Estimation Results

The results of the WTP estimation can be used for estimating the public’s benefit generated from the water security enchanted scenario, which is also the main purpose of the CV study [43]. The WTP per household per year for enhancing water security in FSGF is the weighted composite of the expected values of the significant variables weighted by their estimated coefficients in Table 2. For each model, we calculated the WTP’s mean, standard deviation, and 95% confidence interval for the mean, and provided these statistics in Table 3.
Table 3 shows that, the WTPs from different models has little differences, which also verifies the robustness of the WTP estimation in this paper. As we have discussed above, the statistical power of the Model 3 outperforms the other two models. Our following discussion will mainly rely on the results from Model 3. Model 3 shows that the average WTP is 32.655 Chinese yuan, and its 95% confidence interval ranges from 30.886 to 34.425 Chinese yuan. In FSGF, the shale gas price differs by the consumed amount, and for the basic level of consumption is 1.72 Chinese yuan for less than 500 m3 gas of the year. Thus, our estimated average WTP accounts for 3.80% of the basic household gas bill.
To estimate the benefits of the entire SGE-affected population, we have transferred the estimated WTP from our surveyed areas to the whole SGE areas of FSGF. These areas are Fuling District, Nanchuan District, and Wulong County (as mentioned in Section 2 and Section 3.2), and include 0.619 million households. The total benefits accumulate to 20.202 billion Chinese yuan in the overall shale gas development areas, with a 95% confidence interval ranging from 19.107 to 21.296 billion Chinese yuan. This means that local residents are willing to bear 20.202 billion Chinese yuan on average to reduce the water consumption by 50% per well, increase the wastewater recycle rate to 100%, and build a water monitoring network. Based on our consultation with the experts in Fuling, SGE company roughly spent 70 million Chinese yuan on wastewater treatment in 2017. Our estimation results show that the SGE company can invest more in enhancing water quality and quantity security and increase their spending by 28.9% to meet local residents’ preferences. Moreover, using the discount rate of 4.35%, China’s one-year benchmark loan rate in 2018, the total present value for enhancing water security is about 464 billion Chinese yuan, which indicates a great potential for welfare improvement. Our results confirm that enhancing water security during the SGE is socially desirable and can be economically feasible. In particular, the economic valuation results will provide the basis for judging what kind of technology is profitable and will provide insights for decision-making.

5. Conclusions and Policy Implications

The rapid development of SGE in China has aroused the public’s appeals for water quantity and quality management around the exploration field. In particular, after China determines to boost its economy in the sustainable low-carbon pathway, policymakers pay great attention to the benefits of environmental improvement. This study has studied local household WTP for enhancing water security in the shale gas exploration areas in FSGF, which is a symbolic and fast-growing area in China’s SGE history. We have employed the double-bounded dichotomous choice format of the CV method and combined it with the doubleb Stata command in order to obtain the average WTP, as well as its influencing factors, from our 825 surveyed households.
Our results show that water-related risks posed by SGE were of our respondents’ concern, and local residents were not satisfied with the SGE’s impacts on water quality and quantity. The estimated WTP for enhancing water security is 32.655 Chinese yuan per year per household, which is 3.80% of the household annual basic gas bill. Moreover, according to the model results, respondents who are older, live in the stage 1 development area, have a higher income, get their income mainly from agricultural activities, and are less satisfied with the SGE’s environmental impacts have a higher WTP. This can be explained by the respondents’ dependence on local water resources or eagerness to improve the local water environment. By transferring the estimated WTP to the whole SGE impact area in FSGF, we have calculated the annual economic benefits that can be generated by enhancing water security: 20.202 billion Chinese yuan per year, 28.9% of the SGE companies’ 2017 wastewater treatment expenditure. The total present value for enhancing water security is about 464 billion Chinese yuan, which indicates that enhancing water security can be socially acceptable despite the considerable heterogeneity in WTP.
With the rapid development of SGE, the decision to enhance water security made by the policymakers can be justified by the valuation of potential welfare to make the policy consistent with the social needs. Under these circumstances, our research investigates the public’s WTP for enhancing water security in the context of China’s rapid SGE, which has not yet been studied in the literature. Our results have significant implications for policymaking regarding the environmental impacts posed by SGE. As the environmental protection policy usually generates large number of non-use values, the economic benefit estimated in our study provides valuable insight into the cost–benefit analysis of the relevant policy goals. The total economic benefit of 20.202 billion Chinese yuan per year that can be generated from enhancing water security is quite significant and should be taken seriously by local policymakers. Our study of the public’s WTP for enhancing water security in the FSGF provides relevant information that can be used in the relevant policymaking process, and further analysis should also be conducted in other SGE fields to inform the policymakers about public preferences in different policy sites.

Author Contributions

Conceptualization, D.J. and D.B.; investigation, Z.Y. and G.F.; methodology, D.J. and Z.Y.; resources, D.J., Z.Y. and G.F.; supervision, D.B.; writing—original draft, D.J.; review and editing, D.J. and D.B.

Funding

This research was funded by the National Social Science Foundation of China, grant number 15CJY014.

Conflicts of Interest

The authors declare no conflict of interest.

Appendix A

Figure A1. English translation of the contingent valuation questions.
Water 11 01888 g0a1

References

  1. Cooper, J.; Stamford, L.; Azapagic, A. Shale gas: A review of the economic, environmental, and social sustainability. Energy Technol. 2016, 7, 772–792. [Google Scholar] [CrossRef]
  2. Yu, C.H.; Huang, S.K.; Qin, P.; Chen, X. Local residents’ risk perceptions in response to shale gas exploitation: Evidence from China. Energy Policy 2018, 113, 123–134. [Google Scholar] [CrossRef]
  3. Yang, H.; Flower, R.J.; Thompson, J.R. Shale-gas plans threaten China’s water resources. Science 2013, 340, 1288–1288. [Google Scholar] [CrossRef] [PubMed]
  4. Wang, S. Shale gas exploitation: Status, problems and prospect. Nat. Gas Ind. B 2018, 1, 60–74. [Google Scholar] [CrossRef]
  5. Krupnick, A.; Gordon, H.; Olmstead, S. Pathways to Dialogue: What the Experts Say about the Environmental Risks of Shale Gas Development; Resources for the Future: Washington, DC, USA, 2013. [Google Scholar]
  6. Zoback, M.; Arent, D. Opportunities and challenges of shale gas development. Bridge 2014, 44, 16–23. [Google Scholar]
  7. Groat, C.; Grimshaw, T. Fact-Based Regulation for Environmental Protection in Shale Gas Development. Ph.D. Thesis, University of Texas at Austin, Austin, TX, USA, 2012. [Google Scholar]
  8. Environmental Protection Agency. Study of the Potential Impacts of Hydraulic Fracturing on Drinking Water Resources: Progress Report; Environmental Protection Agency: Washington, DC, USA, 2012.
  9. National Research Council. Induced Seismicity Potential in Energy Technologies; National Academies Press: Washington, DC, USA, 2013. [Google Scholar]
  10. Secretary of Energy Advisory Board. Shale Gas Production Subcommittee 90-Day Report; U.S. Department of Energy: Washington, DC, USA, 2011.
  11. Thomas, M.J.; Pidgeon, N.F.; Evensen, D.T.; Partridge, T.; Hasell, A.; Enders, C.; Herr-Harthorn, B. Public Perceptions of Shale Gas Operations in the USA and Canada: A Review of Evidence; M4ShaleGas Consortium: Utrecht, The Netherlands, 2016. [Google Scholar]
  12. Vidic, R.D.; Brantley, S.L.; Vandenbossche, J.M.; Yoxtheimer, D.; Abad, J.D. Impact of shale gas development on regional water quality. Science 2013, 340, 1235009. [Google Scholar] [CrossRef]
  13. Borick, C.P.; Rabe, B.G.; Lachapelle, E. Public perceptions of shale gas extraction and hydraulic fracturing in New York and Pennsylvania. Issues Energy Environ. Policy 2014, 14, 1–5. [Google Scholar]
  14. Theodori, G.L. Public perception of the natural gas industry: Data from the Barnett shale. Energy Source Part B 2012, 7, 275–281. [Google Scholar] [CrossRef]
  15. Slutz, J.A.; Anderson, J.A.; Broderick, R.; Horner, P.H. Key Shale Gas Water Management Strategies: An Economic Assessment. In Proceedings of the International Conference on Health, Safety and Environment in Oil and Gas Exploration and Production, Perth, Australia, 11–13 September 2012. [Google Scholar] [CrossRef]
  16. Clark, C.E.; Veil, J.A. Produced Water Volumes and Management Practices in the United States (No. ANL/EVS/R-09-1); Argonne National Lab. (ANL): Argonne, IL, USA, 2009.
  17. Kulander, C.S. Shale oil and gas state regulatory issues and trends. Case West. Res. Law Rev. 2012, 63, 1101–1141. [Google Scholar]
  18. Majumdar, S.R. The Politics of Fracking: Regulatory Policy and Local Community Responses to Environmental Concerns; Routledge: New York, NY, USA, 2018. [Google Scholar]
  19. Delivering Water Security for All During Shale Gas Production—A Report Co-Funded by Innovate UK and DECC and Undertaken by the PyTerra Research Consortium. Available online: https://www.pervasive-intelligence.co.uk/publications_data/2016_pyterra_making_water_work_for_shale.pdf (accessed on 1 March 2016).
  20. Rahm, B.G.; Riha, S.J. Evolving shale gas management: Water resource risks, impacts, and lessons learned. Environ. Sci. Process. Impacts 2014, 16, 1400–1412. [Google Scholar] [CrossRef]
  21. Israel, A.L.; Wong-Parodi, G.; Webler, T.; Stern, P.C. Eliciting public concerns about an emerging energy technology: The case of unconventional shale gas development in the United States. Energy Res. Soc. Sci. 2015, 8, 139–150. [Google Scholar] [CrossRef]
  22. Karapataki, C. Techno-Economic Analysis of Water Management Options for Unconventional Natural Gas Developments in the Marcellus Shale. Ph.D. Thesis, Massachusetts Institute of Technology, Cambridge, MA, USA, 2012. [Google Scholar]
  23. Acharya, H.R.; Henderson, C.; Matis, H.; Kommepalli, H.; Moore, B.; Wang, H. Cost Effective Recovery of Low-TDS Frac Flowback Water for Re-Use; U.S. Department of Energy: Washington, DC, USA, 2011.
  24. Bernstein, P.; Kinnaman, T.C.; Wu, M. Estimating willingness to pay for river amenities and safety measures associated with shale gas extraction. East. Econ. J. 2013, 39, 28–44. [Google Scholar] [CrossRef]
  25. Bishop, R.C.; Brown, C.A.; Welsh, M.P.; Boyle, K.J. Grand Canyon recreation and Glen Canyon dam operations: An economic evaluation. In Benefits and Costs in Natural Resources Planning, Interim Report #2; Boyle, L., Heekin, K., Eds.; Department of Agricultural and Resource Economics, University of Maine: Orono, ME, USA, 1989. [Google Scholar]
  26. Alvarez, S.; Asci, S.; Vorotnikova, E. Valuing the potential benefits of water quality improvements in watersheds affected by non-point source pollution. Water 2016, 8, 112. [Google Scholar] [CrossRef]
  27. Johnston, R.J.; Thomassin, P.J. Willingness to pay for water quality improvements in the United States and Canada: Considering possibilities for international meta-analysis and benefit transfer. Agric. Resour. Econ. Rev. 2010, 39, 114–131. [Google Scholar] [CrossRef]
  28. Van Houtven, G.; Powers, J.; Pattanayak, S.K. Valuing water quality improvements in the United States using meta-analysis: Is the glass half-full or half-empty for national policy analysis? Resour. Energy Econ. 2007, 29, 206–228. [Google Scholar] [CrossRef] [Green Version]
  29. Connelly, N.A.; Brown, T.L.; Brown, J.W. Measuring the Net Economic Value of Recreational Boating as Water Levels Fluctuate 1. J. Am. Water Resour. Assoc. 2007, 43, 1016–1023. [Google Scholar] [CrossRef]
  30. Sale, M.C.; Hosking, S.G.; Du Preez, M. Application of the contingent valuation method to estimate a recreational value for the freshwater inflows into the Kowie and the Kromme Estuaries. Water Sa 2009, 35. [Google Scholar] [CrossRef]
  31. Fuling Bureau of Statistics. Statistical Bulletin 2018 on National Economic and Social Development of Fuling District. Available online: http://www.cqfl.gov.cn/Cn/Common/news_view.asp?lmdm=012001&id=6147013 (accessed on 7 May 2019).
  32. Yang, H.; Huang, X.; Yang, Q.; Tu, J.; Li, S.; Yang, D.; Xia, H.; Flower, R.J.; Thompson, J.R. Water requirements for shale gas fracking in Fuling, Chongqing, Southwest China. Energy Procedia 2015, 76, 106–112. [Google Scholar] [CrossRef]
  33. Mei, X.; Wang, Z.; Zhang, S.; Xiong, D.; Zhang, C.; He, M. Main Environmental Risk Analysis and Countermeasure for Shale Gas Mining in Fuling. J. Environ. Sci. Manag. 2015, 42, 63–66. (In Chinese) [Google Scholar]
  34. Wang, S. Research on Environmental Supervision of Shale Gas Development in Fuling. Master’s Thesis, Southwest University of Political Science and Law, Chongqing, China, 2016. [Google Scholar]
  35. Adamowicz, W.; Boxall, P.; Williams, M.; Louviere, J. Stated preference approaches for measuring passive use values: Choice experiments and contingent valuation. Am. J. Agric. Econ. 1998, 80, 64–75. [Google Scholar] [CrossRef]
  36. Jin, J.; Wang, Z.; Ran, S. Comparison of contingent valuation and choice experiment in solid waste management programs in Macao. Ecol. Econ. 2016, 57, 430–441. [Google Scholar] [CrossRef]
  37. Hanemann, M.; Kanninen, B. The statistical analysis of discrete-response CV data. In Valuing Environmental Preferences: Theory and Practice of the Contingent Valuation Method in the US, EU, and Developing Countries; Bateman, I.J., Willis, K.G., Eds.; Oxford University Press: Oxford, UK, 1996. [Google Scholar]
  38. Whitehead, J.C. A practitioner’s primer on contingent valuation. In Handbook on Contingent Valuation; Edward Elgar: Cheltenham, UK, 2006; pp. 92–115. [Google Scholar]
  39. Hanemann, M.; Loomis, J.; Kanninen, B. Statistical efficiency of double-bounded dichotomous choice contingent valuation. Am. J. Agric. Econ. 1991, 73, 1255–1263. [Google Scholar] [CrossRef]
  40. Butkovskyi, A.; Cirkel, G.; Bozileva, E.; Bruning, H.; Van Wezel, A.P.; Rijnaarts, H.H. Estimation of the water cycle related to shale gas production under high data uncertainties: Dutch perspective. J. Environ. Manag. 2019, 231, 483–493. [Google Scholar] [CrossRef] [PubMed]
  41. British Geological Survey. Shale Gas Environmental Monitoring. Available online: https://www.bgs.ac.uk/research/groundwater/shaleGas/home.html (accessed on 29 April 2016).
  42. Johnston, R.J.; Boyle, K.J.; Adamowicz, W.; Bennett, J.; Brouwer, R.; Cameron, T.A.; Hanemann, W.M.; Hanley, N.; Ryan, M.; Scarpa, R.; et al. Contemporary guidance for stated preference studies. J. Assoc. Environ. Resour. Econ. 2017, 4, 319–405. [Google Scholar] [CrossRef]
  43. Hanemann, W.M. Welfare evaluations in contingent valuation experiments with discrete responses. Am. J. Agric. Econ. 1984, 66, 332–341. [Google Scholar] [CrossRef]
  44. Yao, L.; Zhao, M.; Cai, Y.; Yin, Z. Public Preferences for the Design of a Farmland Retirement Project: Using Choice Experiments in Urban and Rural Areas of Wuwei, China. Sustainability 2018, 10, 1579. [Google Scholar] [CrossRef]
  45. Yao, L.Y.; Deng, J.F.; Johnston, R.J.; Khan, I.; Zhao, M.J. Evaluating willingness to pay for the temporal distribution of different air quality improvements: Is China’s clean air target adequate to ensure welfare maximization? Can. J. Agric. Econ. 2018, 67, 215–232. [Google Scholar] [CrossRef]
  46. Moore, J.C.; Welniak, E.J. Income measurement error in surveys: A review. J. Off. Stat. 2000, 16, 331–361. [Google Scholar]
  47. Lopez-Feldman, A. Doubleb: Stata Module to Estimate Contingent Valuation Using Double-Bounded Dichotomous Choice Model. 2010. Available online: http://ideas.repec.org/c/boc/bocode/s457168.html (accessed on 14 October 2013).
  48. Yao, L.; Zhao, M.; Xu, T. China’s Water-Saving Irrigation Management System: Policy, Implementation, and Challenge. Sustainability 2017, 9, 2339. [Google Scholar] [CrossRef]
  49. He, K.; Zhang, J.; Zeng, Y.; Zhang, L. Households’ willingness to accept compensation for agricultural waste recycling: Taking biogas production from livestock manure waste in Hubei, PR China as an example. J. Clean. Prod. 2016, 131, 410–420. [Google Scholar] [CrossRef]
  50. Wang, H.; He, J.; Kim, Y.; Kamata, T. Willingness-to-pay for water quality improvements in Chinese rivers: An empirical test on the ordering effects of multiple-bounded discrete choices. J. Envion. Manag. 2013, 131, 256–269. [Google Scholar] [CrossRef] [PubMed]
  51. Zhao, J.; Liu, Q.; Lin, L.; Lv, H.; Wang, Y. Assessing the comprehensive restoration of an urban river: An integrated application of contingent valuation in Shanghai, China. Sci. Total Environ. 2013, 458, 517–526. [Google Scholar] [CrossRef] [PubMed]
Table 1. Socioeconomic and choice characteristics of the respondents.
VariablesDescriptionsMeanS.D.
genderFemale = 1; Male = 0.0.1120.315
ageAge of the respondent.47.27214.908
educationPrimary school or under = 1; Junior school = 2; Senior school = 3; College degree or above = 4.1.7220.839
locationStage 1 development area = 1; Stage 2 development area = 0.0.5710.495
sizeNumber of persons in the respondent’s household.4.4051.369
incomeLess than 3000 = 1; (3000, 6000) = 2; (6000, 9000) = 3; (9000, 12,000) = 4; (12,000, 15,000) = 5; (15,000, 18,000) = 6; Above 18,000 = 7.3.6861.770
sourceOff-farm income = 0; Farm income = 1.0.6590.474
conditionVery dissatisfied = 1; Dissatisfied = 2; General = 3; Satisfied = 4; Very satisfied = 5.3.1371.178
policy2.9901.268
consumption2.5241.344
disposal2.0501.402
bid1The initial bid randomly assigned to the respondent.56.30316.960
bid2The second bid assigned following the initial bid.45.70918.767
ans1“no” for the first bid = 0; “yes” for the first bid = 1.0.2350.424
ans2“no” for the second bid = 0; “yes” for the second bid = 1.0.2990.458
Table 2. Estimation results of the double-bounded models.
VariablesModel 1Model 2Model 3
Constant32.459 (1.236) ***−7.219 (5.999)−7.085 (4.048) *
gender −1.609 (2.536)
age 0.109 (0.060) *0.100 (0.054) *
education 0.299 (1.057)
location 2.908 (1.605) *2.861 (1.604) *
size 0.131 (0.564)
income 10.628 (0.498) ***10.617 (0.496) ***
source 6.873 (1.703) ***6.946 (1.702) ***
condition −0.570 (0.847)
policy 0.122 (0.889)
consumption −2.009 (0.695) ***−2.119 (0.675) ***
disposal −2.447 (0.751) ***−2.431 (0.655) ***
log likelihood−834.432−587.972−588.497
Wald chi2-482.61 ***480.52 ***
Notes: The descriptions of these variables are defined in Table 1. The standard errors are reported in the parentheses behind the estimated coefficients. *, **, *** indicate the statistical significance at the 10%, 5% and 1% levels, respectively.
Table 3. Estimation results of the double-bounded models.
Annual Mean WTPMeanStandard Error[95% Confidence Interval]
Model 132.4591.236 ***[30.036, 34.882]
Model 240.4114.023 ***[32.525, 48.296]
Model 332.6550.903 ***[30.886, 34.425]
Notes: *, ** and *** indicate the statistical significance at the 10%, 5% and 1% levels, respectively. WTP: willingness to pay.

