Rainfall–Runoff Processes and Modelling in Regions Characterized by Deficiency in Soil Water Storage
Abstract
1. Introduction
2. Methodology
2.1. The Concept of Variable Layer-Based Runoff Generation
2.2. The Vertical and Spatial Distribution of Relative Water Storage Capacity
2.2.1. The Vertical Distribution
2.2.2. The Horizontal Spatial Distribution and Runoff Estimation
2.3. Integration of the Runoff Model into a Hydrological Model
2.3.1. Three-Layer Evapotranspiration Module
2.3.2. Partial Storage–Excess Runoff Module
2.3.3. Water Source Partition Module
2.3.4. Discharge Routing Module
2.4. Measures of Performance Assessment
2.5. The Objective Function of Optimization Algorithm
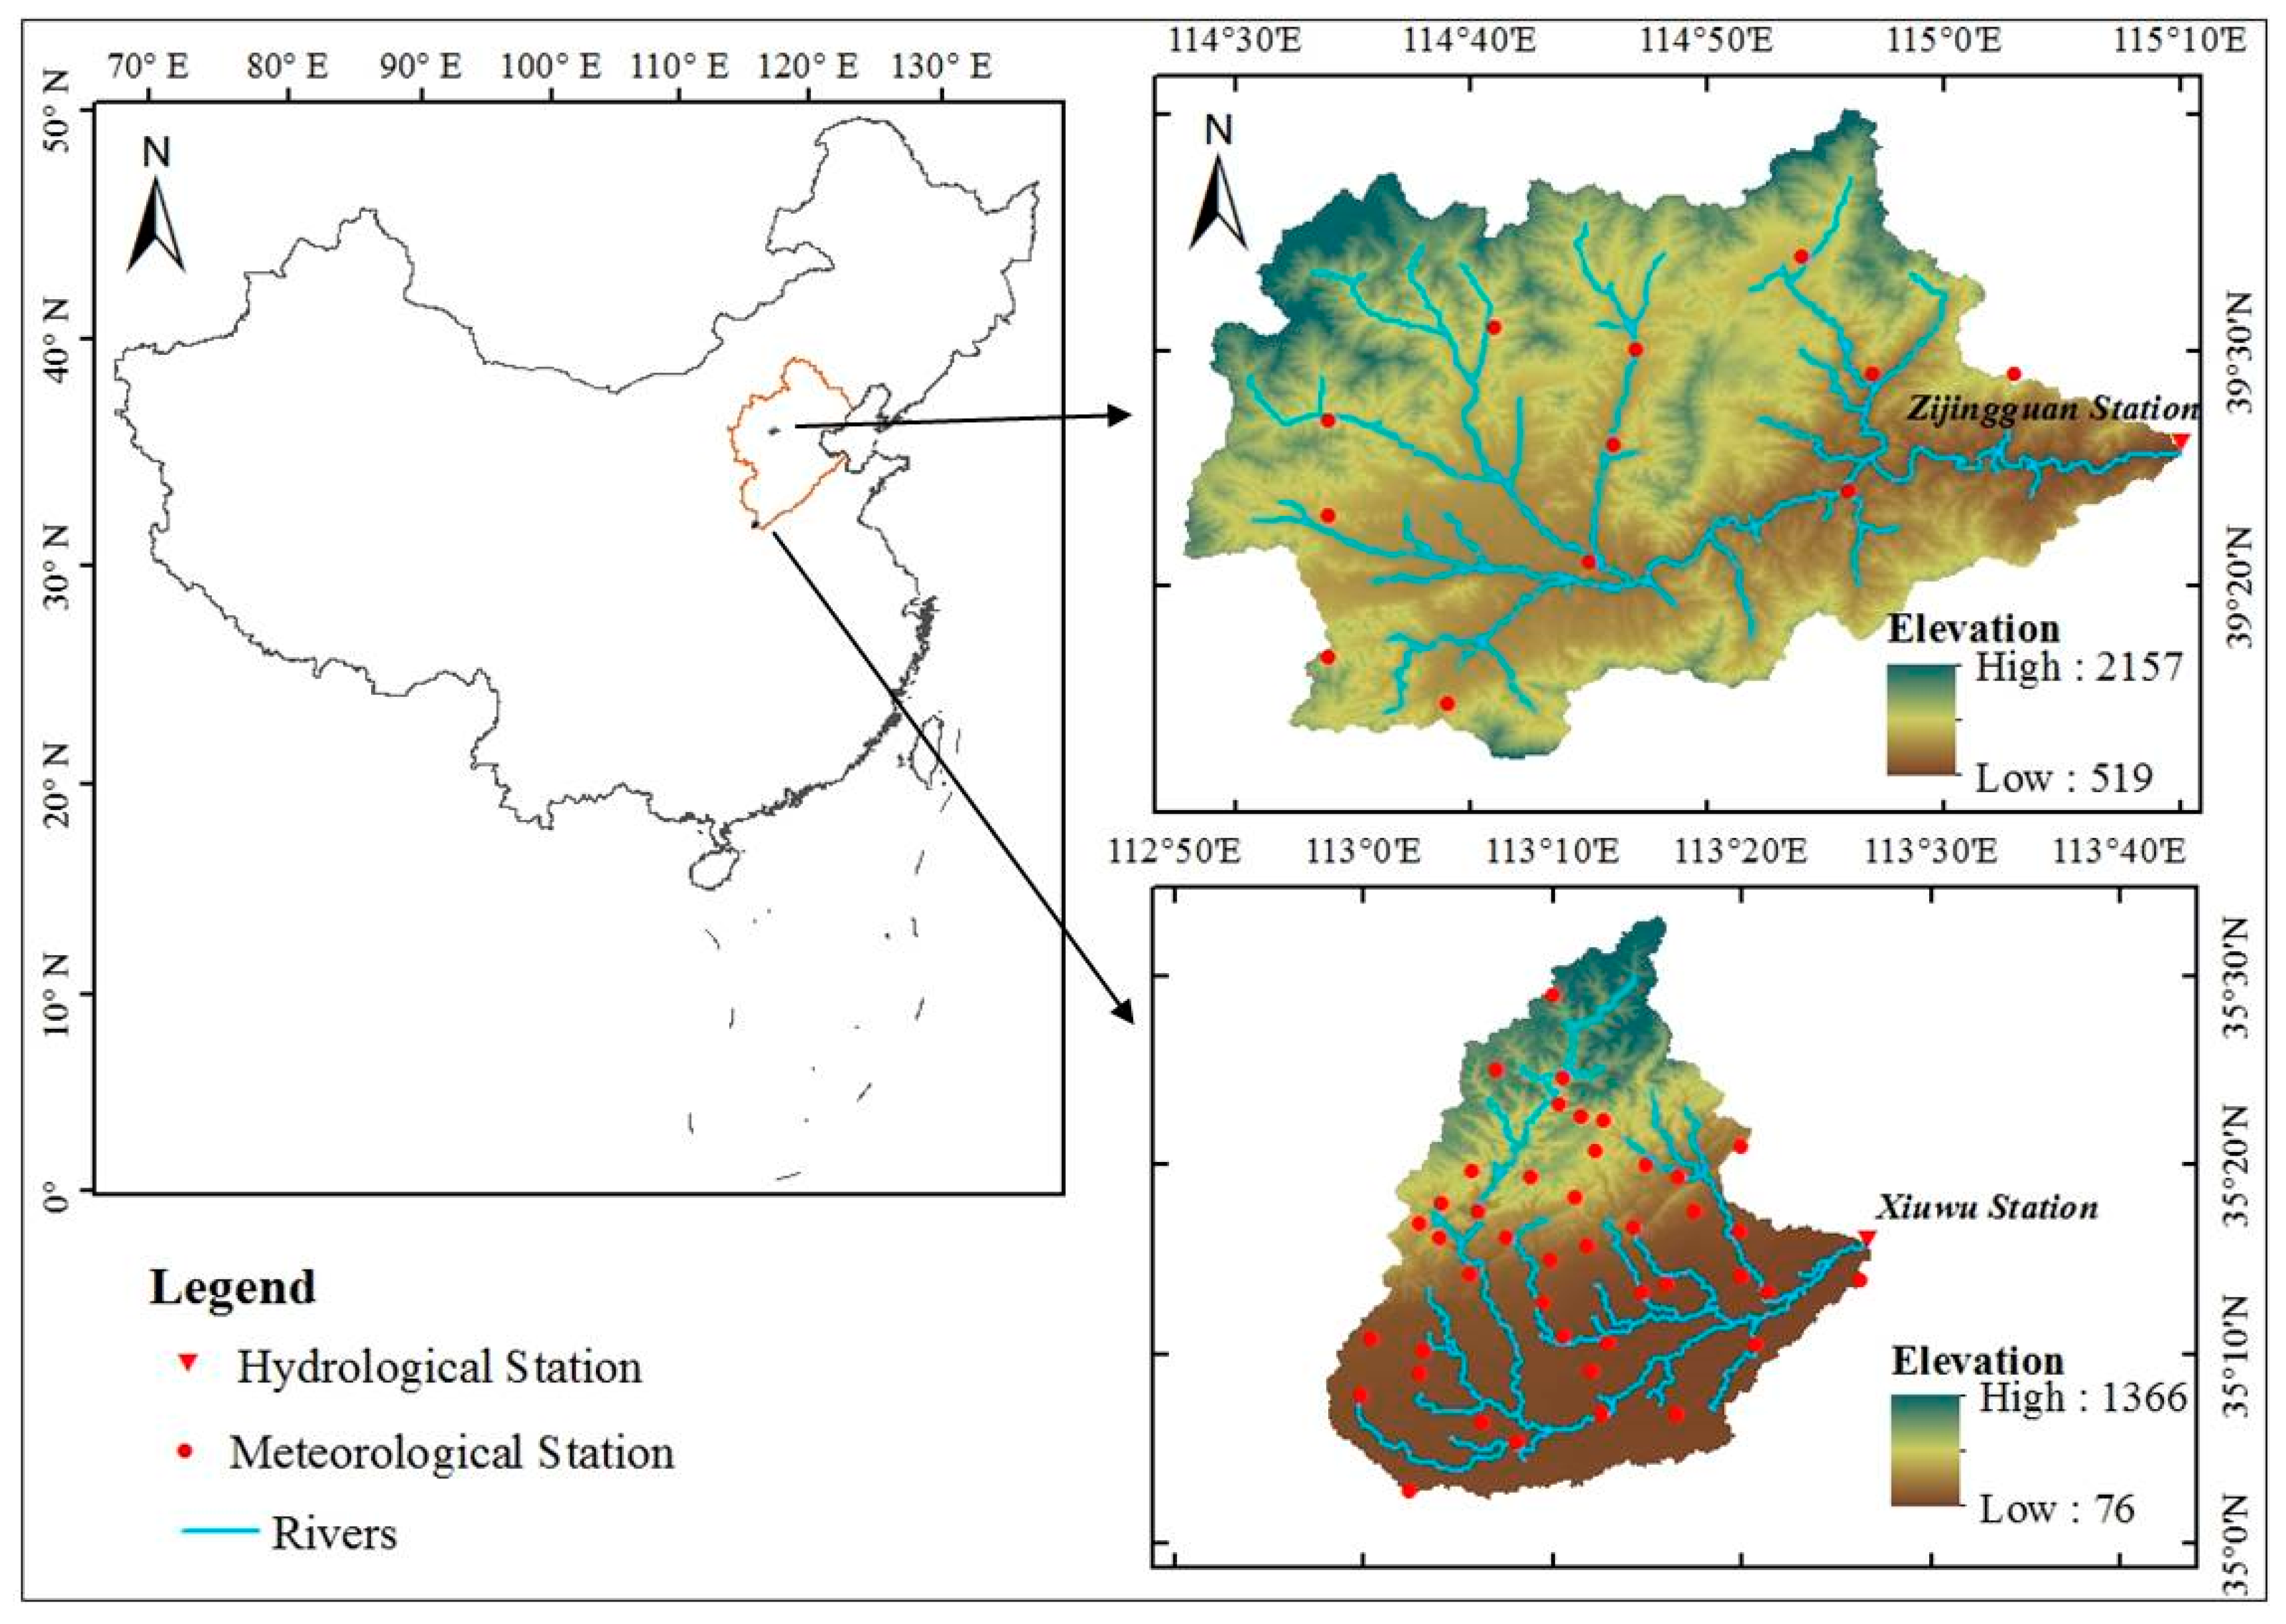
3. Study Area and Data
4. Results
4.1. Optimised Parameter Values
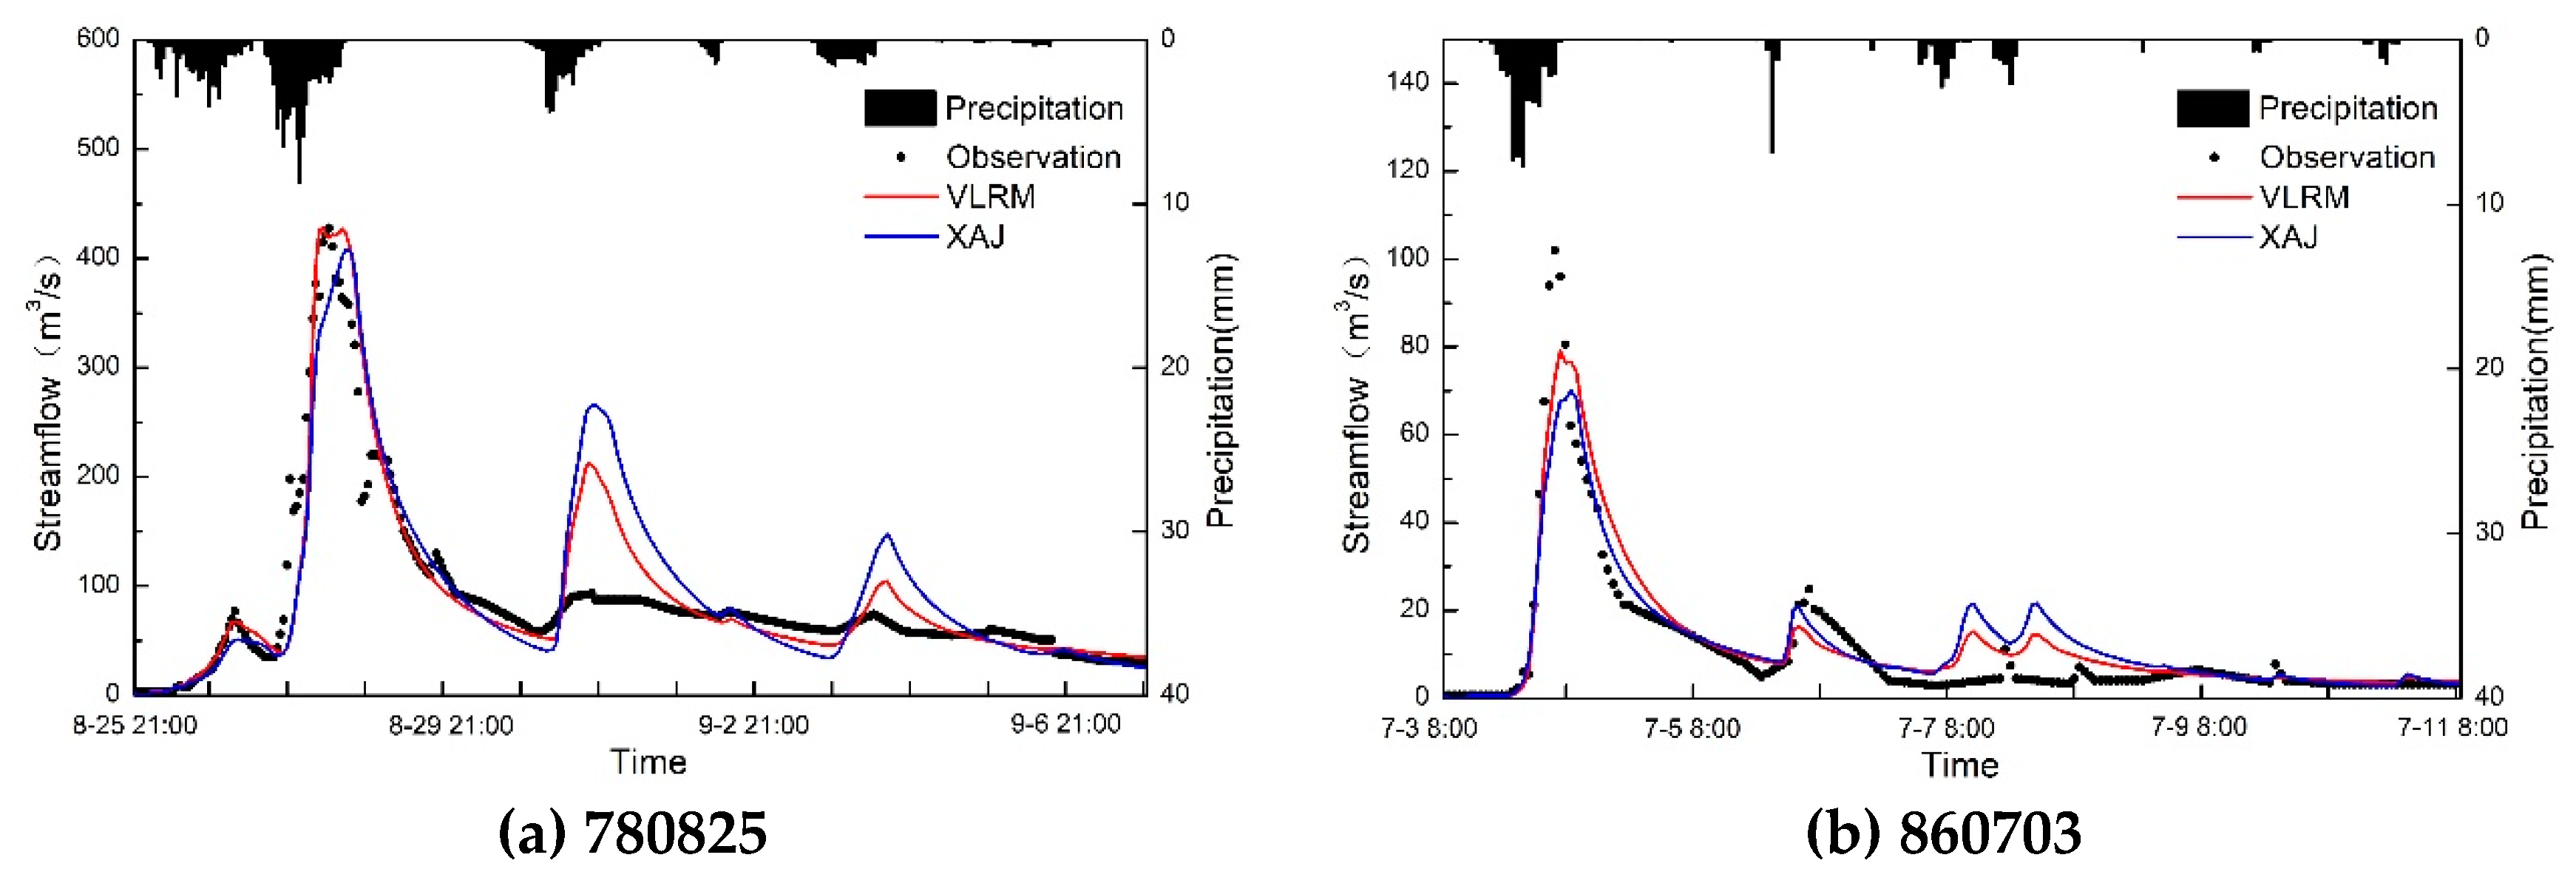
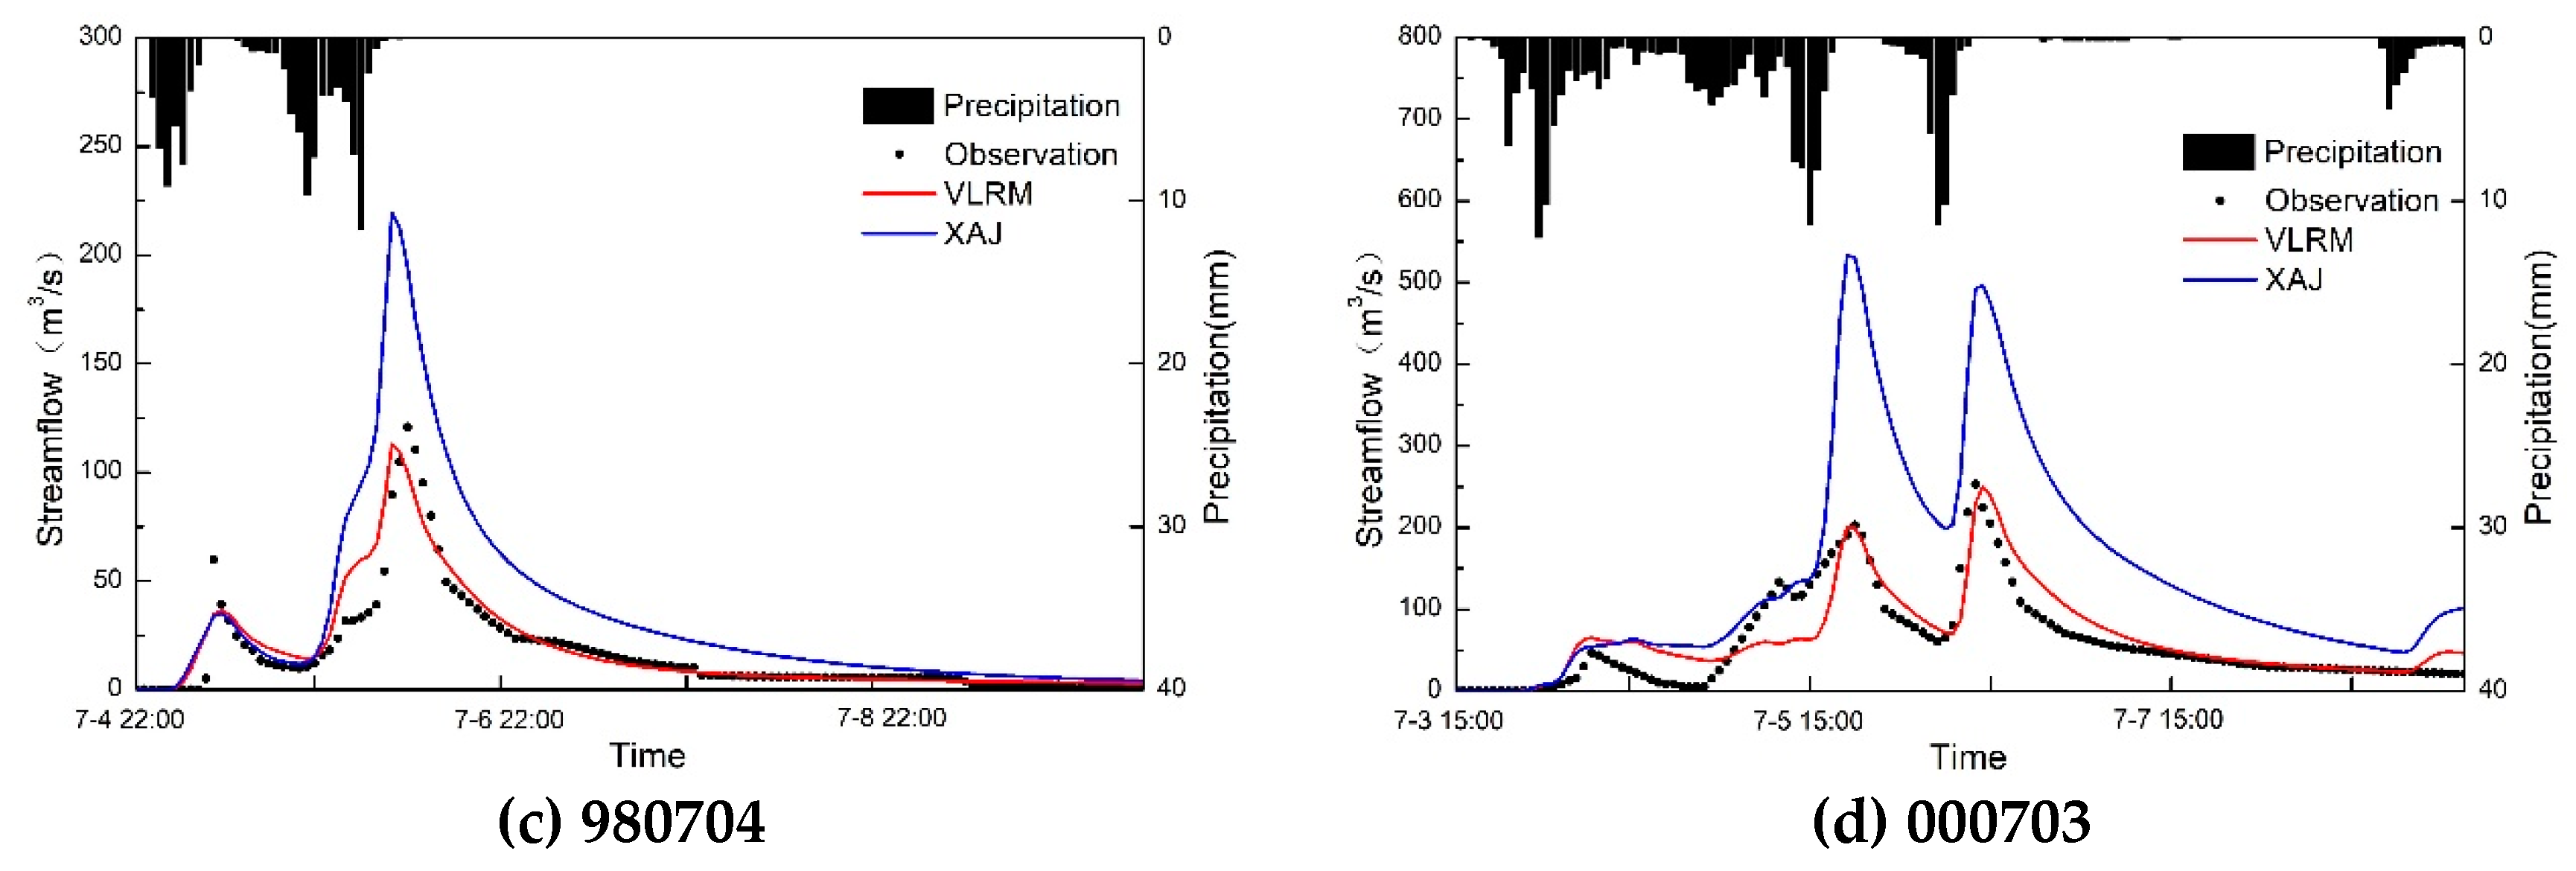
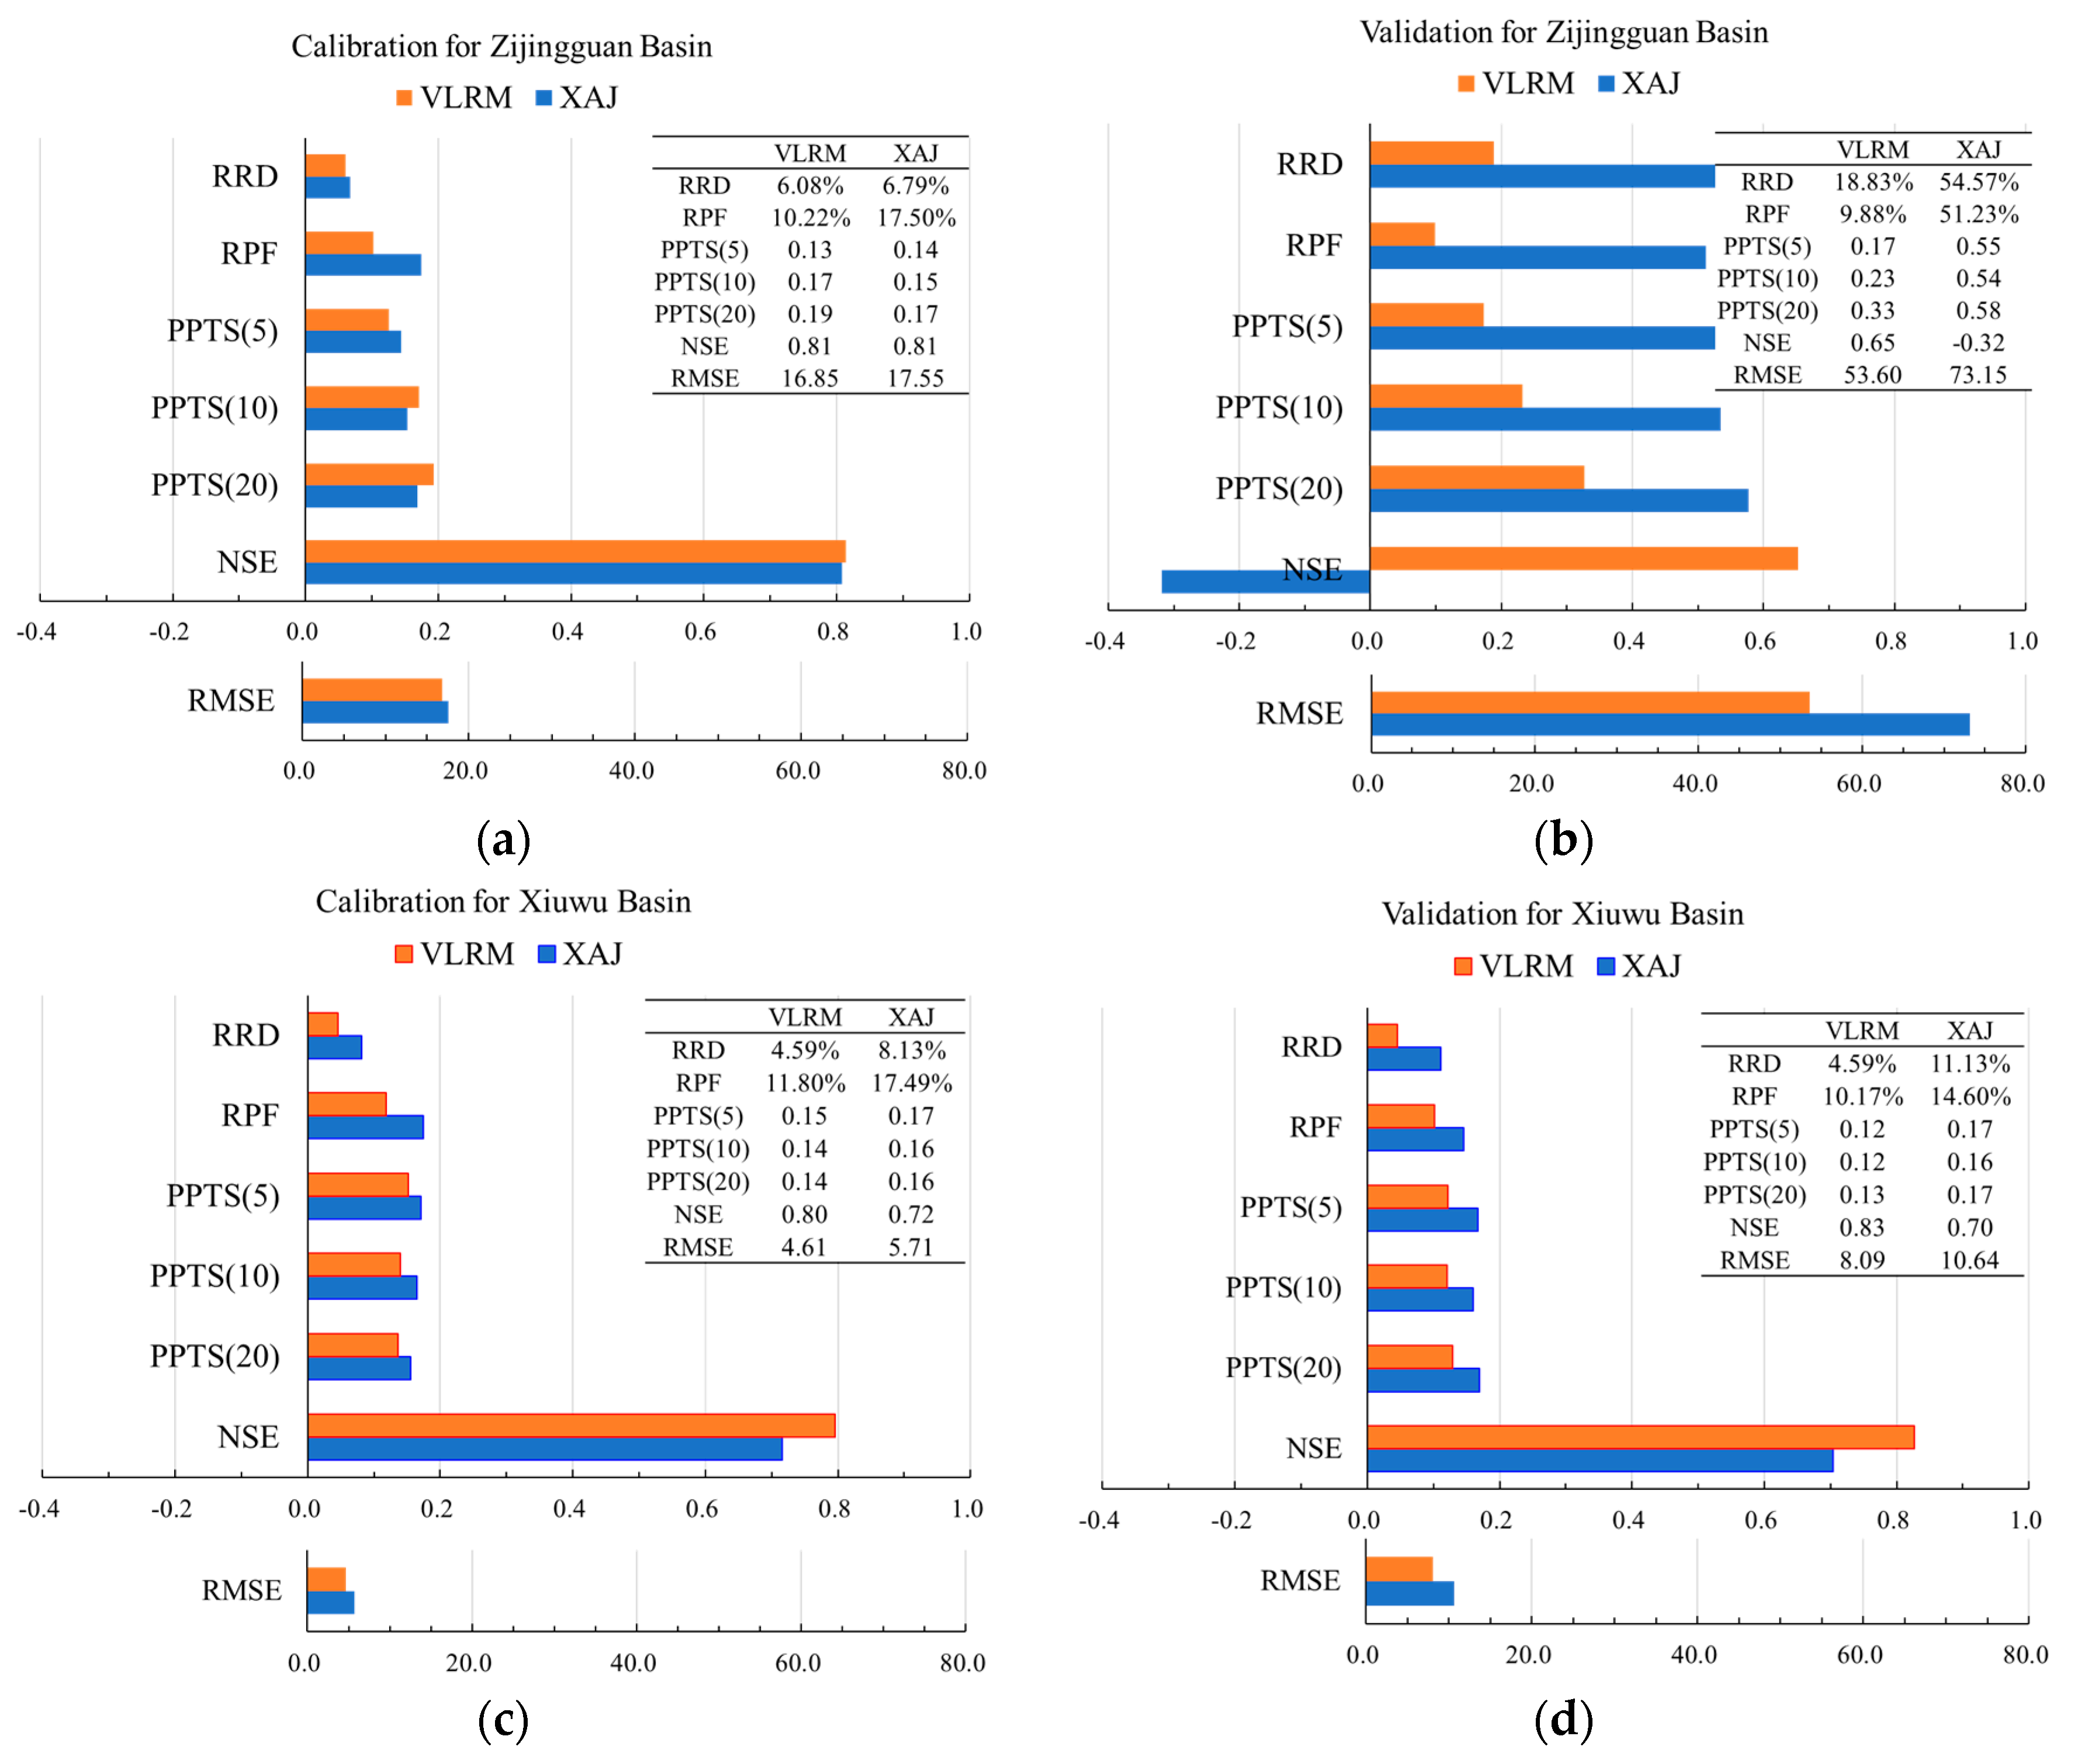
4.2. Statistical and Graphic Presentation of the Results
4.3. Sensitivity and Uncertainty Analyses
5. Discussion
6. Conclusions
Author Contributions
Funding
Acknowledgments
Conflicts of Interest
Appendix A
Appendix B
| Variables | Description | |
|---|---|---|
| Parameters | KC | Ratio of potential evapotranspiration to pan evaporation |
| UM | Tension moisture capacity of upper layer | |
| LM | Tension moisture capacity of lower layer | |
| C | Coefficient of deep evapotranspiration | |
| RWMM | The averaged soil water storage capacity for the whole aeration zone | |
| b | Exponent of the vertical distribution curve for relative water storage capacity | |
| B | Exponent of the spatial distribution curve for relative water storage capacity | |
| SM | Average free water storage capacity | |
| EX | Exponent of the free water storage capacity curve | |
| KI | Outflow coefficient of the free water storage to interflow | |
| KG | Outflow coefficient of the free water storage to groundwater | |
| CS | Recession constant of the surface water | |
| CI | Recession constant of the lower interflow storage | |
| CG | Recession constant of the groundwater storage | |
| KE | Parameter of Muskingum routing | |
| XE | Parameter of Muskingum routing | |
| Conceptual state variables | ratio of depth of AL to the depth of total aeration zone | |
| WU | Soil moisture content of upper layer | |
| WL | Soil moisture content of upper layer | |
| WD | Soil moisture content of upper layer | |
| WW | Soil moisture content in AL | |
| Changes of WW | ||
| Symbols in the figures | AL | Active runoff generation layers |
| P | Precipitation | |
| E | Evapotranspiration | |
| R | Runoff | |
| RS | Surface runoff | |
| RI | Interflow | |
| RG | Groundwater runoff | |
| RW | Relative water storage capacity | |
| The proportion of the runoff area to the basin | ||
| Performance measures | RPF | The relative error of peak flow |
| RRD | The relative error of runoff depth | |
| RMSE | The root mean square error | |
| NSE | The Nash–Sutcliffe coefficient | |
| PPTS | The peak percent threshold statistics | |
References
- Chuntian, C.; Chau, K.W. Three-person multi-objective conflict decision in reservoir flood control. Eur. J. Oper. Res. 2002, 142, 625–631. [Google Scholar] [CrossRef]
- Cloke, H.L.; Pappenberger, F. Ensemble flood forecasting: A review. J. Hydrol. 2009, 375, 613–626. [Google Scholar] [CrossRef]
- Moore, R.J.; Bell, V.A.; Jones, D.A. Forecasting for flood warning. C. R. Geosci. 2005, 337, 203–217. [Google Scholar] [CrossRef]
- Yaseen, Z.M.; Sulaiman, S.O.; Deo, R.C.; Chau, K.-W. An enhanced extreme learning machine model for river flow forecasting: State-of-the-art, practical applications in water resource engineering area and future research direction. J. Hydrol. 2019, 569, 387–408. [Google Scholar] [CrossRef]
- Ameli, A.A.; Craig, J.R.; McDonnell, J.J. Are all runoff processes the same? Numerical experiments comparing a Darcy-Richards solver to an overland flow-based approach for subsurface storm runoff simulation. Water Resour. Res. 2015, 51, 10008–10028. [Google Scholar] [CrossRef]
- Zhao, R.-J. The Xinanjiang model applied in China. J. Hydrol. 1992, 135, 371–381. [Google Scholar] [CrossRef]
- Beven, K. Towards an alternative blueprint for a physically based digitally simulated hydrologic response modelling system. Hydrol. Process. 2002, 16, 189–206. [Google Scholar] [CrossRef]
- Liang, X.; Lettenmaier, D.P.; Wood, E.F. One-dimensional statistical dynamic representation of subgrid spatial variability of precipitation in the two-layer variable infiltration capacity model. J. Geophys. Res. Atmos. 1996, 101, 21403–21422. [Google Scholar] [CrossRef]
- Devia, G.K.; Ganasri, B.P.; Dwarakish, G.S. A Review on Hydrological Models. Aquat. Procedia 2015, 4, 1001–1007. [Google Scholar] [CrossRef]
- Hao, G.; Li, J.; Song, L.; Li, H.; Li, Z. Comparison between the TOPMODEL and the Xin’anjiang model and their application to rainfall runoff simulation in semi-humid regions. Environ. Earth Sci. 2018, 77, 279. [Google Scholar] [CrossRef]
- Chawla, I.; Mujumdar, P.P. Partitioning uncertainty in streamflow projections under nonstationary model conditions. Adv. Water Resour. 2018, 112, 266–282. [Google Scholar] [CrossRef]
- Raju, B.C.K.; Nandagiri, L. Assessment of variable source area hydrological models in humid tropical watersheds. Int. J. River Basin Manag. 2018, 16, 145–156. [Google Scholar] [CrossRef]
- Golmohammadi, G.; Rudra, R.; Dickinson, T.; Goel, P.; Veliz, M. Predicting the temporal variation of flow contributing areas using SWAT. J. Hydrol. 2017, 547, 375–386. [Google Scholar] [CrossRef]
- Kim, S.J.; Steenhuis, T.S. Gristorm: Grid–Based Variable Source Area Storm Runoff Model. Trans. ASAE 2001, 44, 863. [Google Scholar] [CrossRef]
- Ivanov, V.Y.; Vivoni, E.R.; Bras, R.L.; Entekhabi, D. Catchment hydrologic response with a fully distributed triangulated irregular network model. Water Resour. Res. 2004, 40. [Google Scholar] [CrossRef]
- Daneshmand, H.; Alaghmand, S.; Camporese, M.; Talei, A.; Daly, E. Water and salt balance modelling of intermittent catchments using a physically-based integrated model. J. Hydrol. 2019, 568, 1017–1030. [Google Scholar] [CrossRef]
- Schneiderman, E.M.; Steenhuis, T.S.; Thongs, D.J.; Easton, Z.M.; Zion, M.S.; Neal, A.L.; Mendoza, G.F.; Todd Walter, M. Incorporating variable source area hydrology into a curve-number-based watershed model. Hydrol. Process. 2007, 21, 3420–3430. [Google Scholar] [CrossRef]
- Dahlke, H.E.; Easton, Z.M.; Fuka, D.R.; Lyon, S.W.; Steenhuis, T.S. Modelling variable source area dynamics in a CEAP watershed. Ecohydrology 2009, 2, 337–349. [Google Scholar] [CrossRef]
- Lee, K.T.; Huang, J.-K. Runoff simulation considering time-varying partial contributing area based on current precipitation index. J. Hydrol. 2013, 486, 443–454. [Google Scholar] [CrossRef]
- Cantón, Y.; Rodríguez-Caballero, E.; Chamizo, S.; Le Bouteiller, C.; Solé-Benet, A.; Calvo-Cases, A. Chapter 5—Runoff Generation in Badlands. In Badlands Dynamics in a Context of Global Change; Nadal-Romero, E., Martínez-Murillo, J.F., Kuhn, N.J., Eds.; Elsevier: Amsterdam, The Netherlands, 2018; pp. 155–190. [Google Scholar]
- Huang, P.; Li, Z.; Chen, J.; Li, Q.; Yao, C. Event-based hydrological modeling for detecting dominant hydrological process and suitable model strategy for semi-arid catchments. J. Hydrol. 2016, 542, 292–303. [Google Scholar] [CrossRef]
- Dunne, T.; Black, R.D. Partial Area Contributions to Storm Runoff in a Small New England Watershed. Water Resour. Res. 1970, 6, 1296–1311. [Google Scholar] [CrossRef]
- Daliakopoulos, I.N.; Tsanis, I.K. Comparison of an artificial neural network and a conceptual rainfall–runoff model in the simulation of ephemeral streamflow. Hydrol. Sci. J. 2016, 61, 2763–2774. [Google Scholar] [CrossRef]
- Jayawardena, A.W.; Zhou, M.C. A modified spatial soil moisture storage capacity distribution curve for the Xinanjiang model. J. Hydrol. 2000, 227, 93–113. [Google Scholar] [CrossRef]
- Pilgrim, D.H.; Chapman, T.G.; Doran, D.G. Problems of rainfall-runoff modelling in arid and semiarid regions. Hydrol. Sci. J. 1988, 33, 379–400. [Google Scholar] [CrossRef]
- Moazenzadeh, R.; Mohammadi, B.; Shamshirband, S.; Chau, K.-W. Coupling a firefly algorithm with support vector regression to predict evaporation in northern Iran. Eng. Appl. Comput. Fluid Mech. 2018, 12, 584–597. [Google Scholar] [CrossRef]
- Si, W.; Bao, W.; Gupta, H.V. Updating real-time flood forecasts via the dynamic system response curve method. Water Resour. Res. 2015, 51, 5128–5144. [Google Scholar] [CrossRef]
- Lohani, A.K.; Goel, N.K.; Bhatia, K.K.S. Improving real time flood forecasting using fuzzy inference system. J. Hydrol. 2014, 509, 25–41. [Google Scholar] [CrossRef]
- Li, J.; Feng, P.; Chen, F. Effects of land use change on flood characteristics in mountainous area of Daqinghe watershed, China. Nat. Hazards 2014, 70, 593–607. [Google Scholar] [CrossRef]
- Duan, Q.Y.; Gupta, V.K.; Sorooshian, S. Shuffled complex evolution approach for effective and efficient global minimization. J. Optim. Theory Appl. 1993, 76, 501–521. [Google Scholar] [CrossRef]
- Qin, Y.; Kavetski, D.; Kuczera, G. A Robust Gauss-Newton Algorithm for the Optimization of Hydrological Models: From Standard Gauss-Newton to Robust Gauss-Newton. Water Resour. Res. 2018, 54, 9655–9683. [Google Scholar] [CrossRef]
- Qin, Y.; Kavetski, D.; Kuczera, G. A Robust Gauss-Newton Algorithm for the Optimization of Hydrological Models: Benchmarking Against Industry-Standard Algorithms. Water Resour. Res. 2018, 54, 9637–9654. [Google Scholar] [CrossRef]
- Queipo, N.V.; Haftka, R.T.; Shyy, W.; Goel, T.; Vaidyanathan, R.; Kevin Tucker, P. Surrogate-based analysis and optimization. Prog. Aerosp. Sci. 2005, 41, 1–28. [Google Scholar] [CrossRef]
- Wang, Q.J. The Genetic Algorithm and Its Application to Calibrating Conceptual Rainfall-Runoff Models. Water Resour. Res. 1991, 27, 2467–2471. [Google Scholar] [CrossRef]
- Duan, Q.; Sorooshian, S.; Gupta, V. Effective and efficient global optimization for conceptual rainfall-runoff models. Water Resour. Res. 1992, 28, 1015–1031. [Google Scholar] [CrossRef]
- Tolson, B.A.; Shoemaker, C.A. Dynamically dimensioned search algorithm for computationally efficient watershed model calibration. Water Resour. Res. 2007, 43. [Google Scholar] [CrossRef]
- Houska, T.; Multsch, S.; Kraft, P.; Frede, H.G.; Breuer, L. Monte Carlo-based calibration and uncertainty analysis of a coupled plant growth and hydrological model. Biogeosciences 2014, 11, 2069–2082. [Google Scholar] [CrossRef]
- Jung, Y.W.; Oh, D.-S.; Kim, M.; Park, J.-W. Calibration of LEACHN model using LH-OAT sensitivity analysis. Nutr. Cycl. Agroecosyst. 2010, 87, 261–275. [Google Scholar] [CrossRef]
- Beven, K.; Freer, J. Equifinality, data assimilation, and uncertainty estimation in mechanistic modelling of complex environmental systems using the GLUE methodology. J. Hydrol. 2001, 249, 11–29. [Google Scholar] [CrossRef]
- Zheng, Y.; Keller, A.A. Uncertainty assessment in watershed-scale water quality modeling and management: 1. Framework and application of generalized likelihood uncertainty estimation (GLUE) approach. Water Resour. Res. 2007, 43. [Google Scholar] [CrossRef]
- Fowler, K.J.A.; Peel, M.C.; Western, A.W.; Zhang, L.; Peterson, T.J. Simulating runoff under changing climatic conditions: Revisiting an apparent deficiency of conceptual rainfall-runoff models. Water Resour. Res. 2016, 52, 1820–1846. [Google Scholar] [CrossRef]
- Ren, W.; Yang, T.; Shi, P.; Xu, C.-Y.; Zhang, K.; Zhou, X.; Shao, Q.; Ciais, P. A probabilistic method for streamflow projection and associated uncertainty analysis in a data sparse alpine region. Glob. Planet. Chang. 2018, 165, 100–113. [Google Scholar] [CrossRef]
- Li, Z.; Yang, T.; Huang, C.-S.; Xu, C.-Y.; Shao, Q.; Shi, P.; Wang, X.; Cui, T. An improved approach for water quality evaluation: TOPSIS-based informative weighting and ranking (TIWR) approach. Ecol. Indic. 2018, 89, 356–364. [Google Scholar] [CrossRef]
- Sivakumar, B. Dominant processes concept, model simplification and classification framework in catchment hydrology. Stoch. Environ. Res. Risk Assess. 2008, 22, 737–748. [Google Scholar] [CrossRef]
- Mediero, L.; Kjeldsen, T.R. Regional flood hydrology in a semi-arid catchment using a GLS regression model. J. Hydrol. 2014, 514, 158–171. [Google Scholar] [CrossRef]
- Huang, C.-S.; Yang, T.; Yeh, H.-D. Review of analytical models to stream depletion induced by pumping: Guide to model selection. J. Hydrol. 2018, 561, 277–285. [Google Scholar] [CrossRef]
- Liu, X.; Ren, L.; Yuan, F.; Singh, V.P.; Fang, X.; Yu, Z.; Zhang, W. Quantifying the effect of land use and land cover changes on green water and blue water in northern part of China. Hydrol. Earth Syst. Sci. 2009, 5, 735–747. [Google Scholar] [CrossRef]
- Shi, P.; Yang, T.; Xu, C.-Y.; Yong, B.; Shao, Q.; Li, Z.; Wang, X.; Zhou, X.; Li, S. How do the multiple large-scale climate oscillations trigger extreme precipitation? Glob. Planet. Chang. 2017, 157, 48–58. [Google Scholar] [CrossRef]
- Kumar, A.; Yang, T.; Sharma, M.P. Long-term prediction of greenhouse gas risk to the Chinese hydropower reservoirs. Sci. Total Environ. 2019, 646, 300–308. [Google Scholar] [CrossRef]
- Cui, T.; Yang, T.; Xu, C.-Y.; Shao, Q.; Wang, X.; Li, Z. Assessment of the impact of climate change on flow regime at multiple temporal scales and potential ecological implications in an alpine river. Stoch. Environ. Res. Risk Assess. 2018, 32, 1849–1866. [Google Scholar] [CrossRef]
- Wang, X.; Yang, T.; Wortmann, M.; Shi, P.; Hattermann, F.; Lobanova, A.; Aich, V. Analysis of multi-dimensional hydrological alterations under climate change for four major river basins in different climate zones. Clim. Chang. 2017, 141, 483–498. [Google Scholar] [CrossRef]
- Wang, X.; Yang, T.; Yong, B.; Krysanova, V.; Shi, P.; Li, Z.; Zhou, X. Impacts of climate change on flow regime and sequential threats to riverine ecosystem in the source region of the Yellow River. Environ. Earth Sci. 2018, 77, 465. [Google Scholar] [CrossRef]
- Yang, T.; Cui, T.; Xu, C.-Y.; Ciais, P.; Shi, P. Development of a new IHA method for impact assessment of climate change on flow regime. Glob. Planet. Chang. 2017, 156, 68–79. [Google Scholar] [CrossRef]
- Wang, W.-C.; Chau, K.-W.; Qiu, L.; Chen, Y.-B. Improving forecasting accuracy of medium and long-term runoff using artificial neural network based on EEMD decomposition. Environ. Res. 2015, 139, 46–54. [Google Scholar] [CrossRef]
- Fotovatikhah, F.; Herrera, M.; Shamshirband, S.; Chau, K.-W.; Faizollahzadeh Ardabili, S.; Piran, M.J. Survey of computational intelligence as basis to big flood management: Challenges, research directions and future work. Eng. Appl. Comput. Fluid Mech. 2018, 12, 411–437. [Google Scholar] [CrossRef]
- Ali Ghorbani, M.; Kazempour, R.; Chau, K.-W.; Shamshirband, S.; Taherei Ghazvinei, P. Forecasting pan evaporation with an integrated artificial neural network quantum-behaved particle swarm optimization model: A case study in Talesh, Northern Iran. Eng. Appl. Comput. Fluid Mech. 2018, 12, 724–737. [Google Scholar] [CrossRef]


| Parameter | Description | Domains | Optimal Value | |
|---|---|---|---|---|
| Zijingguan | Xiuwu | |||
| KC | Ratio of potential evapotranspiration to pan evaporation | 0.1–2.0 | 1.98 | 0.23 |
| UM | Tension moisture capacity of upper layer | 30–200 | 95 | 89 |
| LM | Tension moisture capacity of lower layer | 30–200 | 102 | 47 |
| C | Coefficient of deep evapotranspiration | 0.01–0.2 | 0.12 | 0.12 |
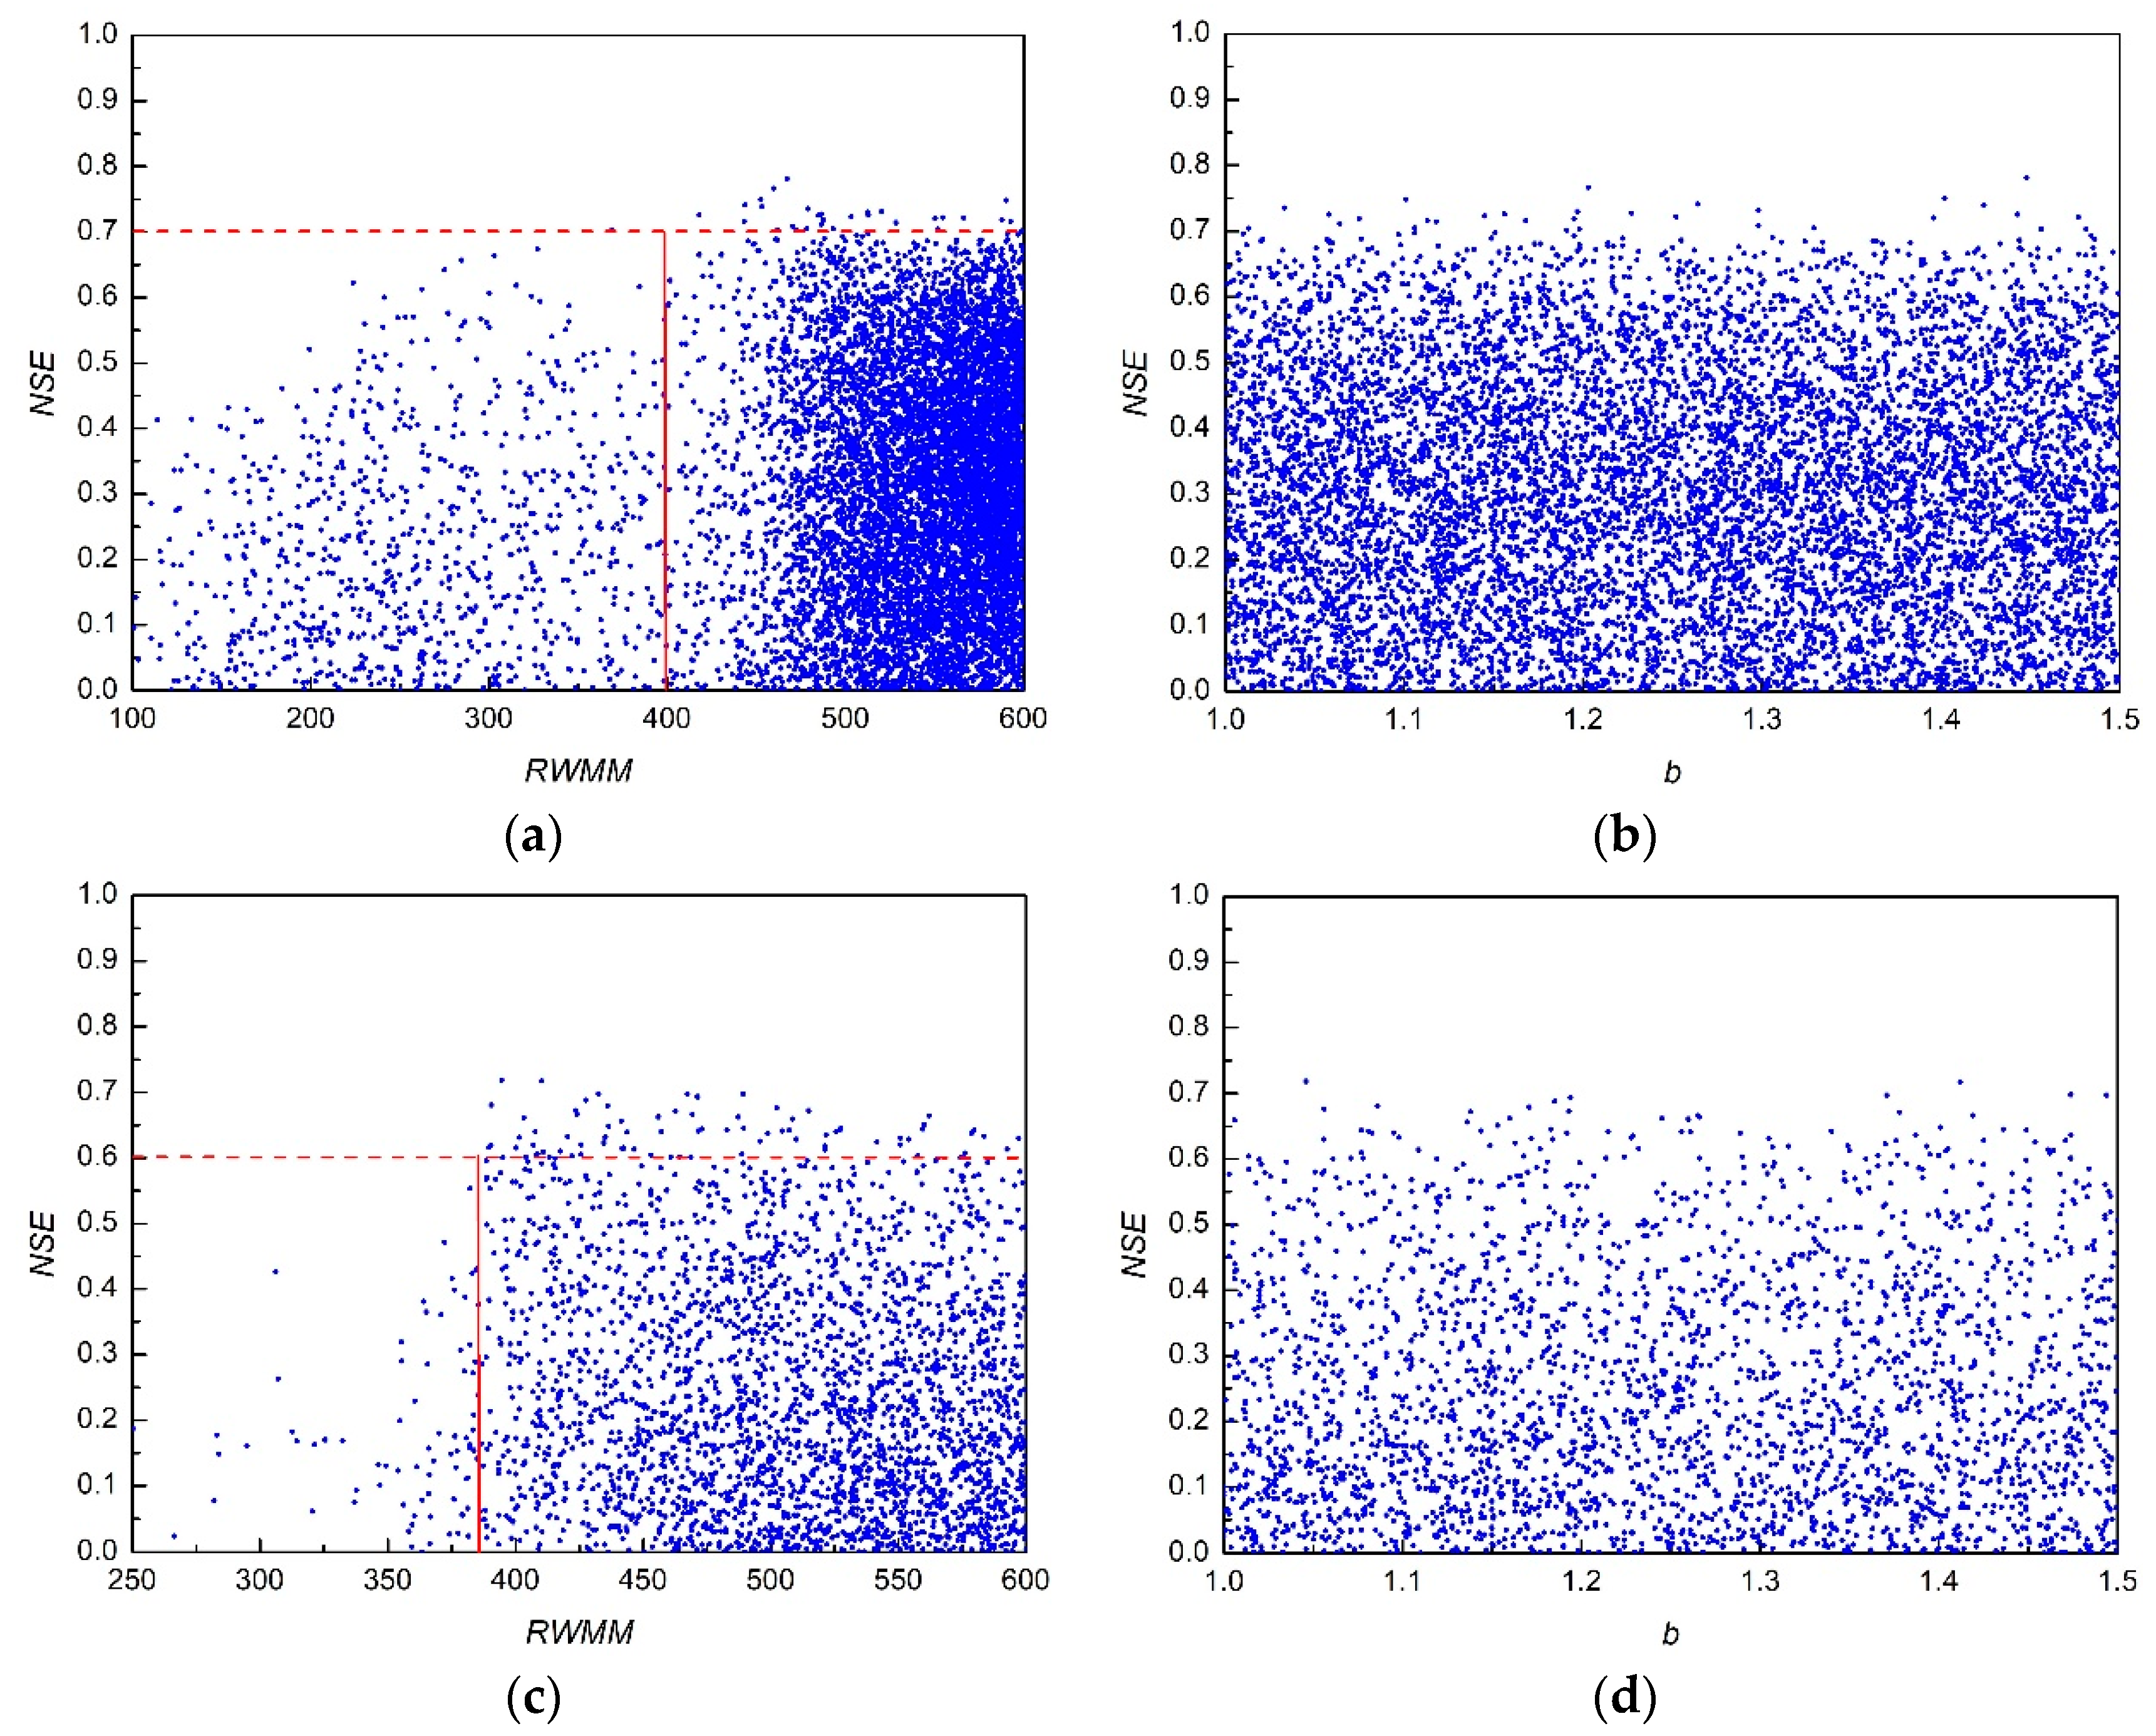
| RWMM | The averaged soil water storage capacity for the whole aeration zone | 300–600 | 458 | 374 |
| b | Exponent of the vertical distribution curve for relative water storage capacity | 1.0–1.4 | 1.3 | 1.2 |
| B | Exponent of the spatial distribution curve for relative water storage capacity | 0.1–0.4 | 0.17 | 0.24 |
| SM | Average free water storage capacity | 10–60 | 35 | 43 |
| EX | Exponent of the free water storage capacity curve | 1.0–1.5 | 1.1 | 1.1 |
| KI | Outflow coefficient of the free water storage to interflow | 0.1–0.8 | 0.26 | 0.12 |
| KG | Outflow coefficient of the free water storage to groundwater | KI + KG = 0.8 | 0.54 | 0.68 |
| CS | Recession constant of the surface water | 0.5–0.990 | 0.900 | 0.978 |
| CI | Recession constant of the lower interflow storage | 0.5–0.999 | 0.979 | 0.933 |
| CG | Recession constant of the groundwater storage | 0.5–0.999 | 0.999 | 0.999 |
| KE | Parameter of Muskingum routing | 0–10 | 2.0 | 3.8 |
| XE | Parameter of Muskingum routing | 0–0.5 | 0.4 | 0.1 |
| Purpose | Flood Events | RRD (%) | RPF (%) | NSE | RMSE | PPTS(5) | PPTS(10) | PPTS(20) | |||||||
|---|---|---|---|---|---|---|---|---|---|---|---|---|---|---|---|
| XAJ | VLRM | XAJ | VLRM | XAJ | VLRM | XAJ | VLRM | XAJ | VLRM | XAJ | VLRM | XAJ | VLRM | ||
| Calibration | 710814 | −2.70 | −1.30 | −20.80 | −13.30 | 0.91 | 0.91 | 2.57 | 2.50 | 0.10 | 0.11 | 0.13 | 0.16 | 0.15 | 0.15 |
| 730819 | −11.80 | −10.00 | −25.00 | −14.50 | 0.75 | 0.70 | 37.91 | 41.82 | 0.09 | 0.07 | 0.17 | 0.17 | 0.25 | 0.28 | |
| 740731 | 5.10 | 3.00 | −38.60 | −29.70 | 0.88 | 0.89 | 20.28 | 19.26 | 0.22 | 0.17 | 0.16 | 0.18 | 0.13 | 0.16 | |
| 760717 | 1.40 | −2.20 | 15.10 | 0.30 | 0.89 | 0.90 | 9.35 | 8.76 | 0.18 | 0.04 | 0.12 | 0.12 | 0.09 | 0.14 | |
| 770702 | −0.90 | 0.60 | −16.60 | −11.20 | 0.59 | 0.54 | 7.61 | 8.03 | 0.22 | 0.21 | 0.23 | 0.22 | 0.18 | 0.18 | |
| 780825 | 13.20 | 7.20 | −4.70 | −0.10 | 0.61 | 0.82 | 48.46 | 32.98 | 0.15 | 0.14 | 0.23 | 0.21 | 0.35 | 0.28 | |
| 790814 | 2.90 | 0.60 | 0.50 | 0.40 | 0.95 | 0.92 | 11.51 | 14.47 | 0.06 | 0.06 | 0.05 | 0.07 | 0.06 | 0.11 | |
| 860703 | 16.00 | 14.80 | −31.30 | −22.50 | 0.81 | 0.87 | 7.18 | 5.90 | 0.19 | 0.21 | 0.18 | 0.28 | 0.17 | 0.28 | |
| 880801 | −7.10 | −15.00 | −4.90 | 0.00 | 0.88 | 0.78 | 13.06 | 17.94 | 0.09 | 0.12 | 0.11 | 0.13 | 0.14 | 0.16 | |
| Validation | 950722 | −24.20 | −26.50 | 15.30 | 14.00 | −0.25 | −0.22 | 25.02 | 24.71 | 0.25 | 0.24 | 0.29 | 0.31 | 0.28 | 0.31 |
| 960727 | 9.50 | −9.40 | 24.10 | 6.70 | 0.95 | 0.95 | 38.85 | 38.77 | 0.17 | 0.07 | 0.16 | 0.19 | 0.19 | 0.21 | |
| 980704 | 103.60 | 12.40 | 81.40 | −6.60 | −0.65 | 0.87 | 29.36 | 8.23 | 0.87 | 0.14 | 0.95 | 0.19 | 1.12 | 0.30 | |
| 000703 | 143.70 | 11.20 | 110.70 | −1.10 | −3.47 | 0.76 | 119.19 | 27.36 | 1.38 | 0.12 | 1.27 | 0.18 | 1.07 | 0.31 | |
| 040810 | −3.50 | 9.70 | −38.00 | 0.00 | 0.81 | 0.85 | 13.82 | 12.16 | 0.32 | 0.21 | 0.22 | 0.16 | 0.18 | 0.13 | |
| 120721 | 42.90 | 43.80 | −37.90 | −30.90 | 0.70 | 0.71 | 212.68 | 210.34 | 0.28 | 0.26 | 0.32 | 0.36 | 0.62 | 0.70 | |
| Title | Flood events | RRD (%) | RPF (%) | NSE | RMSE | PPTS(5) | PPTS(10) | PPTS(20) | |||||||
|---|---|---|---|---|---|---|---|---|---|---|---|---|---|---|---|
| XAJ | VLRM | XAJ | VLRM | XAJ | VLRM | XAJ | VLRM | XAJ | VLRM | XAJ | VLRM | XAJ | VLRM | ||
| Calibration | 670710 | −10.00 | −9.20 | −9.80 | −6.70 | 0.80 | 0.71 | 1.00 | 1.19 | 0.06 | 0.08 | 0.09 | 0.11 | 0.10 | 0.16 |
| 670909 | −3.20 | −1.00 | −9.80 | −13.40 | 0.86 | 0.90 | 3.84 | 3.22 | 0.13 | 0.15 | 0.12 | 0.13 | 0.11 | 0.09 | |
| 680711 | 2.20 | 6.90 | −36.60 | −34.30 | 0.83 | 0.84 | 6.38 | 6.16 | 0.27 | 0.25 | 0.17 | 0.19 | 0.20 | 0.22 | |
| 680720 | −4.10 | −7.10 | −25.90 | −23.40 | 0.70 | 0.64 | 2.74 | 3.01 | 0.28 | 0.34 | 0.18 | 0.23 | 0.13 | 0.16 | |
| 690920 | −7.70 | −2.80 | 12.60 | 9.70 | 0.70 | 0.62 | 2.80 | 3.12 | 0.10 | 0.06 | 0.07 | 0.09 | 0.07 | 0.13 | |
| 700723 | 3.60 | 6.20 | −11.10 | −12.90 | 0.85 | 0.86 | 7.65 | 7.39 | 0.10 | 0.12 | 0.14 | 0.16 | 0.15 | 0.14 | |
| 700805 | 0.40 | 3.60 | −16.90 | −12.10 | 0.90 | 0.90 | 3.45 | 3.57 | 0.15 | 0.11 | 0.12 | 0.08 | 0.08 | 0.07 | |
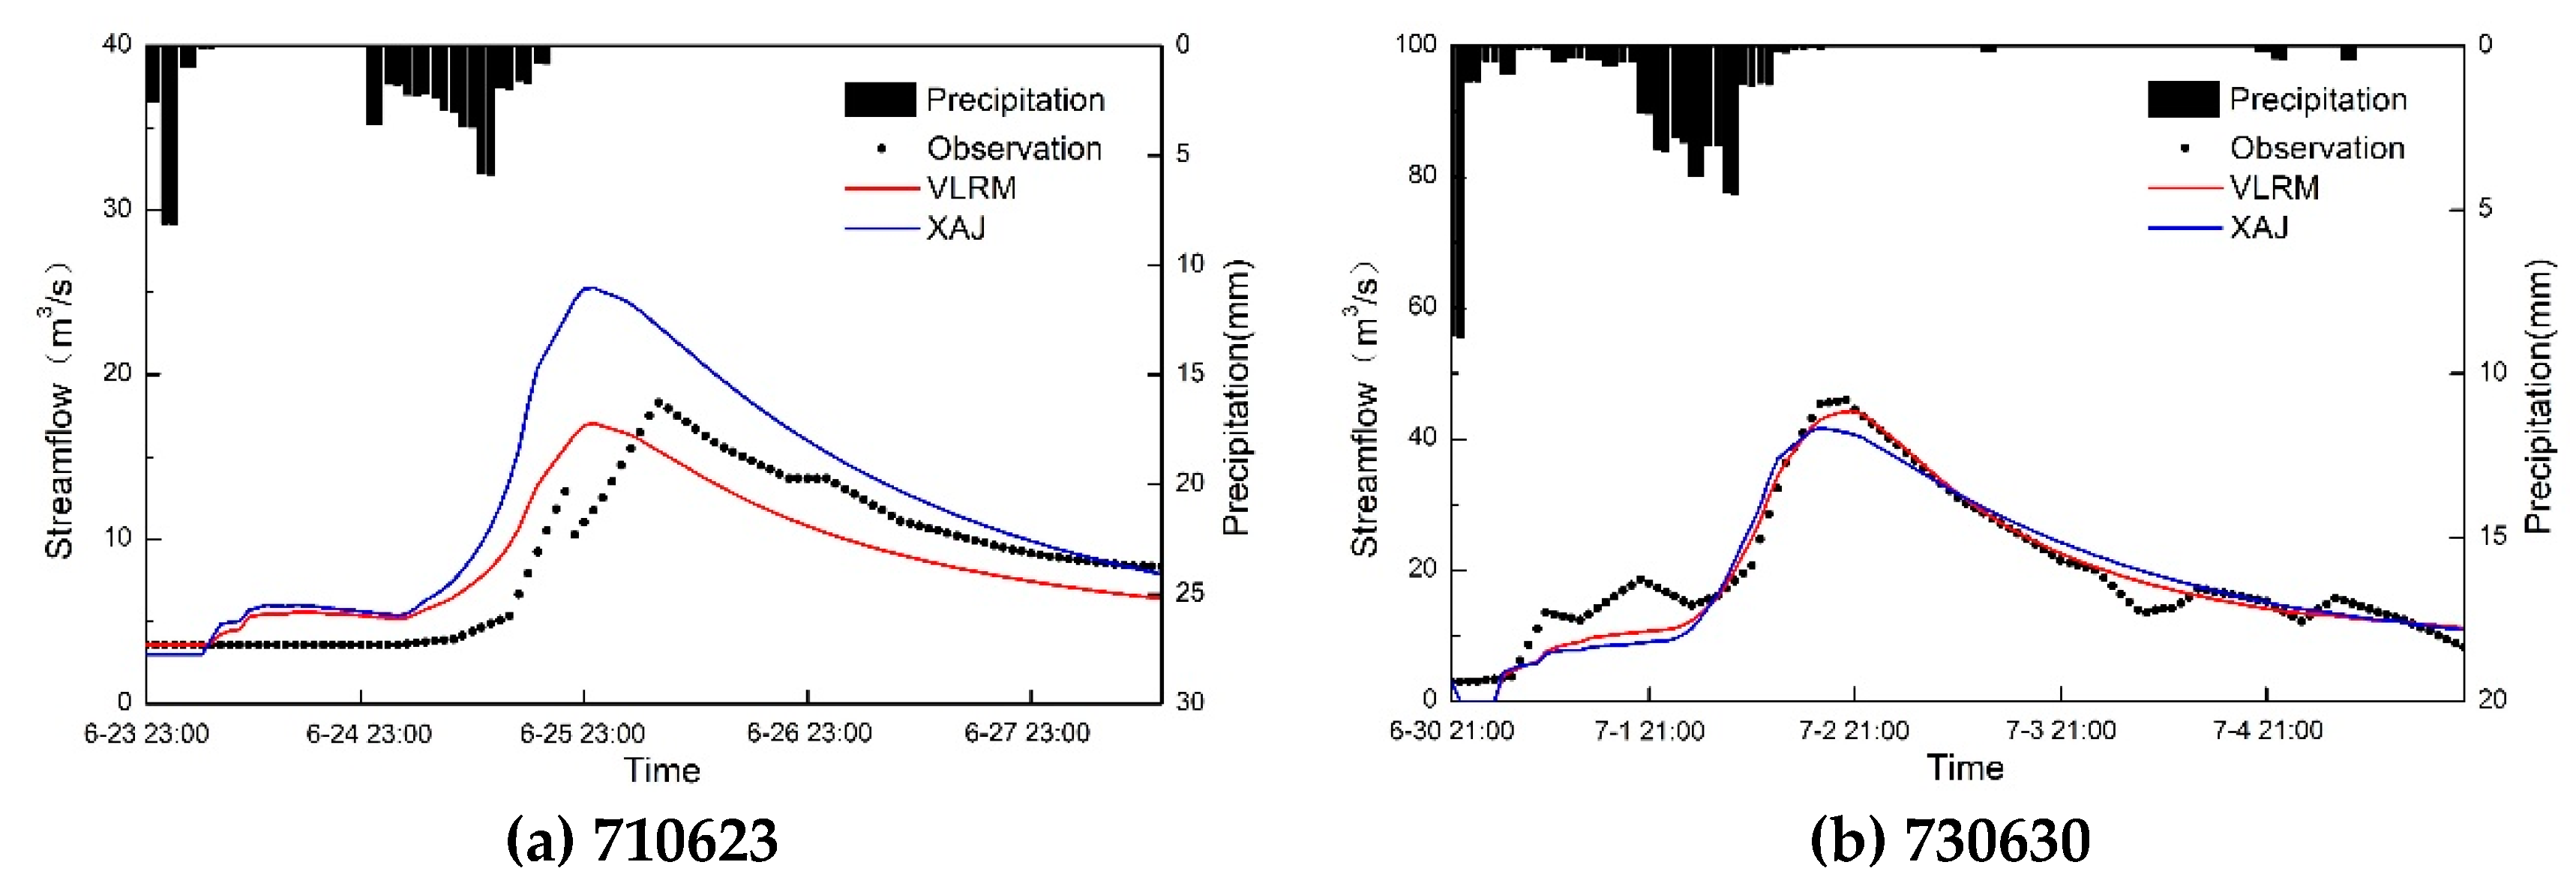
| 710623 | 33.90 | −2.90 | 38.30 | −6.70 | −0.09 | 0.68 | 4.77 | 2.57 | 0.27 | 0.15 | 0.32 | 0.13 | 0.29 | 0.16 | |
| 710628 | 4.90 | 3.30 | −33.10 | −21.60 | 0.63 | 0.79 | 5.44 | 4.11 | 0.30 | 0.20 | 0.25 | 0.16 | 0.16 | 0.16 | |
| 720831 | −13.50 | −7.40 | −5.80 | −2.90 | 0.86 | 0.92 | 5.76 | 4.19 | 0.08 | 0.05 | 0.10 | 0.07 | 0.09 | 0.07 | |
| 730630 | −3.10 | −3.60 | −9.20 | −3.60 | 0.89 | 0.94 | 3.60 | 2.68 | 0.09 | 0.03 | 0.07 | 0.02 | 0.05 | 0.02 | |
| 730718 | 1.00 | −4.70 | −18.30 | −23.60 | 0.61 | 0.60 | 6.85 | 6.92 | 0.29 | 0.33 | 0.22 | 0.27 | 0.20 | 0.23 | |
| 740806 | 1.40 | −2.70 | 9.40 | −5.90 | 0.82 | 0.79 | 7.08 | 7.61 | 0.31 | 0.35 | 0.26 | 0.30 | 0.26 | 0.22 | |
| 750707 | 5.20 | 6.40 | −9.10 | −8.00 | 0.92 | 0.91 | 3.17 | 3.34 | 0.10 | 0.08 | 0.09 | 0.09 | 0.07 | 0.07 | |
| 750804 | 4.10 | 10.20 | −8.20 | −9.60 | 0.95 | 0.94 | 4.18 | 4.62 | 0.11 | 0.12 | 0.10 | 0.10 | 0.08 | 0.09 | |
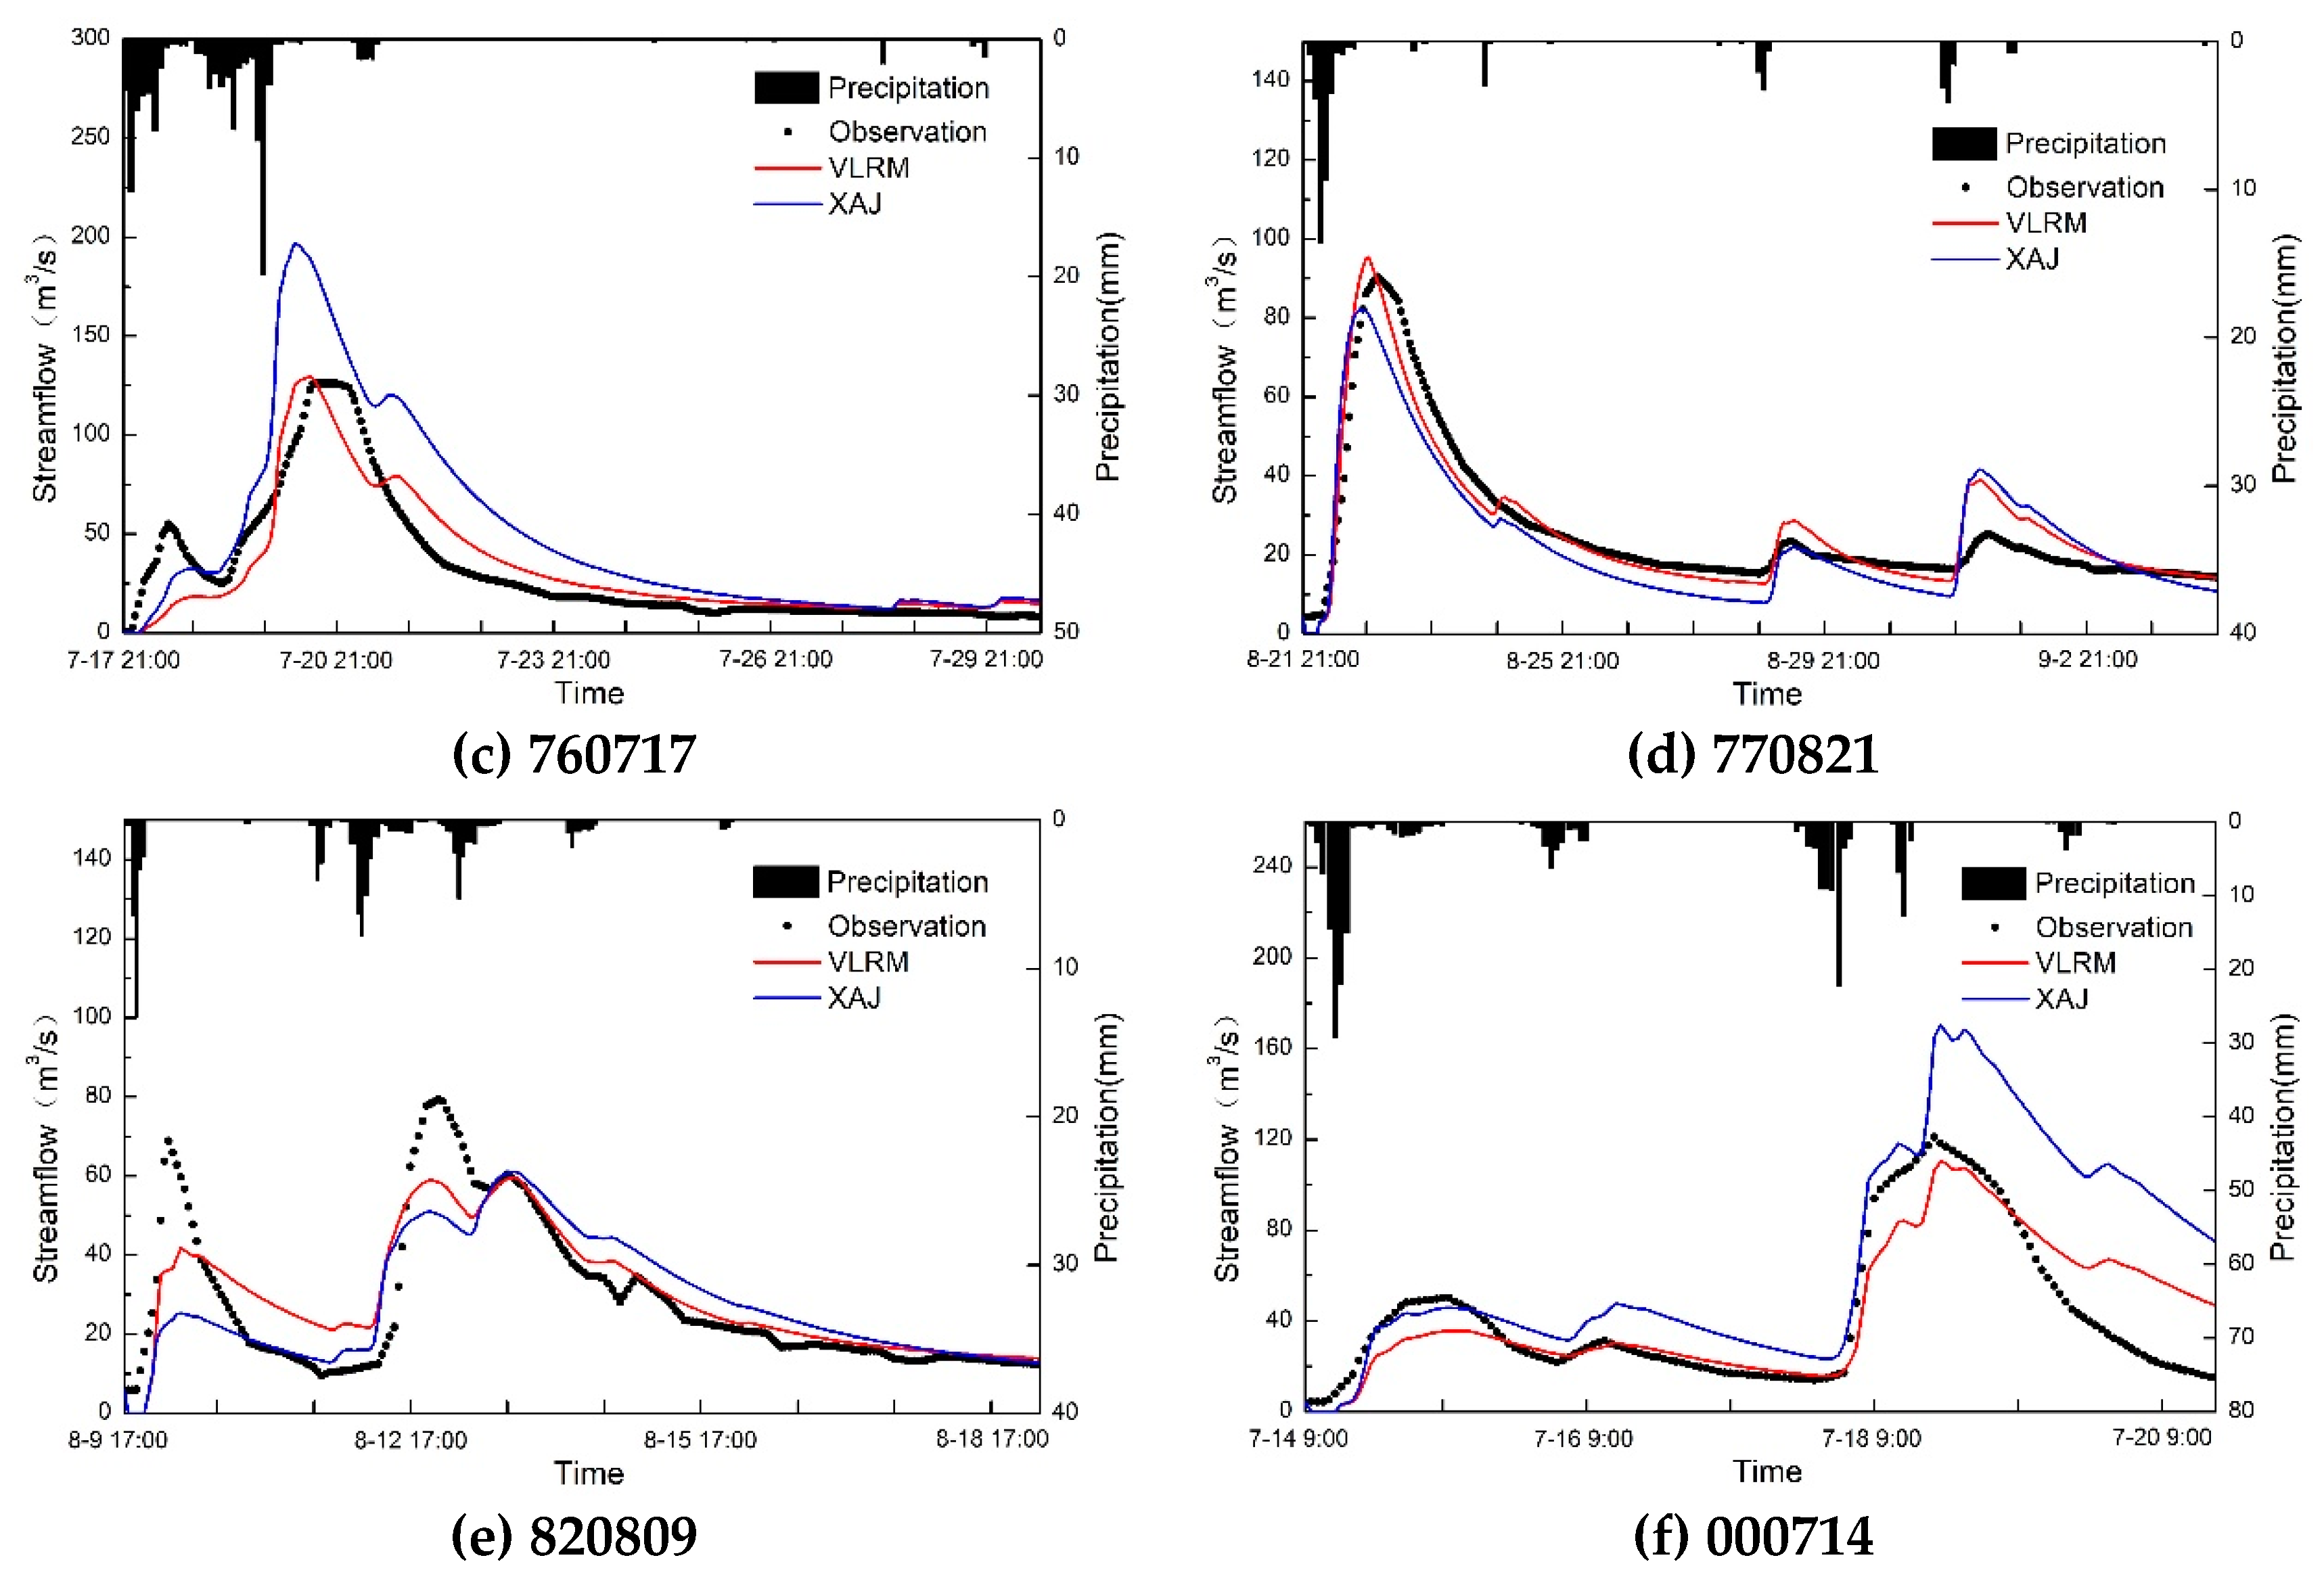
| 760717 | 55.70 | 4.10 | 56.30 | 2.70 | 0.14 | 0.82 | 29.46 | 13.39 | 0.25 | 0.16 | 0.45 | 0.19 | 0.58 | 0.27 | |
| 760805 | −2.80 | 1.40 | −2.20 | 3.50 | 0.96 | 0.98 | 2.98 | 2.41 | 0.05 | 0.05 | 0.06 | 0.04 | 0.06 | 0.04 | |
| 760817 | −4.00 | −4.20 | −21.20 | −14.40 | 0.23 | 0.35 | 2.92 | 2.67 | 0.20 | 0.15 | 0.19 | 0.13 | 0.14 | 0.10 | |
| 760820 | −1.70 | −3.90 | 4.80 | 14.50 | 0.92 | 0.82 | 3.06 | 4.40 | 0.08 | 0.10 | 0.11 | 0.14 | 0.11 | 0.16 | |
| 770624 | 0.00 | −0.20 | −11.10 | −6.40 | 0.84 | 0.90 | 7.05 | 5.71 | 0.20 | 0.15 | 0.18 | 0.17 | 0.18 | 0.17 | |
| 670710 | −10.00 | −9.20 | −9.80 | −6.70 | 0.80 | 0.71 | 1.00 | 1.19 | 0.06 | 0.08 | 0.09 | 0.11 | 0.10 | 0.16 | |
| Validation | 770710 | −4.30 | −6.30 | −10.50 | −8.10 | 0.82 | 0.71 | 6.23 | 7.88 | 0.12 | 0.17 | 0.10 | 0.15 | 0.12 | 0.18 |
| 770725 | −0.10 | 1.40 | −10.00 | 5.20 | 0.82 | 0.85 | 7.97 | 7.21 | 0.12 | 0.05 | 0.14 | 0.05 | 0.12 | 0.06 | |
| 770821 | −8.90 | 2.20 | −9.30 | 5.30 | 0.79 | 0.90 | 8.47 | 5.70 | 0.17 | 0.11 | 0.20 | 0.15 | 0.21 | 0.15 | |
| 780701 | 0.20 | −1.30 | 1.80 | −8.60 | 0.86 | 0.88 | 2.73 | 2.50 | 0.10 | 0.12 | 0.12 | 0.12 | 0.12 | 0.10 | |
| 780727 | 8.00 | 9.40 | −16.00 | −14.80 | 0.89 | 0.89 | 5.31 | 5.35 | 0.20 | 0.18 | 0.15 | 0.13 | 0.12 | 0.10 | |
| 820809 | −0.60 | 4.70 | −23.00 | −24.80 | 0.63 | 0.78 | 11.55 | 8.93 | 0.37 | 0.26 | 0.36 | 0.24 | 0.25 | 0.15 | |
| 830907 | −10.80 | −7.50 | −9.70 | −7.50 | 0.80 | 0.86 | 4.55 | 3.78 | 0.08 | 0.06 | 0.11 | 0.10 | 0.16 | 0.16 | |
| 850913 | −4.50 | −3.80 | −7.10 | −6.70 | 0.91 | 0.82 | 3.70 | 5.12 | 0.06 | 0.05 | 0.04 | 0.04 | 0.05 | 0.08 | |
| 960802 | 14.30 | 5.00 | 17.80 | 11.70 | 0.83 | 0.85 | 19.38 | 17.97 | 0.11 | 0.11 | 0.09 | 0.09 | 0.15 | 0.17 | |
| 000714 | 59.60 | 4.30 | 40.80 | −9.00 | −0.31 | 0.73 | 36.49 | 16.44 | 0.34 | 0.11 | 0.29 | 0.14 | 0.40 | 0.14 | |
© 2019 by the authors. Licensee MDPI, Basel, Switzerland. This article is an open access article distributed under the terms and conditions of the Creative Commons Attribution (CC BY) license (http://creativecommons.org/licenses/by/4.0/).
Share and Cite
Shi, P.; Yang, T.; Xu, C.-Y.; Yong, B.; Huang, C.-S.; Li, Z.; Qin, Y.; Wang, X.; Zhou, X.; Li, S. Rainfall–Runoff Processes and Modelling in Regions Characterized by Deficiency in Soil Water Storage. Water 2019, 11, 1858. https://doi.org/10.3390/w11091858
Shi P, Yang T, Xu C-Y, Yong B, Huang C-S, Li Z, Qin Y, Wang X, Zhou X, Li S. Rainfall–Runoff Processes and Modelling in Regions Characterized by Deficiency in Soil Water Storage. Water. 2019; 11(9):1858. https://doi.org/10.3390/w11091858
Chicago/Turabian StyleShi, Pengfei, Tao Yang, Chong-Yu Xu, Bin Yong, Ching-Sheng Huang, Zhenya Li, Youwei Qin, Xiaoyan Wang, Xudong Zhou, and Shu Li. 2019. "Rainfall–Runoff Processes and Modelling in Regions Characterized by Deficiency in Soil Water Storage" Water 11, no. 9: 1858. https://doi.org/10.3390/w11091858
APA StyleShi, P., Yang, T., Xu, C.-Y., Yong, B., Huang, C.-S., Li, Z., Qin, Y., Wang, X., Zhou, X., & Li, S. (2019). Rainfall–Runoff Processes and Modelling in Regions Characterized by Deficiency in Soil Water Storage. Water, 11(9), 1858. https://doi.org/10.3390/w11091858


