Algae Growth Distribution and Key Prevention and Control Positions for the Middle Route of the South-to-North Water Diversion Project


Abstract
1. Introduction
2. Materials and Methods
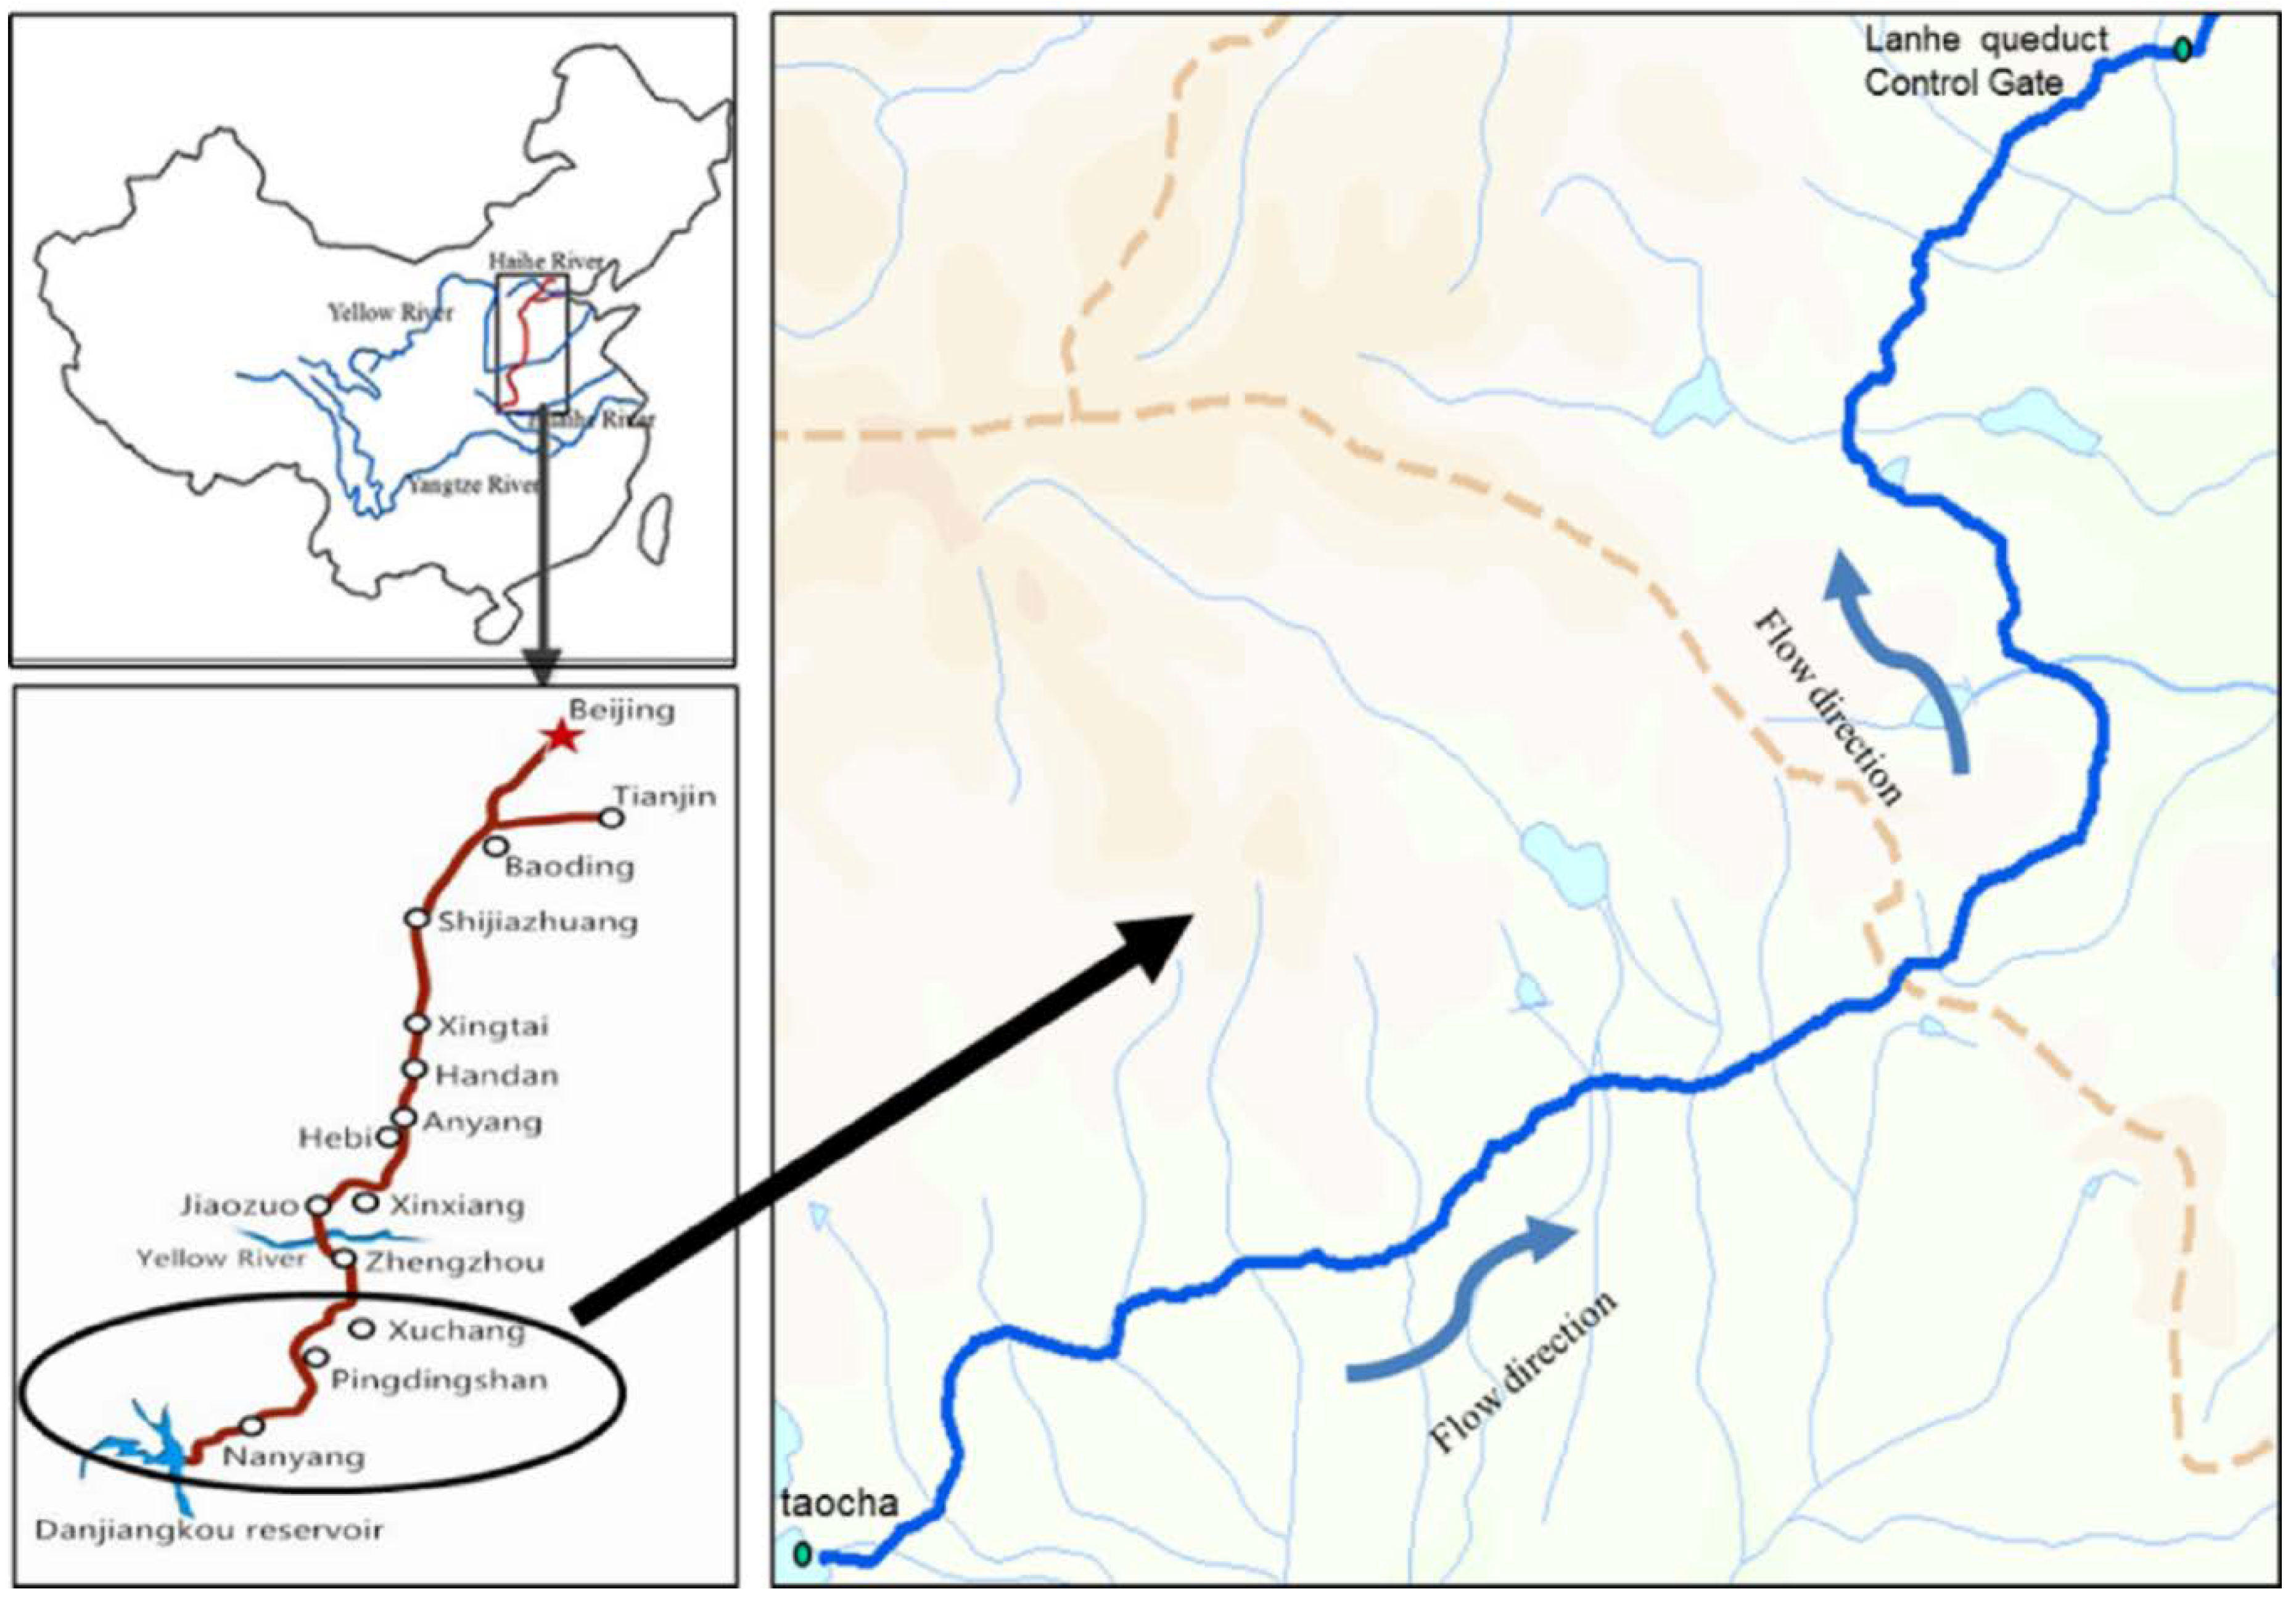
2.1. Study Area
- Long water delivery route: The total length of the main canal is 1432 km. The length from the head of the main canal to the south of the middle branch north of the Juma River is 1196.51 km, and an open canal is used for water diversion. A prestressed concrete cylinder pipe (PCCP) and underground culvert are used for water diversion in the Beijing section which has a total length of 80.05 km. The Tianjin water diversion branch line has a length of 155 km, and an underground culvert is used for the water diversion.
- Large-scale water diversion: The average annual water transfer of the MRP is 9.5 billion m3. For the main canal control points, Taocha has a design flow of 350 m3/s and an enlarged flow of 420 m3/s, while the head of the Tianjin main canal has a design flow of 50 m3/s and an enlarged flow of 60 m3/s. With regard to the general principle of water head distribution in the main canal, the design water levels of Taocha and Beijing Tuancheng Lake are taken as the control. The total water head is distributed among the open canals and buildings on both sides of the Yellow River. The main canal has a total water head of 98.81 m. The water heads are 29.38 m south of the Yellow River and 59.43 m north of the Yellow River. The section from Taocha to north of the Juma River uses an open canal to divert water and has a total water head of 87.08 m.
- Numerous buildings: the MRP has more than 1750 hydraulic structures of various types, including 97 diversion gates, 64 check gates, 54 exit sluices, 61 control gates, nine tunnels, and one pump station.
- Strict water-quality requirements: The main purpose of the MRP is to supply water for consumption and industry in areas with scarce water resources. Therefore, the water quality needs to satisfy the Type II requirements of China’s environmental quality standard for surface water (GB3838-2002).
2.2. Field Investigation and Model Building
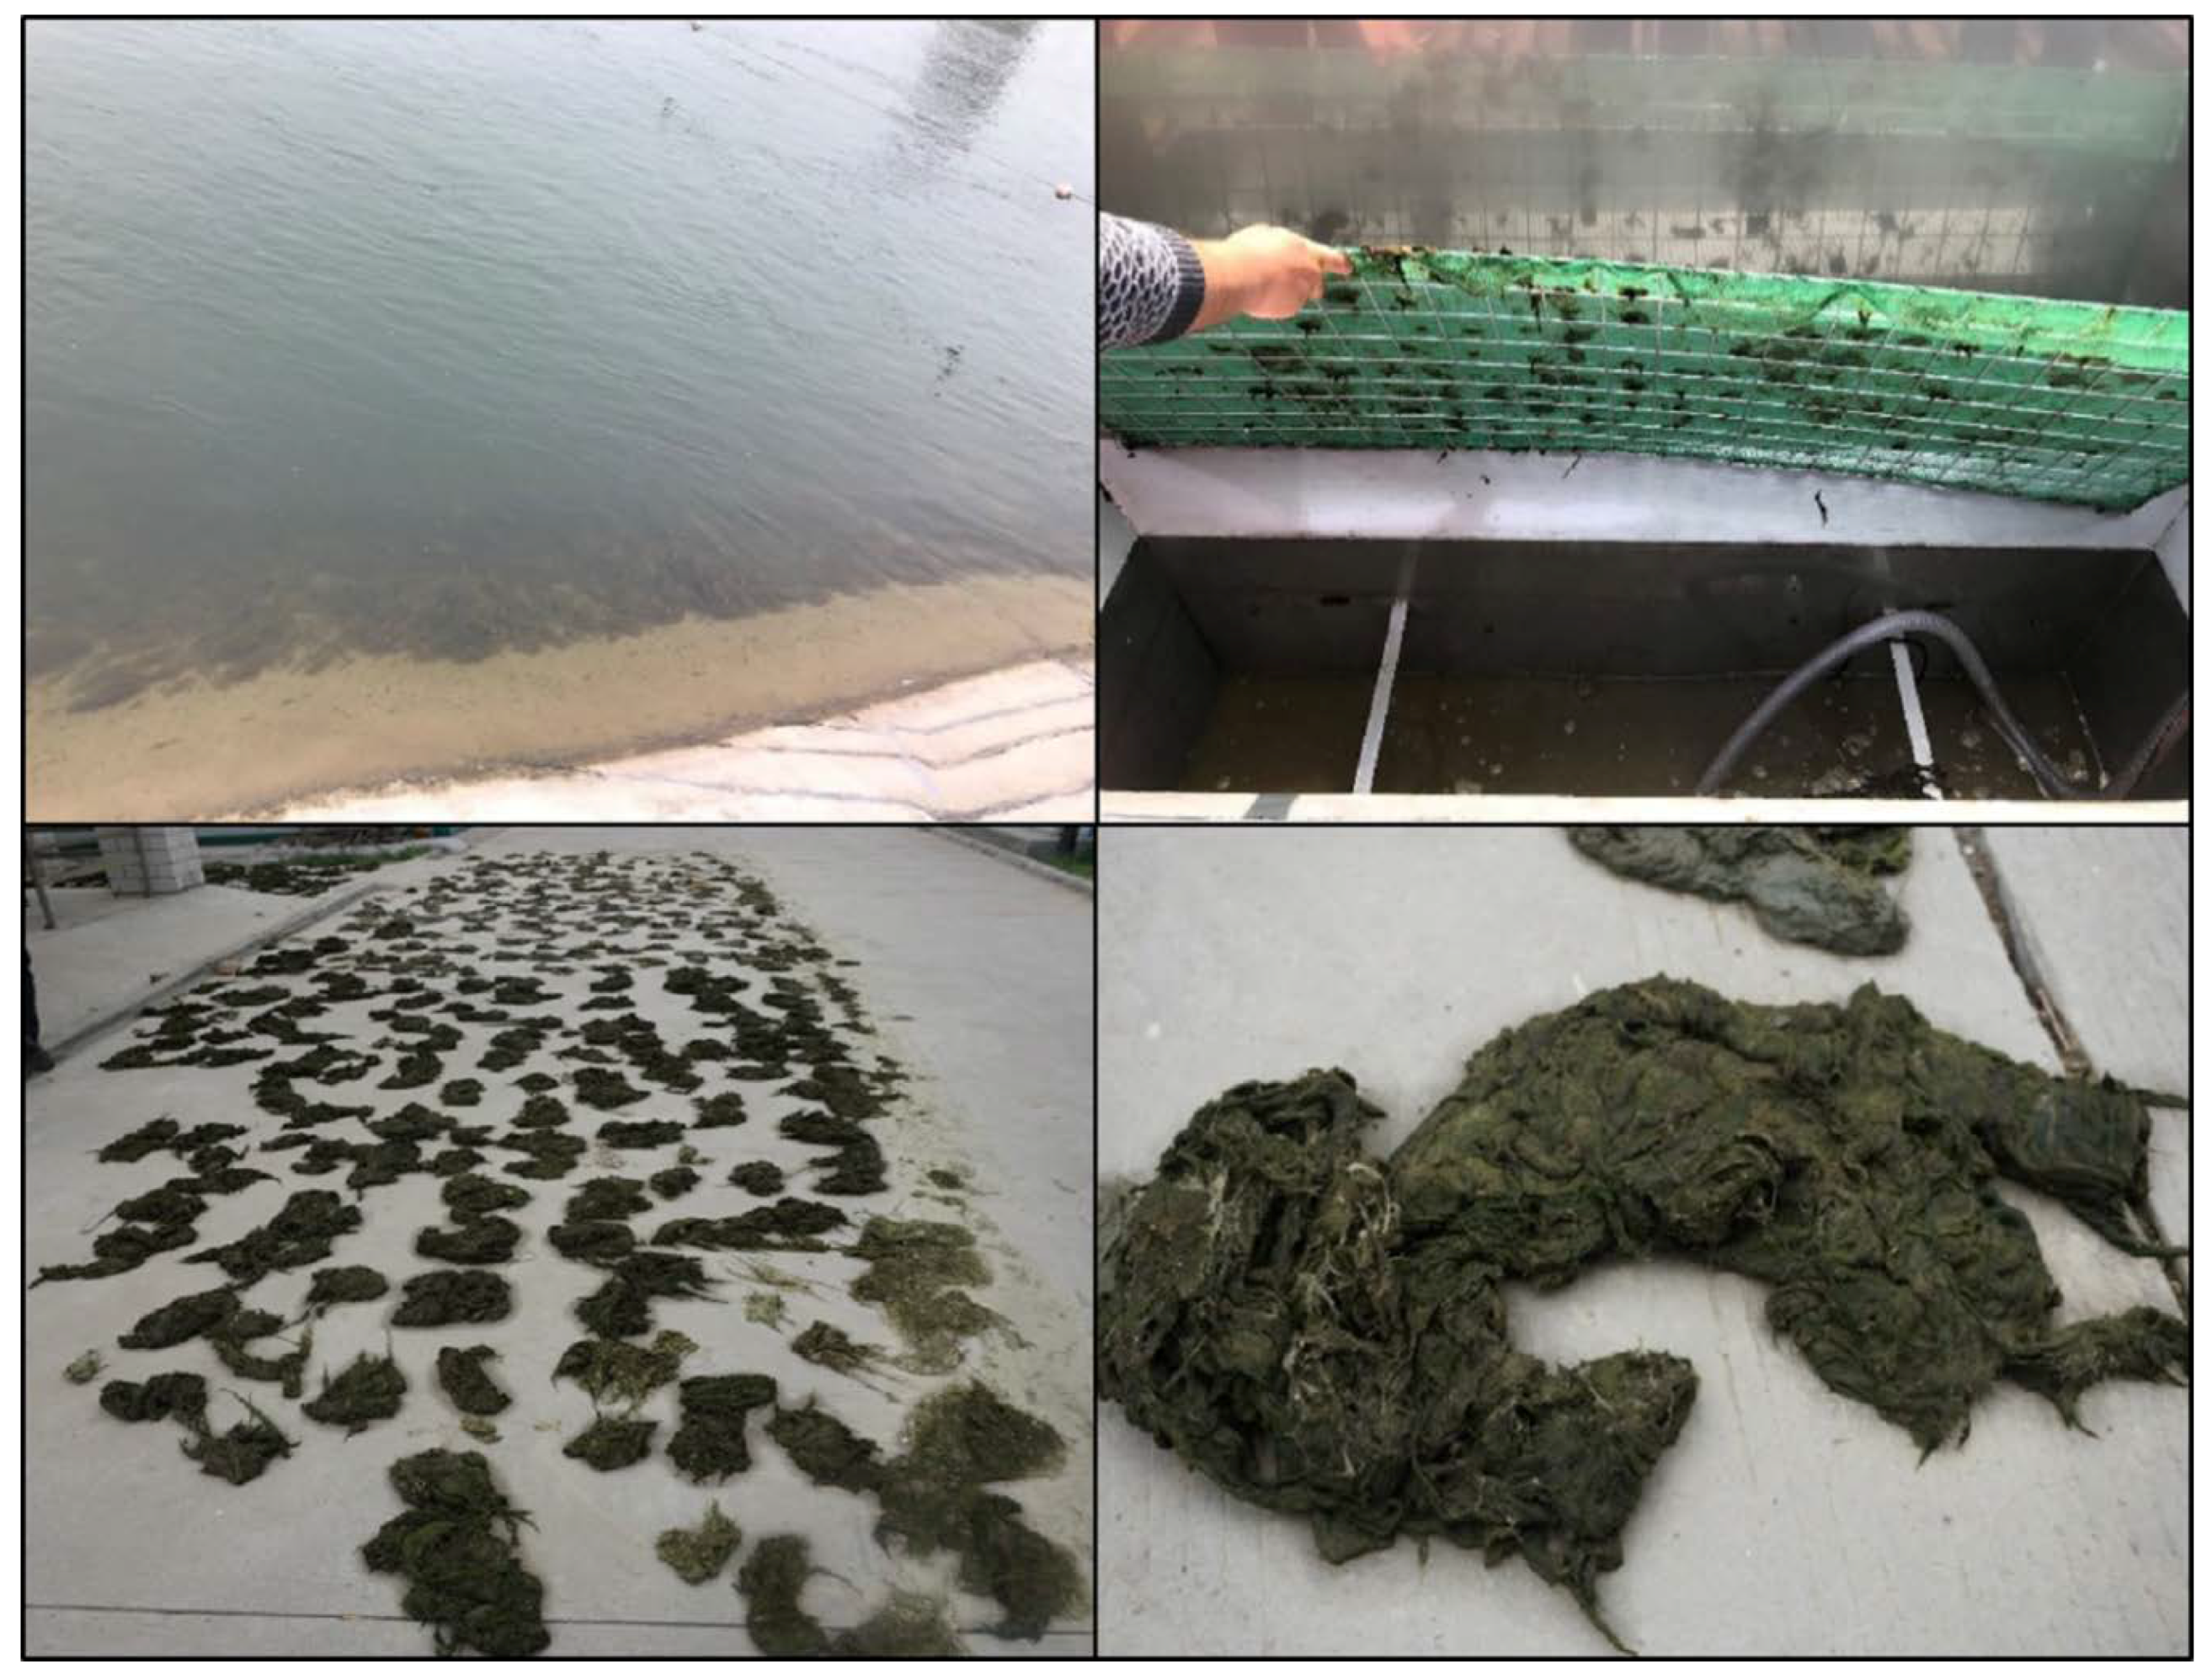
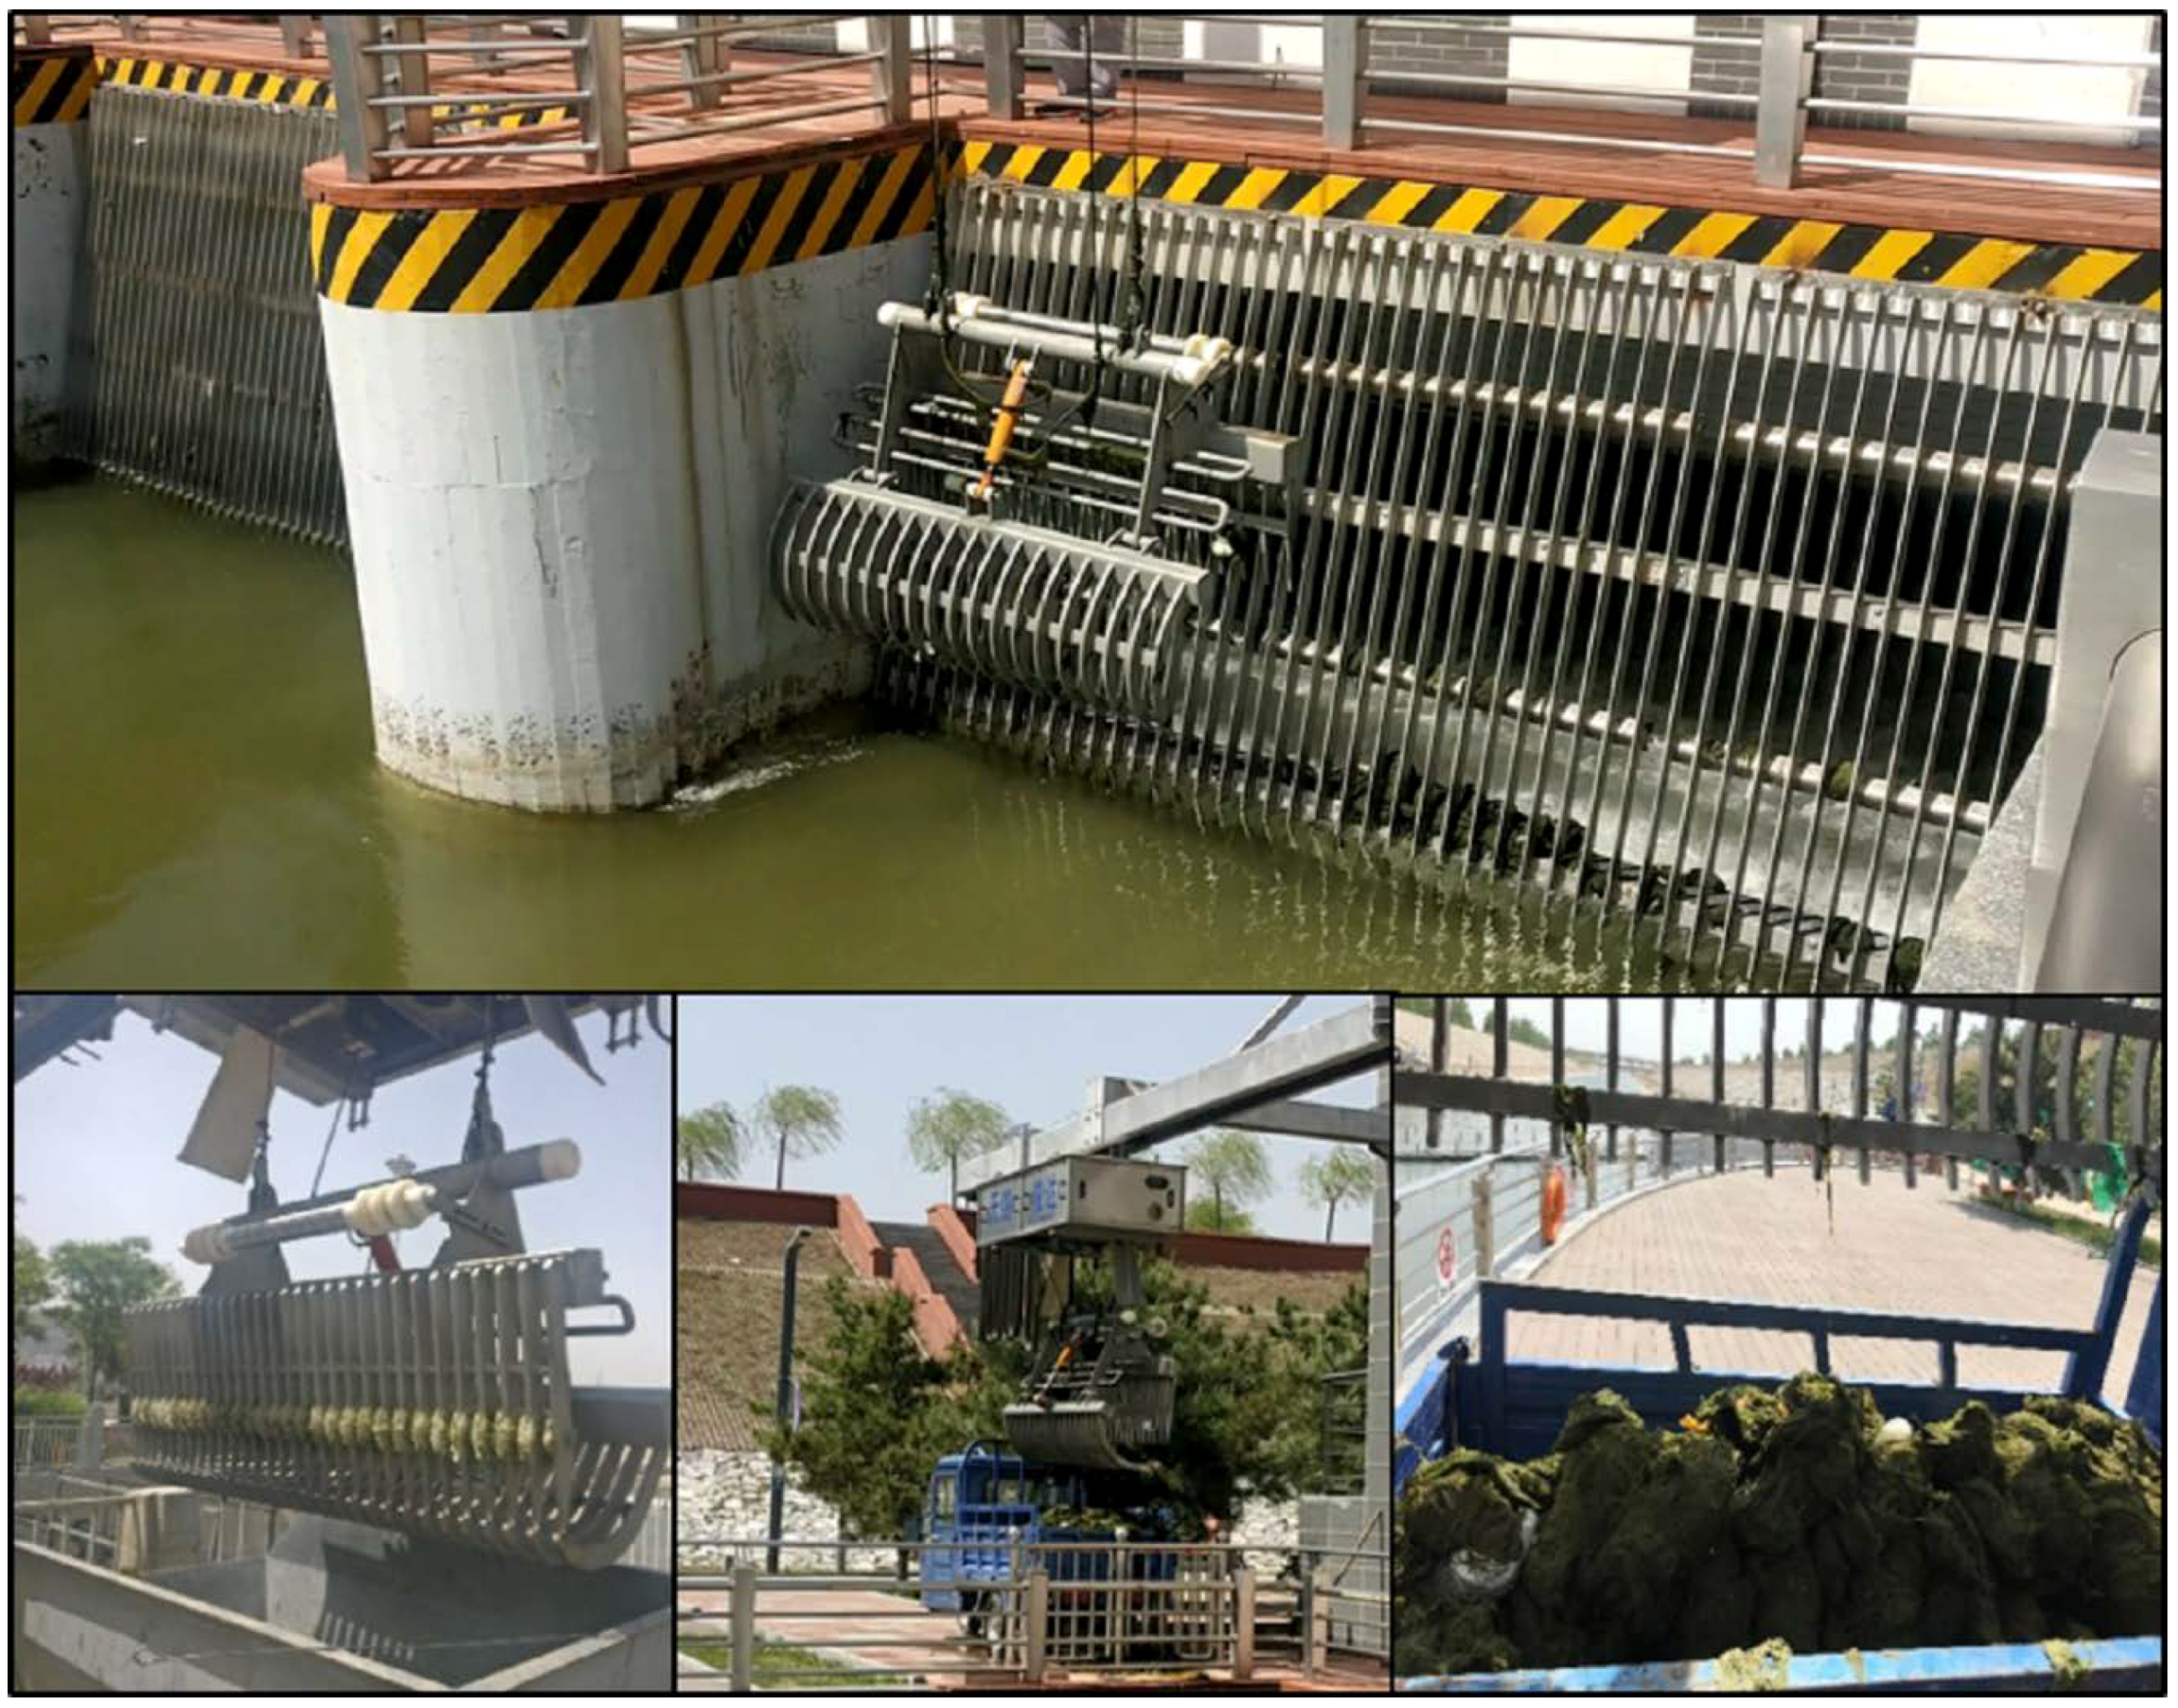
2.2.1. Field Investigation
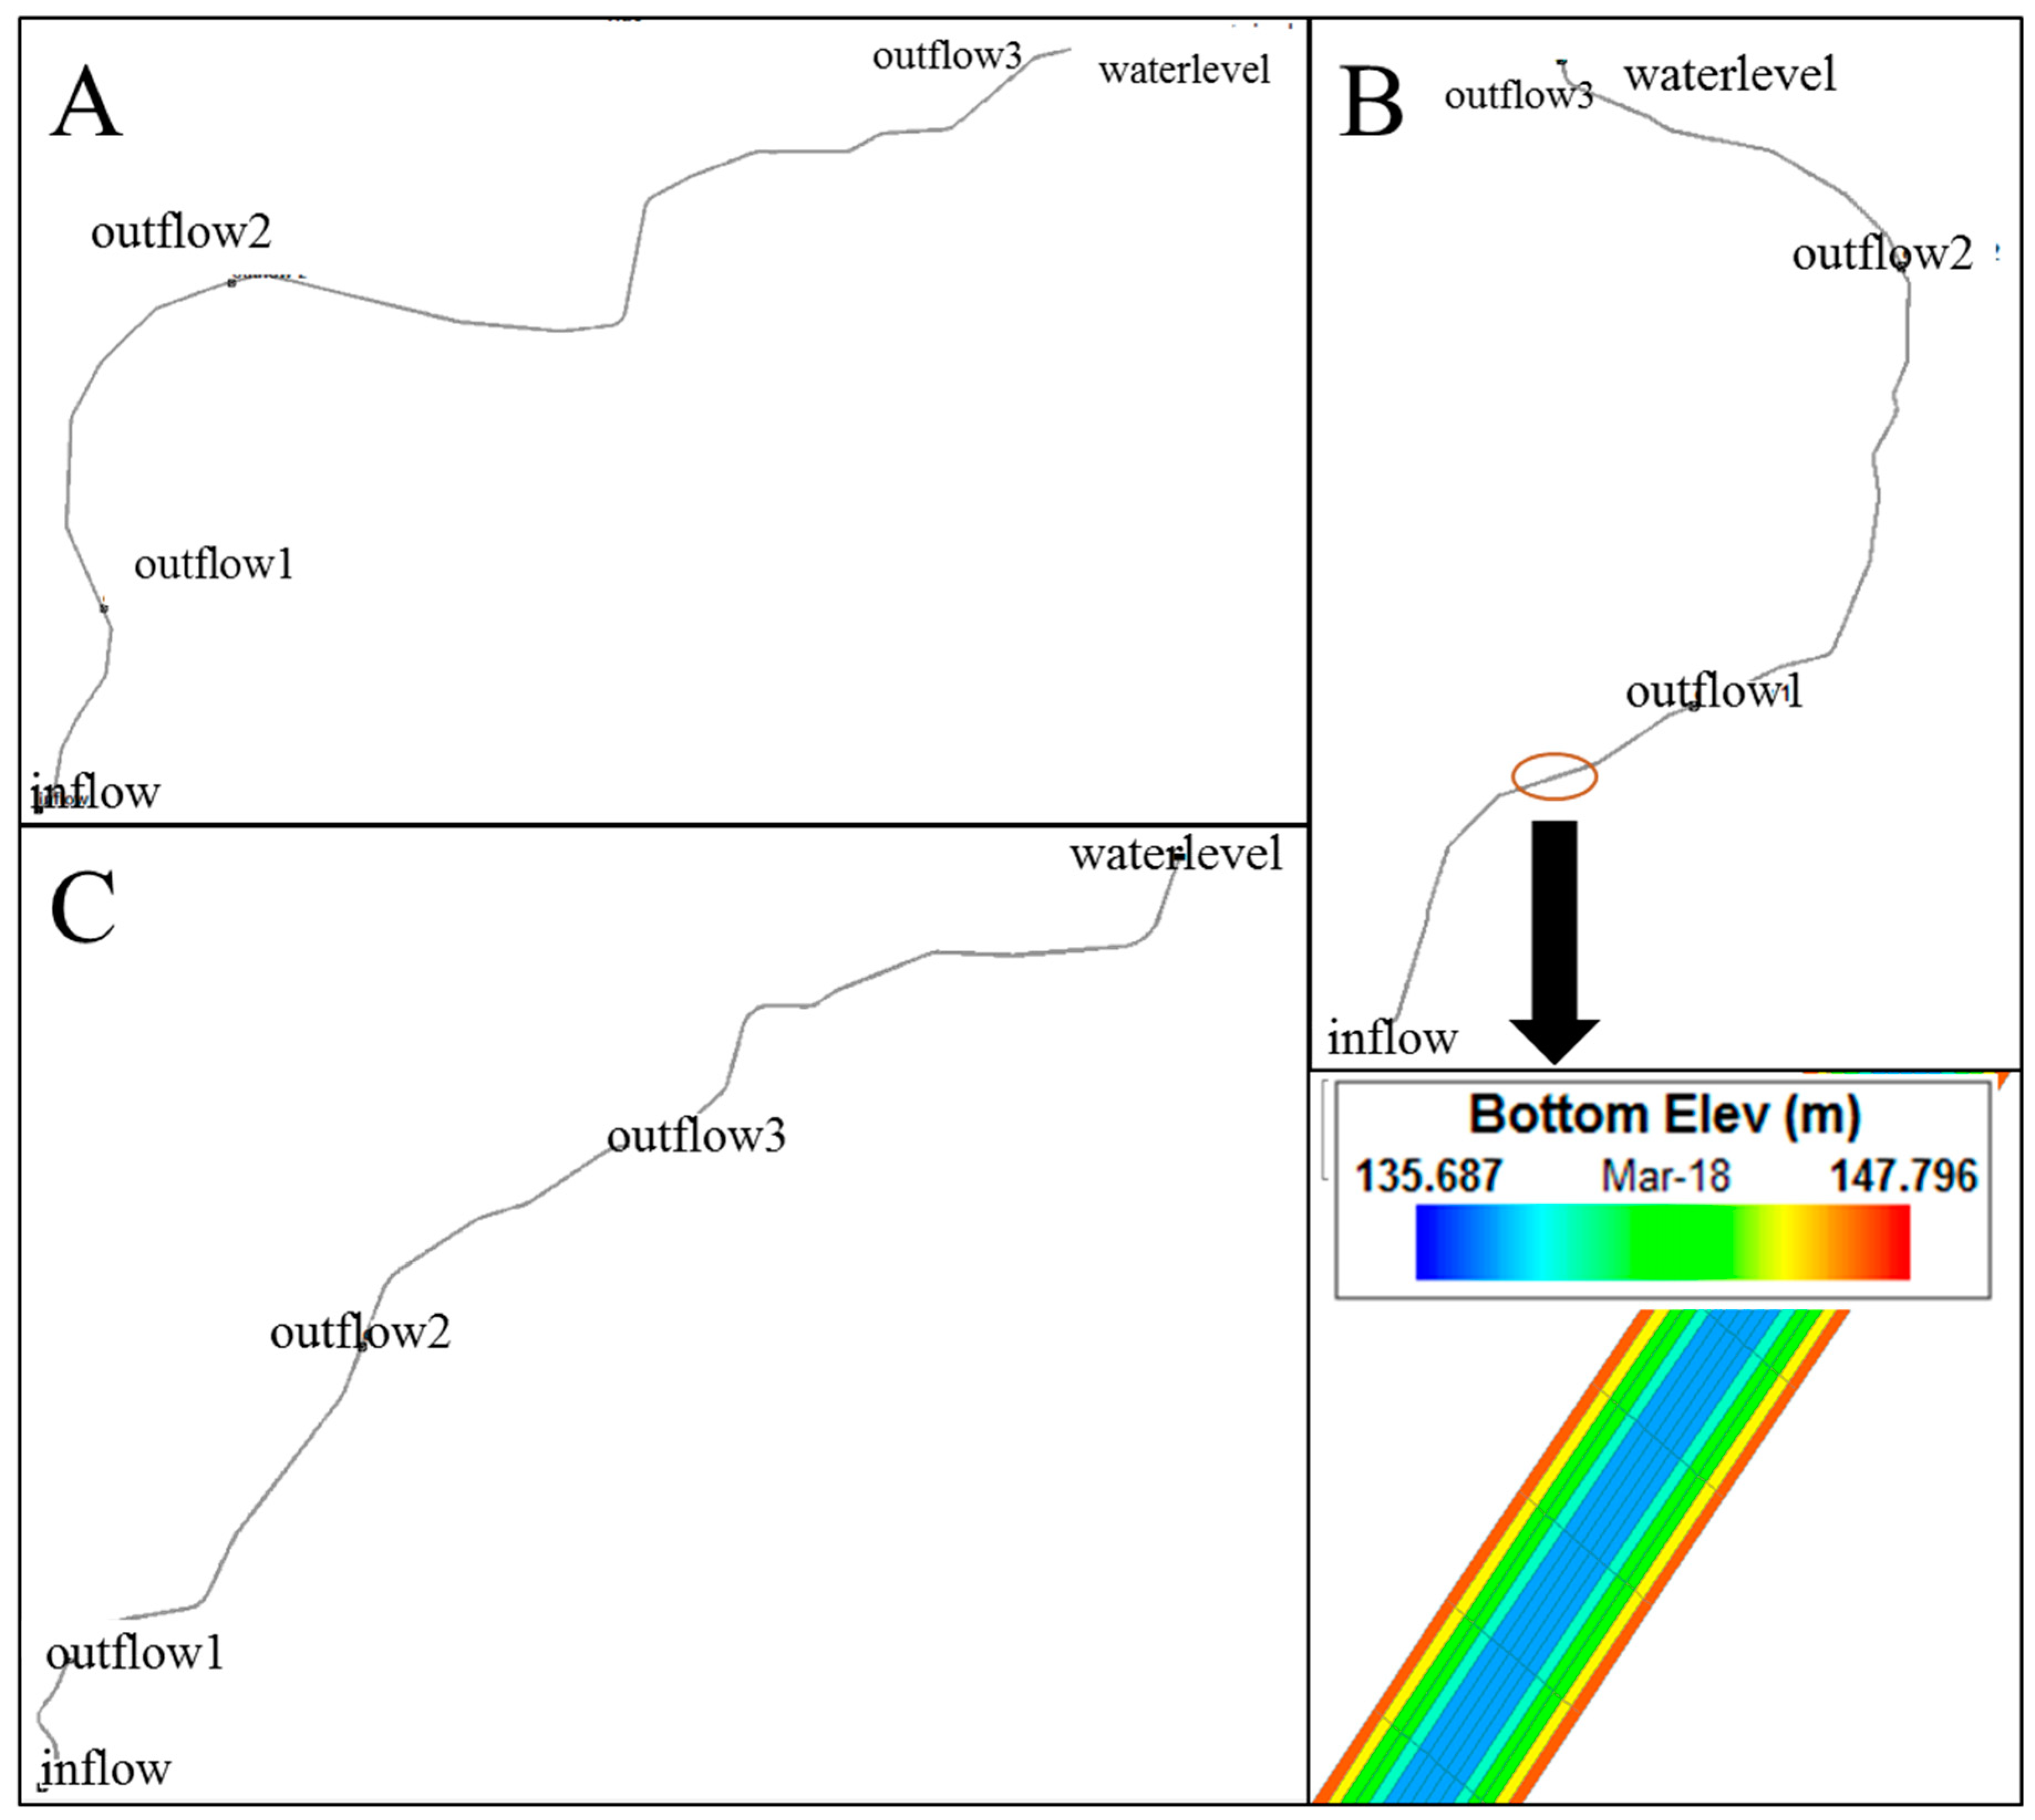
2.2.2. Modeling Area
2.2.3. Modeling
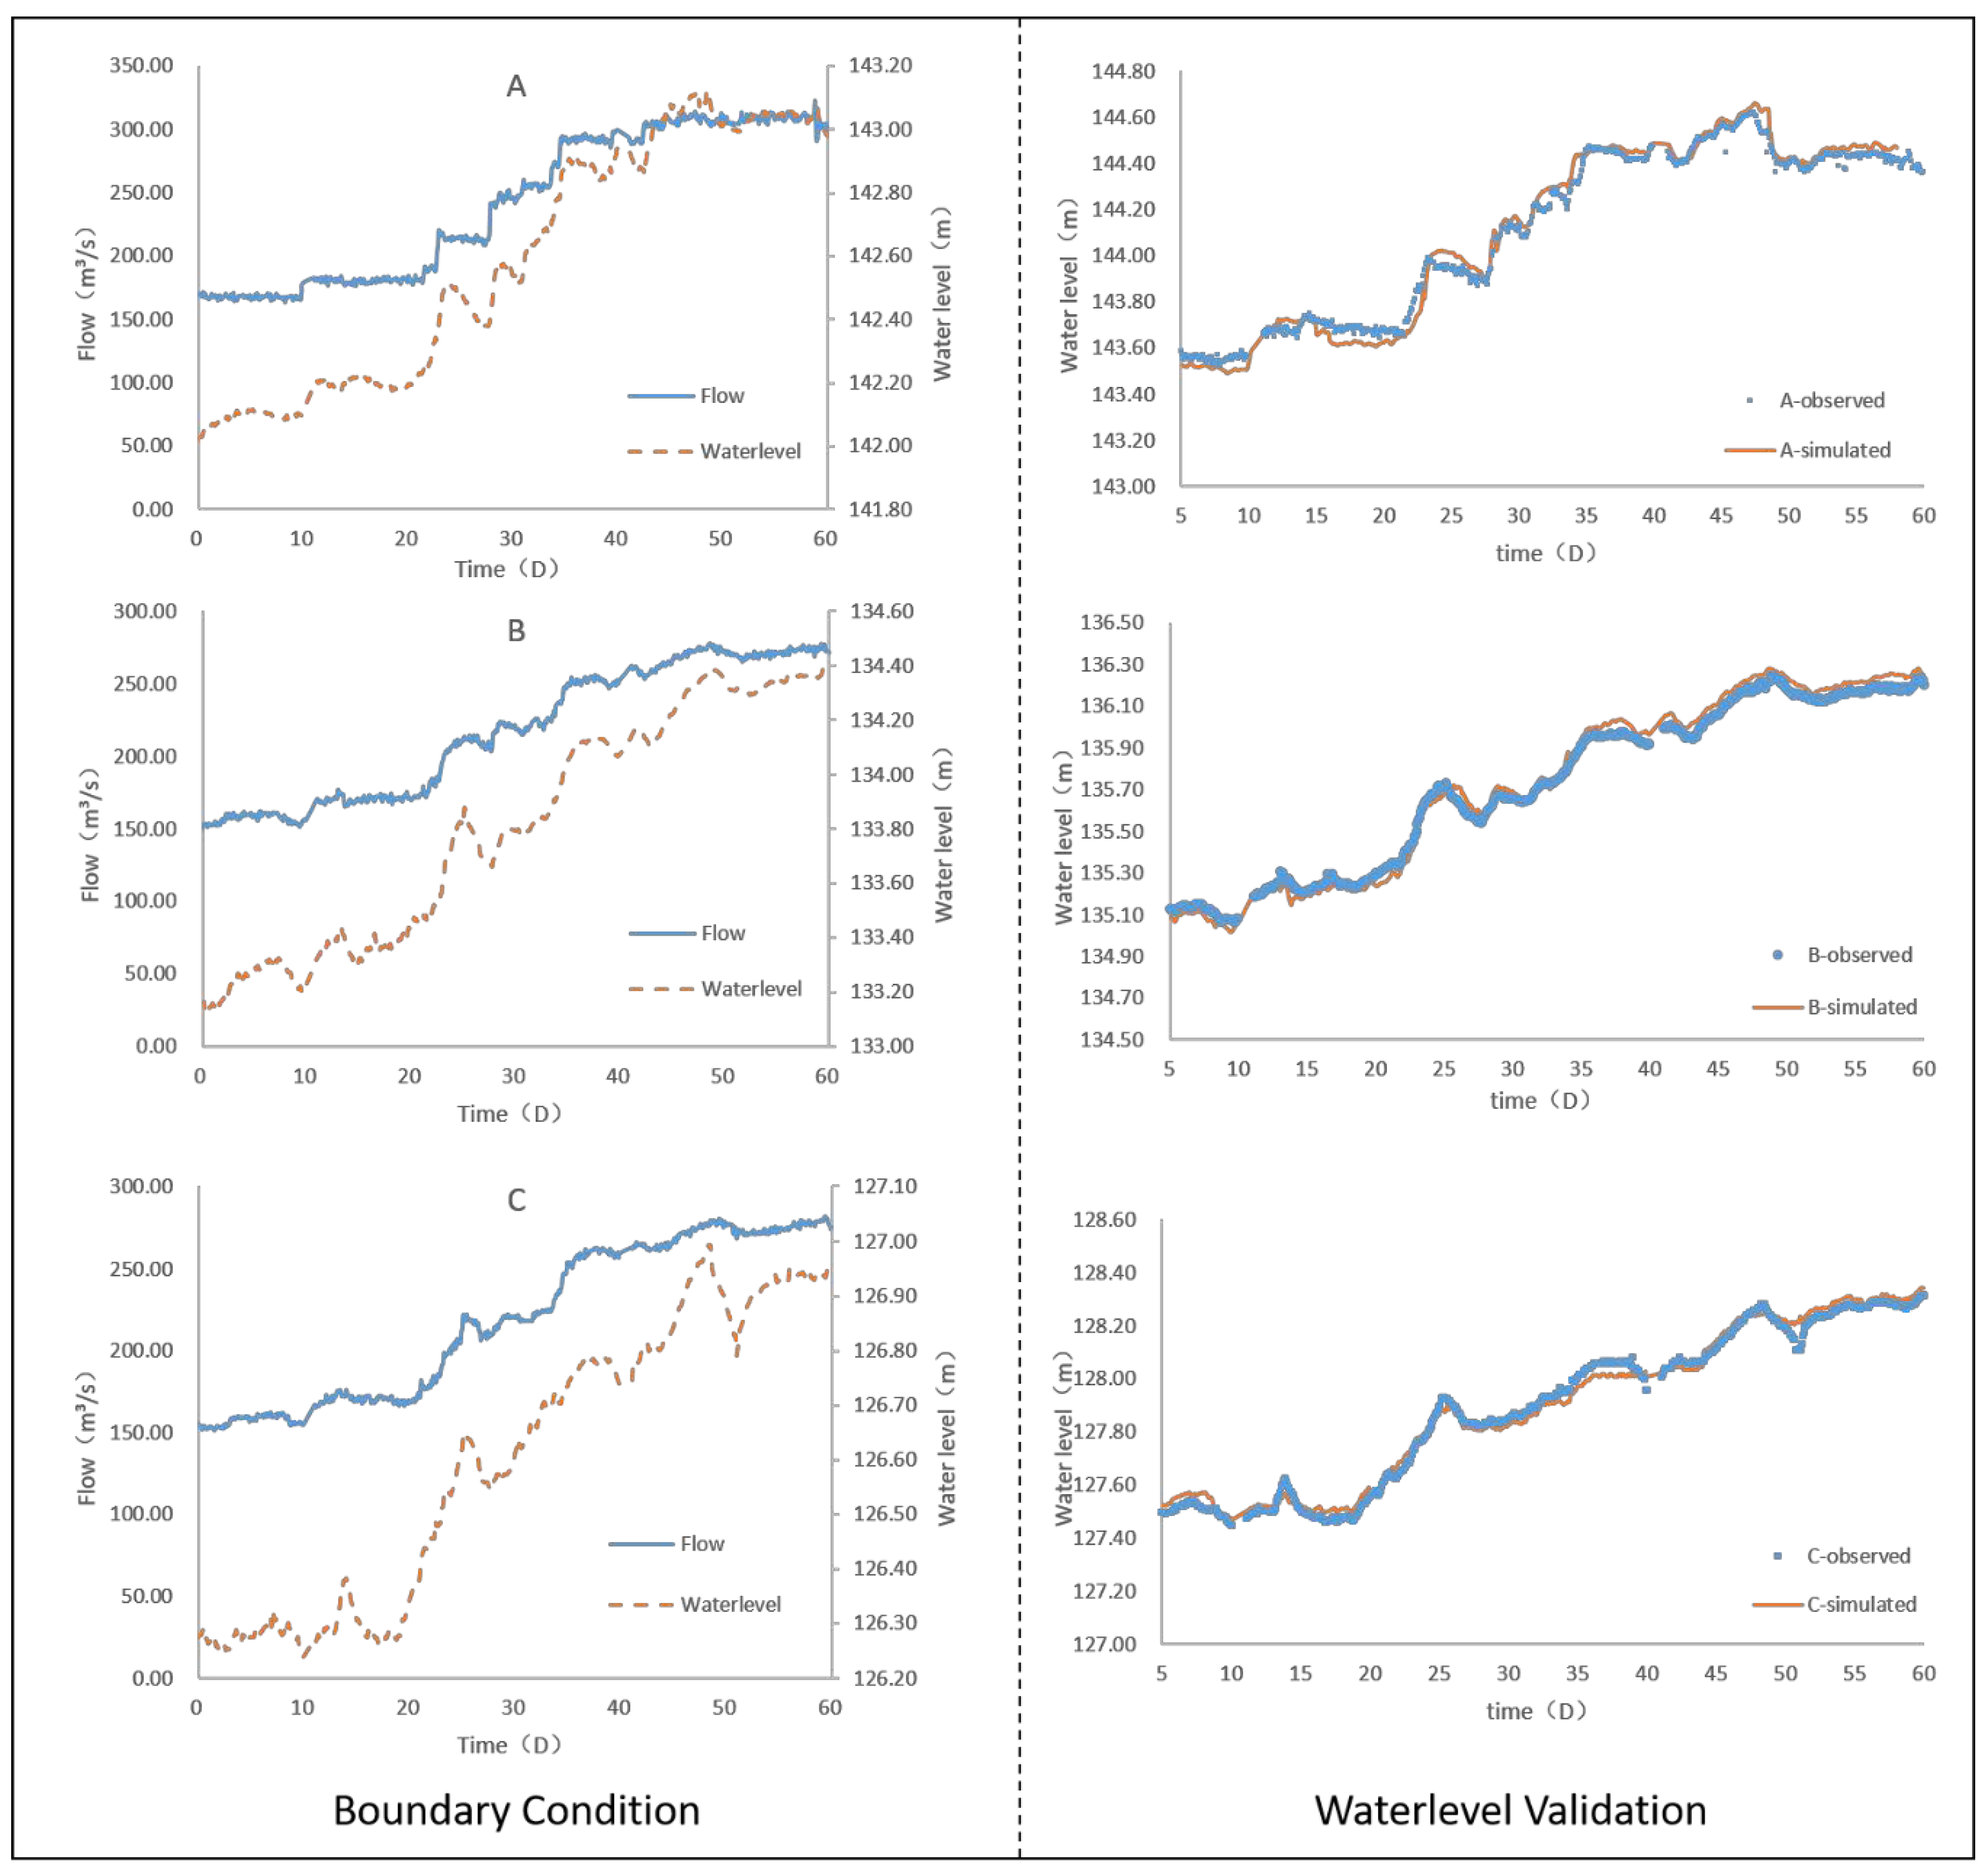
Boundary and Initial Conditions
Model Verification
3. Results and Discussion
3.1. Distribution Regularities of the Algae Zones
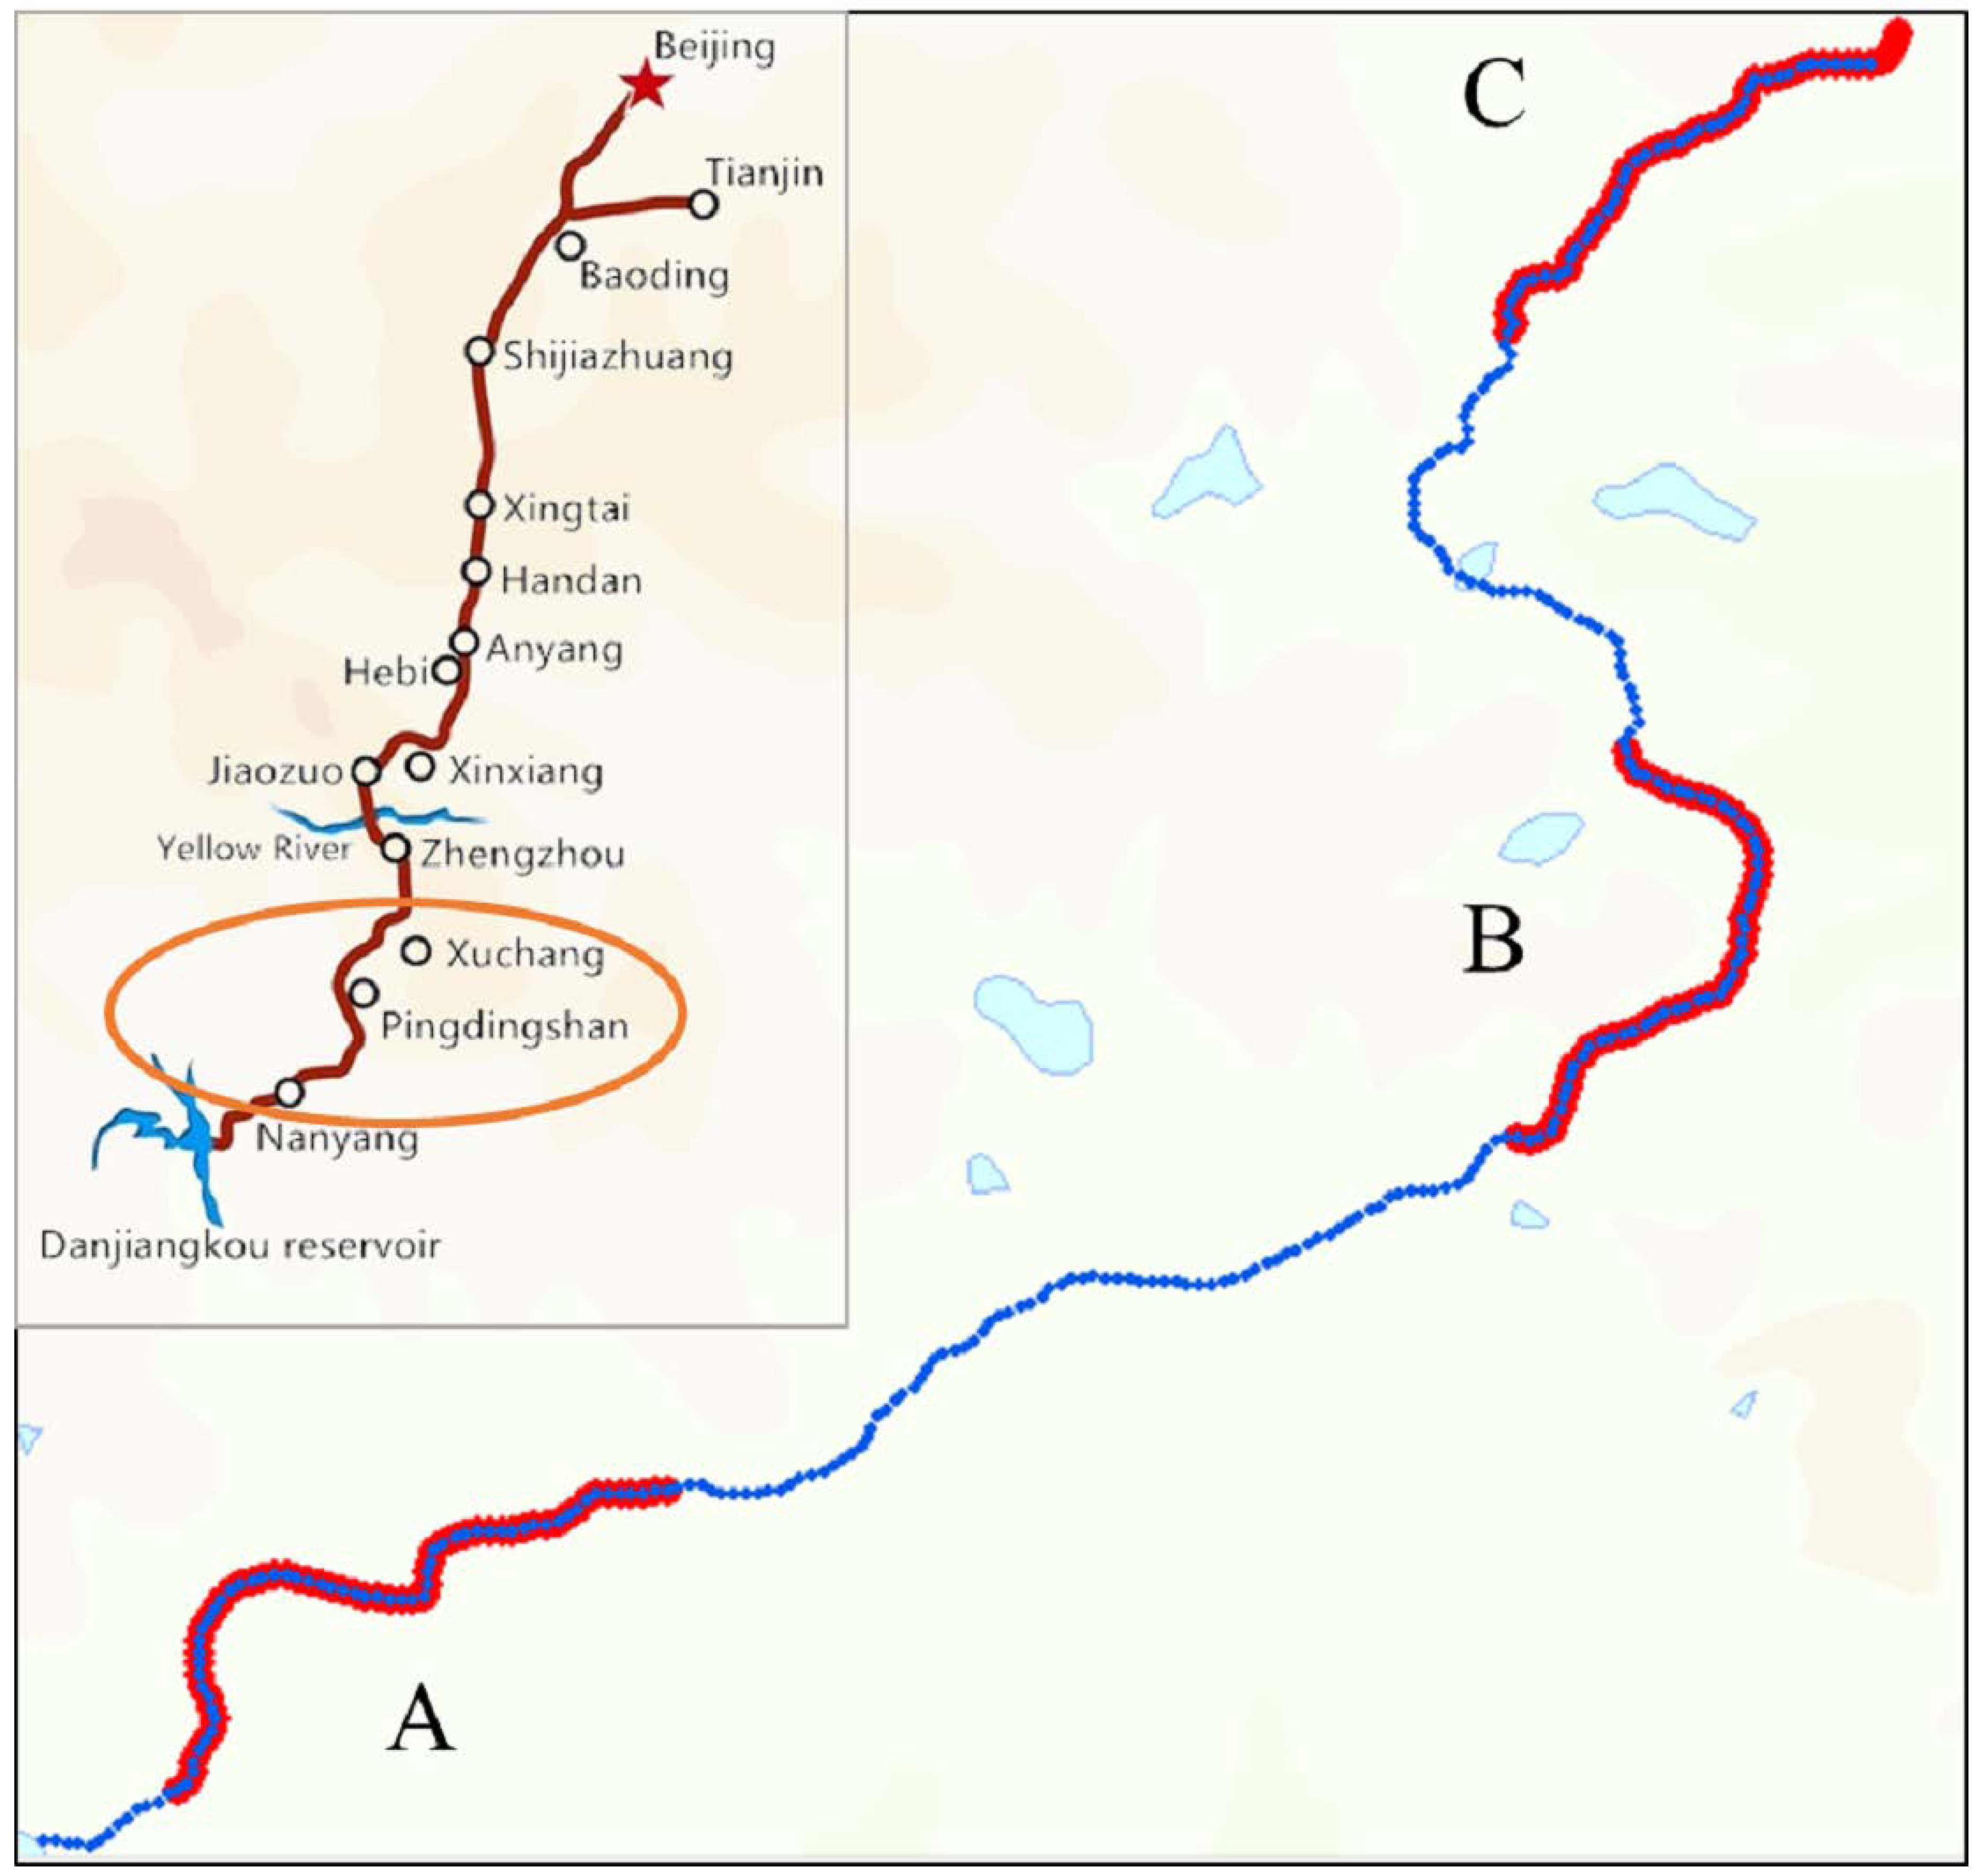
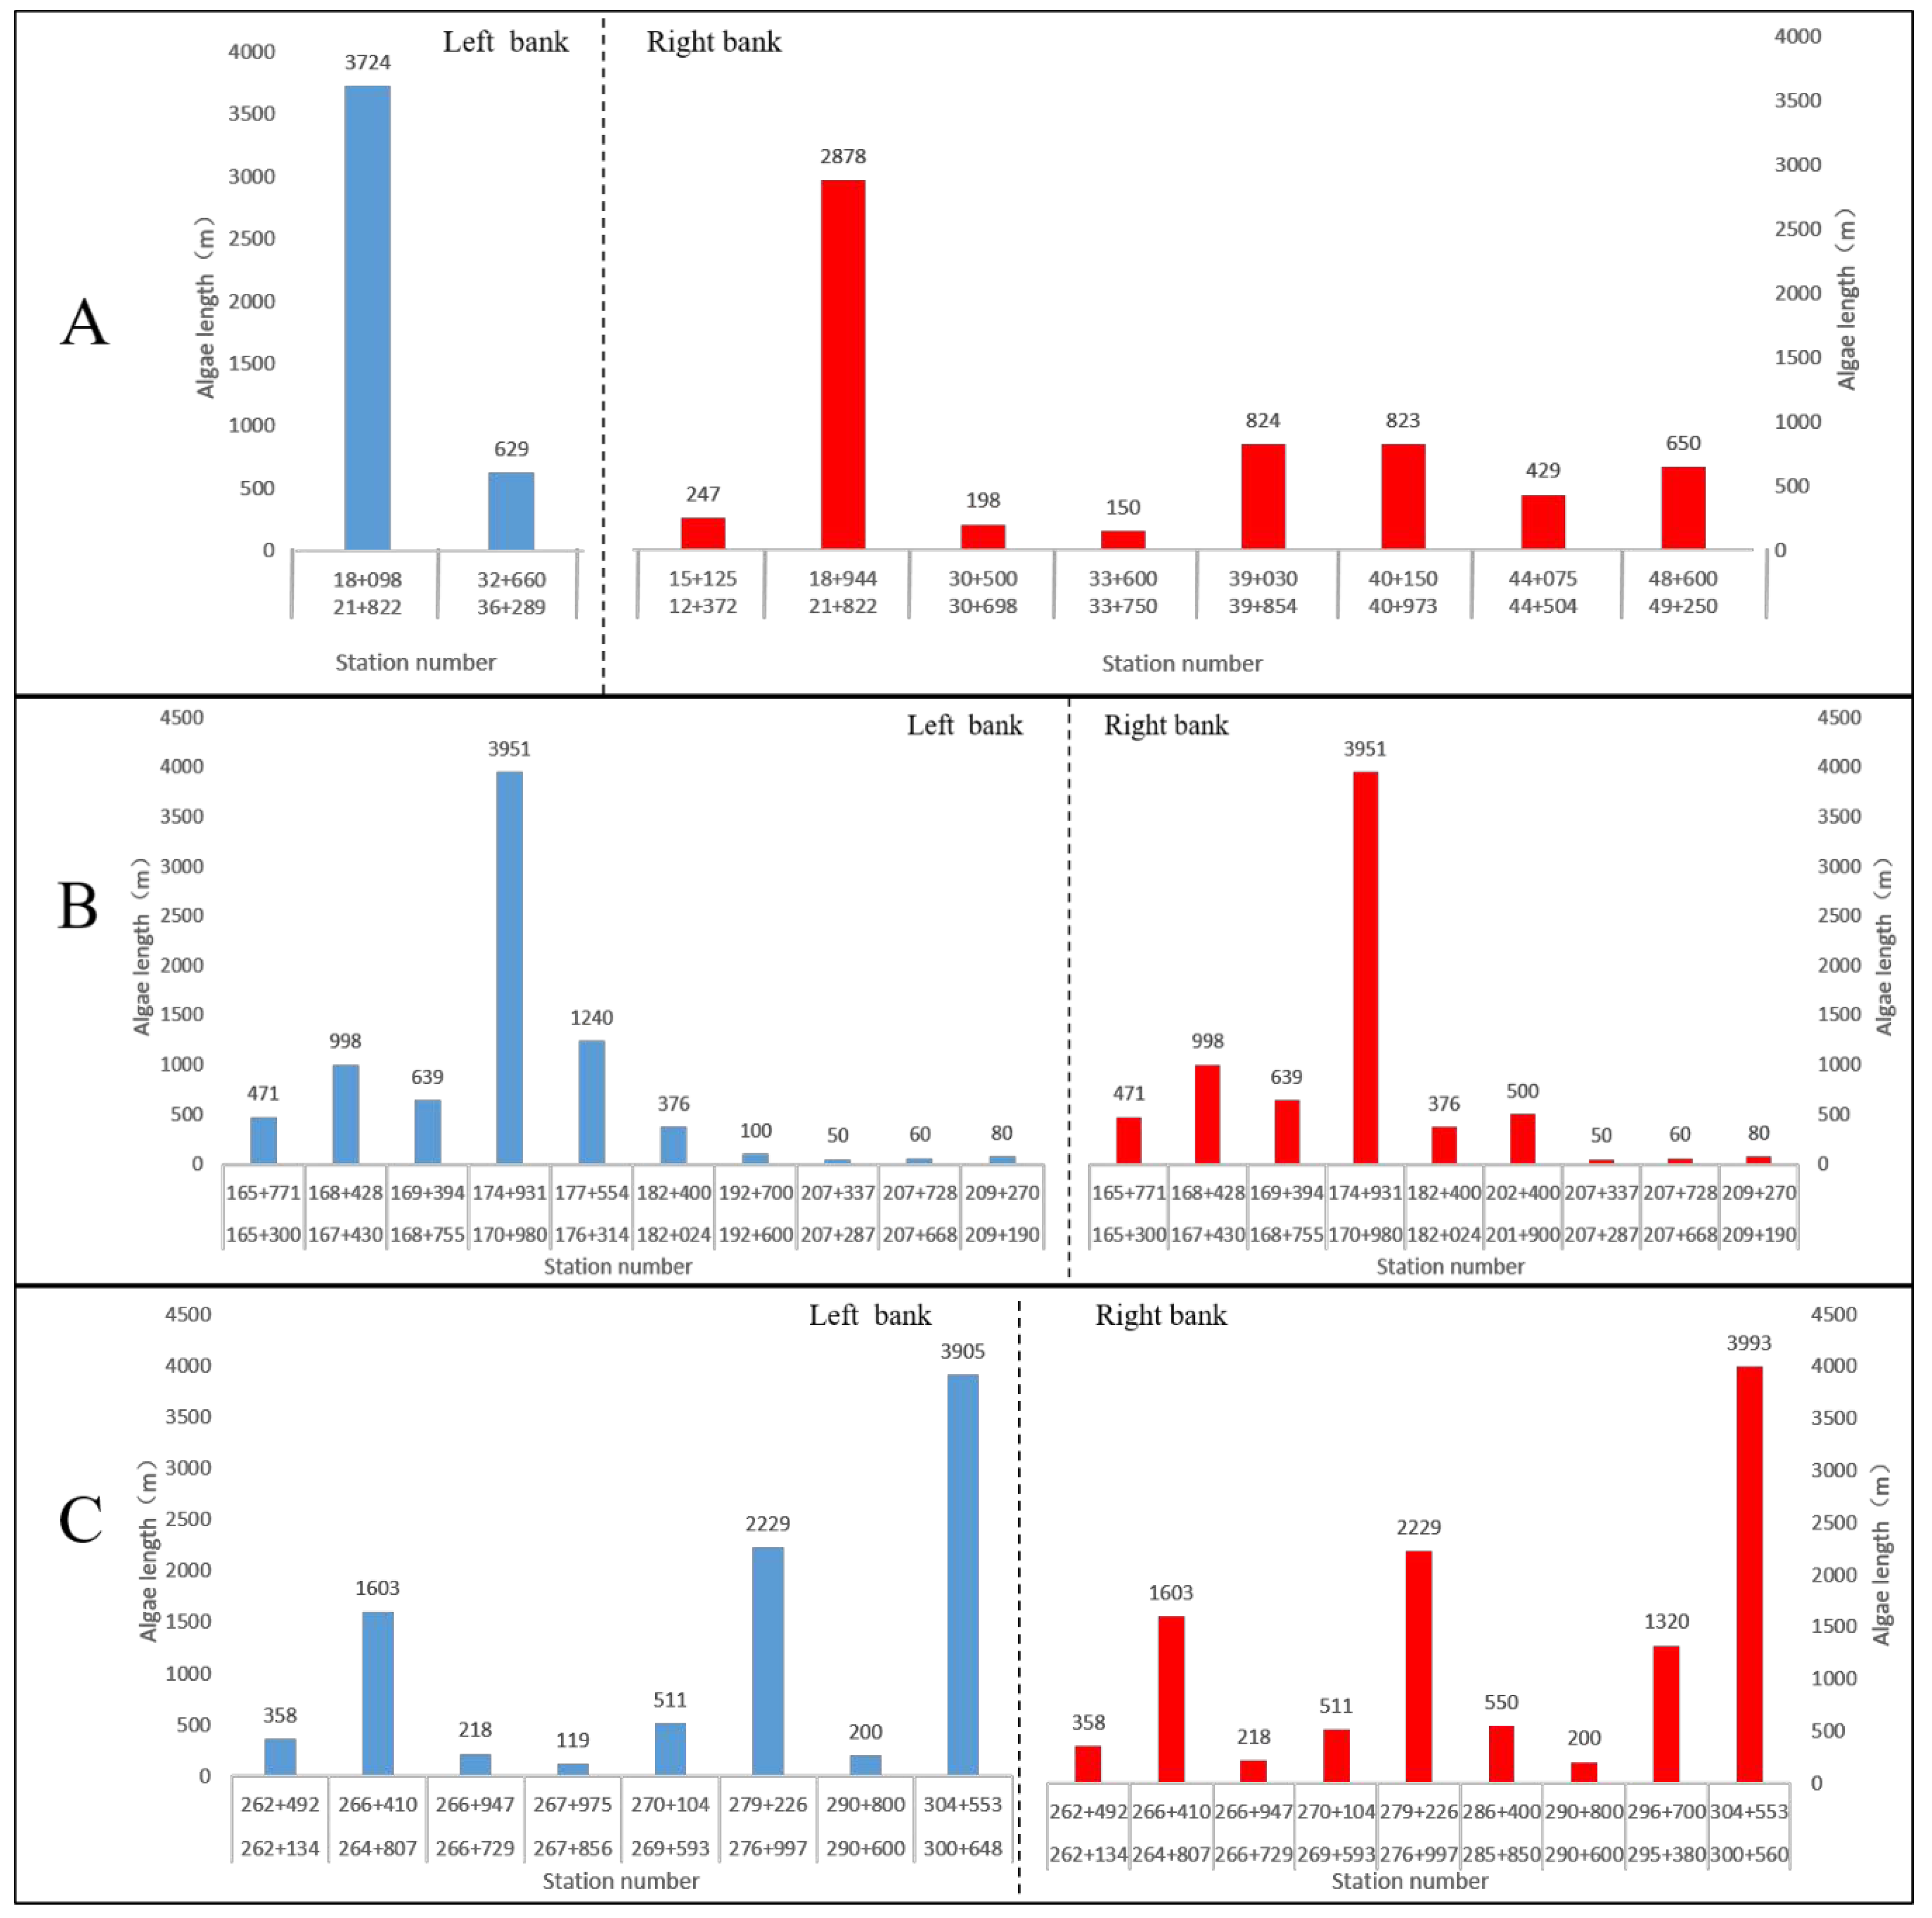
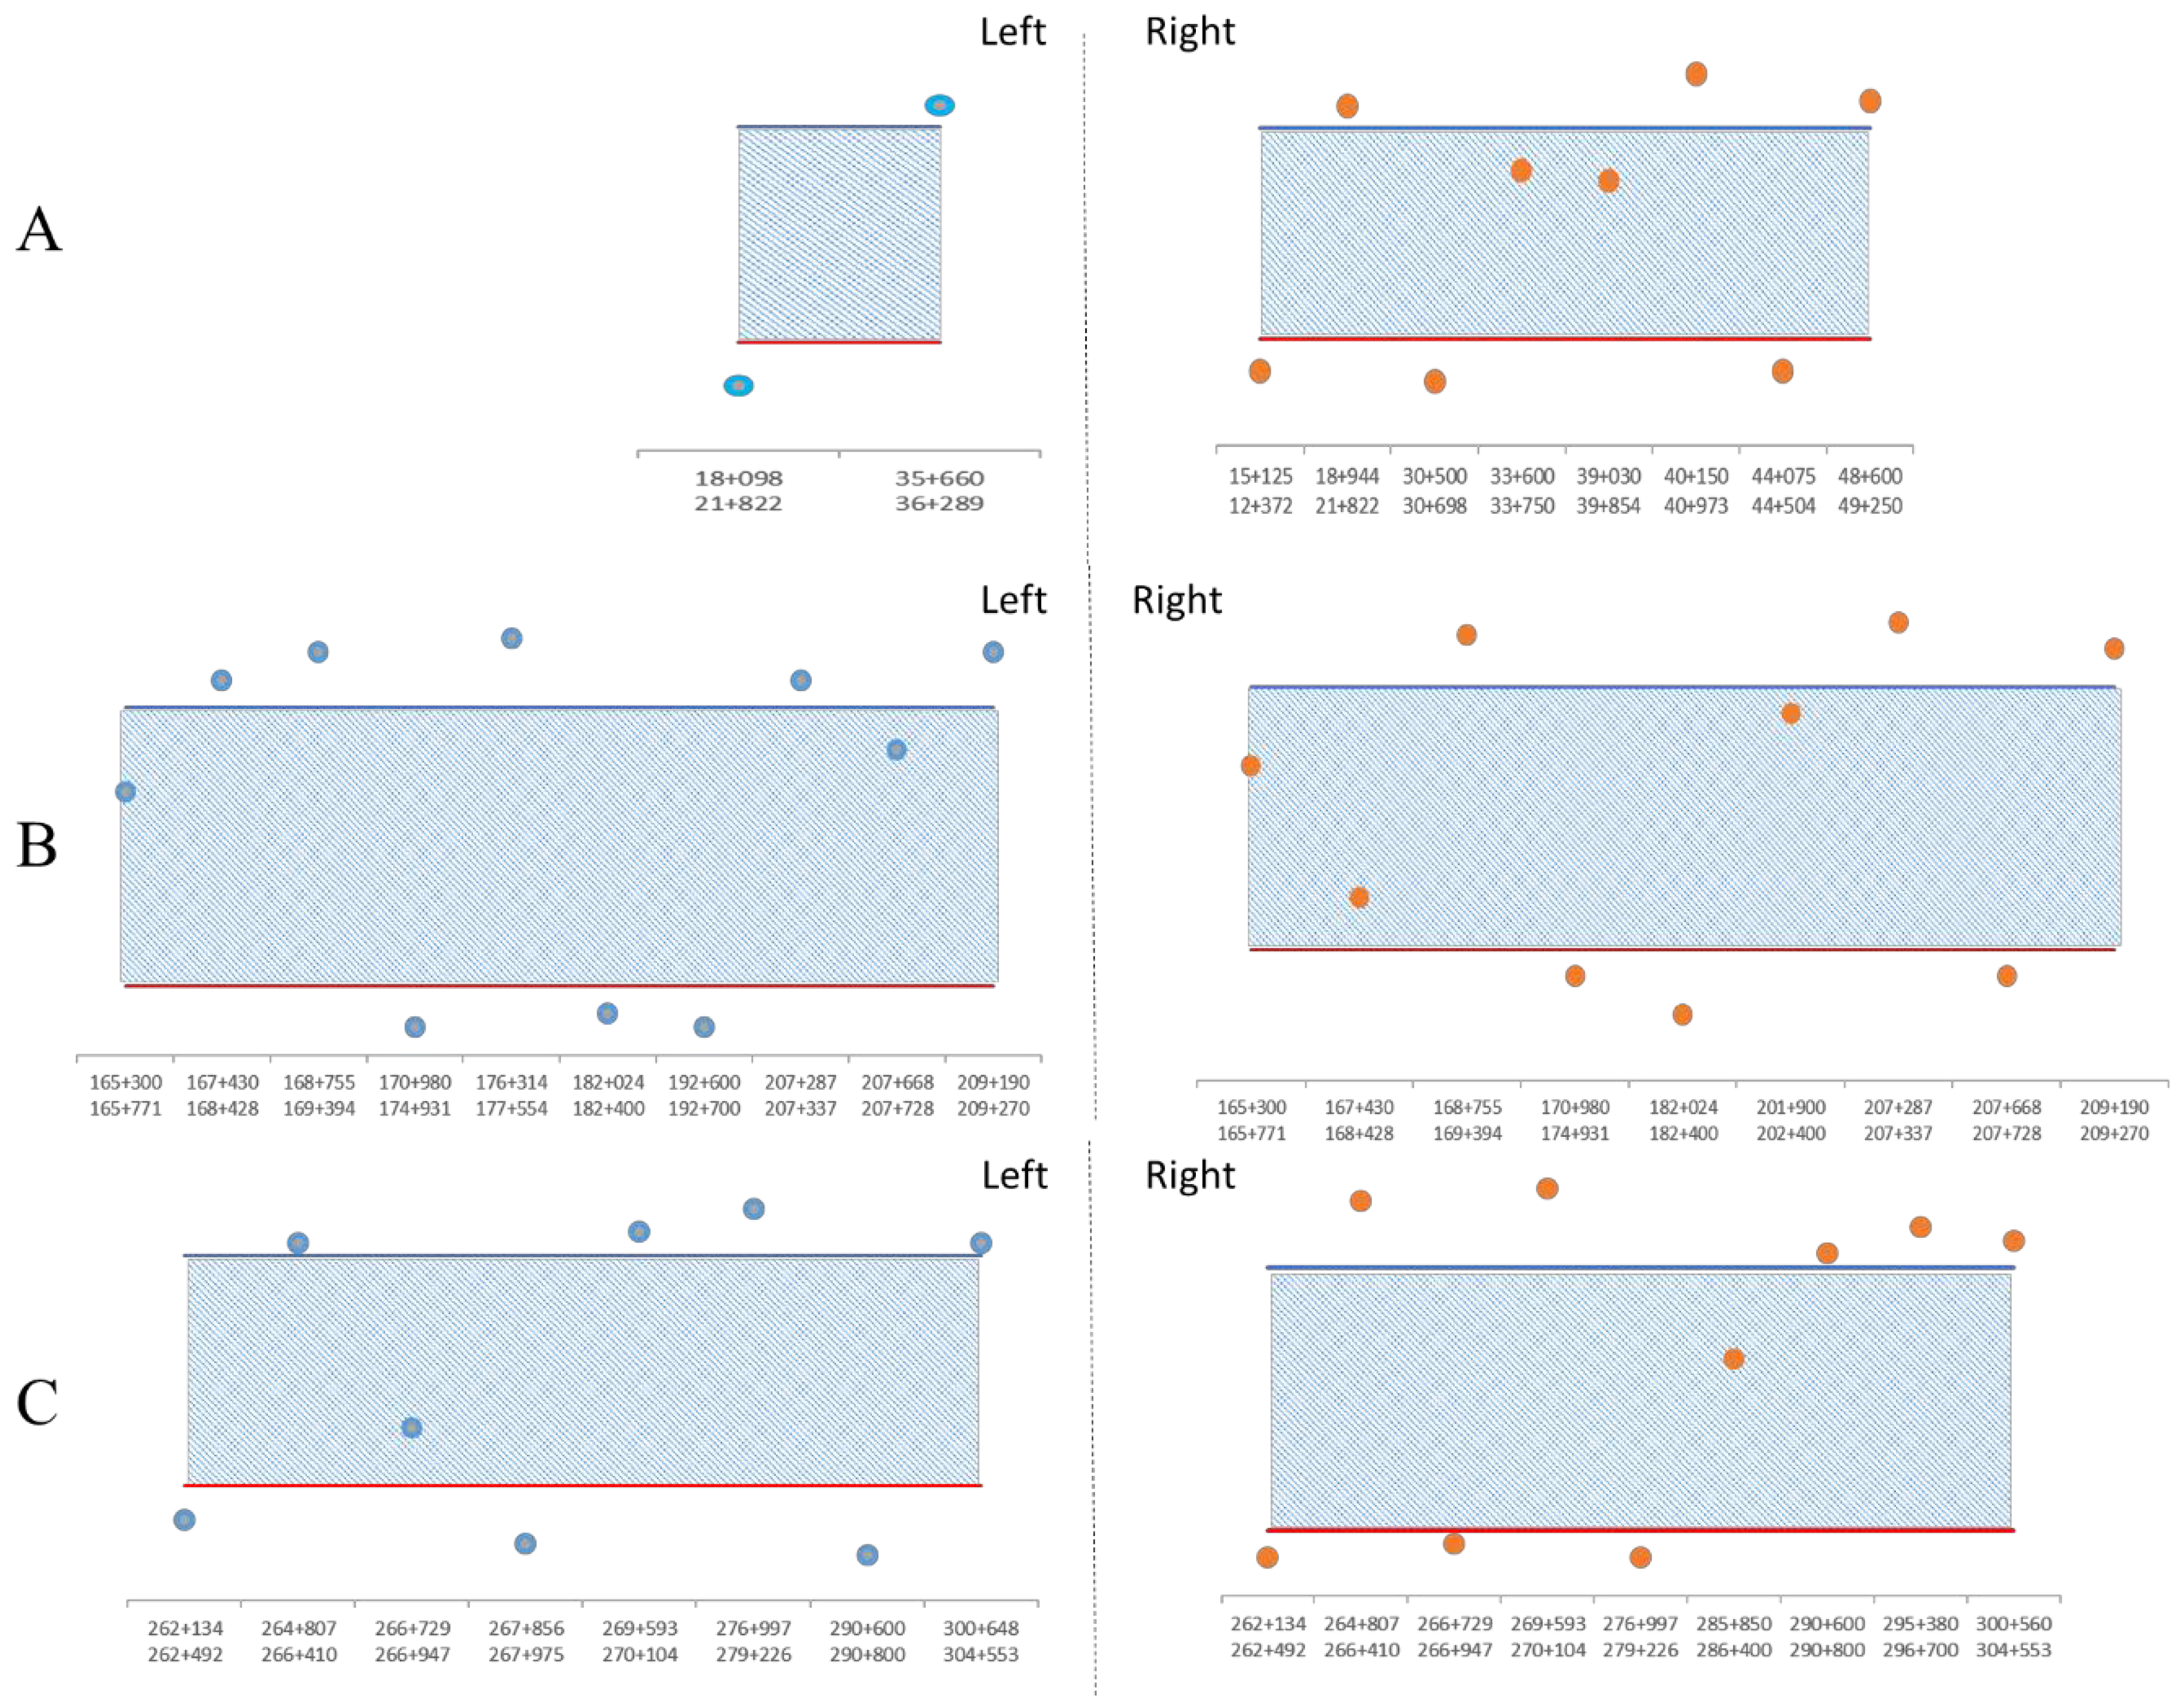
- The total canal length in Section A was 60.04 km. The engineering characteristics of the canal were as follows: a large bend with a length of approximately 15 km and an arc of approximately 60° (blue dotted circle in Figure 7; A2). There were 10 algae growth zones in Section A: two on the left bank and eight on the right bank. The length of each algae zone is shown in Figure 8. The longest algae growth zone on the left bank was 3724 m, and the longest algae zone on the right bank was 2878 m. As shown in Figure 7, the longest algae growth zones on the left and right banks were before the great bend of Section A (A1) (i.e., upstream of the blue dotted circle). The algae growth zone was concentrated in the great bend (A2), and there was almost no algae zone near the lower reaches of the greater bend (A3).
- The total canal length of Section B was 49.54 km. The engineering characteristics of the canal were as follows: a large curved section with a length of approximately 20 km and an arc of approximately 90° (orange dotted circle in Figure 7; B2). There were 19 algae growth zones in Section B: 10 on the left bank and nine on the right bank. The length of each algae zone is shown in Figure 8. The longest algae zone was 3951 m in length. The longest algae zones on the left and right banks were in front (B1) of the large bend section (i.e., upstream of the orange dotted circle). The algae zone in Section B was concentrated in the large bend, especially at the front and end (B1 and B2). From the number of algae zones, the section between B2 and B3 had a length of approximately 10 km with a curvature of approximately 120° and nine algae zones. The longest algae zone was still in front of the large curved section (B1), and only a few algae zones appeared in B3 after the large bend.
- The total canal length of Section C was 46.77 km. The section was characterized by a relatively small degree of bending overall. In contrast, there was a bending section with a large bending degree downstream of Section C (red dotted circle in Figure 7; C3). There were 17 algae growth zones in Section C: eight on the left bank and nine on the right bank. Figure 8 shows that the longest algae zone on the left bank was 3905 m, and the longest algae zone on the right bank was 3993 m. These zones were located at the same position in front of the large bend section (red virtual coil in Figure 7; C3).
- Large-scale algae zones often occurred at the front end of large curved sections in the canal. The largest algae zone appeared at the front of the large bends in Sections A and B (virtual coils in Figure 7). In Section C, although the overall bending degree was relatively small, there was a relatively large bend downstream of the section (virtual coil in Figure 7). The largest algae zone in Section C also appeared upstream of the bend.
- The algae zones were concentrated in curved sections. There were 64 curves with different bending degrees in the study area: 23 in Section A, 23 in Section B, and 18 in Section C. Among the positions with vigorous algae growth, seven in Section A were along bends, accounting for 30.44% of the total bend length and 70% of the total algae growth zones; nine in Section B were along bends, accounting for 39.13% of the total bend length and 81.82% of the total algae growth zones; and six in Section C, accounting for 33.33% of the total section length and 66.67% of the total number of algae growth zones.
3.2. Distribution Regularities of the Flow Rate
3.3. Relationship between Algae and Flow Rate Distributions
- The parent factor is (), and the sub-factor is ().
- Dimensionless data processing.“Averaging” process:“Initialization” processing:where is the average of the observed values; is the k-th observed value; is the initial observed value.
- The correlation coefficients of the algae growth zone length and each index after the mean and initial values are calculated as follows:where is the correlation coefficient between the sub-factor and parent factor at time , is the absolute value of the difference between two sequences at time (), and are the maximum and minimum absolute values, respectively, of the time difference, and is the resolution coefficient. The resolution coefficient is an important factor that directly affects the resolution of the correlation analysis, and its value directly determines the distribution of the correlation coefficients. Different values greatly influence the rate of change in the correlation coefficient. The resolution coefficient is inversely proportional to the resolution. A smaller indicates a greater resolution. In many papers [41,42,43,44,45], ; for specific applications, .Based on , the following average values were obtained: and in Section A, and in Section B, and and in Section C. The following initial values were obtained: and in Section A, and in Section B, and and in Section C.
- Relevance Degree of the Parent Factor and Subfactor .The average relevance degree of a correlation coefficient is given bywhere is the degree of relevance.
4. Conclusions
- The distribution of algae zones in Sections A–C showed that most algae zones occurred in curved sections, and the junction between straight and curved sections (i.e., the front of large bends) was most suitable for large algae zones to appear. Thus, to prevent and control algae in the main canal of the MRP, algae control devices should mainly be installed at the front of large bends with fewer devices at other positions. This will not only effectively prevent and control algae in the main canal, but also reduce the cost.The gray correlation method was used to calculate the correlation between the length of the algae growth zone and the flow rate. The results showed that the correlation between the length of the algae growth zone and the flow rate in Sections A–C was over 0.65 with the mean method and 0.55 with the initial value method. The correlation between Sections B and C was over 0.75, so the length of the algae zone is strongly correlated with the flow rate. According to the field investigation and model results, the relationship between the length of the algae growth zone and the average flow rate in each canal section: a smaller average flow rate leads to a greater length of the algae growth zone. Therefore, we come to the conclusion that the flow rate in the main canal has a high correlation with the length of the algae growth zone and thus a great influence.
- The flow rate at 80.43% of algae zones was less than those before and after the zones. Eight of these zones were in Section A, accounting for 80% of the total number of algae zones; 14 were in Section B, accounting for 77.78% of the total; and 15 were in Section C, accounting for 88.24% of the total. This shows that algae were more likely to grow and more algae zones appeared in areas with low flow rate.
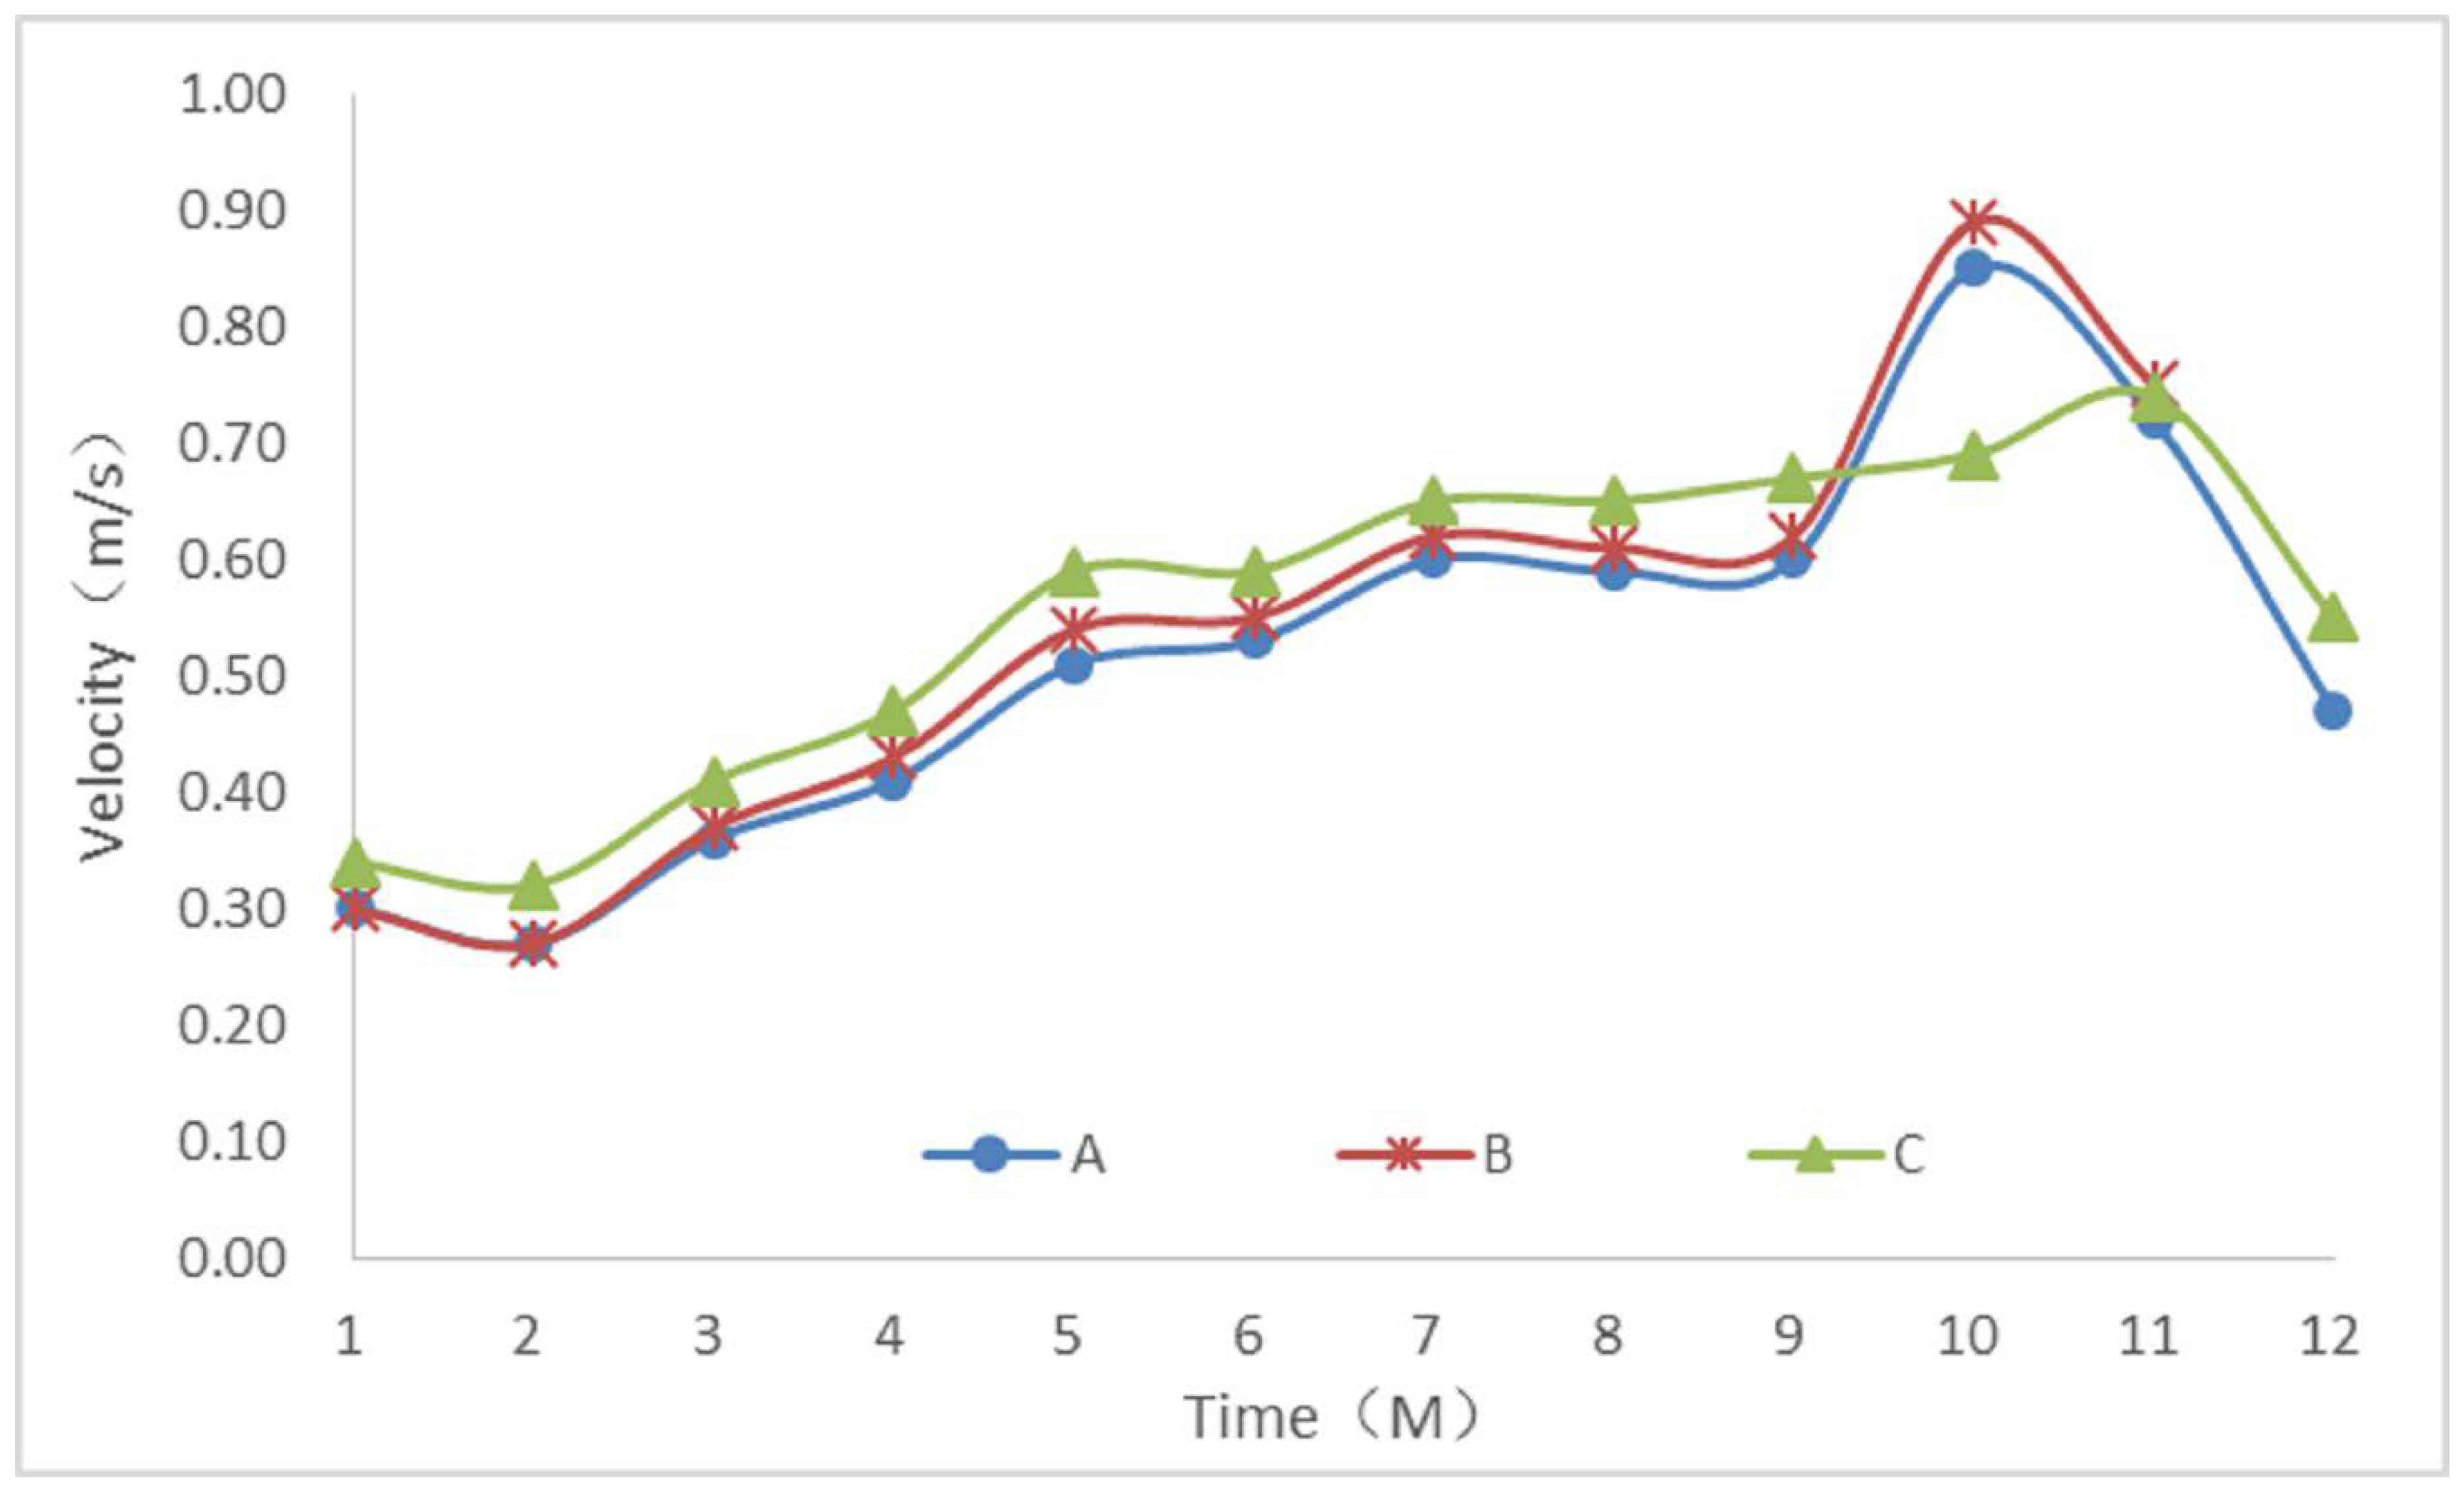
- The historical flow rate data of the main canal showed that the flow rate varied widely. The maximum and minimum flow rates were respectively 0.85 and 0.27 m/s in Section A, 0.89 and 0.27 m/s in Section B, and 0.74 and 0.32 m/s in Section C. This indicates that the main canal has a large capacity to bear changes in the flow rate and can safely operate at high flow rates. This ensures that the hydrodynamic habitat conditions in the main canal can be safely changed to suppress algae growth.
- The change in the hydrodynamic conditions will lead to a change in the material transport in the water, which will affect the growth of algae. At the same time, hydrodynamic conditions will affect the attachment rate, attachment abundance, and biomass of Cladophora to some degree. At high flow rates, the close contact between the filaments of Cladophora can reduce the concentration of substances, both within the Cladophora and in the surrounding water, and the photosynthetic efficiency decreases due to the light-shielding effect, which is called the streamlining effect.Because the flow rate is the most basic and intuitive hydrodynamic parameter, this analysis of the relationship between the flow rate, algae growth, and distribution provides specific and effective suggestions for key prevention and control positions. It is suggested that the key prevention and control measures should be implemented at the large curved section of the main canal, at least at the front of the large curved section. This is clearly extremely important information for improving the efficiency of algae control in the main canal.
Author Contributions
Funding
Acknowledgments
Conflicts of Interest
References
- Shen, H.; Cai, Q.; Zhang, M. Spatial gradient and seasonal variation of trophic status in a large water supply reservoir for the South-to-North Water Diversion Project, China. J. Freshw. Ecol. 2015, 30, 249–261. [Google Scholar] [CrossRef]
- Tang, C.H.; Yi, Y.J.; Yang, Z.F.; Cheng, X. Water pollution risk simulation and prediction in the main canal of the South-to-North Water Transfer Project. J. Hydrol. 2014, 519, 2111–2120. [Google Scholar] [CrossRef]
- Li, S.Y.; Li, J.Q.; Zhang, Q.F. Water quality assessment in the rivers along the water conveyance system of the Middle Route of the South to North Water Transfer Project (China) using multivariate statistical techniques and receptor modeling. J. Hazard. Mater. 2011, 195, 306–317. [Google Scholar] [CrossRef]
- Wang, P.L. Studies on the Formation Mechanism of Diatom Blooms in Hanjiang River from Hydrodynamics and Nutrition. Master’s Thesis, Huazhong Agricultural University, Wuhan, China, 2010. [Google Scholar]
- Zhang, W.H. Effects of Hydrodynamics on Nutrient Cycling and Algal Growth in Lake Tai. Master’s Thesis, Chinese Research Academy of Environmental Sciences, Beijing, China, 2017. [Google Scholar]
- Xu, L.; Feng, P.; Sun, D.M.; Li, F.W. Numerical simulation for the effect of temperature on the algae growth. J. Environ. Saf. 2013, 13, 76–81. [Google Scholar]
- Liu, F.L.; Jin, F. Control Effect of Current Velocity on Alga Growth in Eutrophication Water. Water Sav. Irrig. 2009, 9, 52–54. [Google Scholar]
- Jing, W.Q. Research on the Impact of Flow Velocity on the Eutrophicaton in Water Body. Master’s Thesis, Chongqing Jiaotong University, Chongqing, China, 2009. [Google Scholar]
- Gottlieb, A.D.; Richards, J.H.; Gaiser, E.E. Comparative study of periphyton community structure in long and short-hydroperiod Everglades marshes. Hydrobiologia 2006, 569, 195–207. [Google Scholar] [CrossRef]
- Havens, K.E.; Beaver, J.R.; Casamatta, D.A.; East, T.L.; James, R.T.; Mccormick, P.; Phlips, E.J.; Rodusky, A.J. Hurricane effects on the planktonic food web of a large subtropical lake. J. Plankton Res. 2011, 33, 1081–1094. [Google Scholar] [CrossRef]
- Raeder, U.; Ruzicka, J.; Goos, C. Characterization of the light attenuation by periphyton in lakes of different trophic state. Limnologica 2010, 40, 40–46. [Google Scholar] [CrossRef]
- Yan, R.R.; Png, Y.; Zhao, W.; Li, R.L.; Chao, J.Y. Influence of circumfluent type waters hydrodynamic on growth of algae. China Environ. Sci. 2008, 28, 813–817. [Google Scholar]
- Zhang, Y.M.; Zhang, Y.C.; Zhang, L.J.; Gao, Y.X. The influence of lake hydrodynamics on blue algal growth. China Environ. Sci. 2007, 27, 707–711. [Google Scholar]
- Wang, J.H. The Experimental Study on the Influences of Flow Velocity on Algae Growth. Master’s Thesis, Tsinghua University, Beijing, China, 2012. [Google Scholar]
- Wu, X.H.; Li, Q.H. Reviews of influences from hydrodynamic conditions on algae. Ecol. Environ. Sci. 2010, 19, 1732–1738. [Google Scholar]
- Jiao, S.J. The Effects of Velocity of Glow to the Growth of Algae in Low Current Area of the Three Gorges. Master’s Thesis, Southwest University, Chongqing, China, 2007. [Google Scholar]
- Hondzo, M.M.; Kapur, A.; Lembi, C.A. The effect of small-scale fluid motion on the green alga. Hydrobiologia 1997, 364, 225–235. [Google Scholar] [CrossRef]
- Ding, L.; Zhi, C.Y. Environmental effects on diatom and its monitor of environment. J. Guizhou Norm. Univ. (Nat. Sci.) 2006, 24, 13–16. [Google Scholar]
- Yu, L.H.; Guo, Y.Q. Influence of Dynamic Condition to the Algae of the Reservoir by Diverting the Yellow River. Yellow River 2011, 81–82. [Google Scholar]
- Wang, H.P.; Xia, J.; Xie, P.; Dou, M. Mechanisms for hydrological factors causing algal blooms in Hanjiang River—Based on kinetics of algae growth. Resour. Environ. Yangtze Basin 2004, 13, 282–285. [Google Scholar]
- Li, J.X.; Du, B.; Sun, Y.S. Effcet of hydrodynamics on the eutrophication. Water Resour. Hydropower Eng. 2005, 5, 15–18. [Google Scholar]
- Huang, C.; Zhong, C.H.; Deng, C.G.; Xing, Z.G. Preliminary study on correlation between flow velocity and algae along Daning River’s backwater region at sluice initial stages in the Three Gorges Reservoir. J. Agro-Environ. Sic. 2006, 25, 453–457. [Google Scholar]
- Borchardt, M.A. Effects of flowing water on nitrogen-limited and phosphorus-limiter photosynthesis and optimum N/P ratios by Spirogyra-Fluviatilis (Charophyceae). J. Phycol. 1994, 30, 418–430. [Google Scholar] [CrossRef]
- Healey, F.P. Interacting effects of light and nutrient limitation on the growth rate of Synechococcus linearis (Cyanophyceae). J. Phycol. 2010, 21, 134–146. [Google Scholar] [CrossRef]
- Pannard, A.; Bormans, M.; Lagadeuc, Y. Short-term variability in physical forcing in temperate reservoirs: Effects on phytoplankton dynamics and sedimentary fluxes. Freshw. Biol. 2007, 52, 12–27. [Google Scholar] [CrossRef]
- Huisman, J.; Sharples, J.; Stroom, J.M.; Visser, P.M.; Kardinaal, W.E.A.; Jolanda, M.H.V.; Sommeijer, B. Changes in turbulent mixing shift competition for light between phytoplankton species. Ecology 2004, 85, 2960–2970. [Google Scholar] [CrossRef]
- Zhu, J.; Lei, X.H.; Zheng, H.Z. Risk analysis and emergency countermeasures for oil pollution in main channel of South to North Water Transfer Project. In Proceedings of the 1st International Symposium on Water System Operations, ISWSO 2018, Beijing, China, 16–20 October 2018. [Google Scholar]
- Liu, X.; Chen, Y.W. A review on the ecology of Cladophora. J. Lake Sci. 2018, 30, 19–34. [Google Scholar]
- Zhang, H. Simulation Study on Water Environment of Dianchi Based on the EFDC. Master’s Thesis, Zhejiang University, Hangzhou, China, 2017. [Google Scholar]
- Wu, G.Z.; Xu, Z.X. Prediction of algal blooming using EFDC model: Case study in the Daoxiang Lake. Ecol. Model. 2011, 222, 1245–1252. [Google Scholar] [CrossRef]
- Tang, T.J.; Yang, S.; Yin, K.H. Simulation of eutrophication in Shenzhen Reservoir based on EFDC model. J. Lake Sci. 2014, 26, 393–400. [Google Scholar]
- Gong, R.; He, Y.; Xu, L.G.; Wang, D.G. The application progress of environmental fluid dynamics code (EFDC) in lake and reservoir environment. Trans. Oceanol. Limnol. 2016, 6, 12–19. [Google Scholar]
- Ding, Y.; Jia, H.F.; Ding, Y.W.; Sun, Z.X. Hydrodynamic optimization of urban river network of water towns based on EFDC model. Acta Sci. Circumst. 2016, 36, 1440–1446. [Google Scholar]
- Liu, W.C.; Kuo, J.T. Evaluation of marine outfall with three-dimensional hydrodynamic and water quality modeling. Environ. Model. Assess. 2007, 12, 201–211. [Google Scholar] [CrossRef]
- Zang, Y.F.; Wang, Y.L.; Wang, L. Overview and application analysis of EFDC model. Environ. Impact Assess. 2015, 37, 70–72. [Google Scholar]
- Duan, Y. Water Environment Dynamics Simulation Technology Research Based on EFDC—DanJiangKou Reservoir as an Example. Master’s Thesis, China University of Geosciences, Wuhan, China, 2014. [Google Scholar]
- Zhou, X.B.; Wu, J.; Zhang, Z.Y.; Zhuang, W. Application study of EFDC on division of drinking water source conservation area by taking one drinking water plant in Hangjiahu region as a case. Environ. Sci. Surv. 2009, 28, 30–32. [Google Scholar]
- Chen, H.Y. Study on Water Quality Early Warning of Huainan Water Source Based on EFDC Model. Master’s Thesis, Minzu University of China, Beijing, China, 2012. [Google Scholar]
- Zhen, G.J. Hydrodynamics and Water Quality: Modeling Rivers, Lakes, and Estuaries; Wiley-Interscience: Hoboken, NJ, USA, 2008. [Google Scholar]
- Liu, X.M.; Li, J.Q.; Dou, X.M.; Wang, Y.L. The Application and Advance of Environmental Fluid Dynamics Code (EFDC) in Estuarine Water Environment. Environ. Sci. Technol. 2011, 34, 136–140. [Google Scholar]
- Satapathy, B.K.; Bijwe, J.; Kolluri, D.K. Assessment of fiber contribution to friction material performance using gray relational analysis (GRA). J. Compos. Mater. 2005, 40, 483–501. [Google Scholar] [CrossRef]
- Sun, Y.G. Research on Gray Relational Analysis and Its Application. Master’s Thesis, Nanjing University of Aeronautics and Astronautics, Nanjing, China, 2007. [Google Scholar]
- Wang, J.M.; Guo, J.W.; Lian, X.J. Comparative study on two improved Gray Relational Analysis. J. North China Electr. Power Univ. 2005, 6, 72–76. [Google Scholar]
- Deng, J.L. Gray System Theory Tutorial; Huazhong University of Technology Press: Wuhan, China, 1990. [Google Scholar]
- Shi, S.L. Theory analysis of interzone of resolution ratio ρ in gray interrelated modeland practical validation in safety valuation of working faces. J. Xiangtan Min. Inst. 1999, 2, 7–11. [Google Scholar]


| Index | Flow Rate (m/s) | Flow Rate (m/s) | Flow Rate (m/s) |
|---|---|---|---|
| Average | 0.656 | 0.742 | 0.648 |
| Initialization | 0.555 | 0.772 | 0.758 |
| Index | Section A | Section B | Section C |
|---|---|---|---|
| Length of algae growth zone (km) | 10.55 | 15.09 | 20.125 |
| Ratio of length of algae growth zone to length of canal section (%) | 17.58 | 30.46 | 43.03 |
| Average flow rate (m/s) | 0.314 | 0.239 | 0.225 |
© 2019 by the authors. Licensee MDPI, Basel, Switzerland. This article is an open access article distributed under the terms and conditions of the Creative Commons Attribution (CC BY) license (http://creativecommons.org/licenses/by/4.0/).
Share and Cite
Zhu, J.; Lei, X.; Quan, J.; Yue, X. Algae Growth Distribution and Key Prevention and Control Positions for the Middle Route of the South-to-North Water Diversion Project. Water 2019, 11, 1851. https://doi.org/10.3390/w11091851
Zhu J, Lei X, Quan J, Yue X. Algae Growth Distribution and Key Prevention and Control Positions for the Middle Route of the South-to-North Water Diversion Project. Water. 2019; 11(9):1851. https://doi.org/10.3390/w11091851
Chicago/Turabian StyleZhu, Jie, Xiaohui Lei, Jin Quan, and Xia Yue. 2019. "Algae Growth Distribution and Key Prevention and Control Positions for the Middle Route of the South-to-North Water Diversion Project" Water 11, no. 9: 1851. https://doi.org/10.3390/w11091851
APA StyleZhu, J., Lei, X., Quan, J., & Yue, X. (2019). Algae Growth Distribution and Key Prevention and Control Positions for the Middle Route of the South-to-North Water Diversion Project. Water, 11(9), 1851. https://doi.org/10.3390/w11091851