Article

Degradation of Methylene Blue via Dielectric Barrier Discharge Plasma Treatment

China Petroleum and Chemical Industry Federation Engineering Laboratory of Biodiesel Technology, Zhejiang Provincial Key Laboratory of Biofuel, and College of Chemical Engineering, Zhejiang University of Technology, Hangzhou 310014, China
*
Author to whom correspondence should be addressed.
Water 2019, 11(9), 1818; https://doi.org/10.3390/w11091818
Submission received: 18 July 2019 / Revised: 28 August 2019 / Accepted: 29 August 2019 / Published: 31 August 2019
(This article belongs to the Section Wastewater Treatment and Reuse)

Abstract

:
The degradation of methylene blue (MB) using an upgraded dielectric barrier discharge (DBD) plasma reactor was investigated in this paper. Air plasma was generated in the glass bead packed bed in the reactor, which was propagated into MB solution through a microporous diffuser plate. Microdischarge phenomenon can be observed on the interface of MB solution and the diffuser plate, where plasma active species were generated. The effects of air flow rate, initial solution concentration, initial solution pH, and initial solution conductivity on MB degradation were examined. Experimental results indicated that the proposed plasma reactor was effective for MB degradation. No obvious change in MB degradation efficiency was obtained for solution with various initial pH and conductivities, which suggested the potential of the reactor in actual wastewater treatment. The possible mechanism of the generation of plasma active species for MB degradation was proposed. In addition, the total organic carbon removal and chemical oxidation demand removal after 30 min treatment were 38.5% and 48.3%, which was higher than that obtained by ozone. The energy yield for MB degradation reached up to 9.3 g/kWh. Finally, a possible degradation pathway of MB solution was proposed.

1. Introduction

Nowadays, the wastewater generated in the dyeing industry contains considerable amounts of organic pollutants and causes severe environmental and health problems [1]. It is estimated that over 7 × 10⁵ tons of dyes are produced annually [2]. Dye molecules have complex and stable structures due to the existence of auxochromes (water soluble bonding compound) and chromophores (color giving compound) [3], which are toxic, recalcitrant, and difficult to be degraded by traditional physical, chemical, and biological treatment [4]. Advanced oxidation processes (AOPs) based on hydroxyl radicals generated in situ has attracted much attention [5,6]. The standard oxidation potential of hydroxyl radicals is as high as 2.80 V, only next to fluorine (E0: 3.06 V). Numerous hazardous compounds can be non-selectively oxidized and decomposed to CO2, H2O, and inorganic ions by hydroxyl radicals. Typical AOPs include photocatalysis, Fenton process, ozone, hydrogen peroxide, cavitation, and plasma technology. These processes can convert refractory organics into smaller molecules, which can be adopted for the pretreatment of wastewater [5].
Compared to other AOPs, the plasma-based oxidation methods can simultaneously generate diverse physical and chemical effects, such as electric field, UV light, shockwave, and reactive species including •OH, •O, O3, H2O2, etc. [7]. All of these can be generated without additional chemical agents. As a promising plasma discharge mode, non-thermal plasma (NTP) technique can be utilized to degrade pollutants in wastewater at atmospheric pressure and room temperature with lower input energy than thermal plasma [8]. The typical NTP discharge in, and in contact with, liquids can be divided into three parts, namely, direct discharge in liquids, discharge in gas phase over a liquid, and discharge in multiphase environment such as bubbles or foams inside liquids [7].
For discharge in gas phase over a liquid, the gas breakdown occurs in the gap between liquid and high voltage plate. Thus, plasma active species and high energy electrons are generated and then transferred into liquids to react with organic compound [9,10]. The efficiency of NTP reactors is mainly relevant to the efficiency of mass transfer between gas and liquid phases. A packed water jet bed plasma reactor was put forward by Foster et al. [11] to maximize the plasma contact area with the water. The parallel operation of multiple plasma jets or packed bed arrays of water streams are potential solutions to the scale-up problem. Tichonovas et al. [4] and Li et al. [12] proposed a dielectric barrier discharge (DBD) reactor and a gas–liquid plasma reactor, respectively. In their reactors, the gas was sent into the discharge zone, with plasma generated and dispersed into liquid phase by porous ceramic diffusers. This process can increase the efficiency of mass transfer of active species into liquid, resulting in enhanced degradation efficiency. However, the active species diffused into liquid are mostly ozone since the other active radicals dissipate during diffusion process due to their short lifetime [13]. Thus, the mineralization of contaminants in wastewater is difficult to achieve. Therefore, it is necessary to design an effective discharge reactor which can generate plasma species in situ for decomposition and mineralization of wastewater.
Packed bed dielectric barrier discharge plasma reactors have attracted increasing attention due to their high energy efficiency in air pollutant treatment [14]. The existence of the packing beads in the discharge zone changes the electric field discharge distribution. Thus, enhanced electric field can be produced at the contact points between beads, which can promote the generation of plasma active species [15]. In addition, microdischarges in micropores were used to generate high energy electrons and plasma active species with high density, without consuming high energy [16,17]. Hensel et al. [18] studied the ozone generation by capillary microplasmas. Gary Eden et al. [19] invented microchannel reactor devices for ozone generation using microdischarges. However, few studies on wastewater treatment using microdischarges were reported. In this paper, an upgraded dielectric barrier discharge (DBD) plasma reactor, combining a bead packed bed and porous diffuser plate, was put forward for the treatment of dyeing wastewater. The bead packed bed was used to improve discharge homogenization and enhance energy efficiency. The microporous diffuser plate was used as a gas diffuser to generate bubbles in water to improve the mass transfer between the plasma active species and water sample. More importantly, microdischarges can be generated in micropores in the porous diffuser plate, which would result in more formation of plasma active species.
In this study, the performance of the present reactor in degradation of dyeing wastewater was evaluated with methylene blue (MB) solution as the model wastewater. The effects of air flow rate, initial solution concentration, initial solution pH, and initial solution conductivity on the MB degradation efficiency were examined. Furthermore, comparison experiments of wastewater treatment by the present reactor and ozone alone were conducted. The addition of t-butanol as the radical scavenger was used to further verify the in-situ generation of plasma active species. Moreover, chemical oxygen demand (COD) and total organic carbon (TOC) were determined to investigate the mineralization of MB solution. Finally, the possible degradation pathway was put forward.

2. Materials and Methods

2.1. Materials

Methylene blue (98 wt %), potassium iodide (KI, 99 wt %), potassium chloride (KCl, 99.5 wt %), sodium thiosulfate (Na2S2O3, 99 wt %), sodium hydroxide (NaOH, 96 wt %), sulfuric acid (H2SO4, 95–98 wt %), hydrochloric acid (HCl, 36–38 wt %), and t-Butanol (99%) were purchased from the related companies. The purity of methanol and dichloromethane used for liquid chromatography was HPLC grade (99.9 wt %). Deionized water was used for solution preparation.

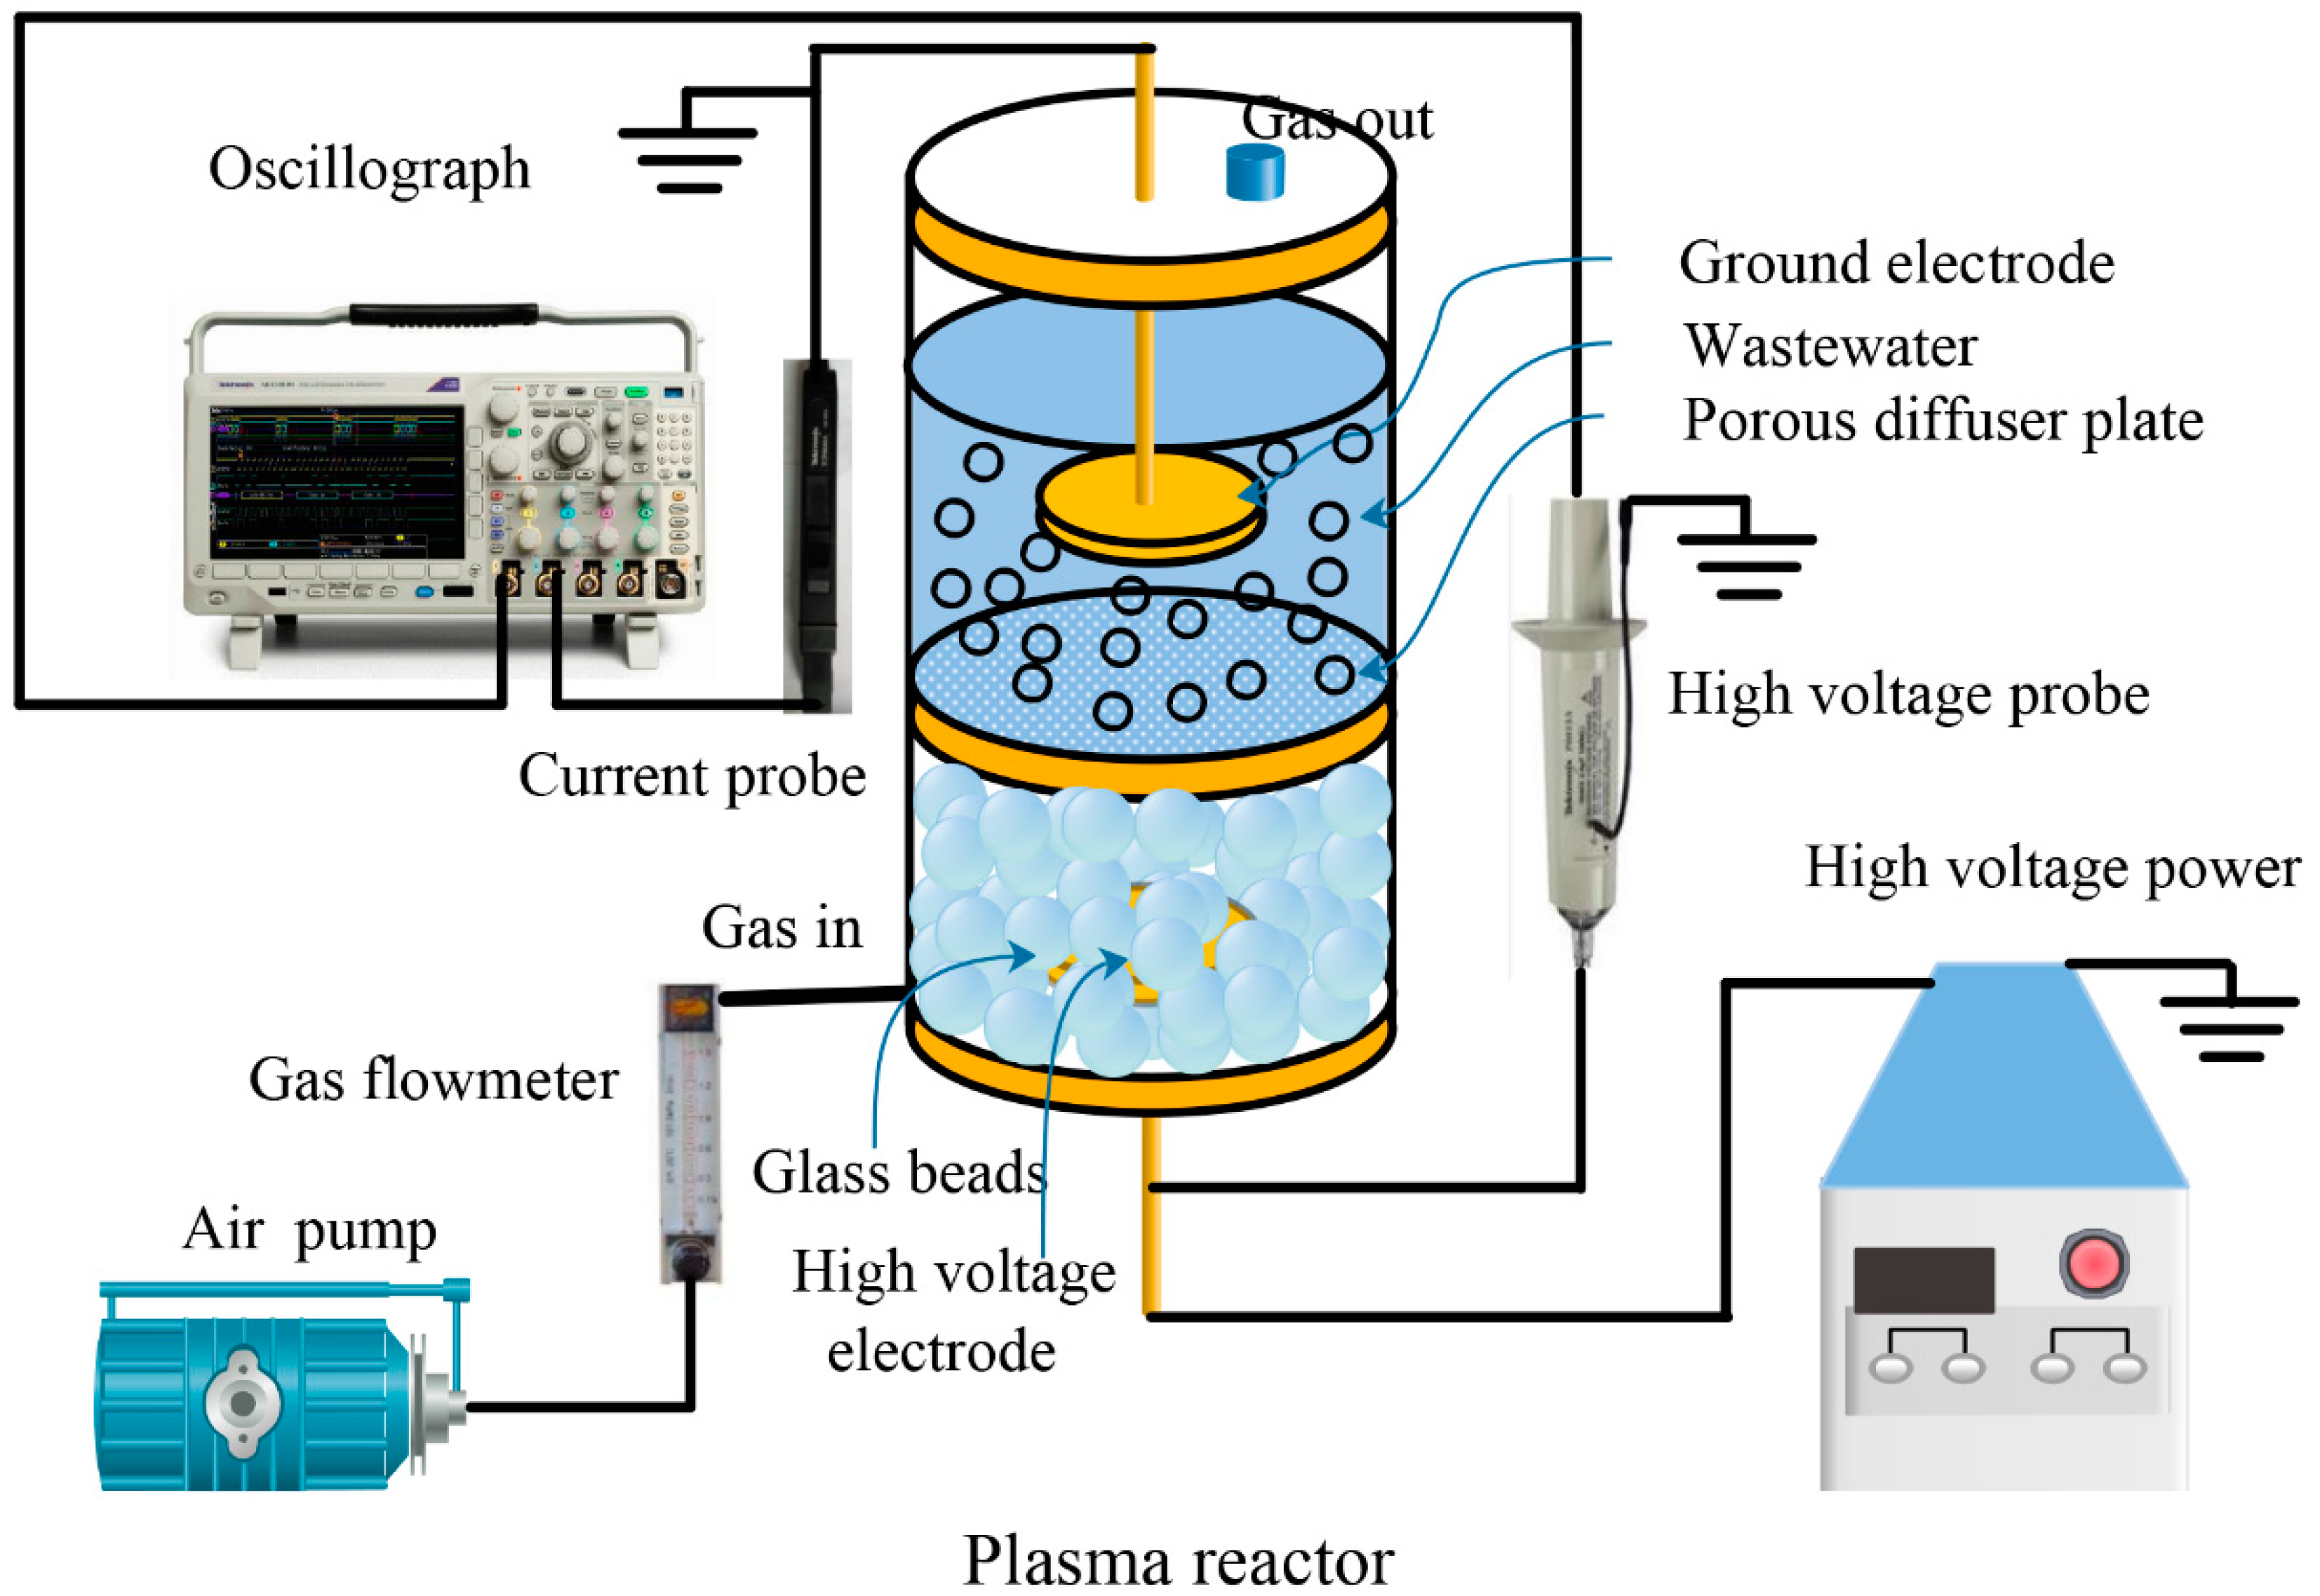
2.2. Experimental Setup

Figure 1 shows the DBD plasma reactor comprising a glass tank (inner diameter: 60 mm; height: 100 mm), SiO2 based porous diffuser plate (average pore size: 15–30 μm; diameter: 45 mm; thickness: 5 mm), and stainless steel plates (diameter: 30 mm; height: 3 mm) as ground and high voltage electrodes. High frequency power (CTP-2000K, Nanjing Suman Electronics Co., Ltd., Nanjing, China) was used to supply high voltage to the DBD plasma reactor. The output frequency of the power generator can be adjusted from 1 to 100 kHz. The output voltage can be adjusted up to 30 kV using alternating voltage. The typical frequency, voltage, and current applied to the plasma reactor were 9.7 kHz, 6–8 kV, and about 30–50 mA, respectively. The high voltage electrode was surrounded by 45 glass beads (diameter: 4 mm) and placed below the porous diffuser plate. The ground electrode was immersed in liquid. The distance from high voltage electrode to porous diffuser plate was 4 mm. The indoor air was fed to the DBD plasma reactor from the bottom by an air pump, and ozone formed in the bead packed bed region was dispersed into wastewater through the microporous diffuser plate. In addition, the plasma active species were generated by microdischarges in micropores on the porous diffuser plate and directly reacted with contaminants in wastewater.
Batch experiments were carried out to explore the influence of different factors (air flow rate, initial solution concentration, initial solution pH, and initial solution conductivity) on the efficiency of MB degradation using plasma reactor. Initial solution pH was modified by sodium hydroxide and hydrochloric acid. Initial solution conductivity was adjusted by potassium chloride. For each batch experiment, the total volume of the system was 100 mL. In addition, MB degradation by plasma treatment was compared with that by ozone treatment. Ozone was supplied by an ozone generator, with the concentration consistent with that under the plasma treatment condition. In addition, to verify the generation of hydroxyl radical, t-butanol as the radical scavenger was introduced into the MB wastewater followed by plasma or ozone treatment.
Furthermore, MB solution was treated by plasma for 10 min, followed by being extracted with 10 mL dichloromethane for degradation products analysis. The mixture was ultrasonically treated for 30 min, and the organic layer was then analyzed.

2.3. Analysis Methods

Samples were taken during the same intervals. The MB concentration was measured using Agilent Cary 60 UV-Visible spectrophotometer (Santa Clara, CA, USA). The characteristic absorption wavelength of MB at 664 nm was adopted. The MB degradation efficiency η is defined as follows:
η ( % ) = C 0 C t C 0 × 100 ,
where C0 is the initial MB concentration, and Ct is the concentration at t time. The pH of the solution was measured by a pH meter (PHS-3E, INESA Scientific Instrument Co., Ltd., Shanghai, China). The conductivity of the solution was measured by a conductivity meter (DDS-307A, INESA Scientific Instrument Co., Ltd., Shanghai, China).
The concentration of outlet ozone was determined by iodometric method. Ozone was continuously generated in the plasma reactor and introduced into aqueous solution. After enough treatment time, the concentration of dissolved ozone in liquid phase can reach equilibrium with that in gas phase. Thus, the accumulation of dissolved ozone in aqueous solution was negligible and hence the generation rate of ozone was considered to be equal with that measured at the outlet [4].
COD was analyzed by 5B-6C (V8) multi-parameter water quality analyzer (Lianhua Technology Co., Ltd., Beijing, China). TOC was measured by TOC-VCPN analyzer (Shimadzu, Kyoto, Japan).
A high voltage probe (P6015A) and a current probe (TCP-0030A, Tektronix, Shanghai, China) were used to measure the voltage (U) and the current (I) applied to the DBD reactor, respectively. The time response and bandwidth of the current probe and voltage probe were 7 ns, 120 MHz and 4 ns, 75 MHz, respectively. A digital oscilloscope (DPO 3052, Tektronix, Shanghai, China) was used to record the signal detected by the two probes. The discharge power for the reactor was calculated by the following equation:
P = f × 0 T U ( t ) · I ( t ) d t .
The energy yield for MB degradation can be calculated by the following equation:
Y ( g / k W h ) = C ( g / L ) × V ( L ) × 1 100 × η ( % ) P ( k W ) × t ( h ) ,
where C and V represent initial concentration and volume of MB solution (100 mL), respectively. η is the degradation efficiency at t time, and P is input power.
Liquid chromatography-mass spectrometry (LC-MS) (Waters 2695-ThermoFisher LCQTM Deca XP plus, Waltham, MA, USA) was used to analyze the degradation products with plasma treatment. The positive ion mode was adopted. The mobile phase was mixture of methanol and ultrapure water (9:1) at a flow rate of 0.5 mL/min. Degradation products with volume of 20 μL was injected to system with ESI source. The change in the bond structure of MB was determined on a Bruker Tensor II Fourier Transform infrared spectroscopy (FT-IR), with a resolution of 4 cm−1 and scanning time of 64. Each experiment was repeated at least three times.

3. Results and Discussion

3.1. MB Degradation Using the DBD Plasma Reactor

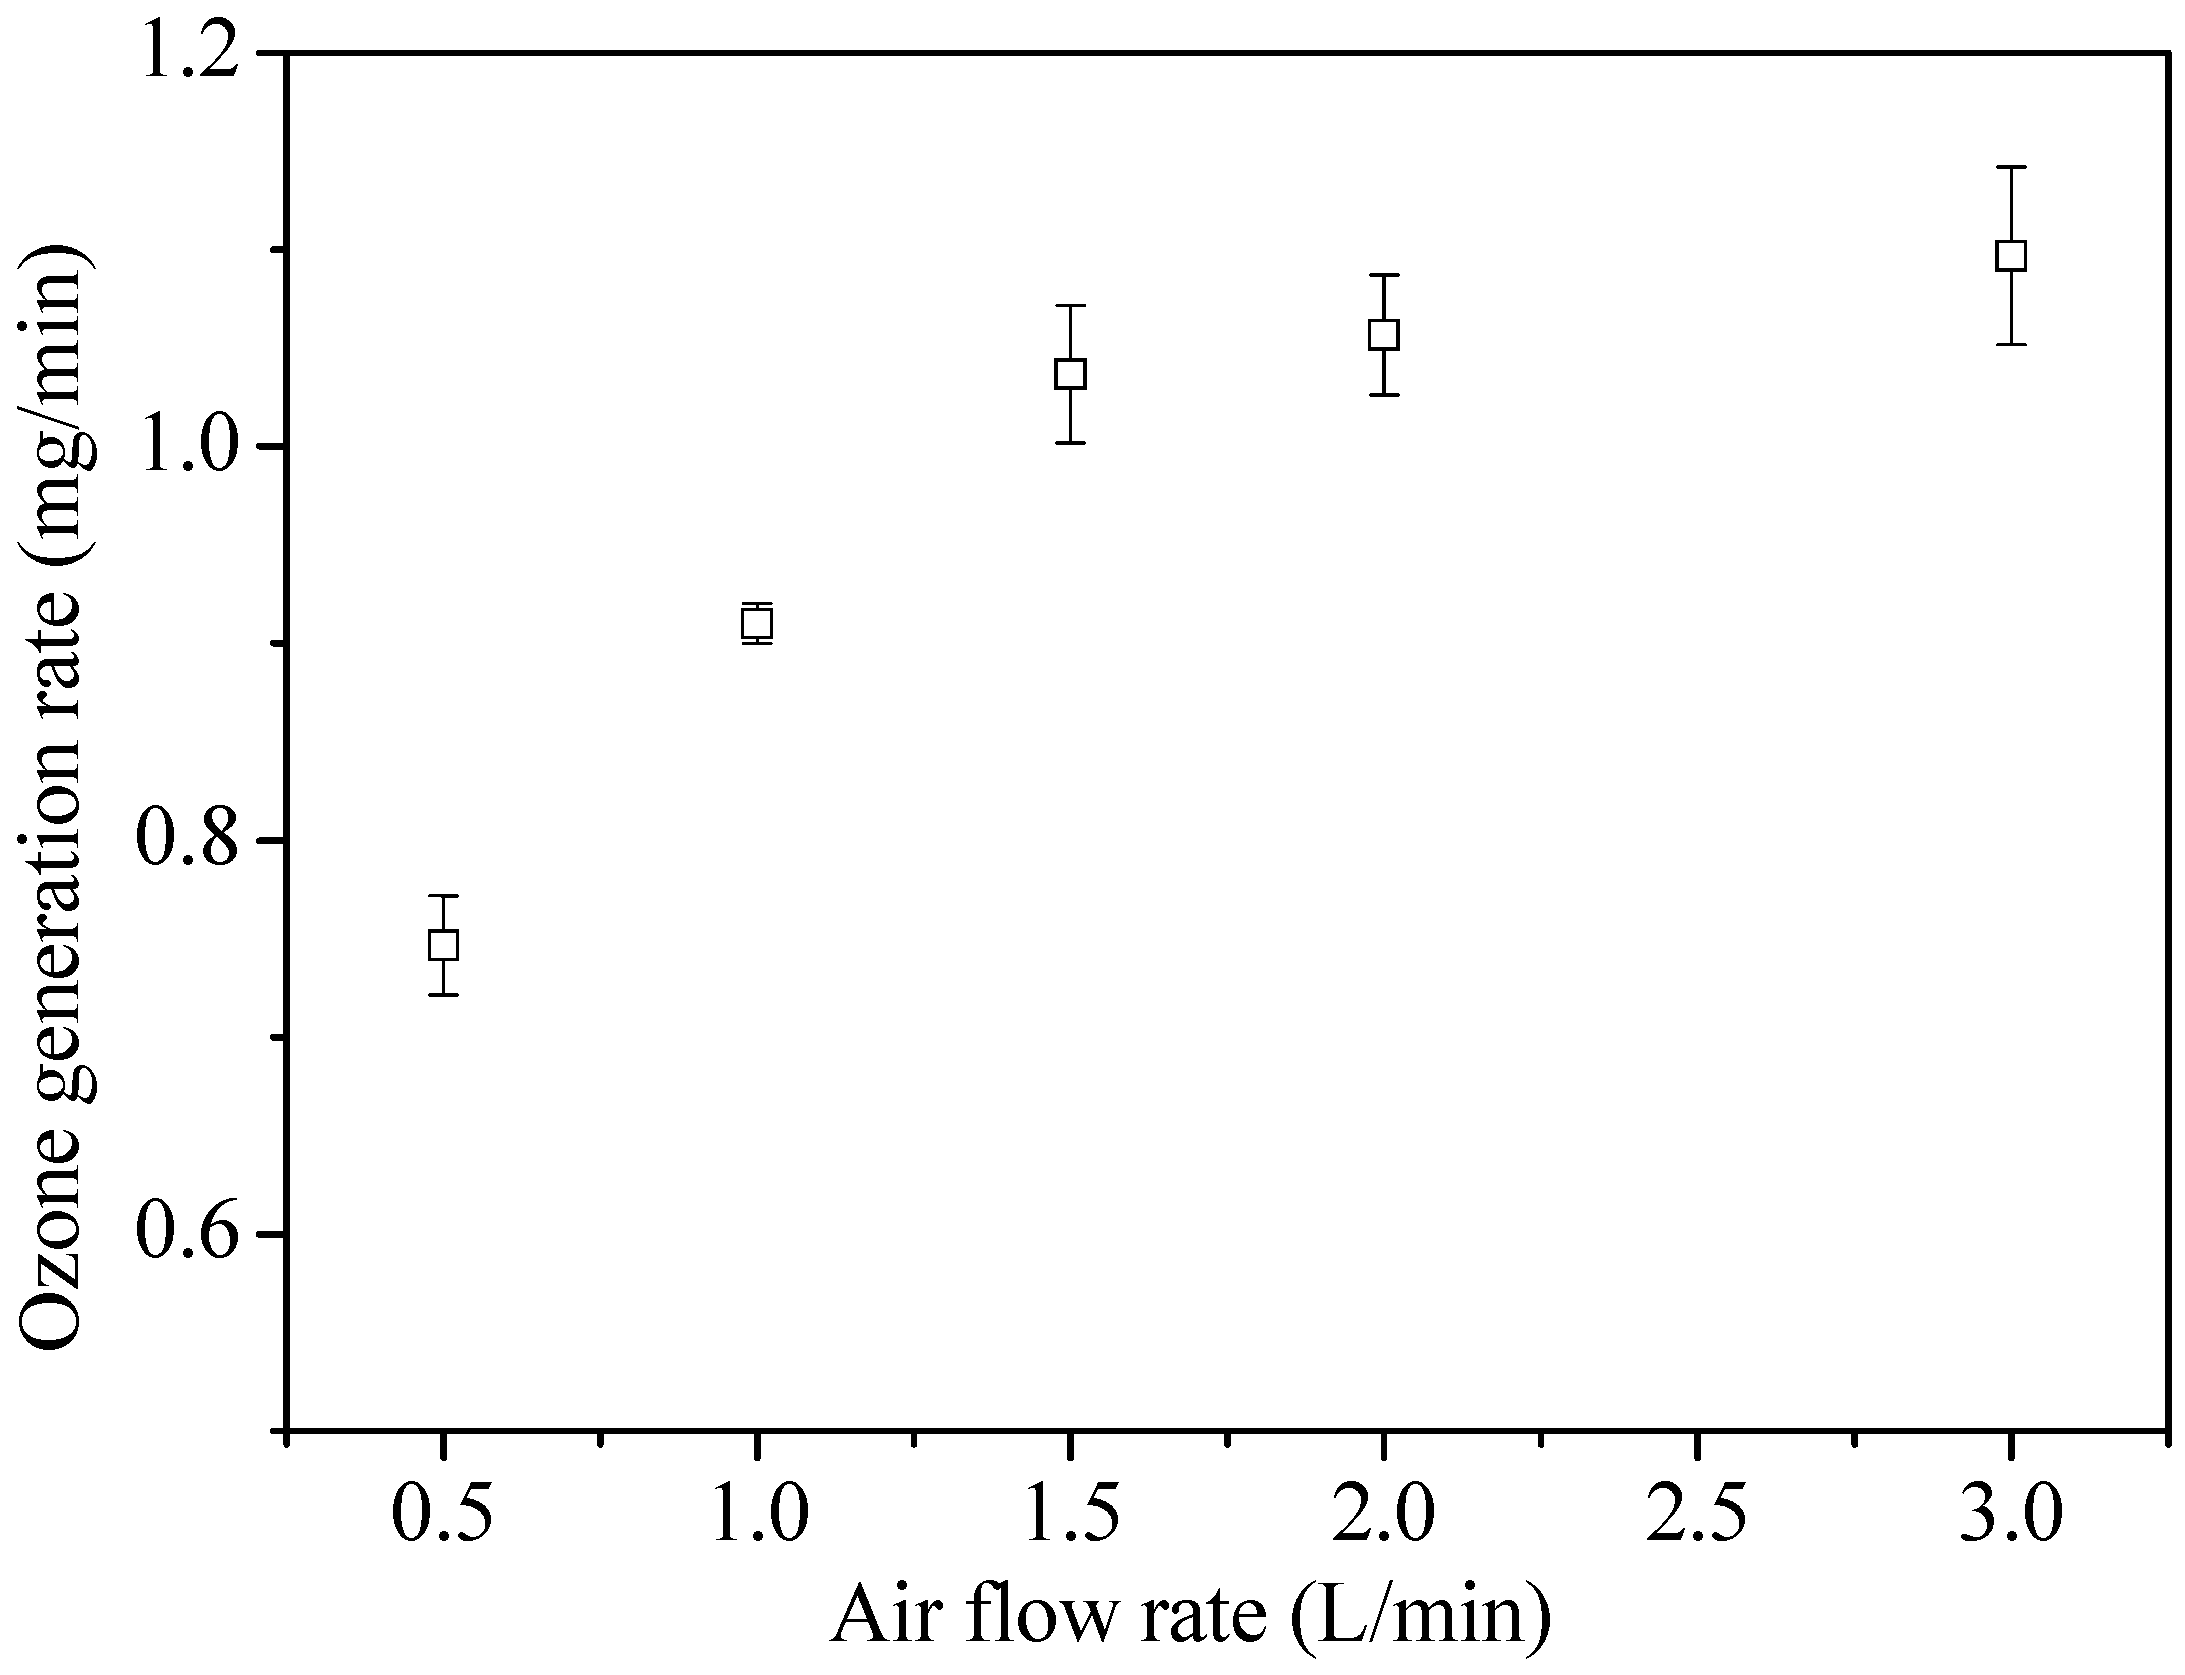
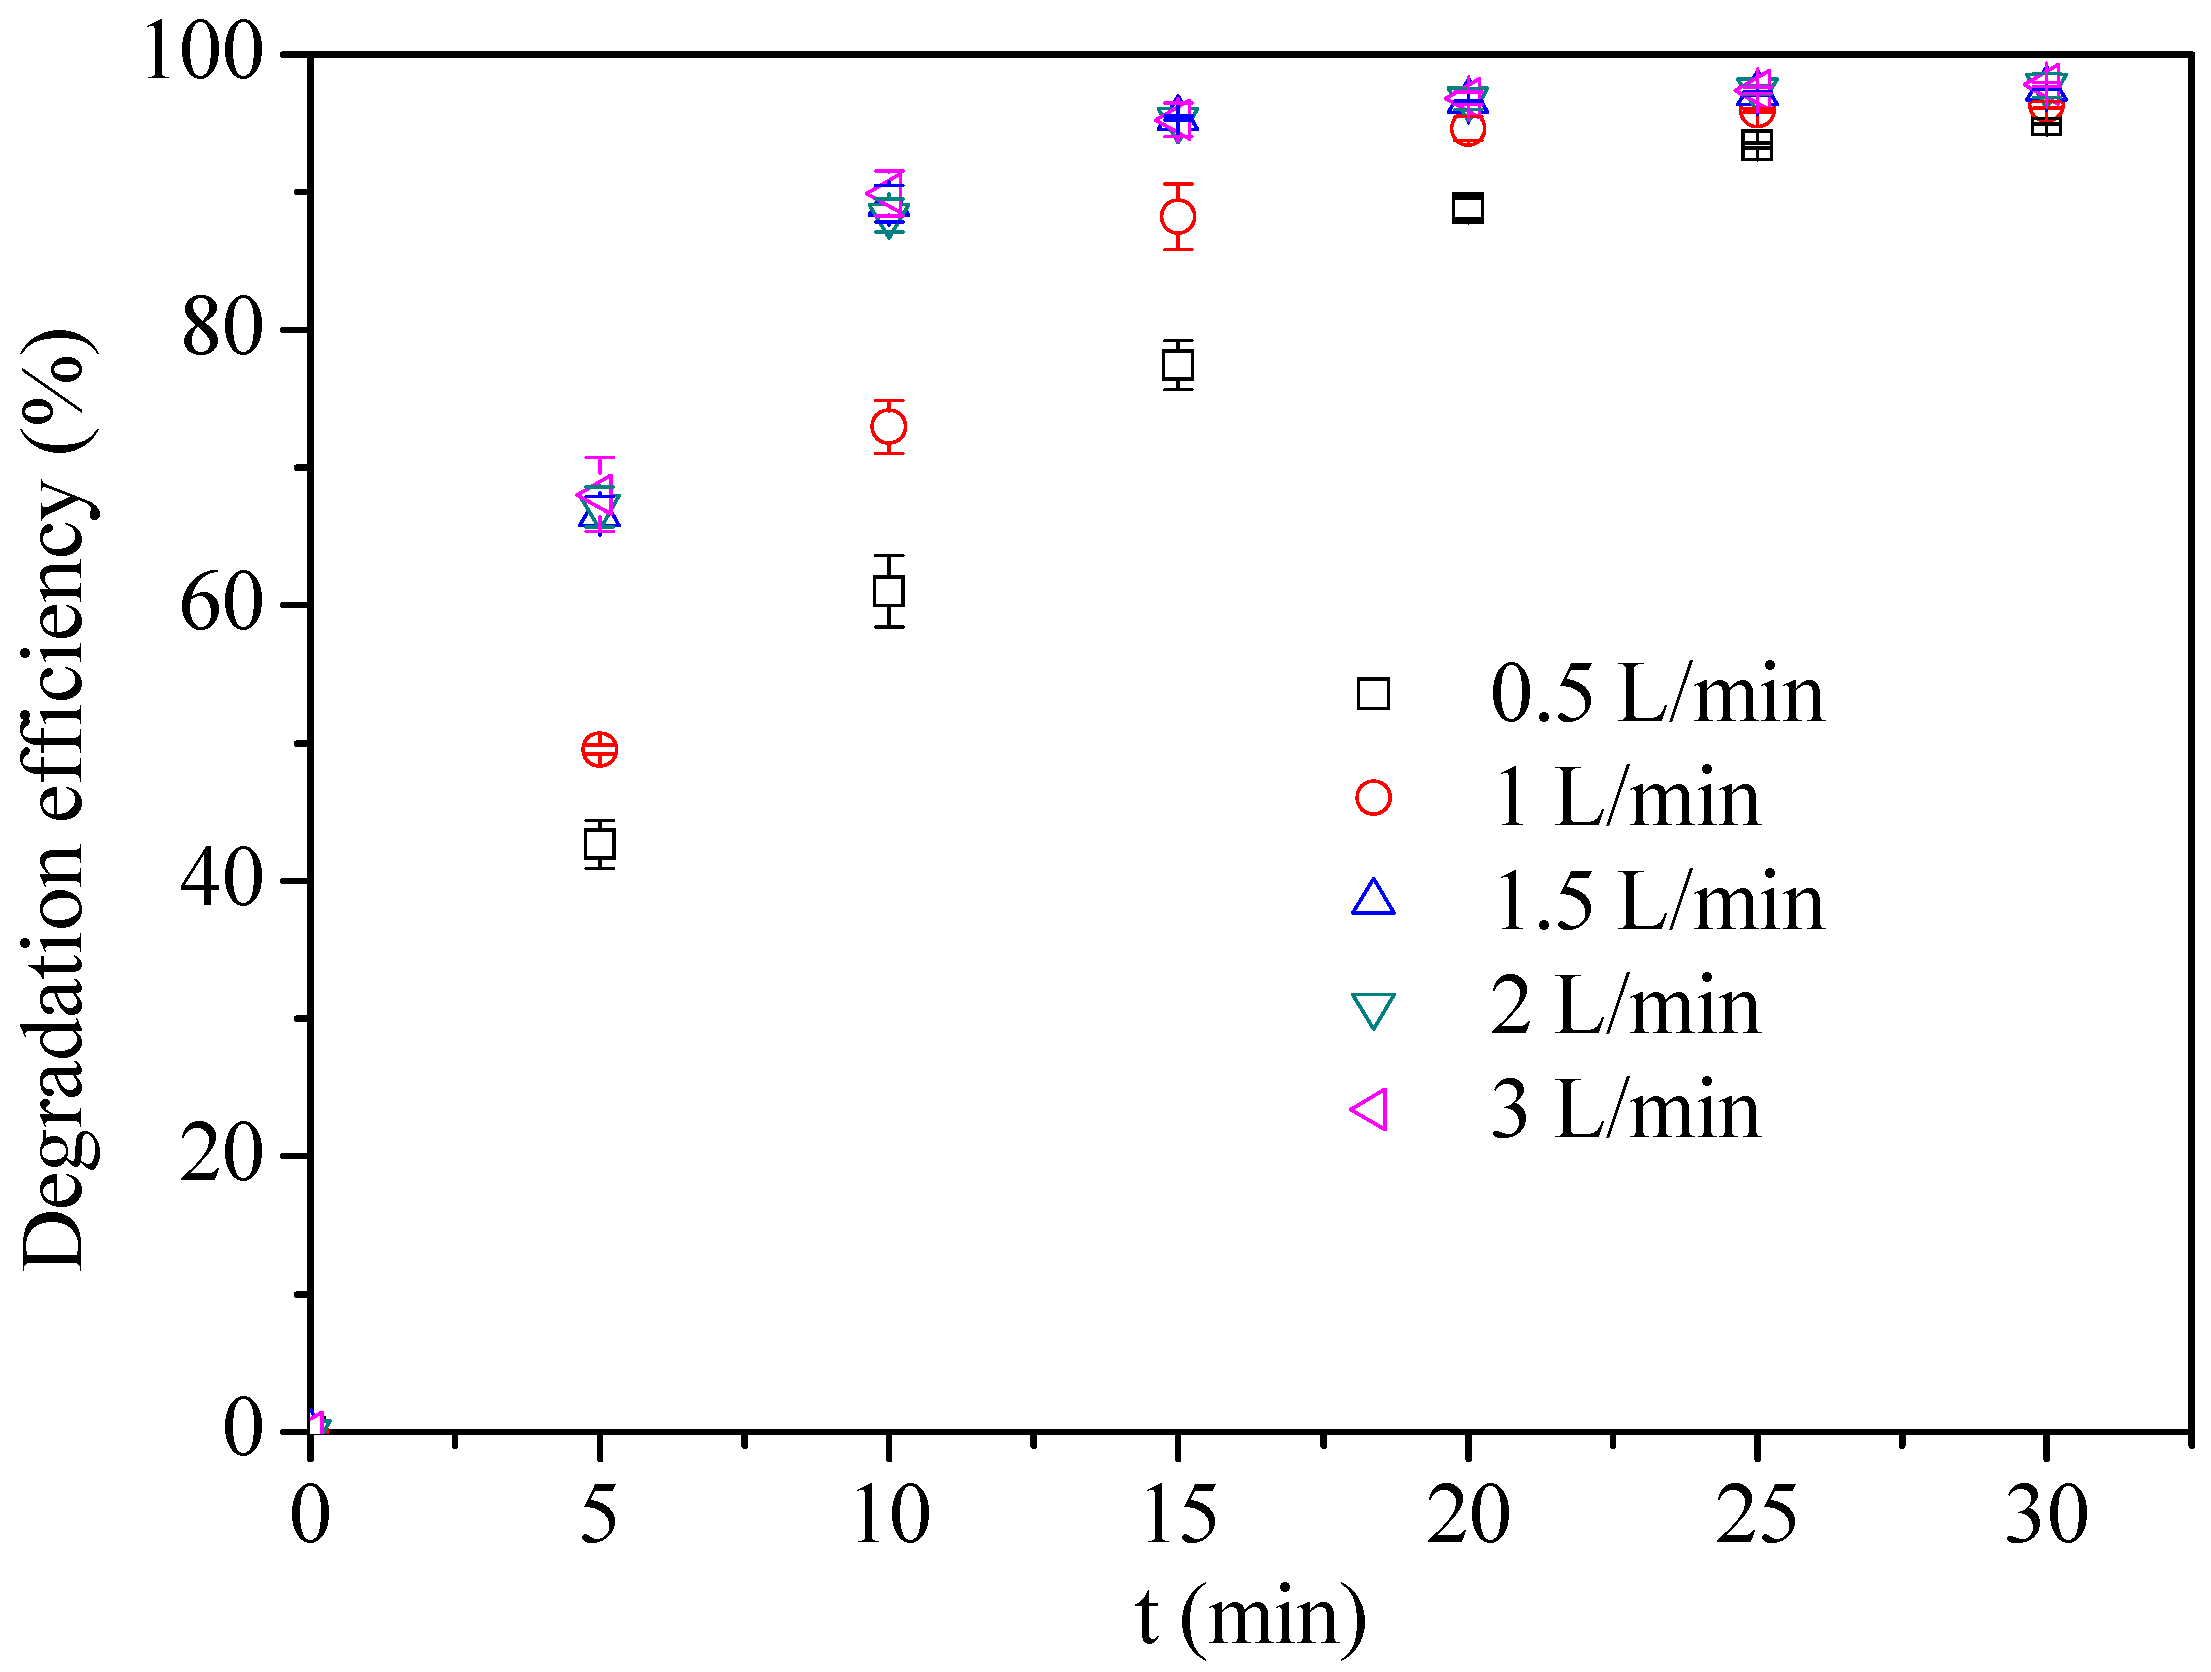
3.1.1. Effect of Air Flow Rate

The degradation process is largely influenced by the number of plasma active species. Since ozone exhibits a more steady state and can survive for longer, it can be used as a reflection of the number of plasma active species [10]. Hence, the effect of air flow rate on ozone generation rate was explored. As shown in Figure 2, more ozone was detected with the increase in air flow rate, which was because more high energy electrons were generated with increasing air flow rate and hence the collision probability between electrons and gas molecules was promoted. However, no significant change in ozone generation rate was found when the air flow rate was higher than 1.5 L/min. It was probably due to the limited energy provided to the reactor for active species generation and more ozone decomposition at higher concentration [20].
The effect of air flow rate on MB degradation efficiency is shown in Figure 3. The MB degradation was favored by higher air flow rate, which was mainly due to the increase in active species generation. The production of plasma active species was almost unchanged at the air flow rate of higher than 1.5 L/min, resulting in nearly the same tendency of MB degradation efficiency. On the other hand, gas bubbled into the liquid through the microporous diffuser plate. Thus, lower air flow rate resulted in smaller bubble size and larger specific mass transfer area. However, the total mass transfer area was still small due to a relatively small number of bubbles, leading to lower MB degradation efficiency. The total mass transfer area was increased with the increase in flow rate, yet the residence time of the bubbles in the liquid was reduced. Thus, the MB degradation efficiency firstly increased with increasing air flow rate and then remained almost unchanged. Overall, the air flow rate of 1.5 L/min was used in the following experiments.

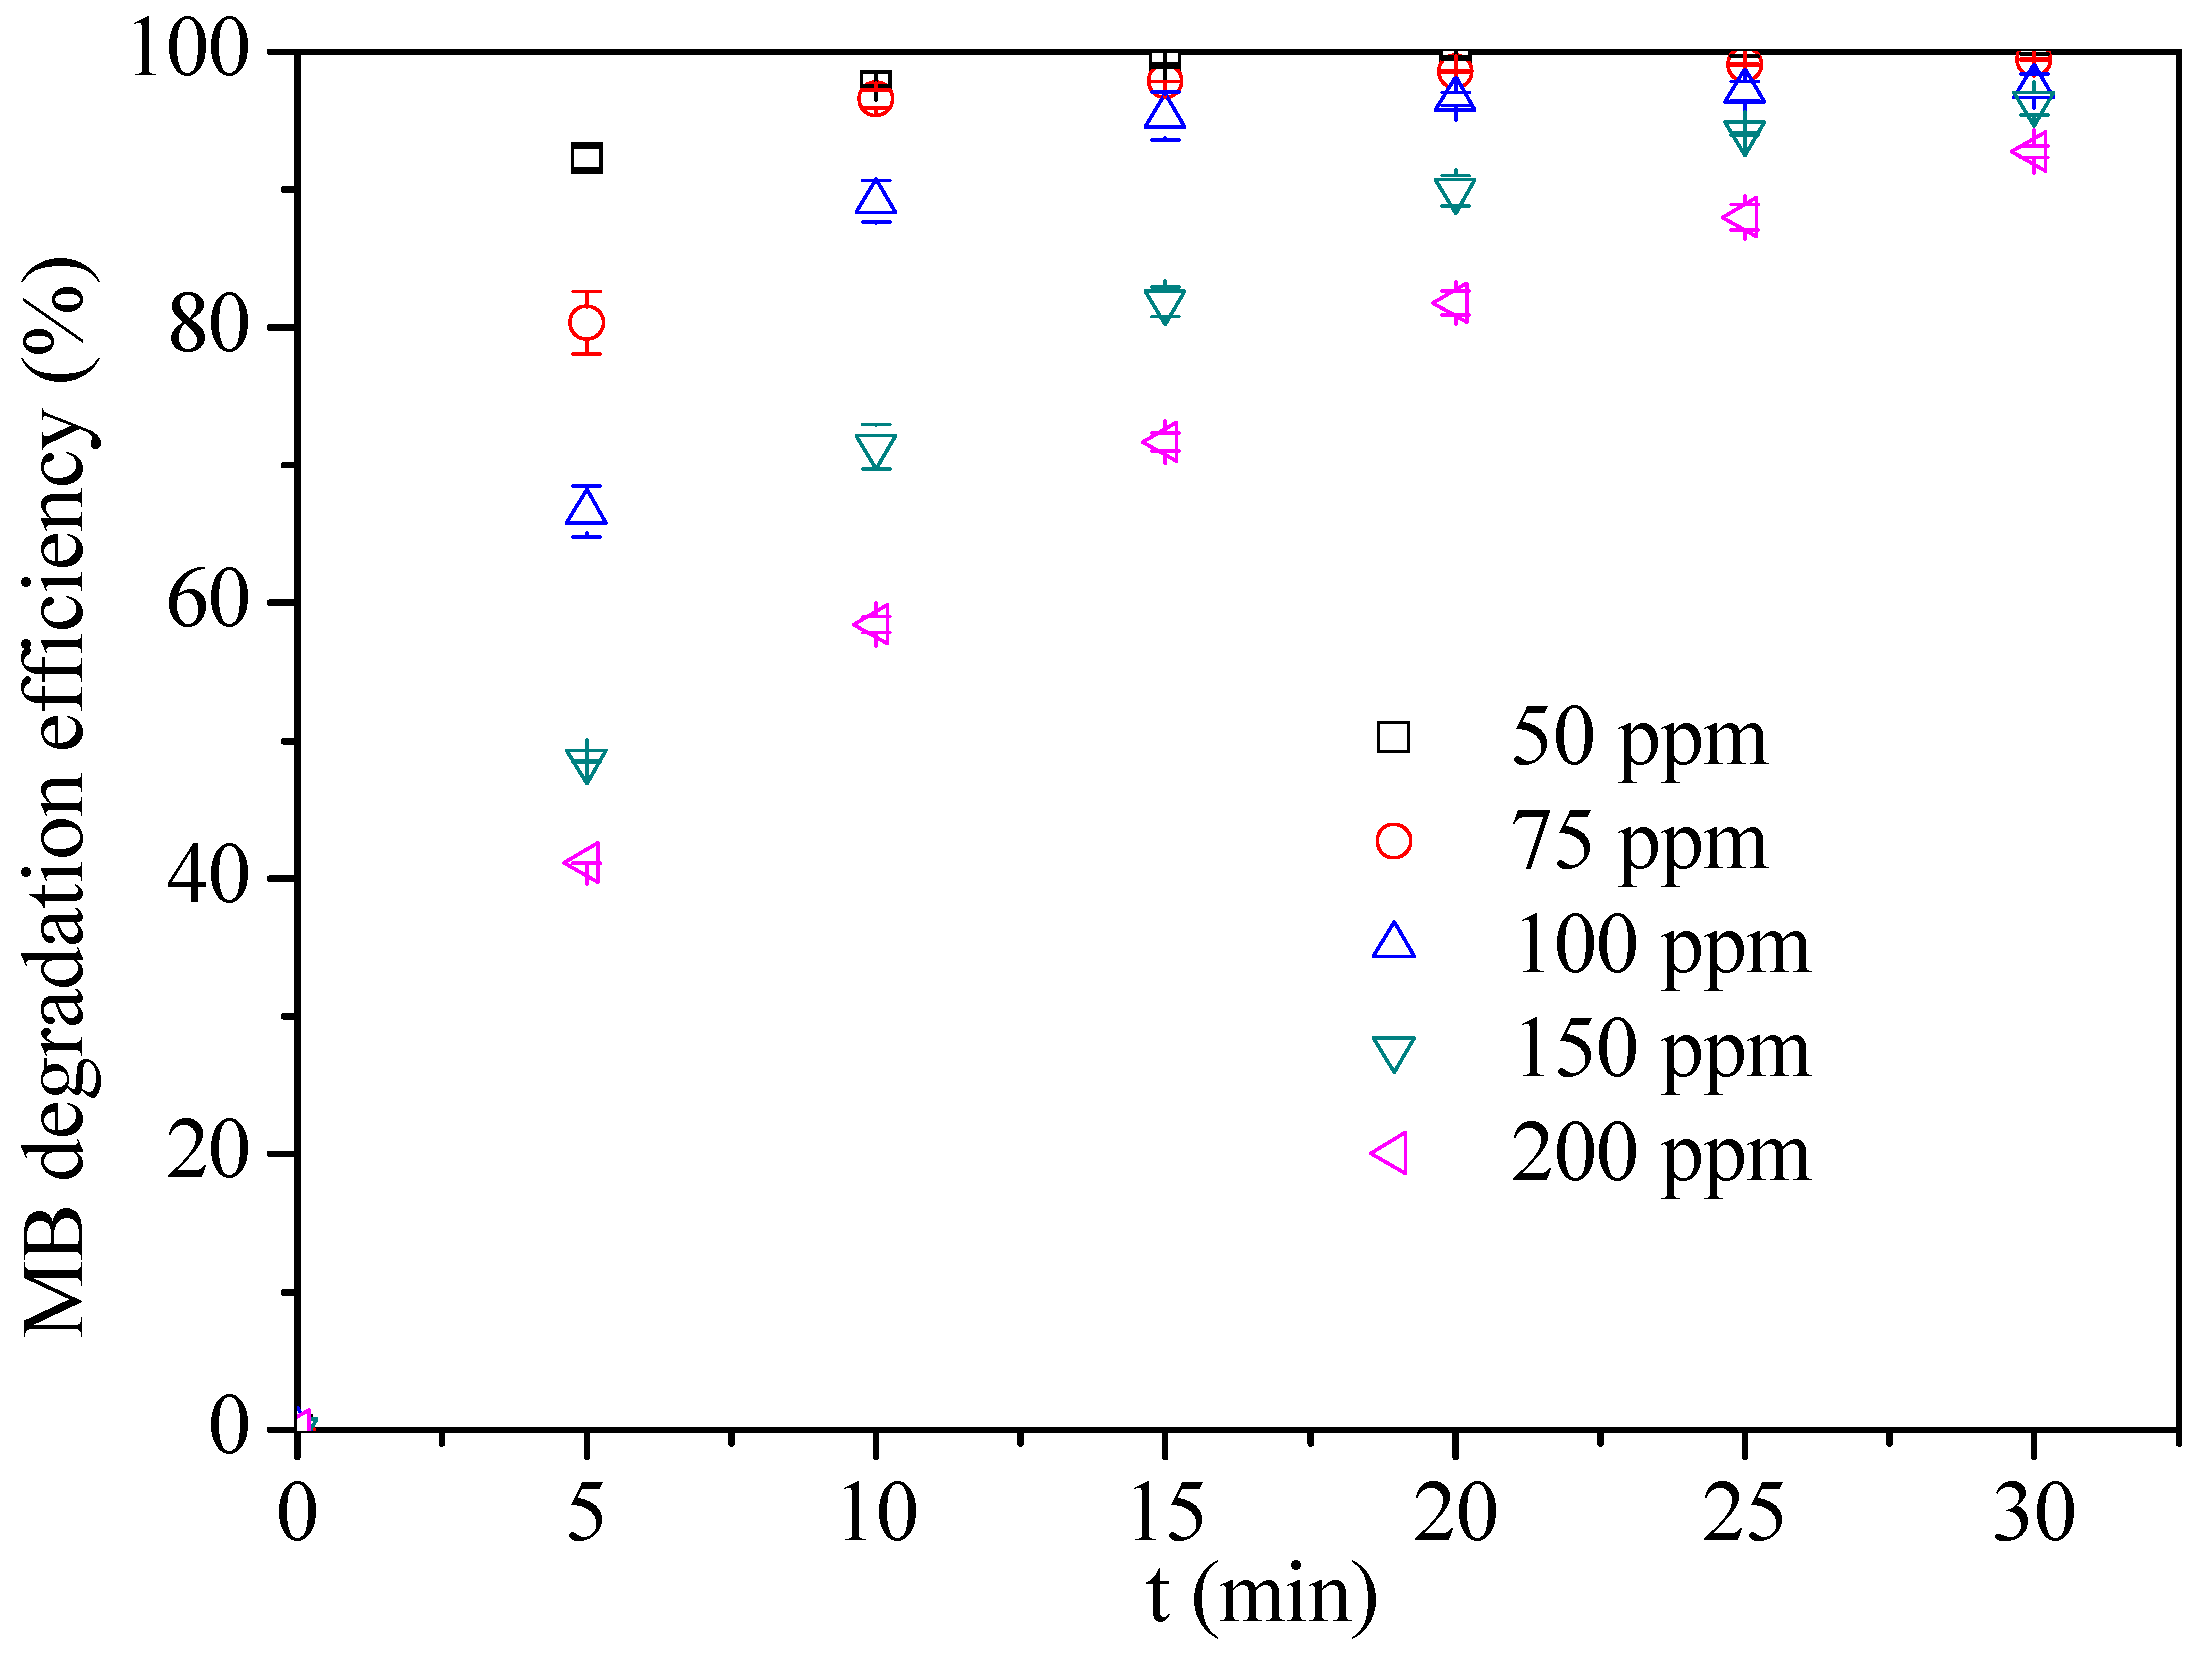
3.1.2. Effect of Initial MB Concentration

The effect of initial MB concentration (50, 75, 100, 150, 200 ppm) on degradation efficiency is displayed in Figure 4. The MB degradation efficiency at higher initial MB concentration was lower than that at lower initial MB concentration for the first 15 min. The main reason lies in the fact that for the constant energy input, the amount of plasma active species formed in the discharge process was maintained at a specific concentration level. Thus, the degradation efficiency would be reduced at higher pollutant concentration. It can be also noted that the MB degradation efficiency reached nearly 100% for three initial MB concentrations (50, 75, and 100 ppm) during adequate treatment time. It proved that the proposed plasma reactor is effective for MB degradation.

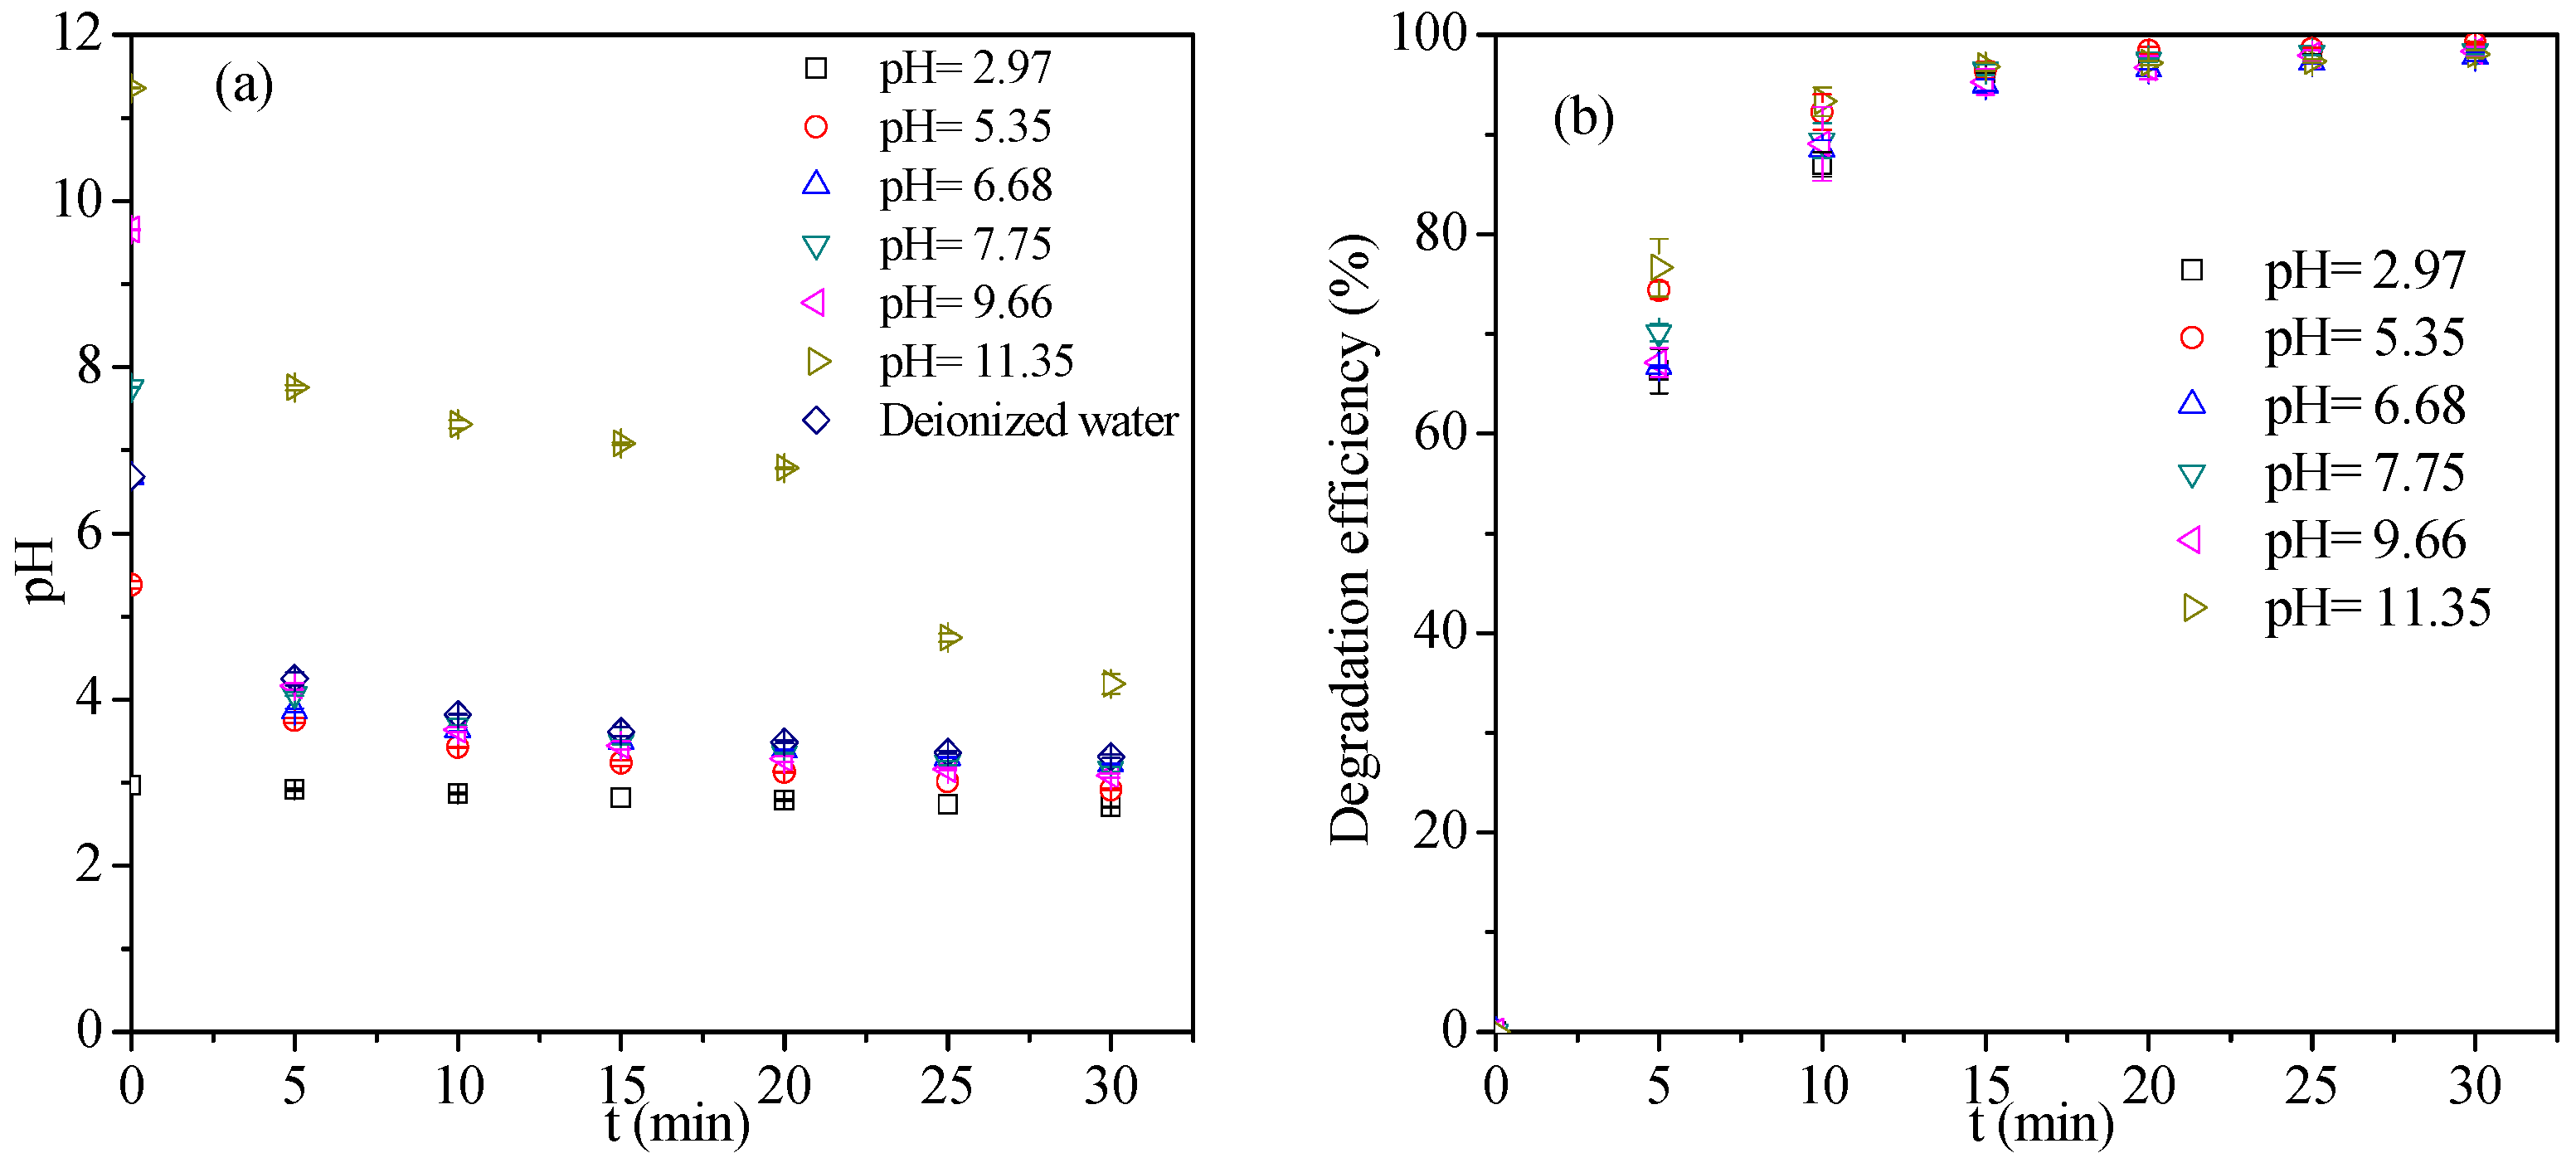
3.1.3. Effect of Initial Solution pH

Since actual dyeing wastewater ranges from acidic to alkaline conditions [21], it is necessary to investigate the effect of initial solution pH on MB degradation efficiency. Figure 5a shows the tendency of pH variation under different initial solution pH. The pH values of all the MB solutions gradually reached a certain level at the range of acidic condition. It was probably due to several special acidic compounds such as nitrous acid and nitric acid, which were originated from nitrogen in air during the discharge process as given in Equations (4)–(8) [10,22,23]. In addition, carboxylic intermediates which were produced in the MB degradation process can also contribute to a certain pH variation in solution. The reason was that more hydroxyl radicals were produced in acidic atmosphere and enhanced decomposition of O3 into hydroxyl radicals in the presence of OH [24]. However, the ultimate efficiency reached up to about 100% for all solutions after 30 min treatment. It suggested application potential of the reactor in the treatment of dyeing wastewater with various initial pH.
O 2 + e 2 O · + e ,
N 2 + e 2 N · + e ,
N · +   O · NO ,
NO + O · NO 2 ,
NO 2 + H 2 O NO 3 + 2 H + .

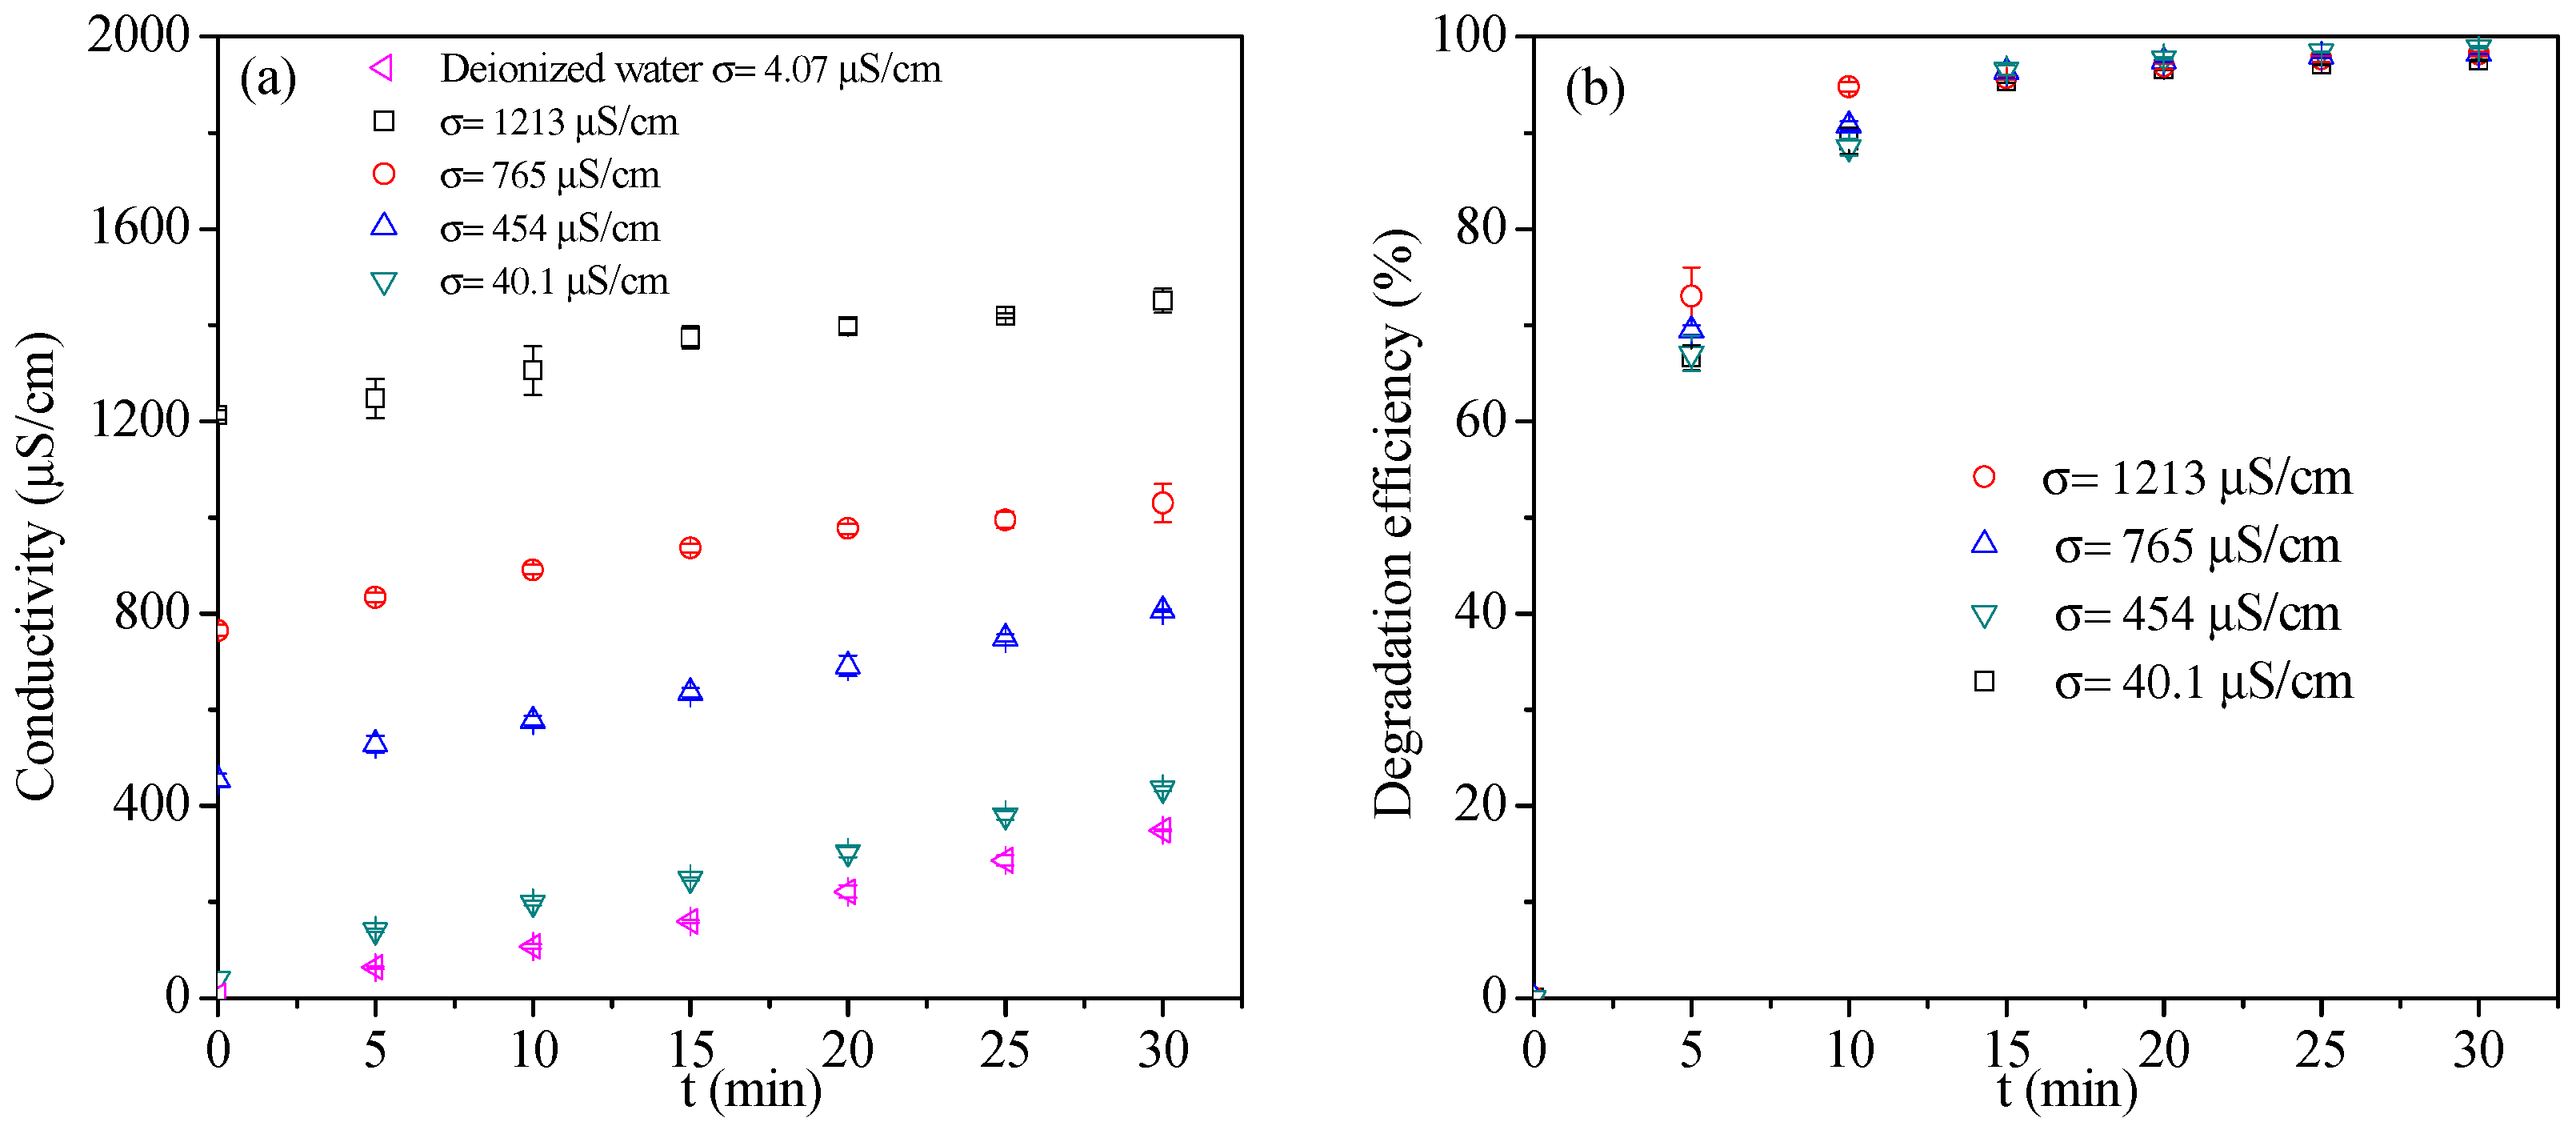
3.1.4. Effect of Initial Solution Conductivity

Figure 6 shows the change in conductivity during the MB degradation process and the MB degradation efficiency under different initial solution conductivities. Continuous increase in solution conductivity was observed, which was mainly due to the formation of acidic substances and degradation intermediates by plasma. The conductivity variation within the 30 min discharge was increased from 202 to 395.4 μS/cm with the decrease in initial solution conductivity from 1213 to 40.1 μS/cm. It may be attributed to conversion of soluble substances to insoluble ones at higher initial solution conductivity, which slightly reduced the conductivity of the solution [4]. However, almost complete MB degradation was achieved after 30 min treatment for various initial solution conductivities. It indicated that the proposed reactor has the potential for the treatment of dyeing wastewater with a wide range of initial conductivities.

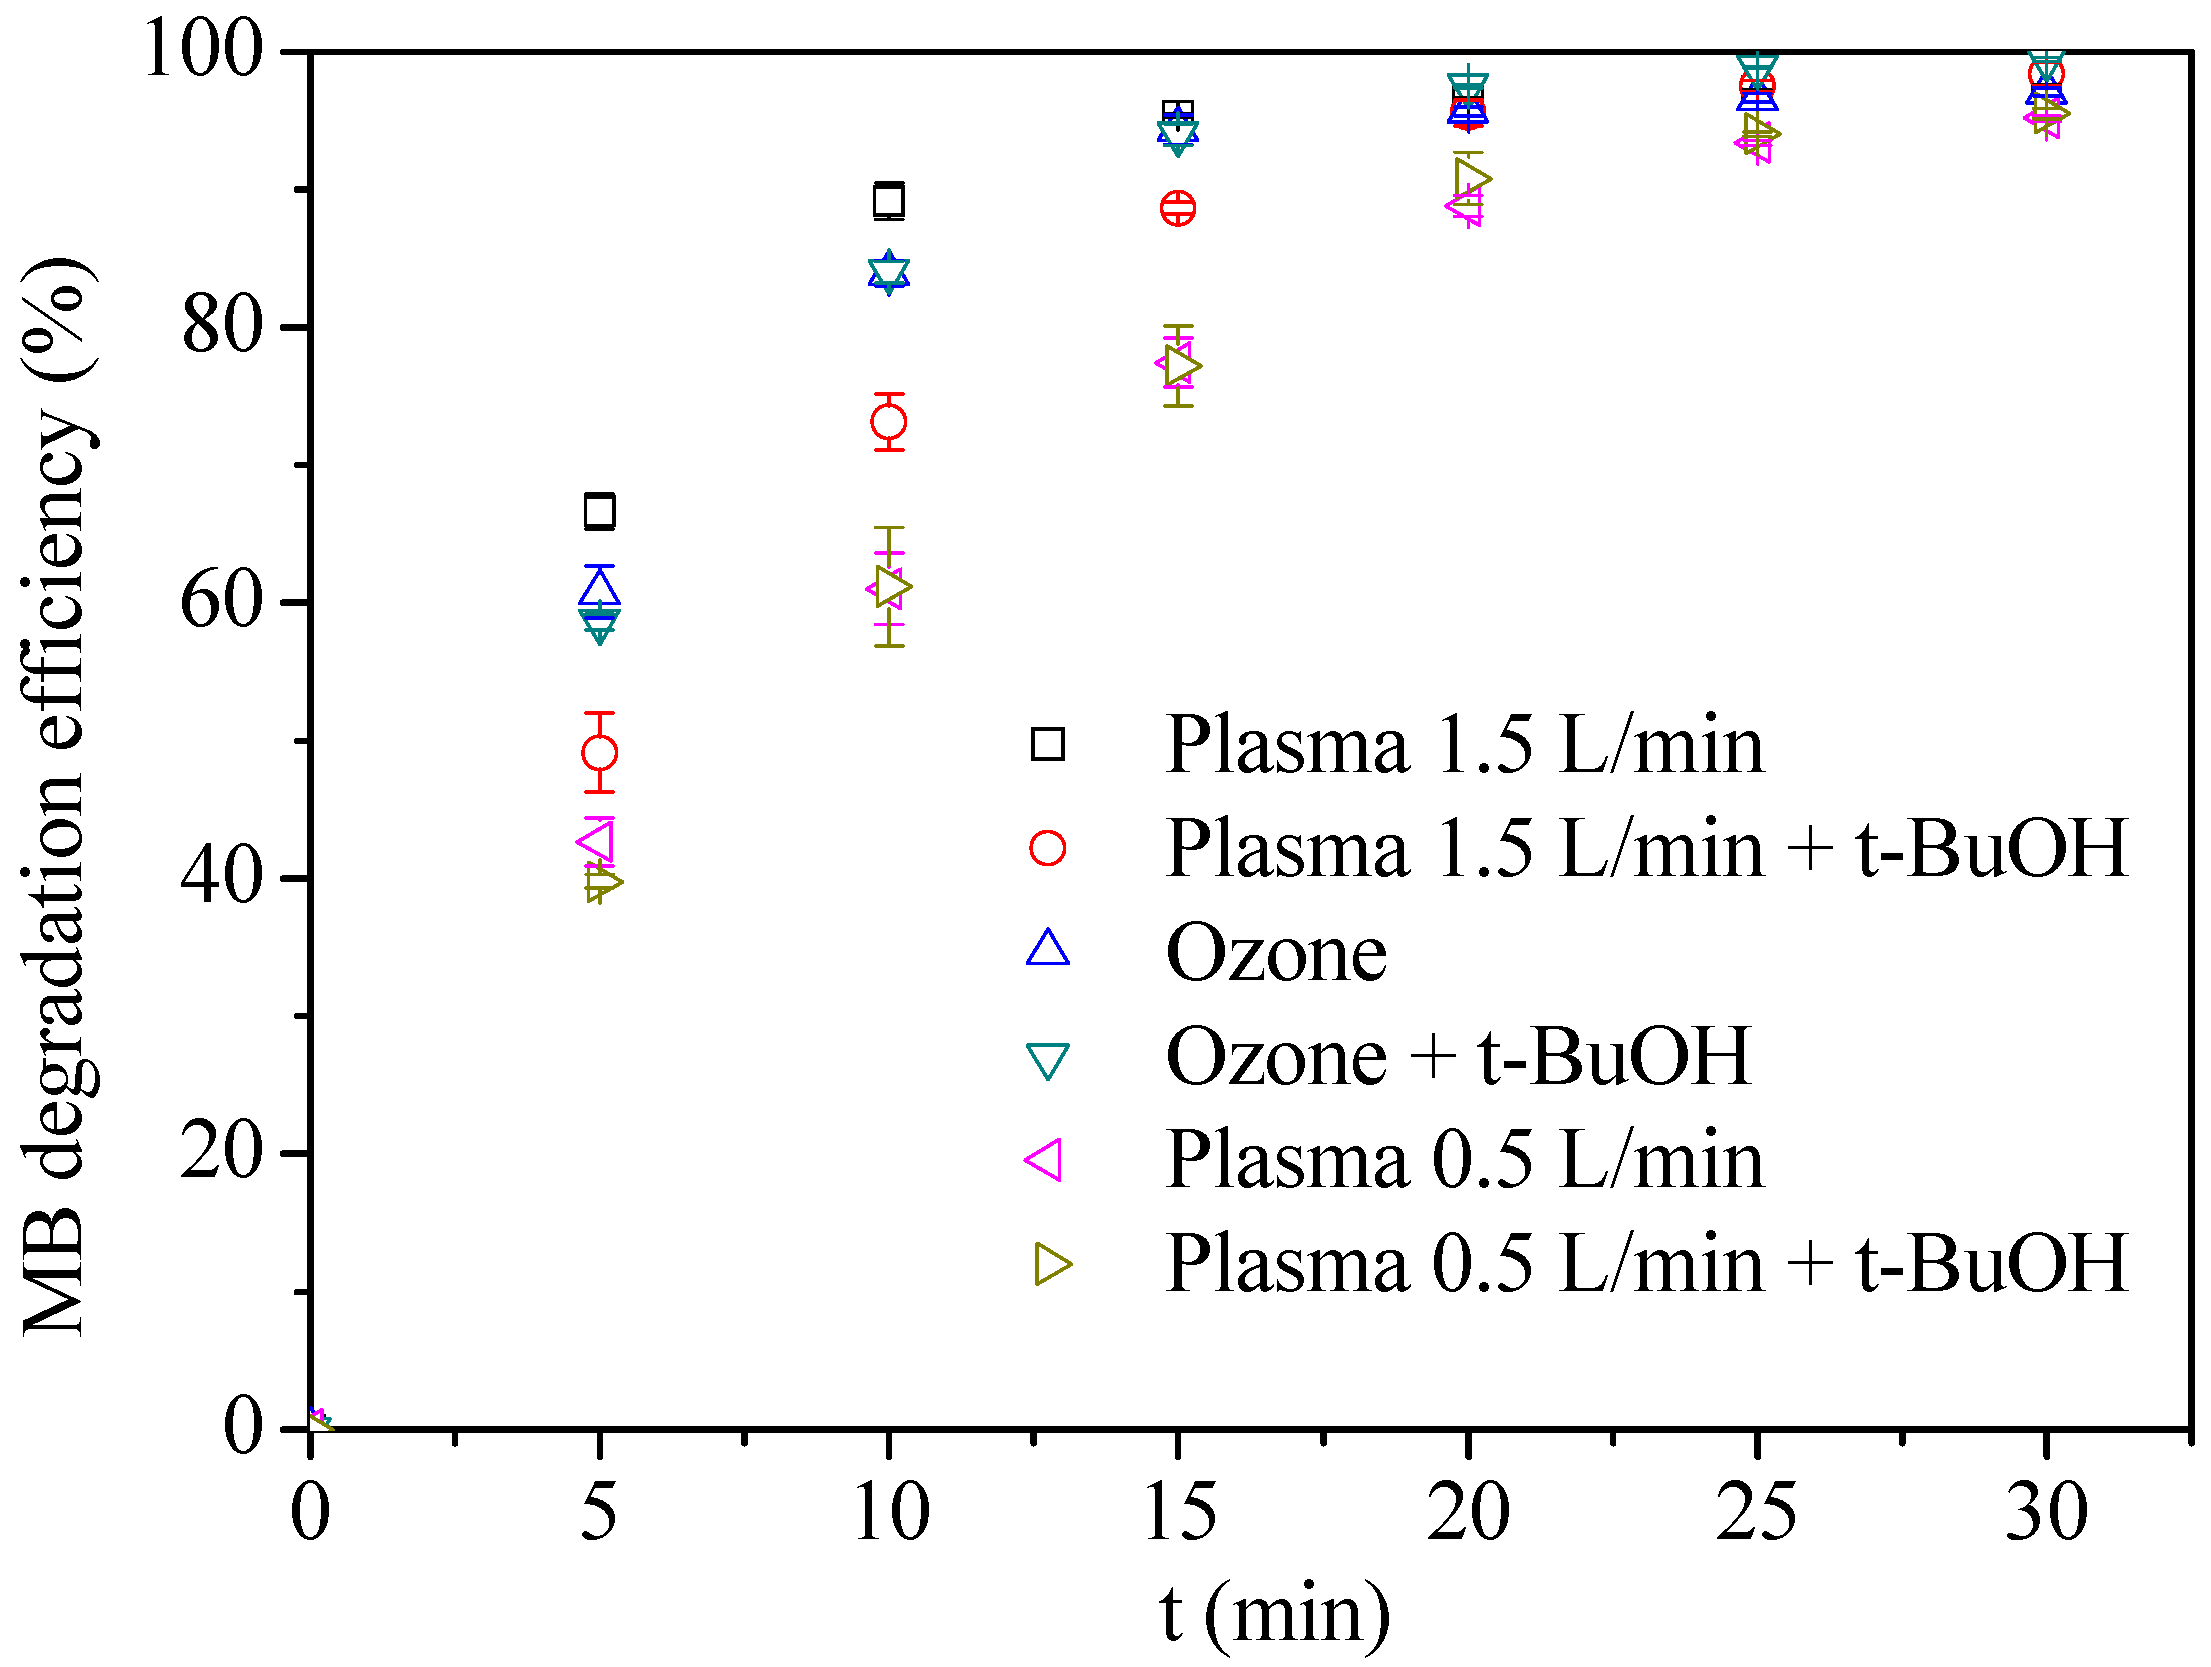
3.2. Comparison of Ozone and Plasma on MB Degradation

MB degradation by plasma treatment was compared with that by ozone treatment. Ozone was supplied by an ozone generator, with the concentration consistent with that under plasma treatment condition. As shown in Figure 7, the degradation efficiency under plasma treatment condition was higher than that under ozone treatment condition for first 15 min treatment. It was mainly attributed to the free radicals generated by discharge, such as •OH, •O, •N, and •H, which enhanced the MB degradation. Since the lifetime of these free radicals is very short (1 ns–1 μs) [13], the radicals can only be produced in situ through microdischarges in micropores. Nearly complete MB degradation was also observed by ozone treatment after 30 min, which was mainly due to the excess ozone used. As shown in Table 1, the energy efficiency was 9.3 g/kWh under plasma treatment, which was significantly higher than that obtained by other researchers.
t-Butanol, acting as a well-known radical scavenger, can react with a wide range of radicals, especially hydroxyl radical. Meanwhile, its reaction with ozone can be neglected [25]. In order to verify the in-situ generation of free radicals, the excess t-butanol (100 ppm) was injected to the MB solution, which was then subjected to ozone and plasma treatment. As shown in Figure 7, the addition of t-butanol largely reduced the MB degradation rate and efficiency under plasma treatment condition at 1.5 L/min. However, no obvious change in MB degradation efficiency was observed at 0.5 L/min. By contrast, the degradation efficiency after 30 min treatment slightly increased from 96.9% to 99.3% under ozone condition. It was mainly because t-butanol reduced the surface tension and viscosity of the aqueous solution, resulting in smaller gas bubbles. Thus, the mass transfer between ozone and wastewater was enhanced, which increased the MB degradation efficiency [26]. Notably, the degradation efficiency under plasma treatment condition with t-butanol addition was even lower than that under ozone condition. It was probably because t-butanol reacted with free radicals, which caused more energy to be distributed into the radical generation and hence less energy was converted for the production of ozone. Most radicals were then eliminated by t-butanol and thus less ozone resulted in lower MB degradation efficiency. The ozone generation rate with the presence of t-butanol was measured to be 0.85 mg/min, which was indeed lower than that without t-butanol addition (1.07 mg/min).

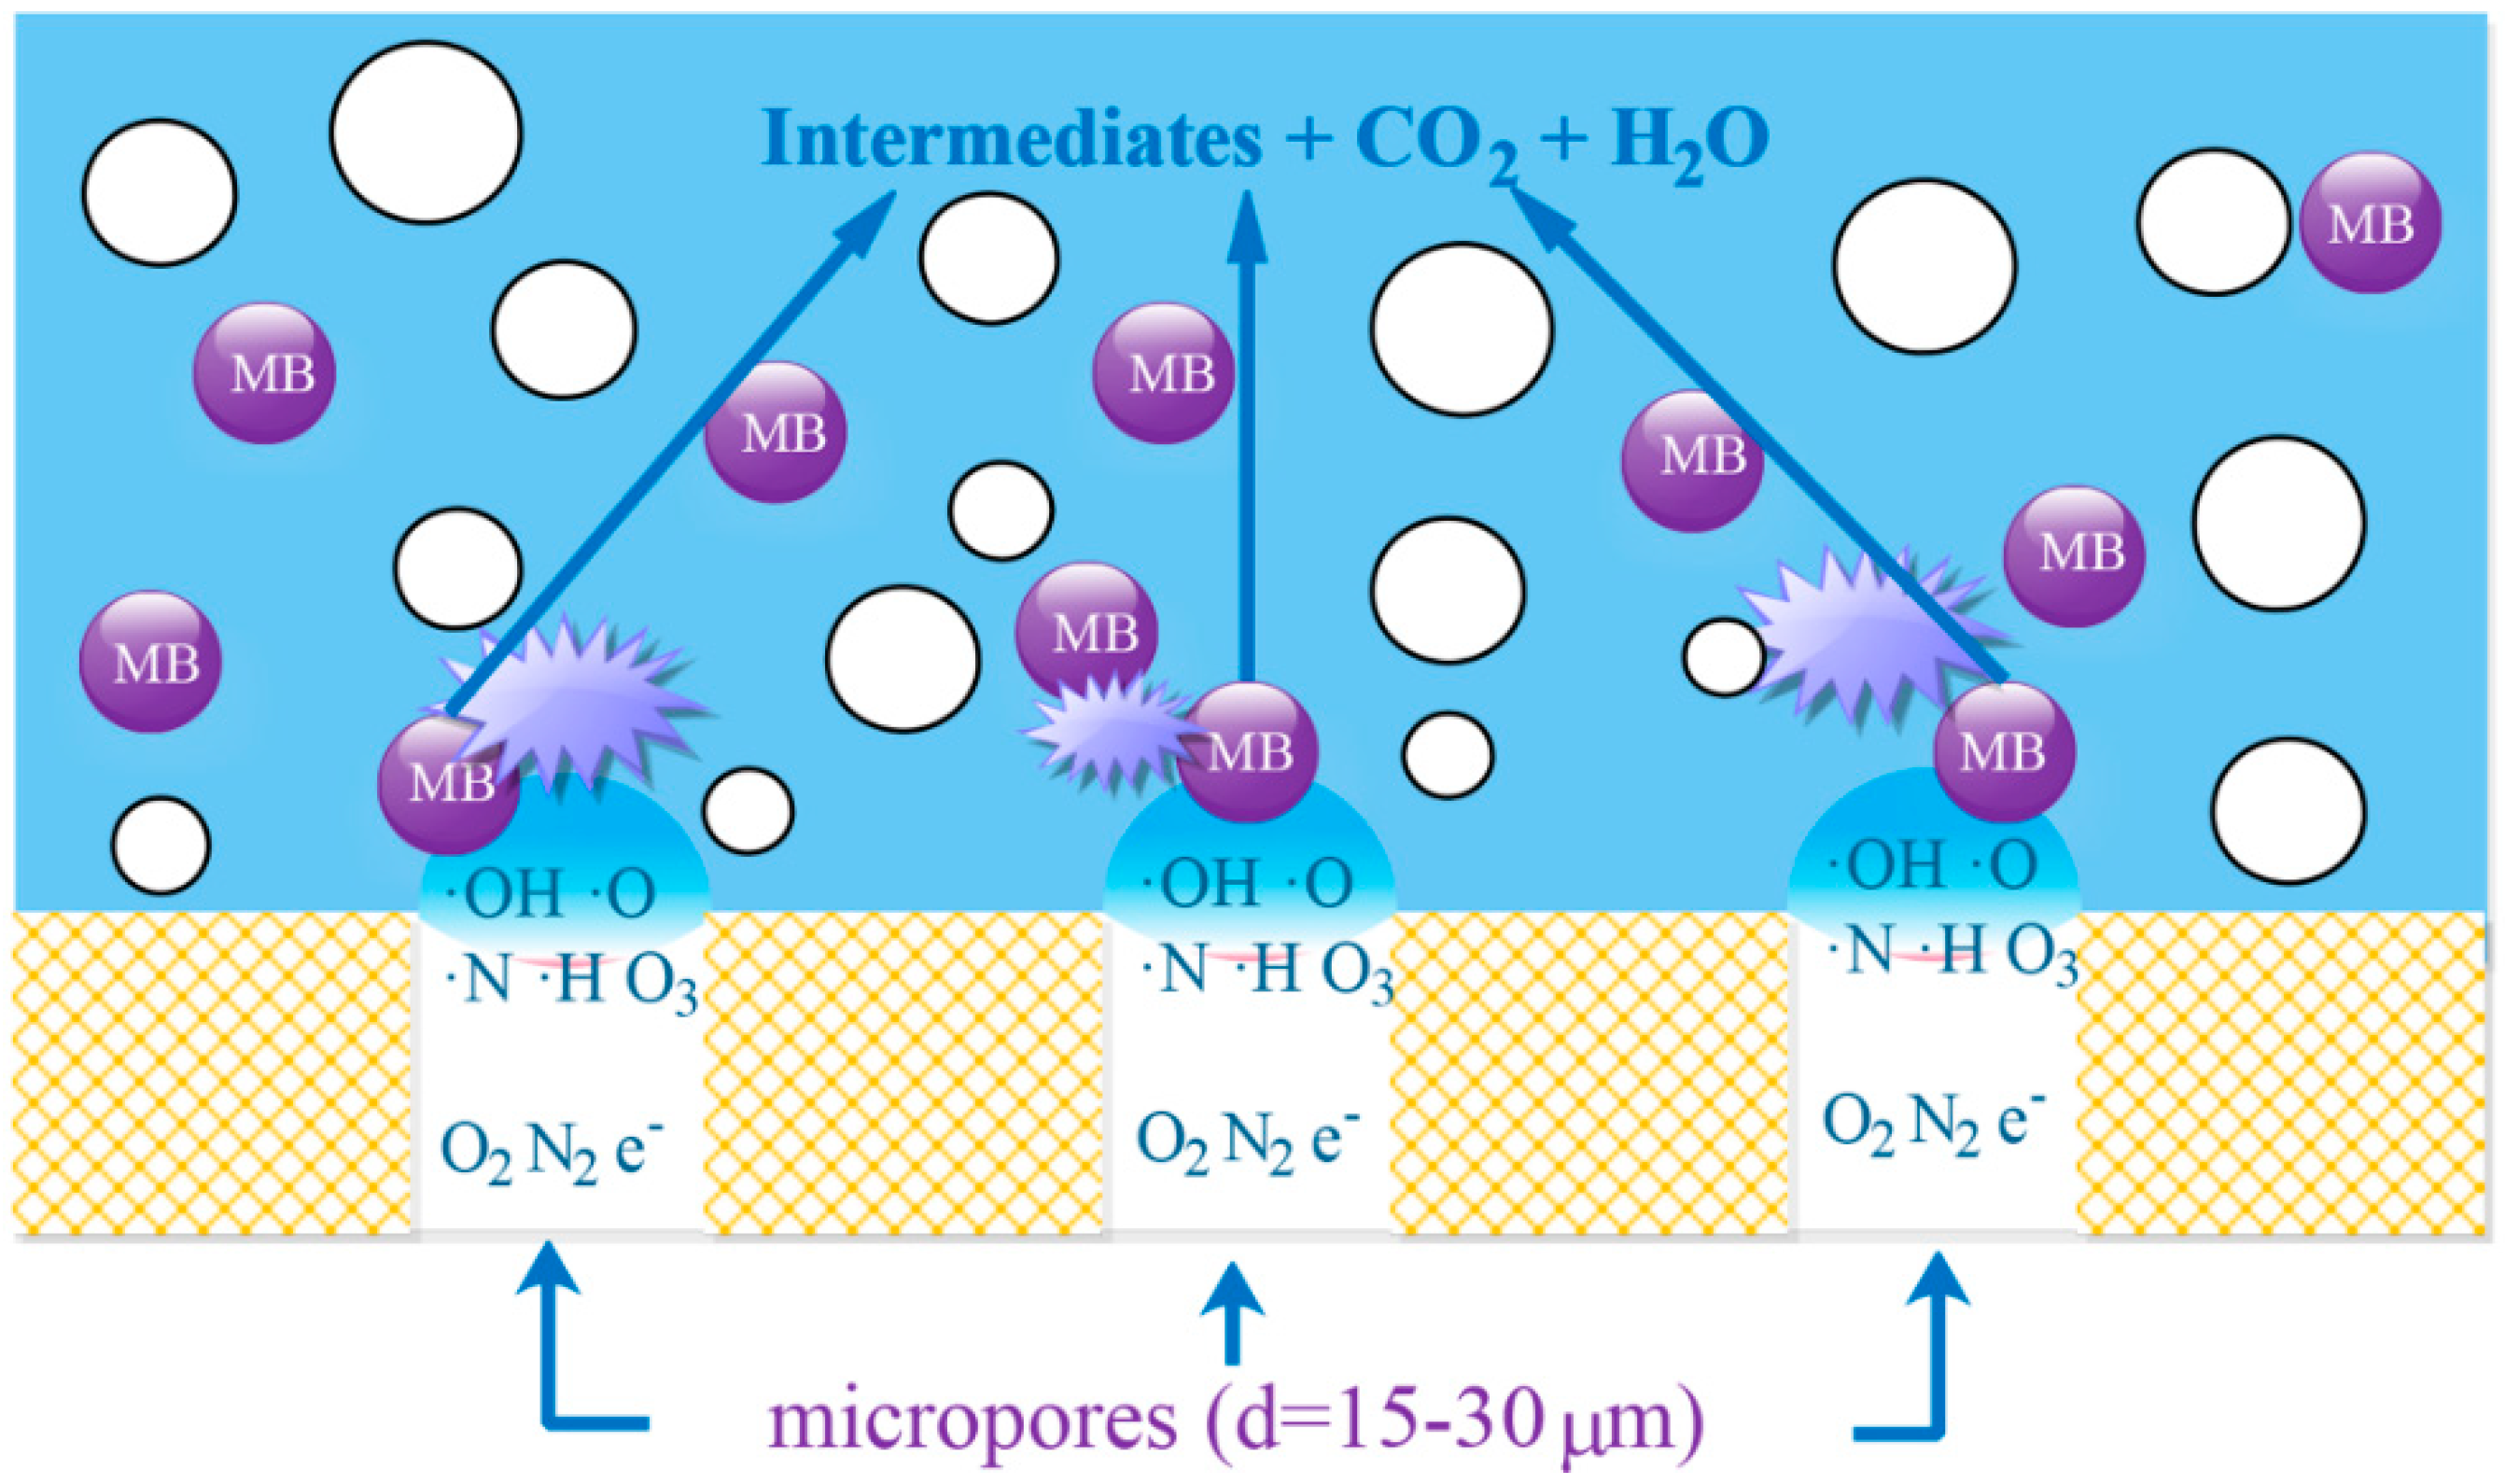
3.3. Possible Mechanism of Generation of Plasma Active Species

Due to the short lifetime of free radicals, their in-situ generation is necessary to make full use of these radicals. The possible mechanism of generation of plasma active species for MB degradation was demonstrated in Figure 8. High energy electrons generated by discharge moved with high air flow to the gas–liquid interface through the micropores in the diffuser plate. At the interface, gas film would be formed as the air bubbled into liquid. Various plasma active species were produced on the gas film by the collision between high energy electrons and N2, O2, and H2O molecules. These active species reacted with and degraded MB molecules into smaller molecules. The continuous renewal of gas film would significantly enhance the generation of active species and hence greatly improve the MB degradation efficiency.

3.4. Mineralization of MB

The mineralization of MB refers to the complete degradation of MB molecules into CO2 and H2O, with TOC as an index of mineralization degree. The TOC removal was 38.5% after 30 min plasma treatment. The result was larger than that obtained by Reddy et al. [23] under similar conditions. Meanwhile, the COD removal reached 48.3% after 30 min plasma treatment. By comparison, the TOC and COD removal after 30 min ozone treatment were 26.6% and 34.2%, respectively. It indicated that the proposed plasma reactor is promising in mineralization of pollutants.
The sample was pre-filtered prior to TOC analysis. It is interesting to find that the TOC removal after 10 and 20 min plasma treatment was 61.2% and 50.2%, respectively. The reason can be attributed to the redissolution of insoluble degradation solids in suspension. The sample solutions at 10 and 20 min contained some insoluble solids which settled from the liquid. These insoluble solids were mainly composed of intermediates formed in MB degradation. Thus, the TOC of supernatant liquid was reduced. In addition, the solids were gradually degraded into small soluble compounds which contributed to the increase in TOC of supernatant liquid. The redissolution of insoluble degradation solids increased with treatment time, resulting in decreasing TOC removal. It suggested that the solids can be separated from the solution before their further degradation, which would increase the treatment efficiency and save time and energy.

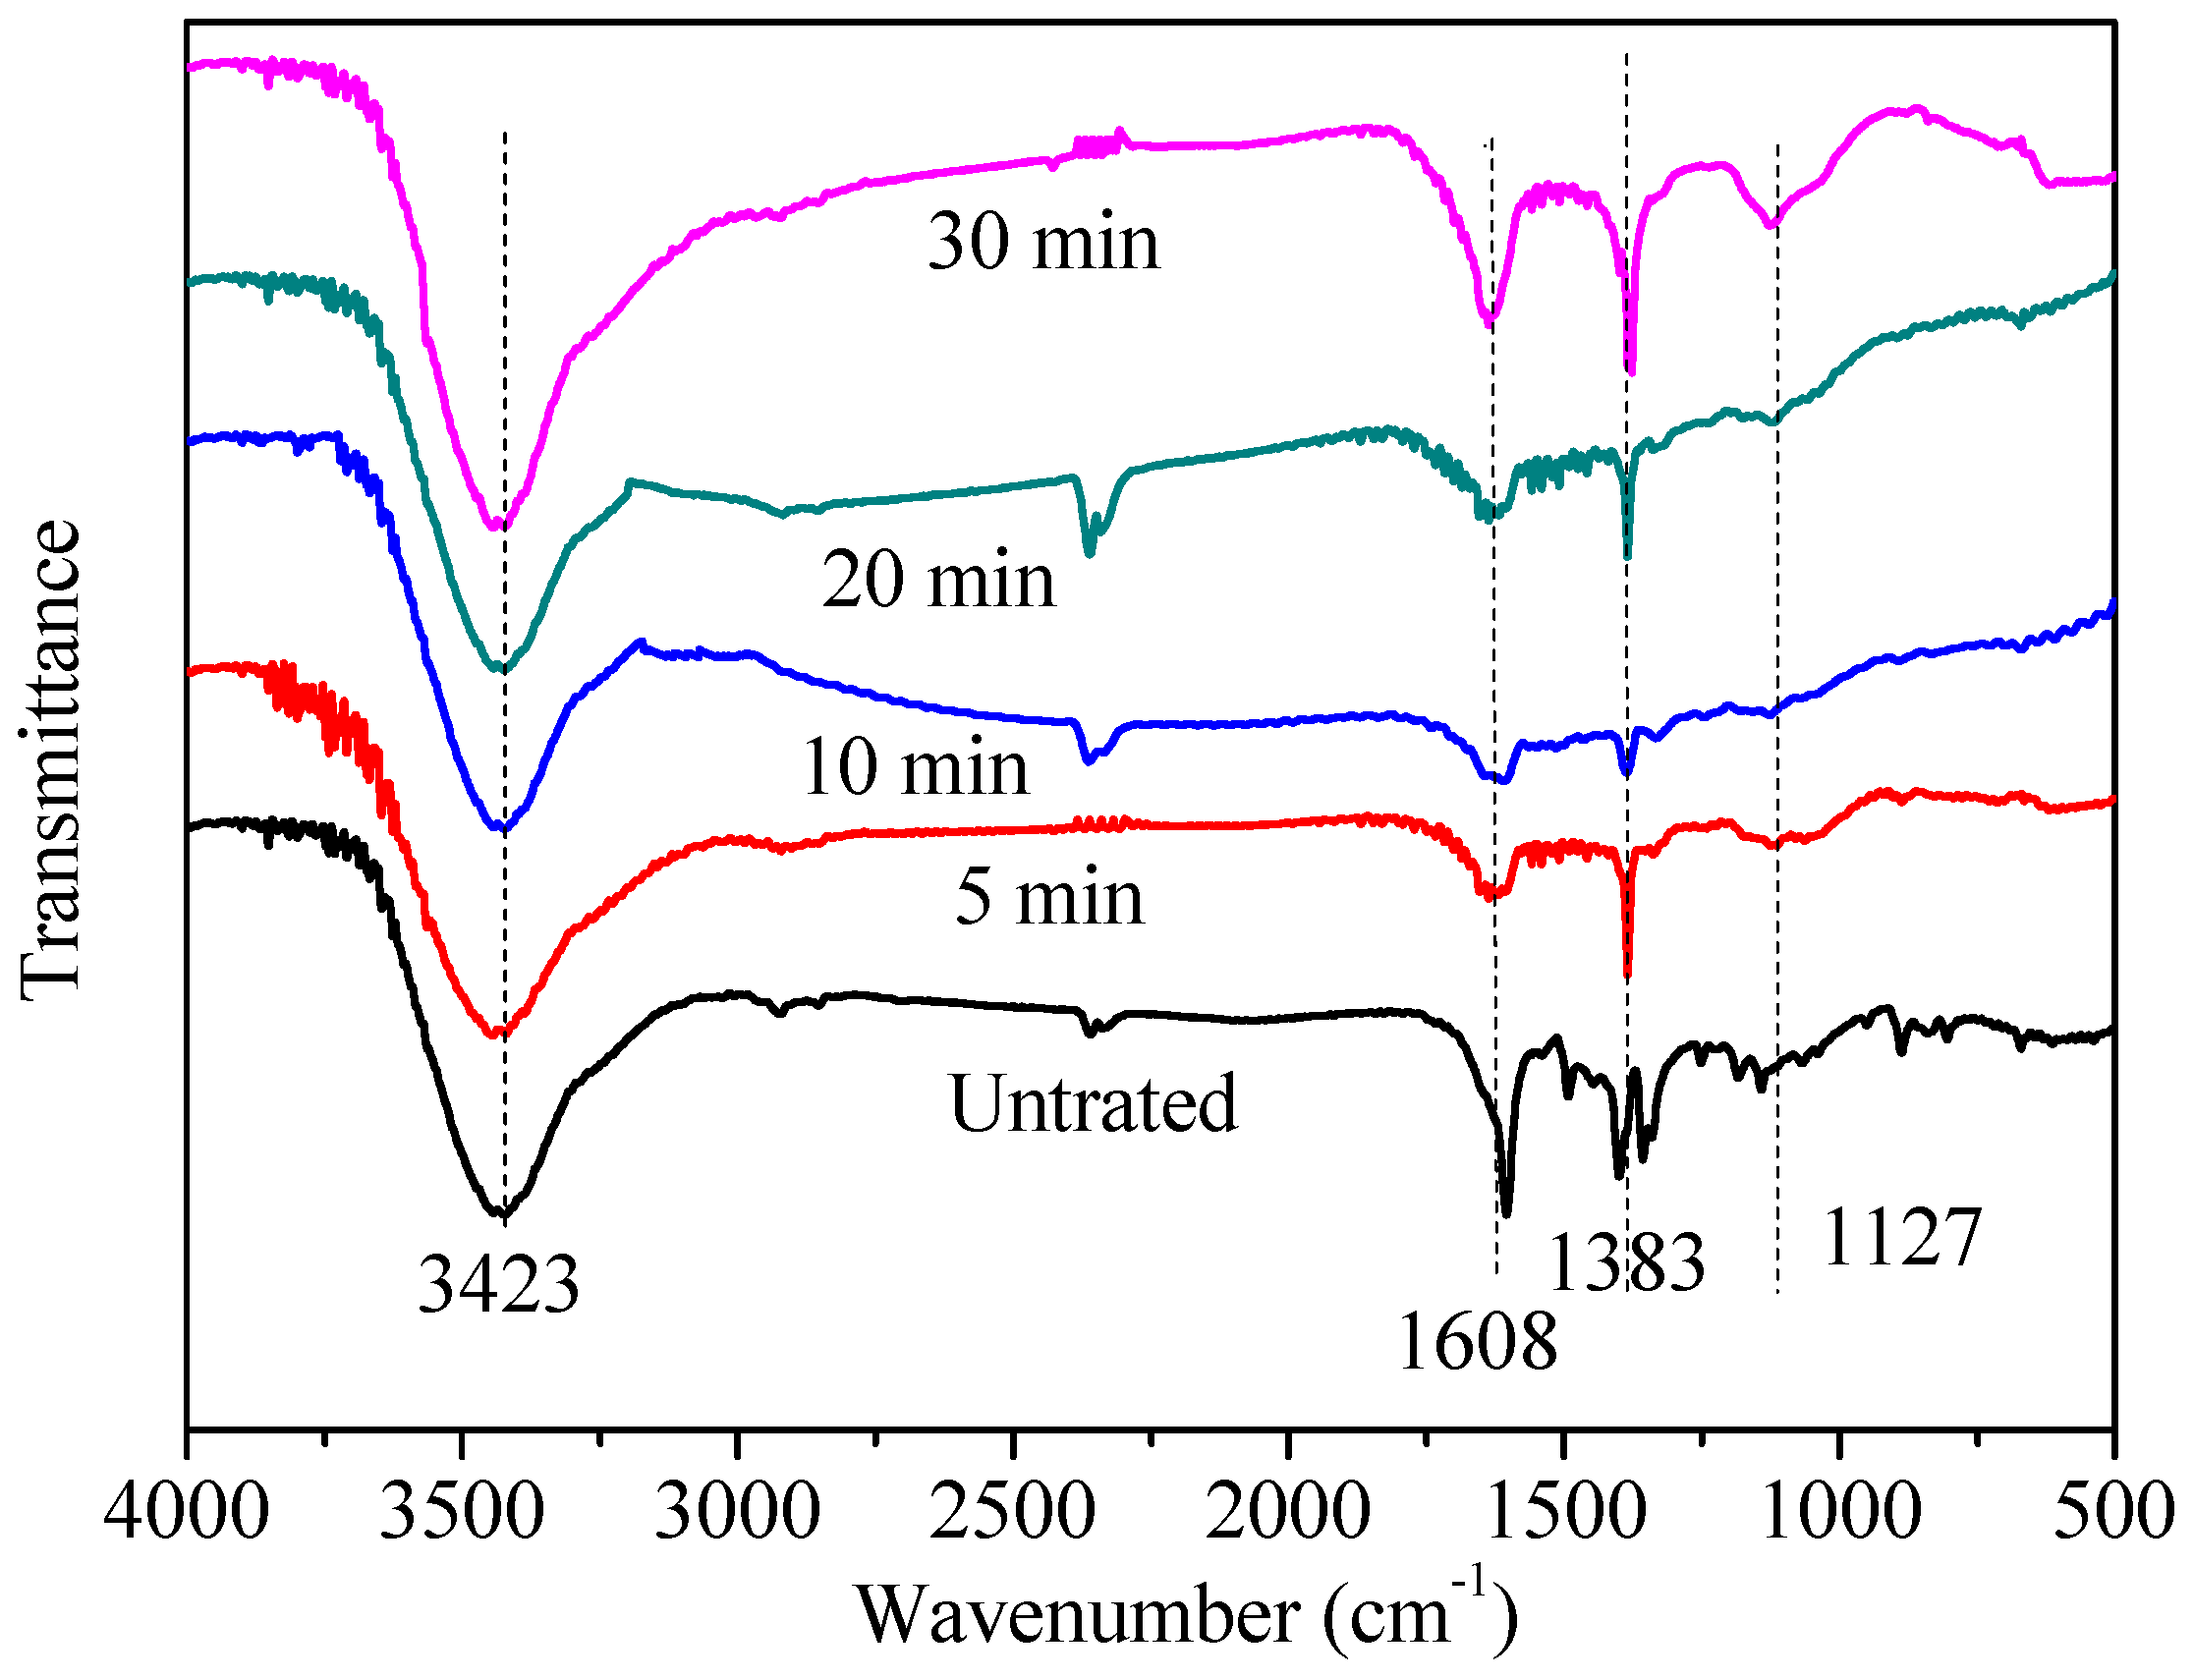
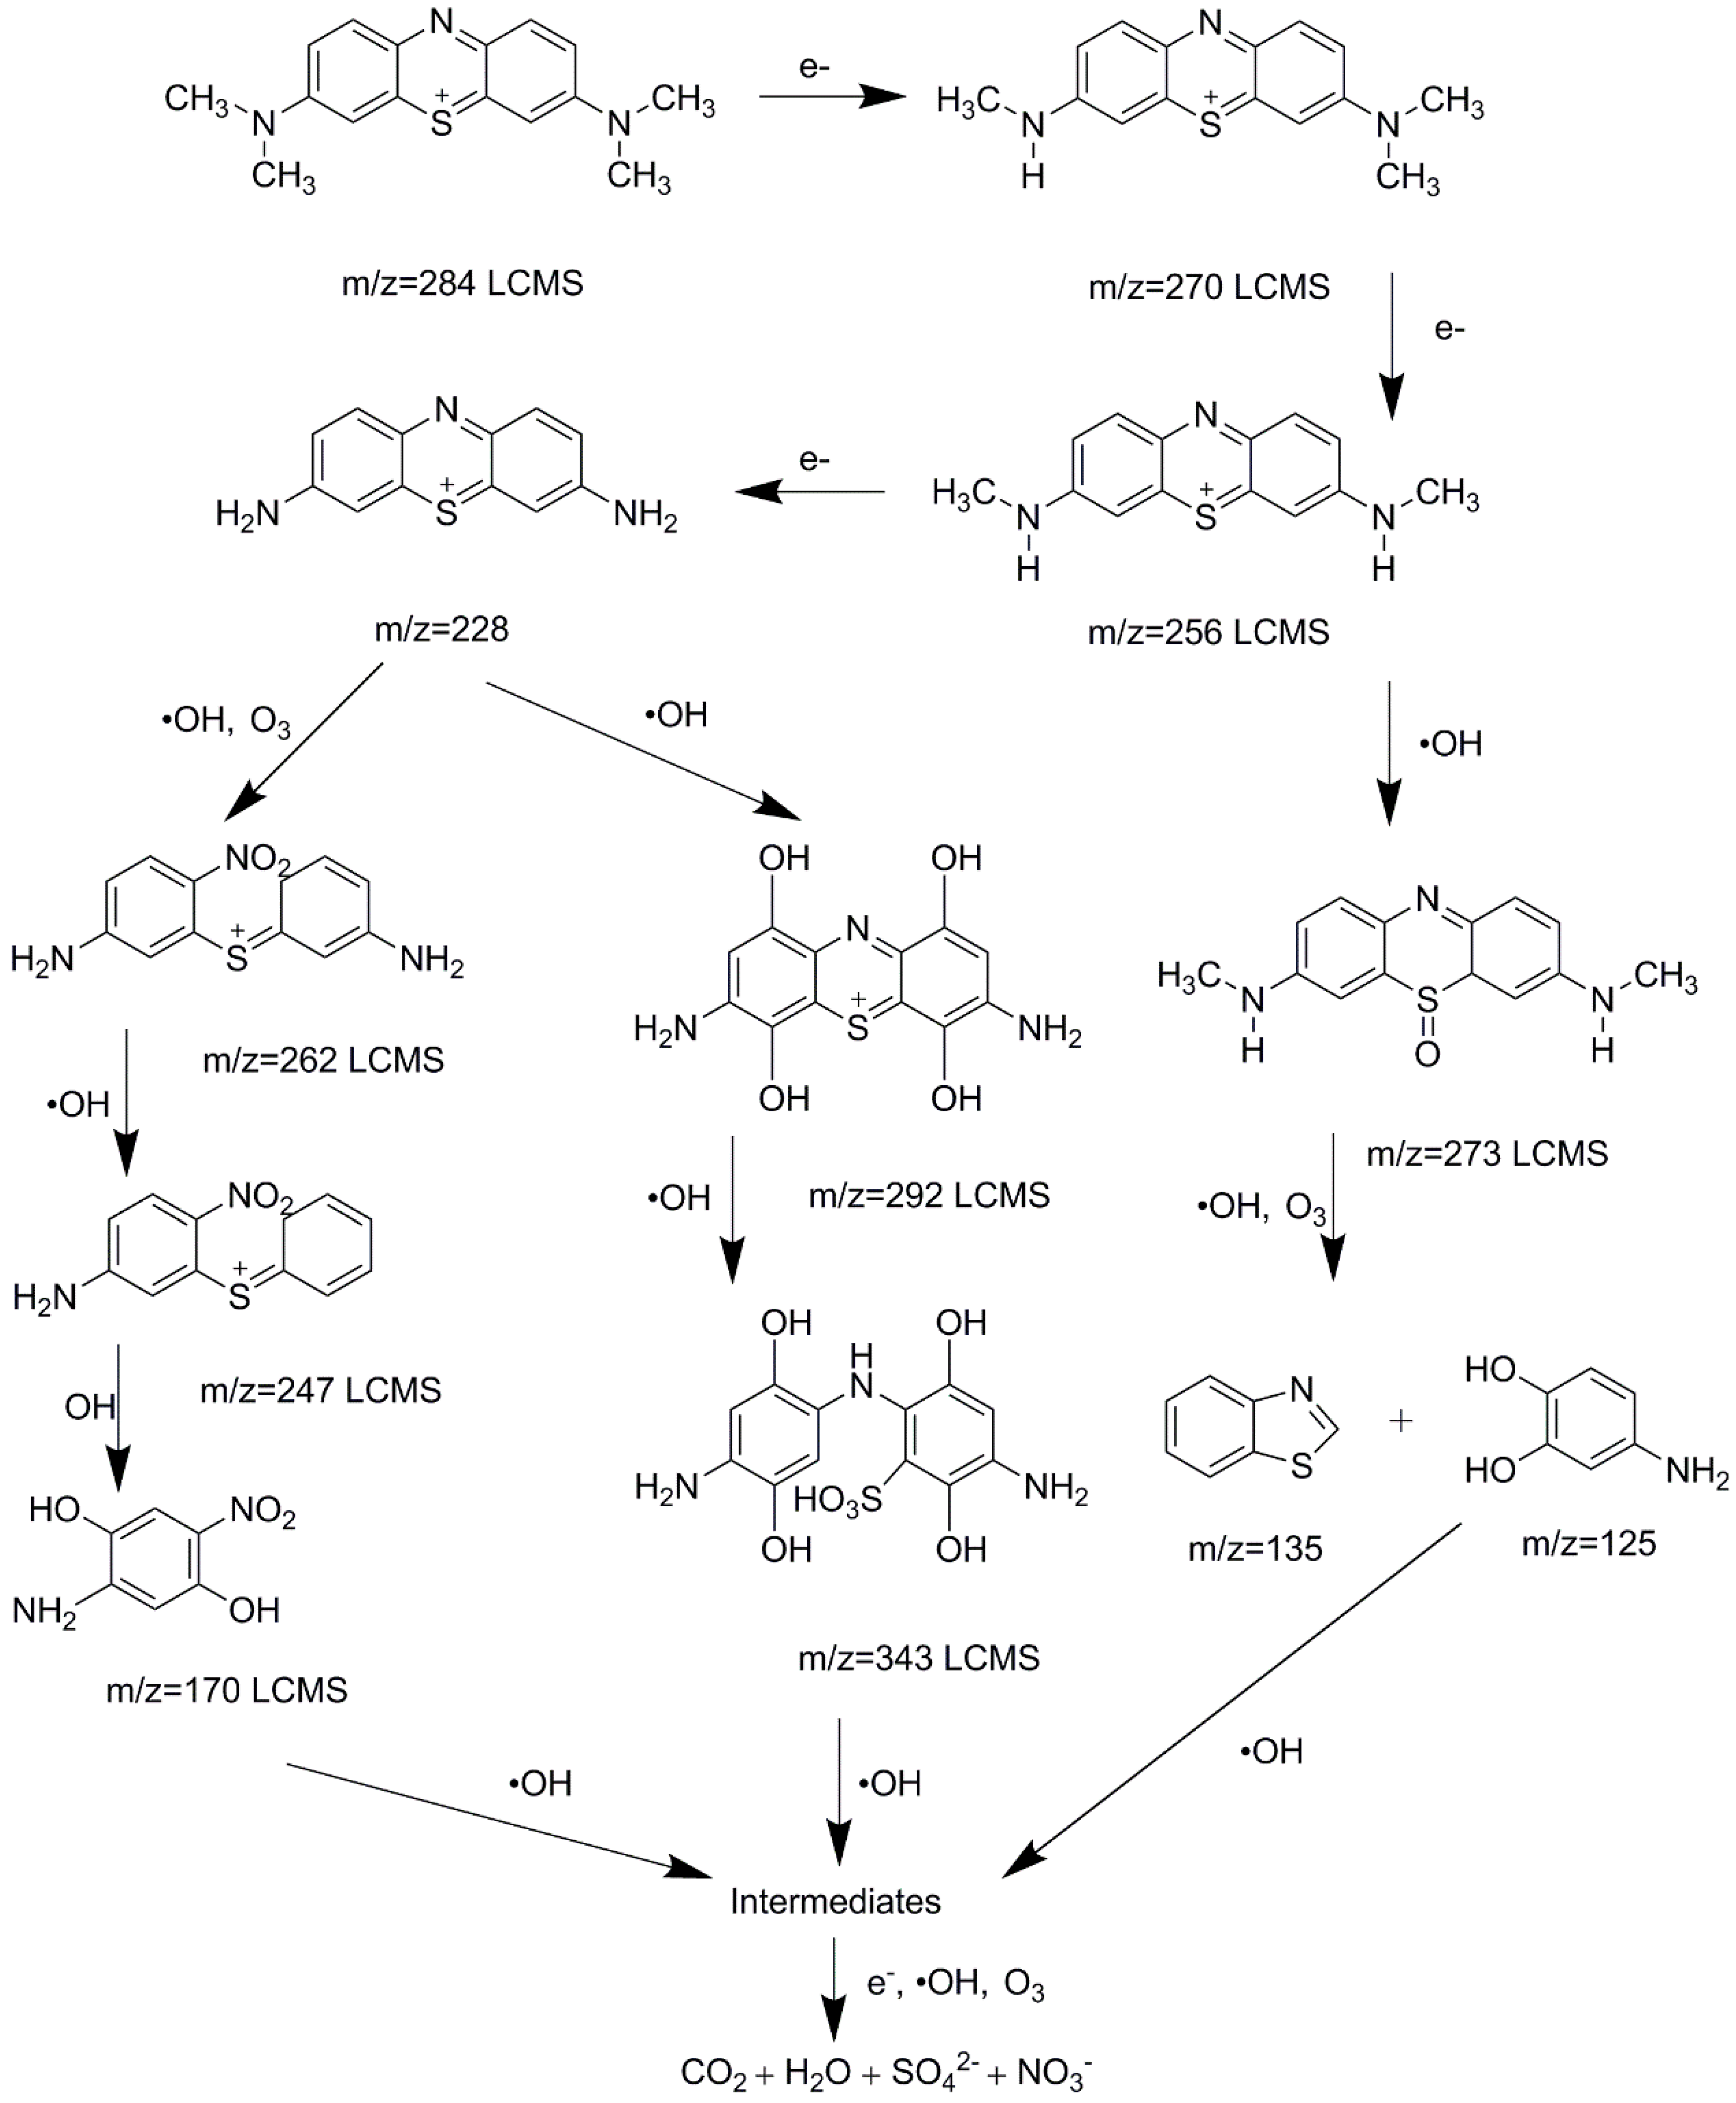
3.5. Degradation Process

Figure 9 shows the visible absorption spectra of MB solution during the plasma treatment process. The absorption peak at 664 nm obviously decreased with increasing exposure time, indicating the dye molecules were degraded by plasma treatment. Almost all the MB molecules were decomposed after 30 min of treatment.
The vibrational spectra of MB molecules at several stages during the process of degradation were investigated by FT-IR. As shown in Figure 10, the bands at c.a. 3423 cm−1 were assigned to stretching vibrations of OH group included in a hydrogen bond, while 1608 cm−1, 1383 cm−1, and 1127 cm−1 corresponded to the C=C, NO3, and C–O group, respectively [10,30]. The existence of NO3 in treated solution was attributed to nitric acid and nitrous acid formed from nitrogen in air during the discharge process. In addition, intermediates containing C–O were generated after plasma treatment, which was mainly due to reactive oxygen species attack.
Furthermore, LC-MS was used to explore the degradation intermediates. High energy electron, ozone and hydroxyl radical were the main species for the intermediate generation. Similar results were found by Wang et al. [27]. A possible pathway was put forward, as displayed in Figure 11. The peak at m/z of 284 confirmed the existence of MB molecules. With the presence of high-energy electrons, MB molecules were converted into fragments with peaks at m/z of 270, 256, 228, which was attributed to demethylation. In addition, hydroxyl radicals were widely acknowledged as the main species to degrade MB molecules. The organics with m/z of 292 and 343 were determined by LCMS, which was due to hydroxylation reaction [31]. In addition, the bond dissociation energy of CH3–N(CH3)C6H5 and C6H5–S–C6H5 was calculated as only 70.8 and 76 kcal/mol, respectively, which caused the corresponding bonds to be broken more easily [10]. Thus, the compounds with peaks at m/z of 273, 262, and 247 were observed. Possible ring breaking reactions with hydroxyl radicals and ozone were proposed, which could lead to the formation of compounds with peaks at m/z of 170, 135, and 125. Finally, the intermediates would be decomposed and mineralized into CO2, H2O, SO42– and NO3.

4. Conclusions

An upgraded DBD plasma reactor was reported for the treatment of dyeing wastewater with methylene blue as the model compound. The reactor combined with the bead packed bed and microporous diffuser plate can enhance MB degradation efficiency and mineralization. The degradation efficiency, TOC removal, and COD removal after 30 min treatment of 100 ppm MB solution in 1.5 L/min air flow were 97.5%, 38.5%, and 48.3%, respectively. The energy yield for MB degradation by plasma reached up to 9.3 g/kWh. The comparison experiments indicated the plasma treatment was preferable to ozone treatment. In addition, the initial solution pH and conductivity had little effect on MB degradation, which suggested the application potential of the proposed reactor in treatment of various dyeing wastewater. The degradation mechanism of MB showed that the generation of intermediates was attributed to high energy electron, ozone, and hydroxyl radical.

Author Contributions

Conceptualization, L.W., Q.X., M.L. and Y.N.; Investigation, L.W. and Y.L.; Methodology, L.W., Q.X., Z.W., X.L. and Y.N.; Supervision, L.W.; Writing—original draft, L.W.; Writing—review and editing, L.W., Q.X. and Y.N.

Funding

This research received no external funding.

Conflicts of Interest

The authors declare no conflict of interest.

References

  1. He, P.Y.; Zhang, Y.J.; Chen, H.; Liu, L.C. Development of an eco-efficient CaMoO4/electroconductive geopolymer composite for recycling silicomanganese slag and degradation of dye wastewater. J. Clean. Prod. 2019, 208, 1476–1487. [Google Scholar] [CrossRef]
  2. Li, W.; Mu, B.; Yang, Y. Feasibility of industrial-scale treatment of dye wastewater via bio-adsorption technology. Bioresour. Technol. 2019, 277, 157–170. [Google Scholar] [CrossRef] [PubMed]
  3. Katheresan, V.; Kansedo, J.; Lau, S.Y. Efficiency of various recent wastewater dye removal methods: A review. J. Environ. Chem. Eng. 2018, 6, 4676–4697. [Google Scholar] [CrossRef]
  4. Tichonovas, M.; Krugly, E.; Racys, V.; Hippler, R.; Kauneliene, V.; Stasiulaitiene, I.; Martuzevicius, D. Degradation of various textile dyes as wastewater pollutants under dielectric barrier discharge plasma treatment. Chem. Eng. J. 2013, 229, 9–19. [Google Scholar] [CrossRef]
  5. Wang, J.L.; Xu, L.J. Advanced oxidation processes for wastewater treatment: Formation of hydroxyl radical and application. Crit. Rev. Environ. Sci. Technol. 2012, 42, 251–325. [Google Scholar] [CrossRef]
  6. Paździor, K.; Bilińska, L.; Ledakowicz, S. A review of the existing and emerging technologies in the combination of AOPs and biological processes in industrial textile wastewater treatment. Chem. Eng. J. 2018, in press. [Google Scholar] [CrossRef]
  7. Bruggeman, P.; Leys, C. Non-thermal plasmas in and in contact with liquids. J. Phys. D Appl. Phys. 2009, 42, 53001. [Google Scholar] [CrossRef]
  8. Liu, Y.; Zhang, H.; Sun, J.; Liu, J.; Shen, X.; Zhan, J.; Zhang, A.; Ognier, S.; Cavadias, S.; Li, P. Degradation of aniline in aqueous solution using non-thermal plasma generated in microbubbles. Chem. Eng. J. 2018, 345, 679–687. [Google Scholar] [CrossRef]
  9. Ceriani, E.; Marotta, E.; Shapoval, V.; Favaro, G.; Paradisi, C. Complete mineralization of organic pollutants in water by treatment with air non-thermal plasma. Chem. Eng. J. 2018, 337, 567–575. [Google Scholar] [CrossRef]
  10. Huang, F.; Chen, L.; Wang, H.; Yan, Z. Analysis of the degradation mechanism of methylene blue by atmospheric pressure dielectric barrier discharge plasma. Chem. Eng. J. 2010, 162, 250–256. [Google Scholar] [CrossRef]
  11. Foster, J.E.; Mujovic, S.; Groele, J.; Blankson, I.M. Towards high throughput plasma based water purifiers: Design considerations and the pathway towards practical application. J. Phys. D Appl. Phys. 2018, 51, 293001. [Google Scholar] [CrossRef]
  12. Li, J.; Sato, M.; Ohshima, T. Degradation of phenol in water using a gas-liquid phase pulsed discharge plasma reactor. Thin Solid Films 2007, 515, 4283–4288. [Google Scholar] [CrossRef]
  13. Jiang, B.; Zheng, J.; Qiu, S.; Wu, M.; Zhang, Q.; Yan, Z.; Xue, Q. Review on electrical discharge plasma technology for wastewater remediation. Chem. Eng. J. 2014, 236, 348–368. [Google Scholar] [CrossRef]
  14. Chen, H.L.; Lee, H.M.; Chen, S.H.; Chang, M.B. Review of packed-bed plasma reactor for ozone generation and air pollution control. Ind. Eng. Chem. Res. 2008, 47, 2122–2130. [Google Scholar] [CrossRef]
  15. Wang, W.; Kim, H.H.; Van Laer, K.; Bogaerts, A. Streamer propagation in a packed bed plasma reactor for plasma catalysis applications. Chem. Eng. J. 2018, 334, 2467–2479. [Google Scholar] [CrossRef]
  16. Hensel, K. Microdischarges in ceramic foams and honeycombs. Eur. Phys. J. D 2009, 54, 141–148. [Google Scholar] [CrossRef]
  17. Hong, Y.C.; Jeon, H.W.; Lee, B.J.; Uhm, H.S. Generation of plasma using capillary discharge in water. IEEE Trans. Plasma Sci. 2010, 38, 3464–3466. [Google Scholar] [CrossRef]
  18. Hensel, K.; Machala, Z.; Tardiveau, P. Capillary microplasmas for ozone generation. Eur. Phys. J. Appl. Phys. 2009, 47, 22813. [Google Scholar] [CrossRef] [Green Version]
  19. Eden, J.G.; Kim, M.H.; Cho, J.H.; Park, S.J. Modular Microplasma Microchannel Reactor Devices, Miniature Reactor Modules and Ozone Generation Devices. U.S. Patent 9,390,894 B2, 12 July 2016. [Google Scholar]
  20. Kim, K.-S.; Yang, C.-S.; Mok, Y.S. Degradation of veterinary antibiotics by dielectric barrier discharge plasma. Chem. Eng. J. 2013, 219, 19–27. [Google Scholar] [CrossRef]
  21. Pavithra, K.G.; Kumar, P.S.; Jaikumar, V.; Sundar Rajan, P. Removal of colorants from wastewater: A review on sources and treatment strategies. J. Ind. Eng. Chem. 2019, 75, 1–19. [Google Scholar] [CrossRef]
  22. Fahmy, A.; El-Zomrawy, A.; Saeed, A.M.; Sayed, A.Z.; Ezz El-Arab, M.A.; Shehata, H.A. Modeling and optimizing Acid Orange 142 degradation in aqueous solution by non-thermal plasma. Chemosphere 2018, 210, 102–109. [Google Scholar] [CrossRef] [PubMed]
  23. Manoj Kumar Reddy, P.; Rama Raju, B.; Karuppiah, J.; Linga Reddy, E.; Subrahmanyam, C. Degradation and mineralization of methylene blue by dielectric barrier discharge non-thermal plasma reactor. Chem. Eng. J. 2013, 217, 41–47. [Google Scholar] [CrossRef]
  24. Feng, J.; Zheng, Z.; Sun, Y.; Luan, J.; Wang, Z.; Wang, L.; Feng, J. Degradation of diuron in aqueous solution by dielectric barrier discharge. J. Hazard. Mater. 2008, 154, 1081–1089. [Google Scholar] [CrossRef] [PubMed]
  25. Grabowski, L.R.; Van Veldhuizen, E.M.; Pemen, A.J.M.; Rutgers, W.R. Corona above water reactor for systematic study of aqueous phenol degradation. Plasma Chem. Plasma Process. 2006, 26, 3–17. [Google Scholar] [CrossRef]
  26. Beltrán, F.J.; Aguinaco, A.; Rey, A.; García-Araya, J.F. Kinetic studies on black light photocatalytic ozonation of diclofenac and sulfamethoxazole in water. Ind. Eng. Chem. Res. 2012, 51, 4533–4544. [Google Scholar] [CrossRef]
  27. Wang, B.; Dong, B.; Xu, M.; Chi, C.; Wang, C. Degradation of methylene blue using double-chamber dielectric barrier discharge reactor under different carrier gases. Chem. Eng. Sci. 2017, 168, 90–100. [Google Scholar] [CrossRef]
  28. Malik, M.A.; Rehman, U.; Ghaffar, A.; Ahmed, K. Synergistic effect of pulsed corona discharges and ozonation on decolourization of methylene blue in water. Plasma Sour. Sci. Technol. 2002, 11, 236. [Google Scholar] [CrossRef]
  29. Zhang, Y.; Zheng, J.; Qu, X.; Chen, H. Design of a novel non-equilibrium plasma-based water treatment reactor. Chemosphere 2008, 70, 1518–1524. [Google Scholar] [CrossRef]
  30. Bansode, A.S.; More, S.E.; Siddiqui, E.A.; Satpute, S.; Ahmad, A.; Bhoraskar, S.V.; Mathe, V.L. Effective degradation of organic water pollutants by atmospheric non-thermal plasma torch and analysis of degradation process. Chemosphere 2017, 167, 396–405. [Google Scholar] [CrossRef]
  31. De Brito Benetoli, L.O.; Cadorin, B.M.; Baldissarelli, V.Z.; Geremias, R.; de Souza, I.G.; Debacher, N.A. Pyrite-enhanced methylene blue degradation in non-thermal plasma water treatment reactor. J. Hazard. Mater. 2012, 237–238, 55–62. [Google Scholar] [CrossRef]
Figure 1. Diagram of the experimental apparatus.
Water 11 01818 g001
Figure 2. Effect of air flow rate on ozone generation rate.
Water 11 01818 g002
Figure 3. The effect of air flow rate on methylene blue (MB) degradation efficiency (MB concentration = 100 ppm, solution pH = 6.68, solution conductivity = 40.1 μS/cm, input power = 8.6 W).
Water 11 01818 g003
Figure 4. The effect of initial solution concentration on MB degradation efficiency (air flow rate = 1.5 L/min, initial solution pH = 6.68, input power = 8.6 W).
Water 11 01818 g004
Figure 5. The pH variation (a) and the effect of initial solution pH on degradation efficiency (b) (air flow rate = 1.5 L/min, MB concentration = 100 ppm, initial solution conductivity = 40.1 μS/cm, input power = 8.6 W).
Water 11 01818 g005
Figure 6. The conductivity variation (a) and the effect of initial solution conductivity (b) on degradation efficiency (air flow rate = 1.5 L/min, MB concentration = 100 ppm, initial solution pH = 6.68, input power = 8.6 W).
Water 11 01818 g006
Figure 7. Comparison of ozone and in-situ plasma on MB degradation and the effect of t-butanol (MB concentration = 100 ppm, initial solution pH = 6.68, initial solution conductivity = 40.1 μS/cm, input power = 8.6 W).
Water 11 01818 g007
Figure 8. Mechanism of in-situ generation of plasma active species for MB degradation.
Water 11 01818 g008
Figure 9. UV-Visible absorption spectra of MB solution (100 mL, 100 ppm) recorded as a function of exposure time 0–30 min.
Water 11 01818 g009
Figure 10. Fourier transform infrared spectroscopy (FT-IR) analysis of degradation of MB (100 mL, 100 ppm) recorded as a function of exposure time.
Water 11 01818 g010
Figure 11. Possible degradation pathway of MB.
Water 11 01818 g011
Table 1. Comparison of dye degradation in different studies.
Used DyeType of Plasma ReactorConditionsEnergy Yield (g/kWh)COD Removal (%)TOC Removal (%)Refs.
Methylene blueDBDV0: 0.1 L, C0: 100 ppm,
t: 30 min, V: 8 kV,
F: 9.7 kHz, Air: 1.5 L/min
9.348.338.5This study
Methylene blueDBDV0: 0.05 L, C0: 100 ppm,
t: 40 min, V: 6 kV,
F: 50 Hz, O2: 0.06 L/min
0.1467.1[27]
Methylene bluePulsed corona dischargeV0: 0.02 L, C0: 13.25 ppm,
t: 20 min, V: 40 kV,
F: 60 Hz, O2: 0.01 L/min
0.341[28]
Methyl orangeNon-equilibrium plasmaV0: 0.1 L, C0: 100 ppm,
t: 15 min, V: 46 kV,
F: 100 Hz, Air: 1.6 L/min
3.645[29]
V0: liquid volume; C0: initial concentration; t: treatment time; V: input voltage; F: input frequency.

