Assessment of Suitable Land for Surface Irrigation in Ungauged Catchments: Blue Nile Basin, Ethiopia


Abstract
1. Introduction
2. Materials and Methods
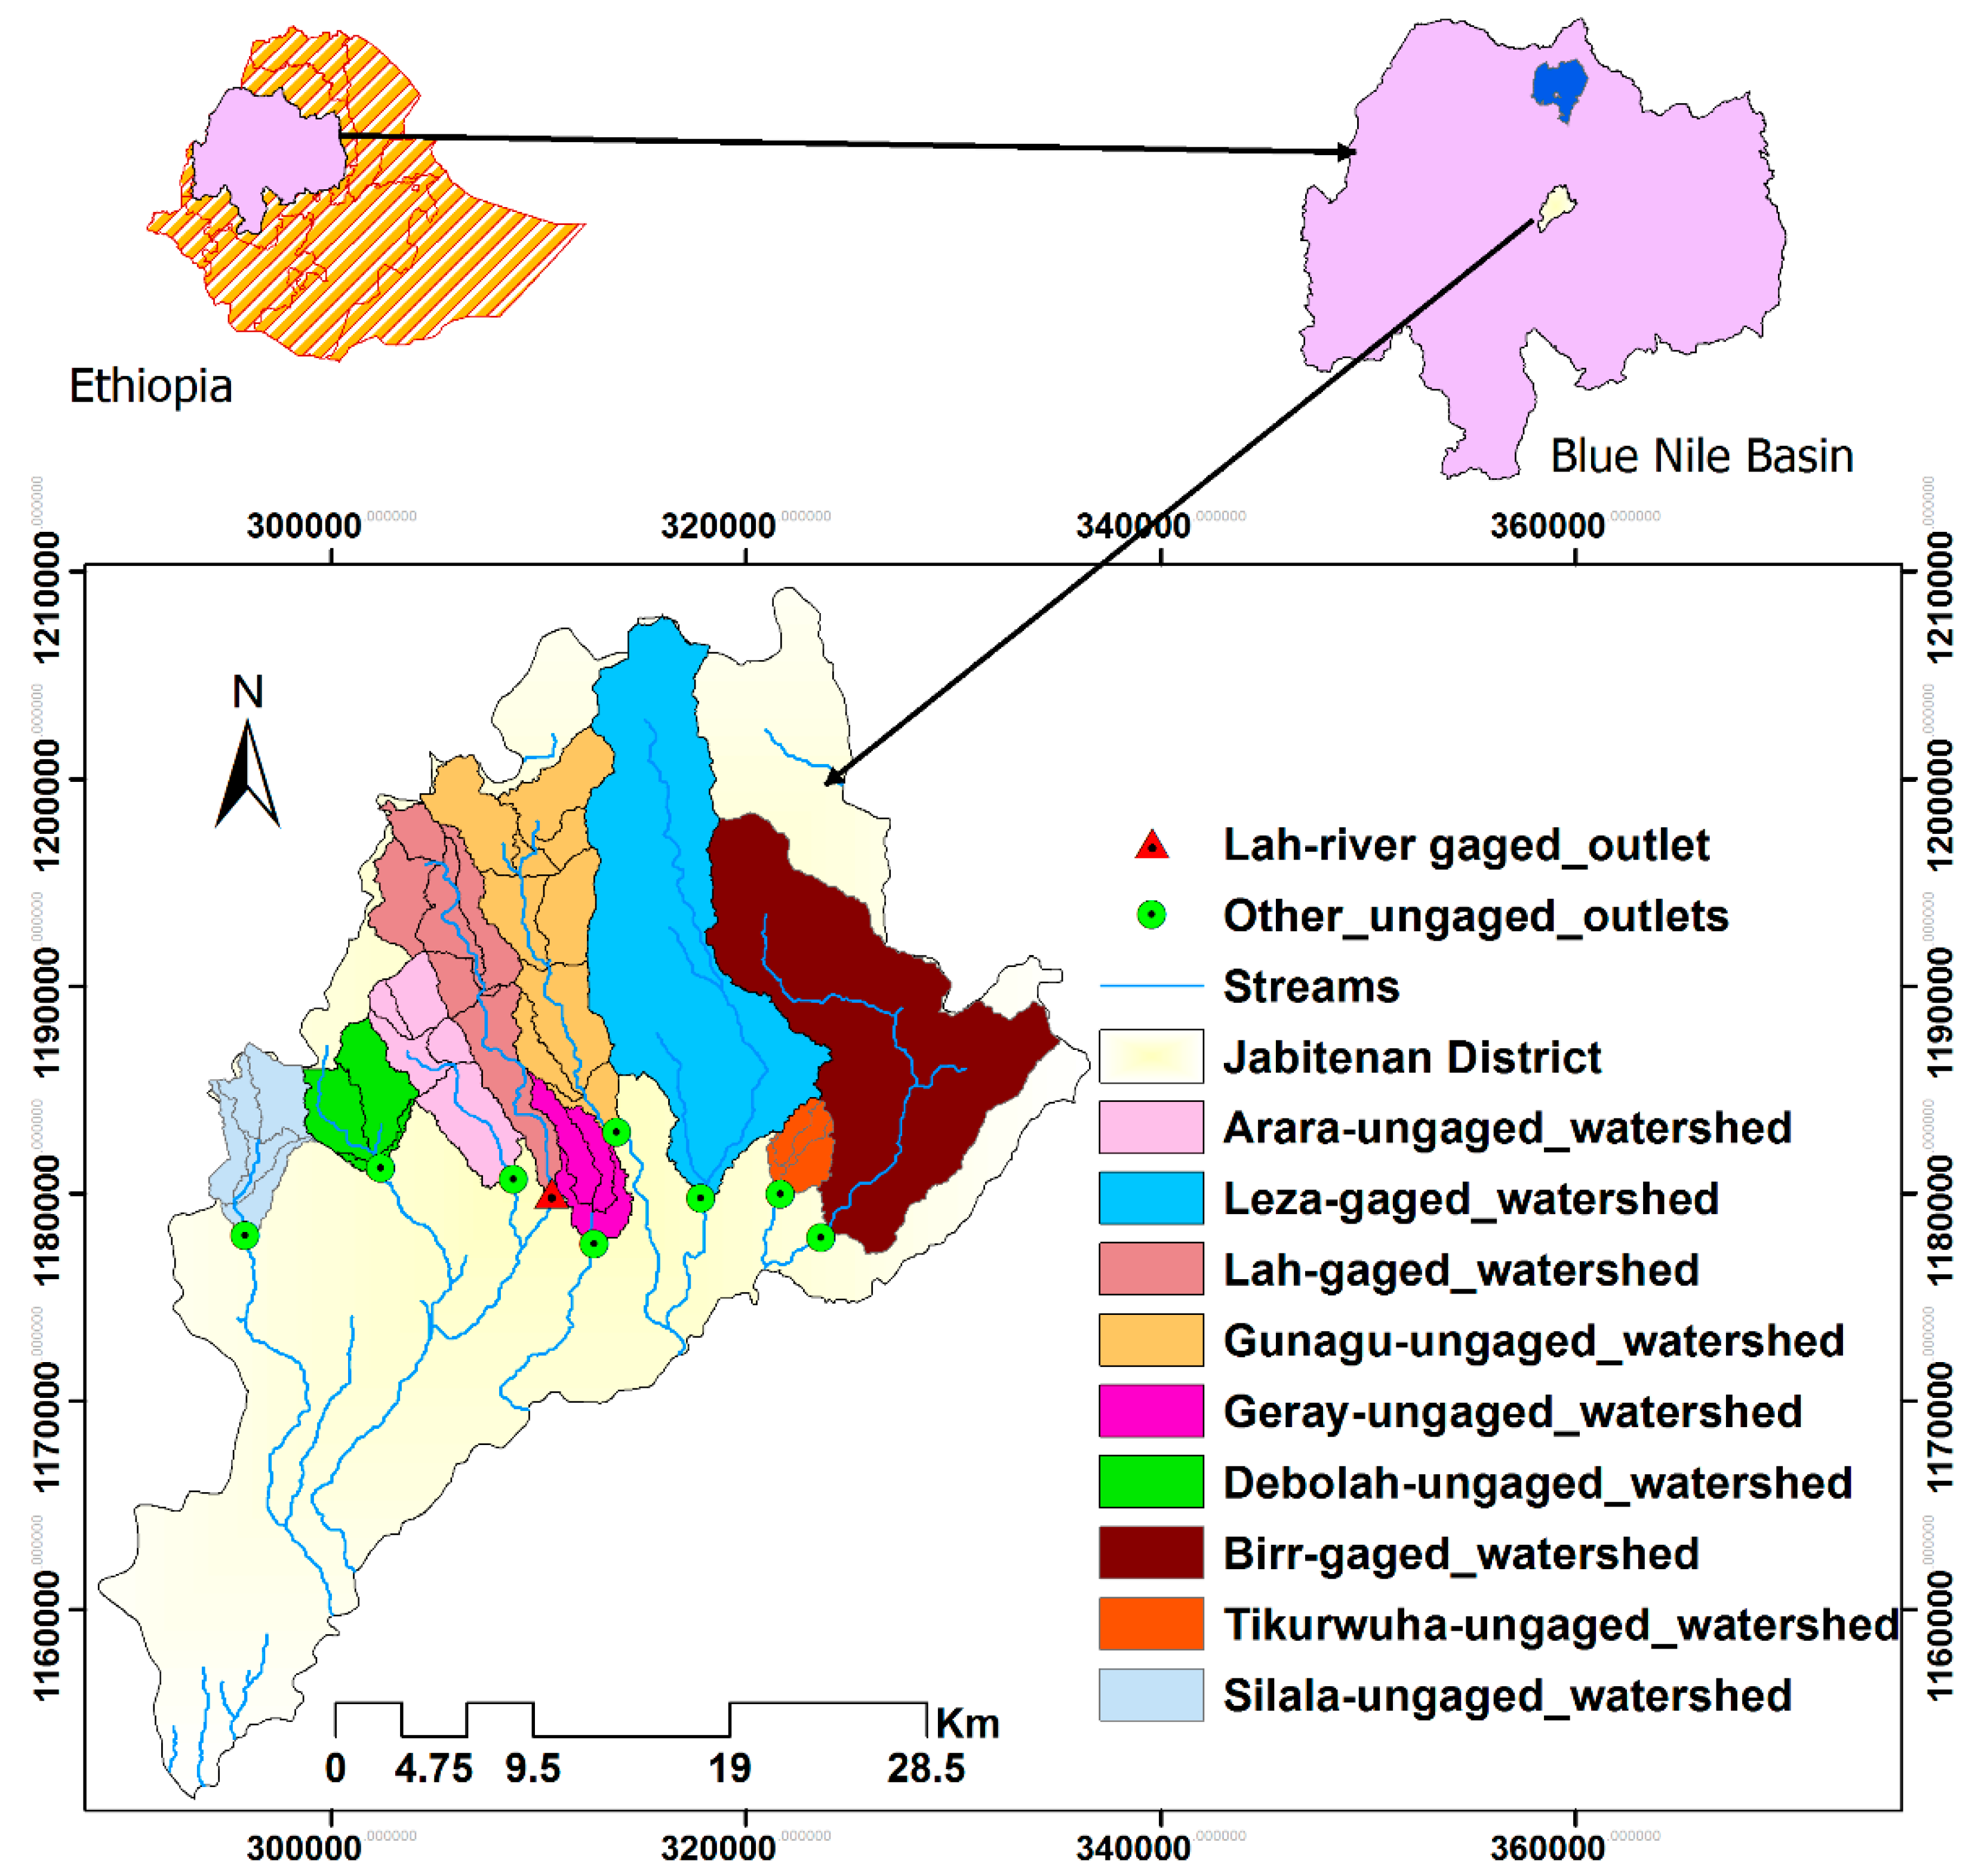
2.1. Description of the Study Area
2.2. Data Collection
2.2.1. Climate
2.2.2. Land Features
2.2.3. Stream Discharge
2.3. Methods
2.3.1. SWAT Model
Sensitivity Analysis in SWAT
Calibration and Validation of SWAT
SWAT Model Performance
2.3.2. Predicting Stream Flow for Ungauged Catchments
2.3.3. Irrigation Suitable Land Potential
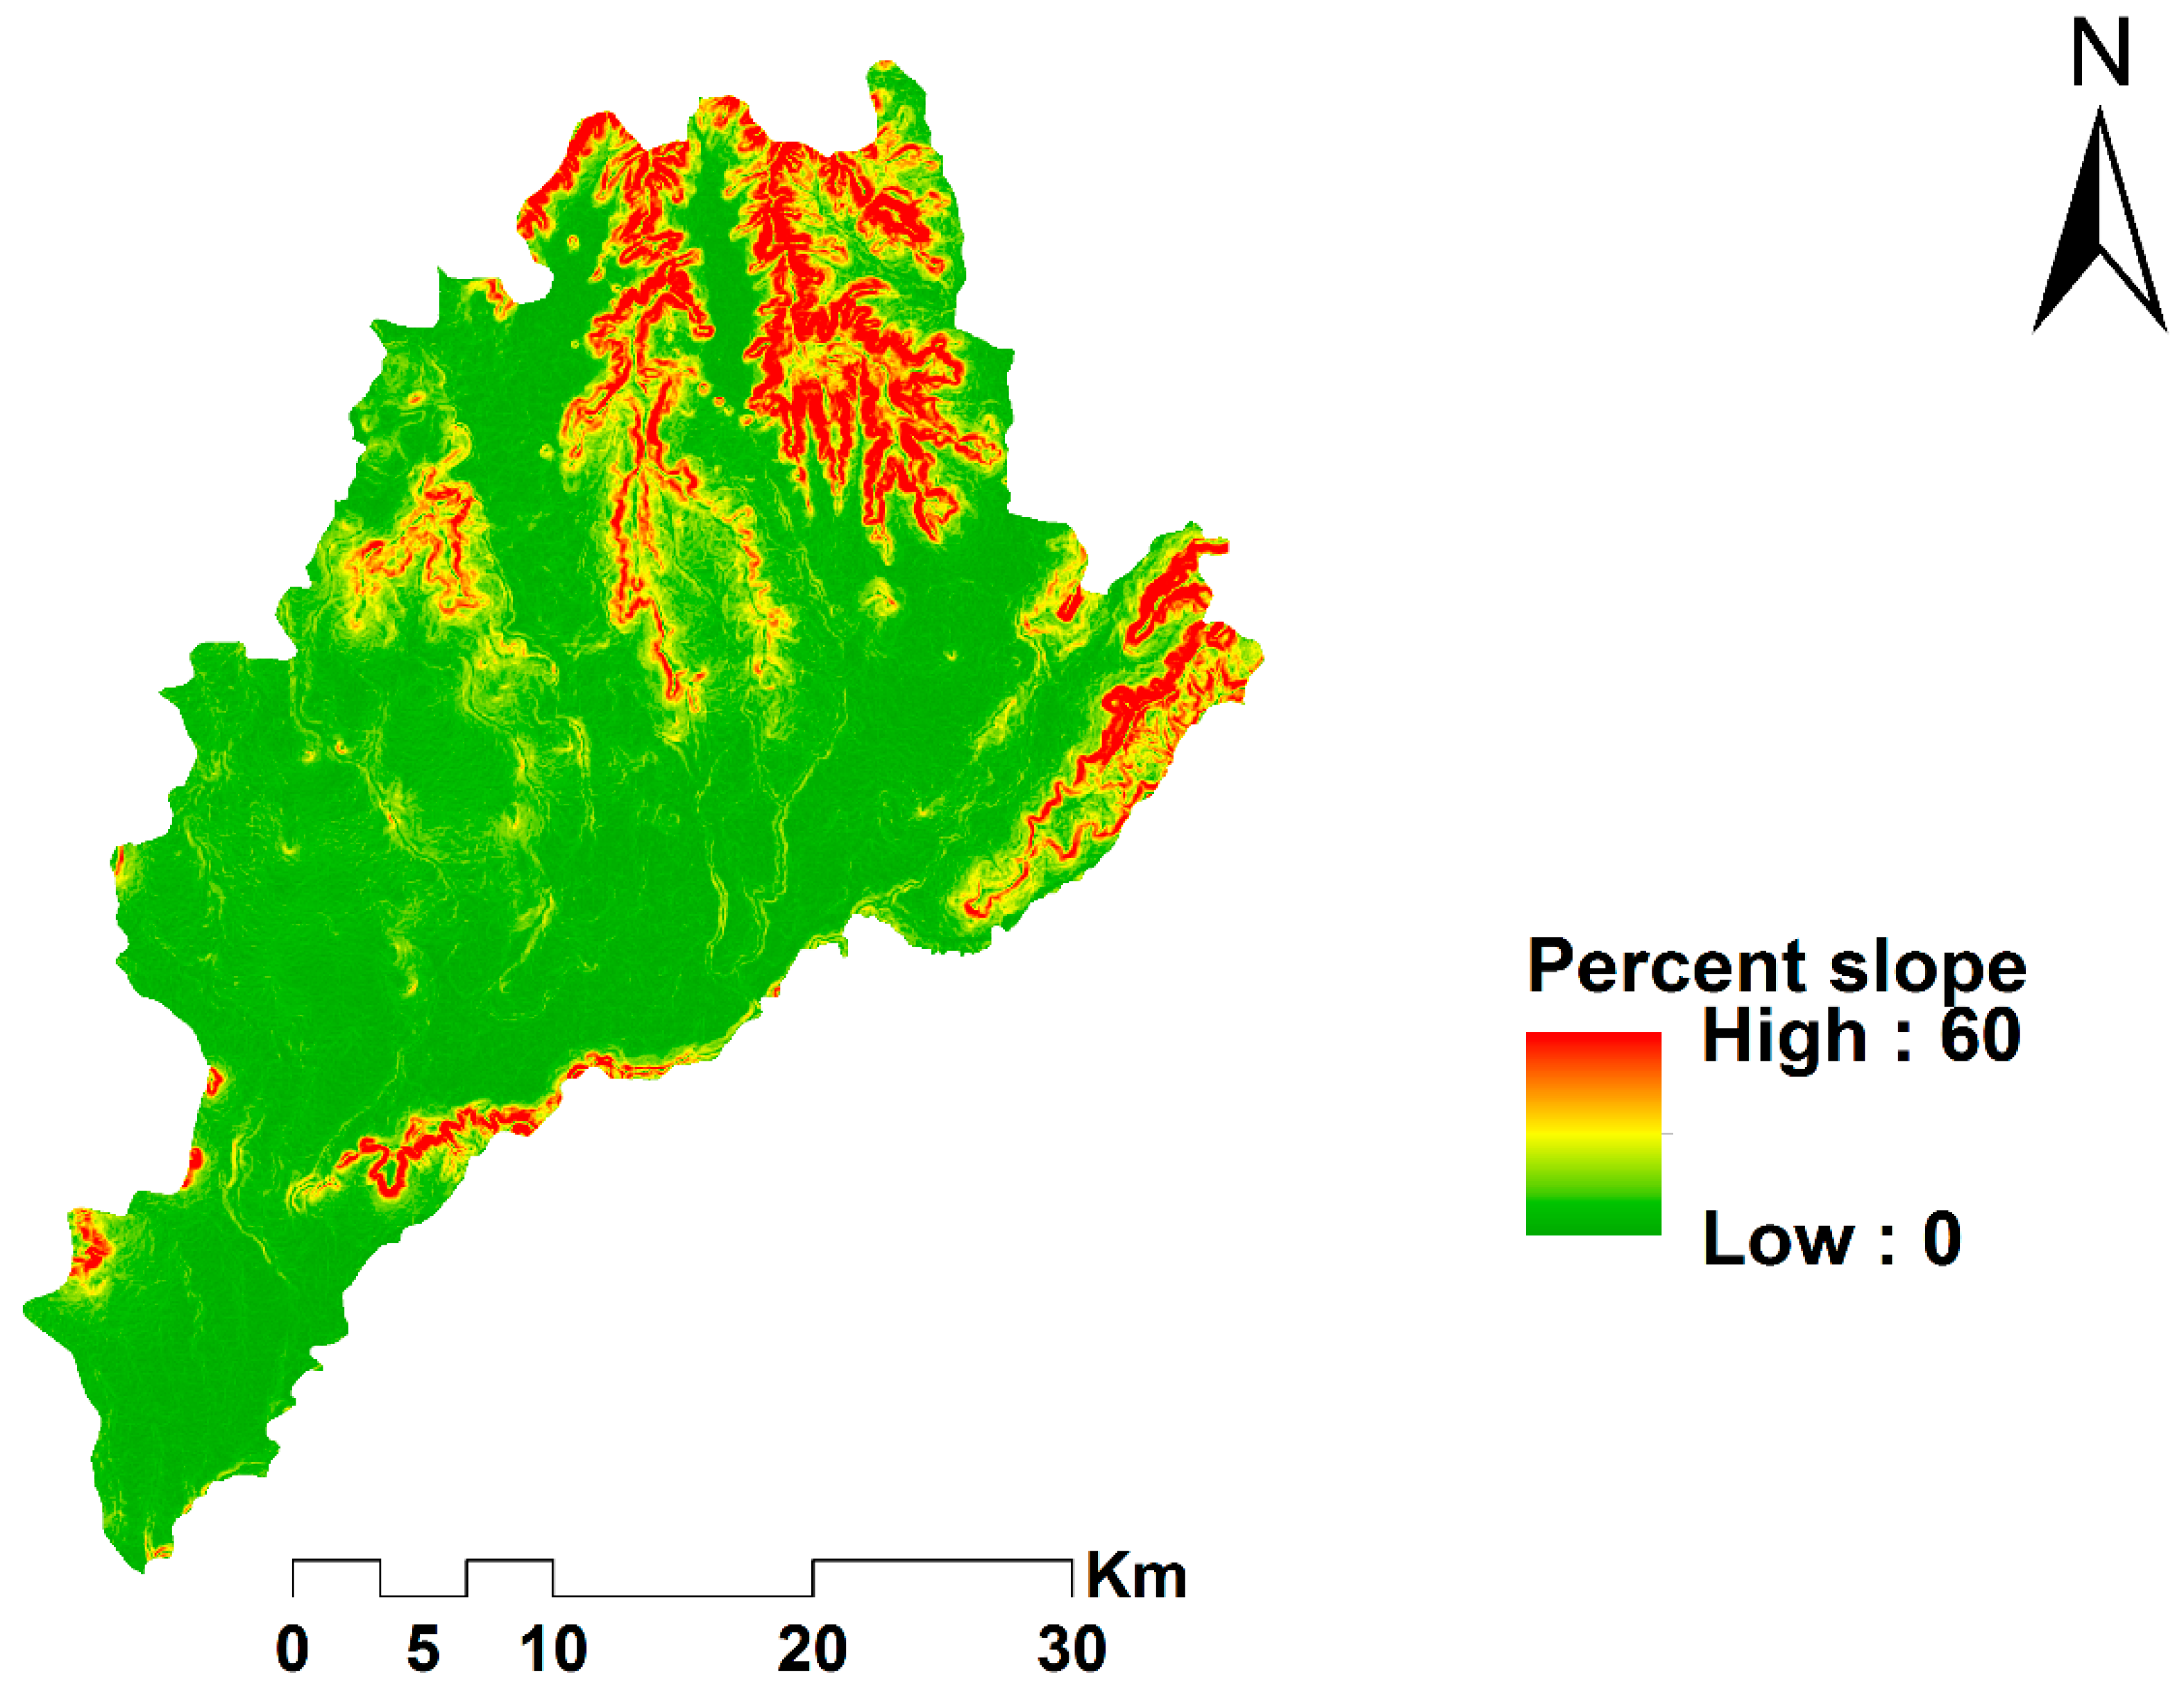
Slope Factor
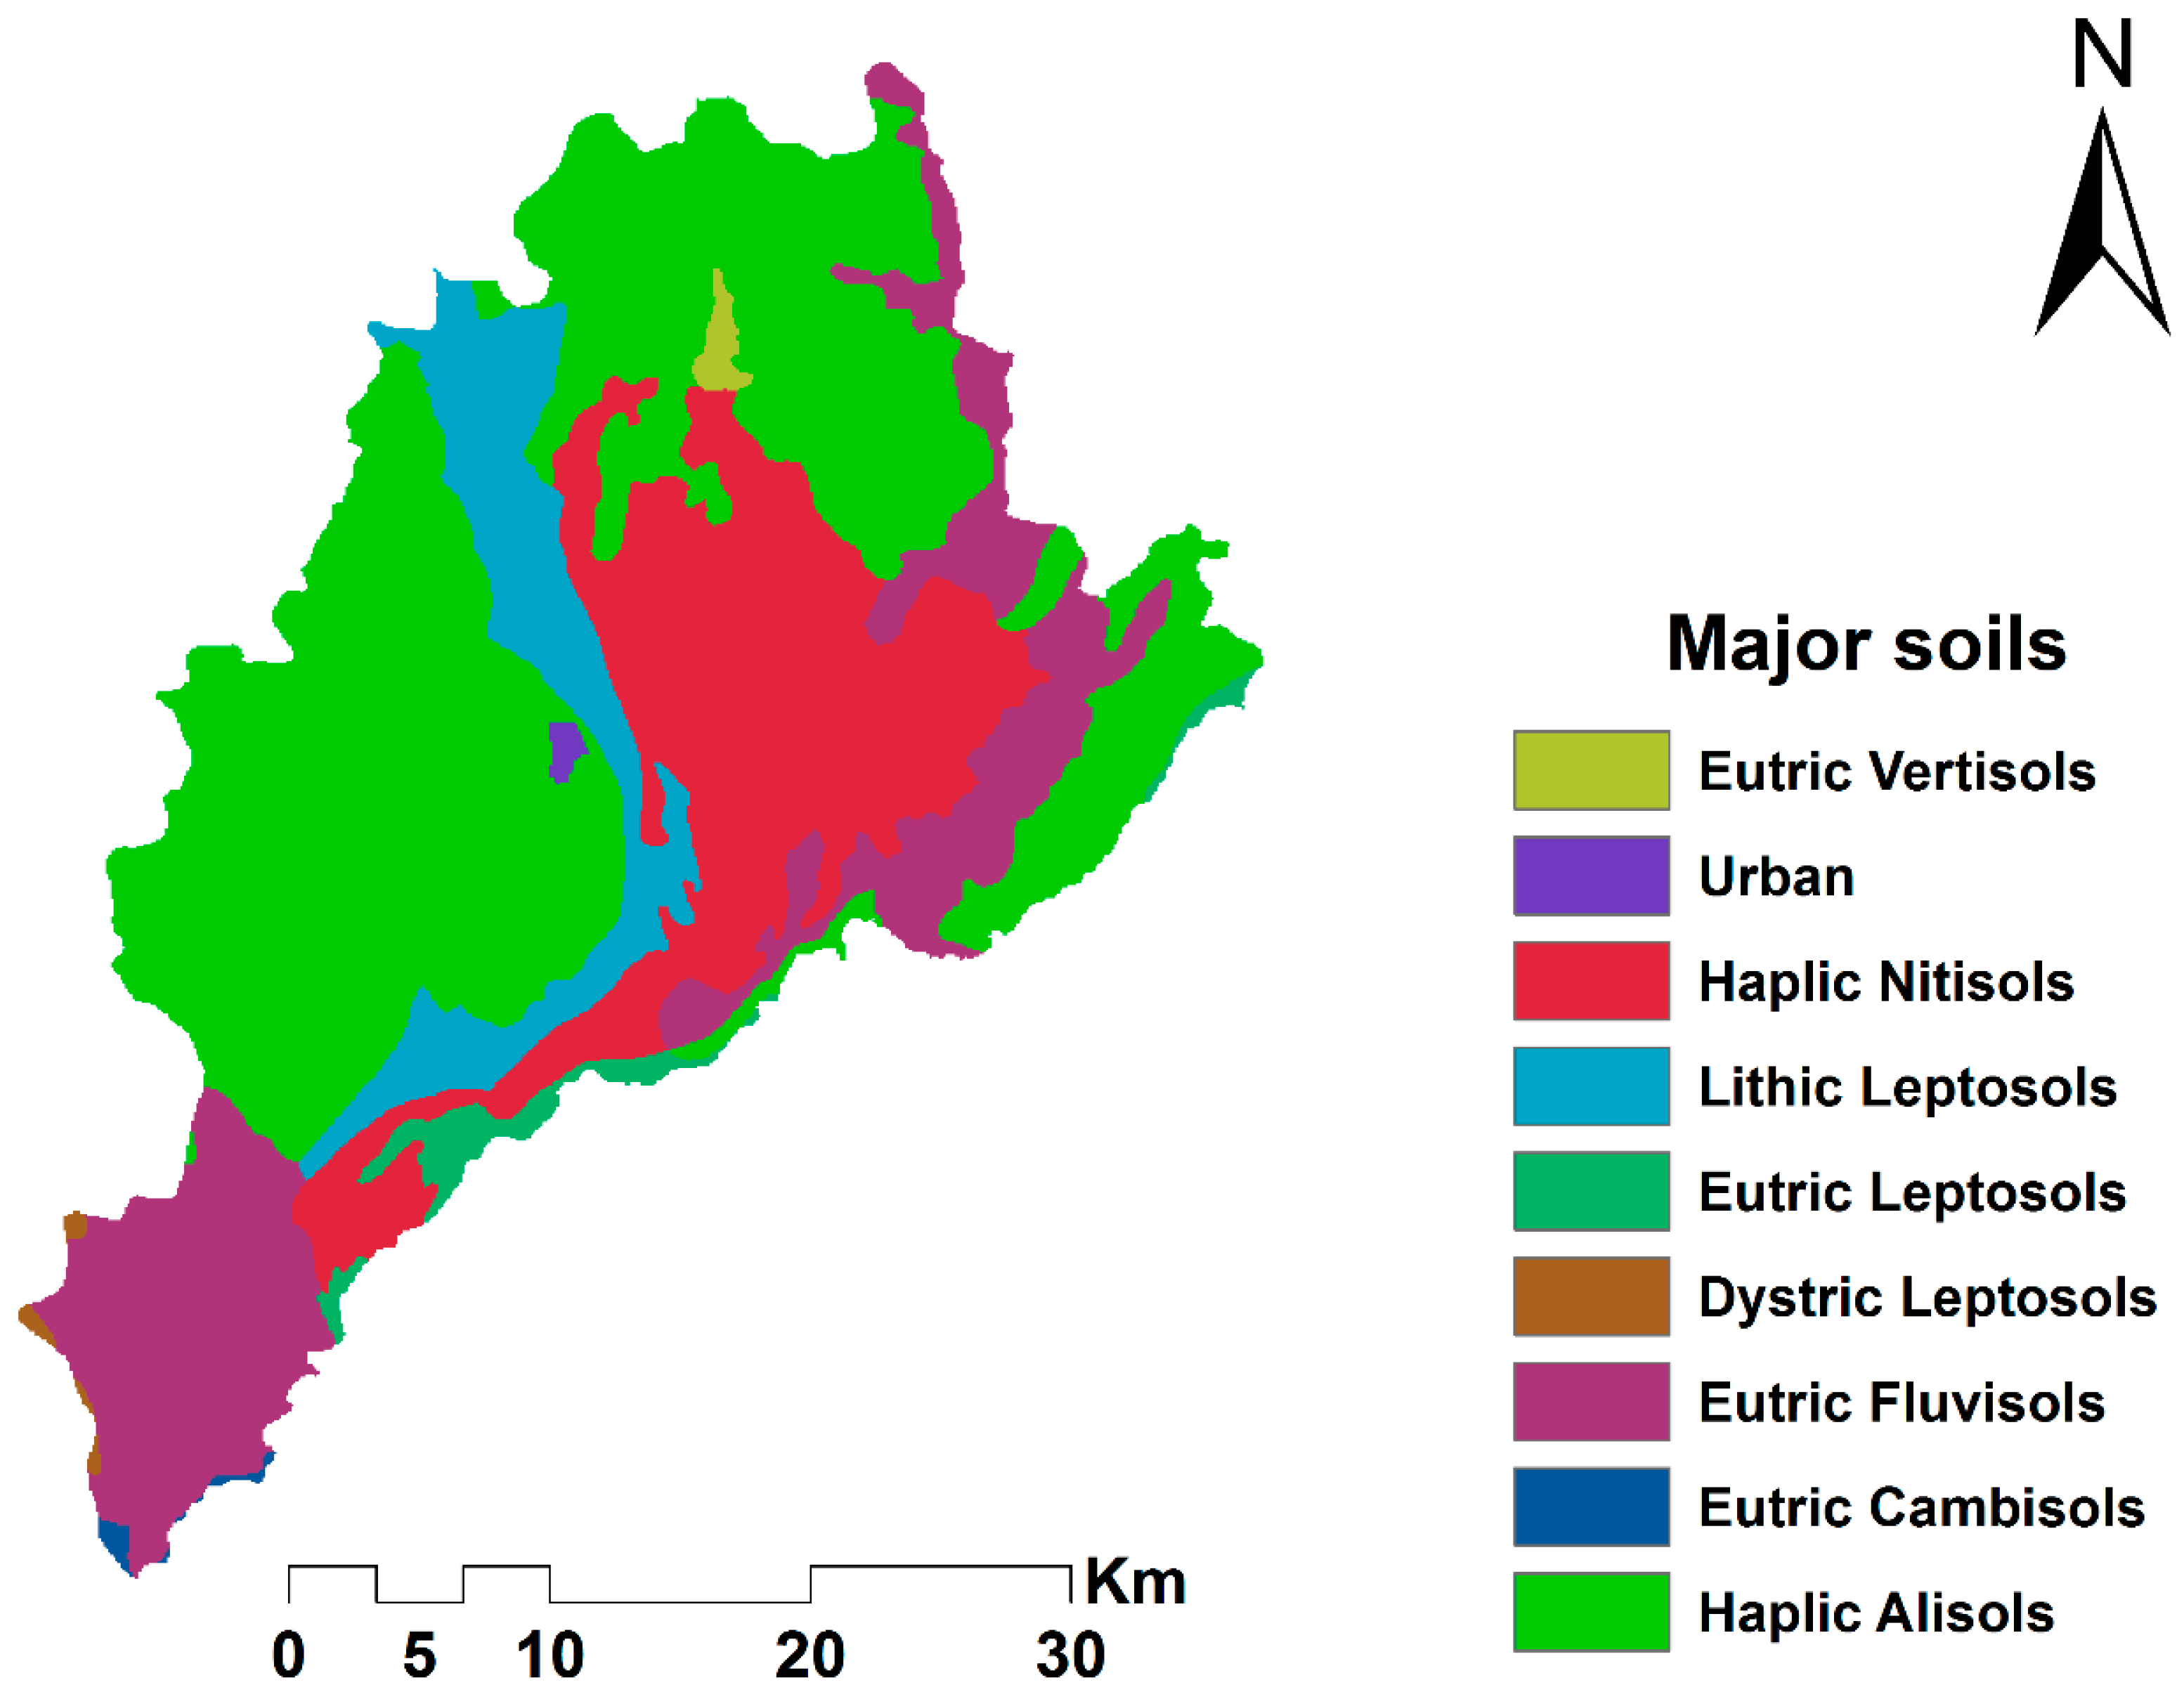
Soil factor
River Proximity Factor
Land Use Suitability Factor
2.3.4. Weighted Overlay Analysis of the Factors
2.3.5. Irrigation Water Requirement
3. Results and Discussion
3.1. SWAT Model
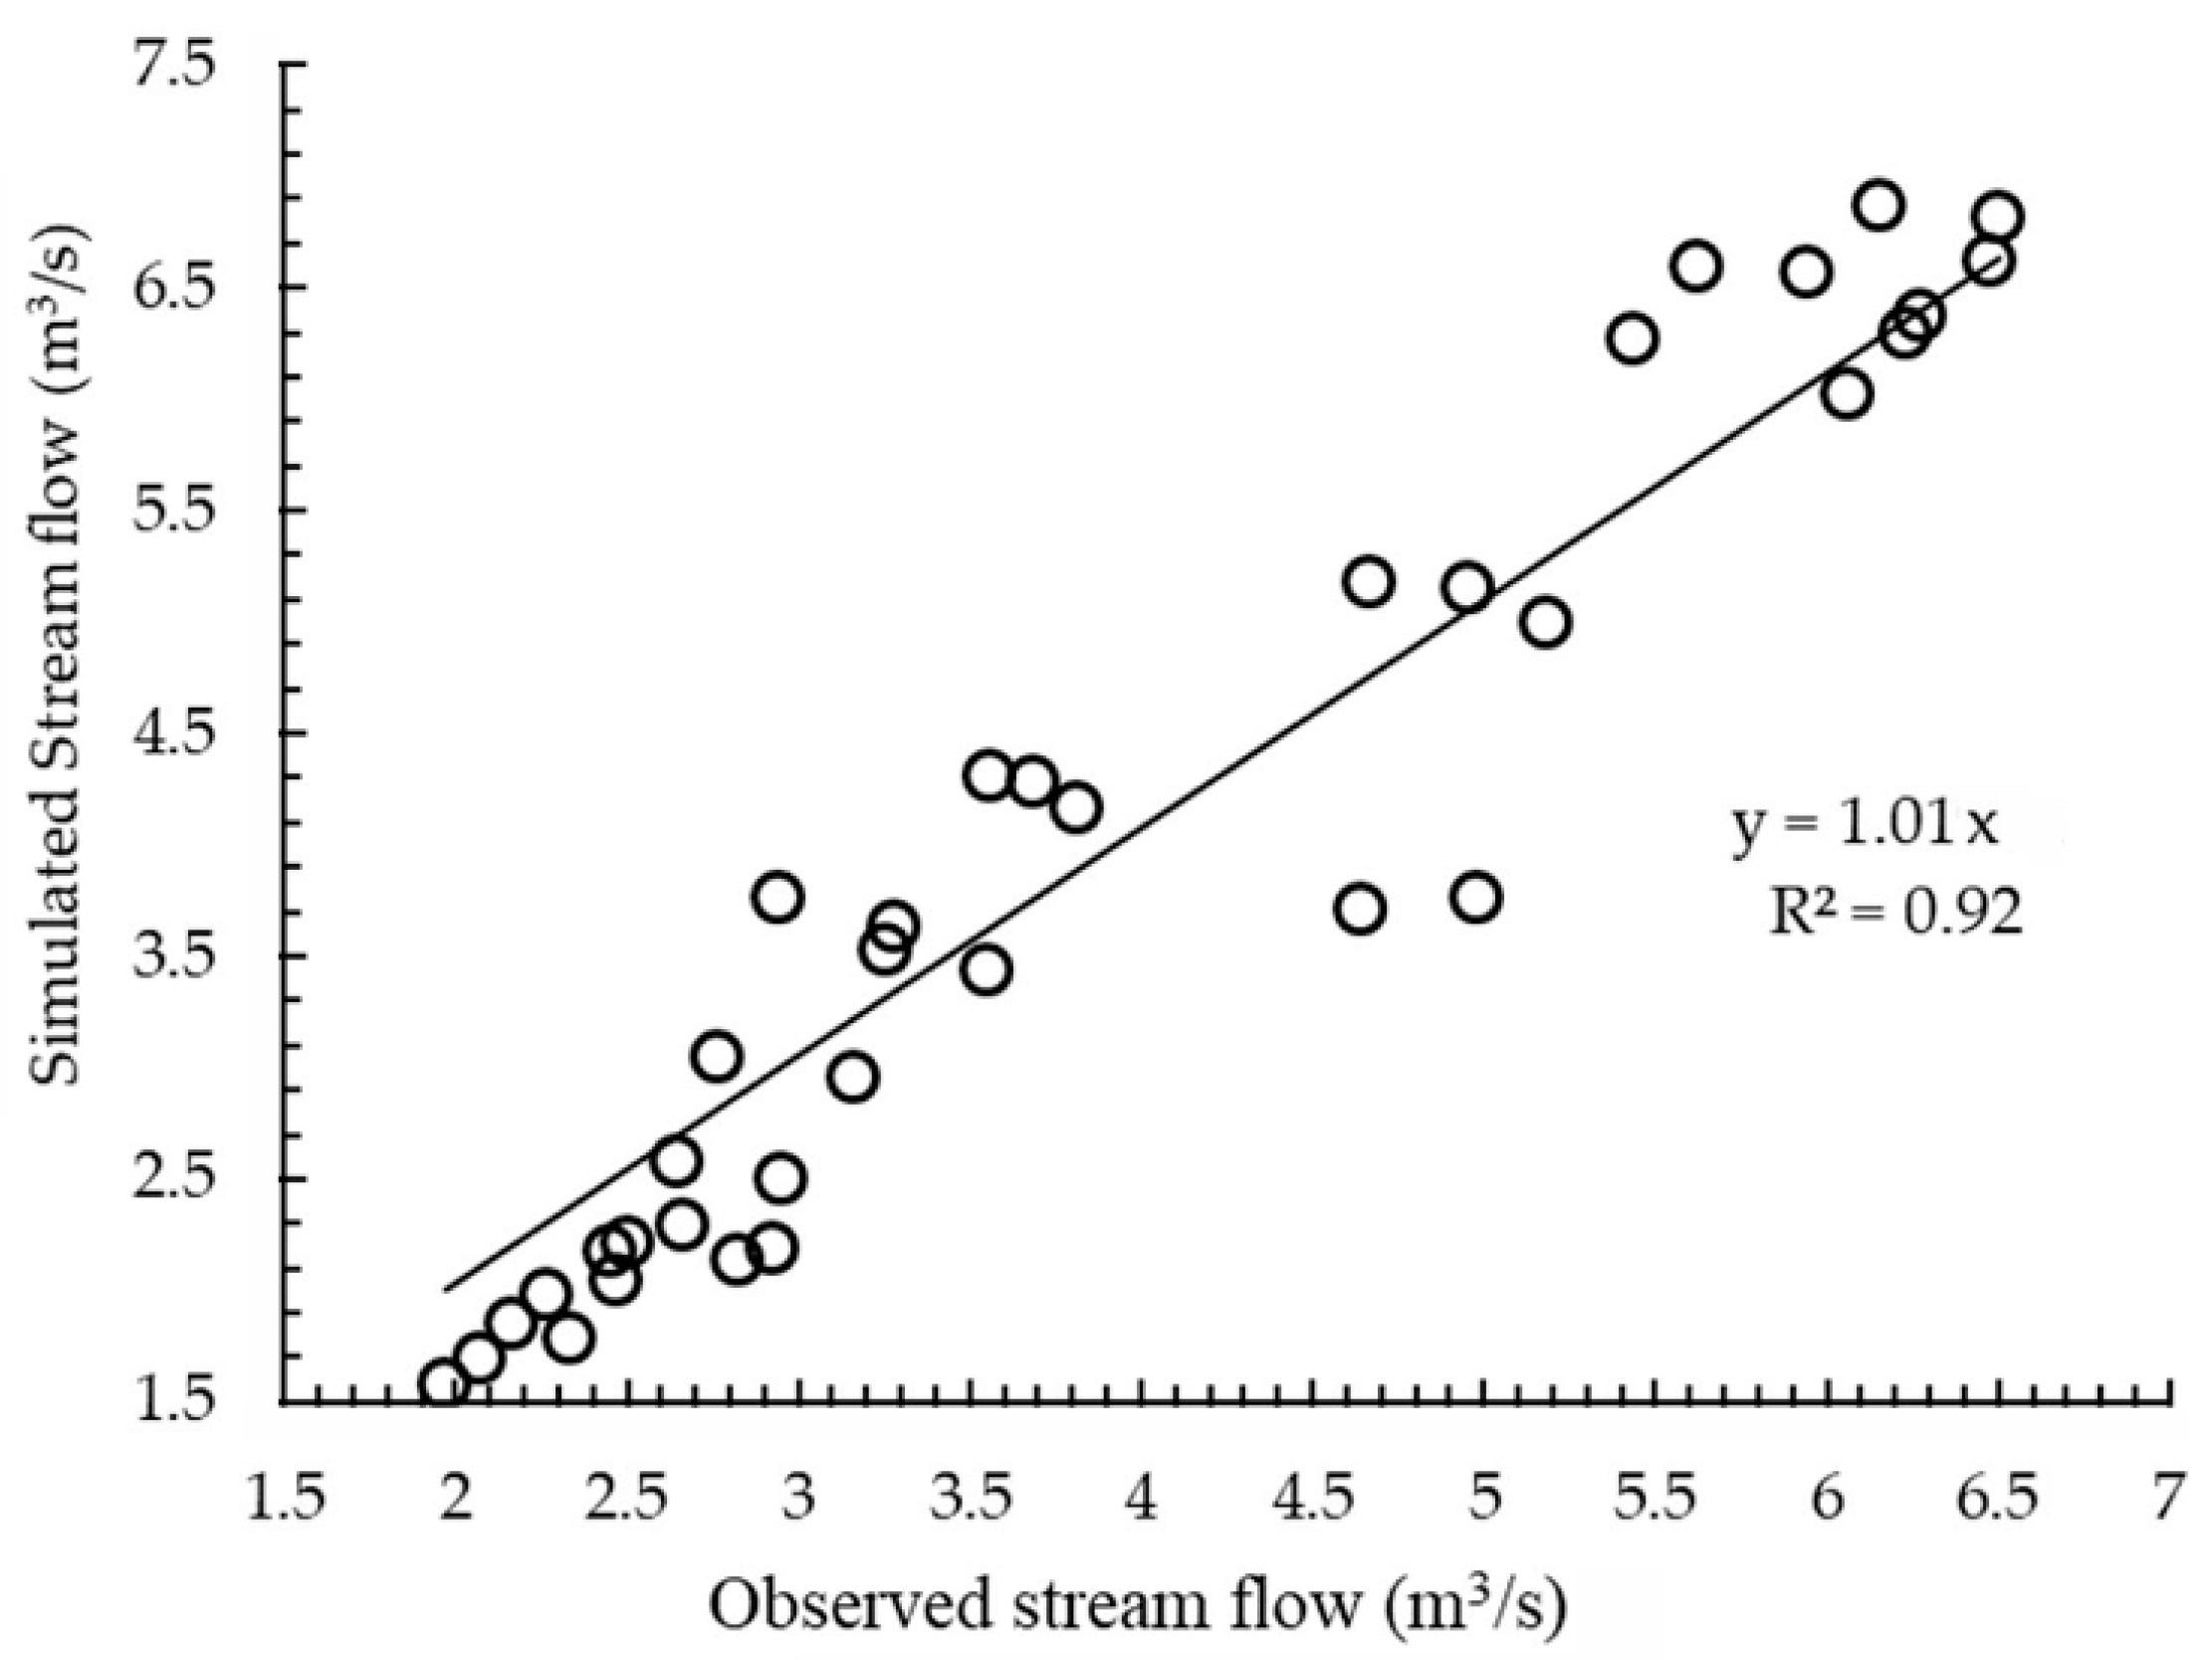
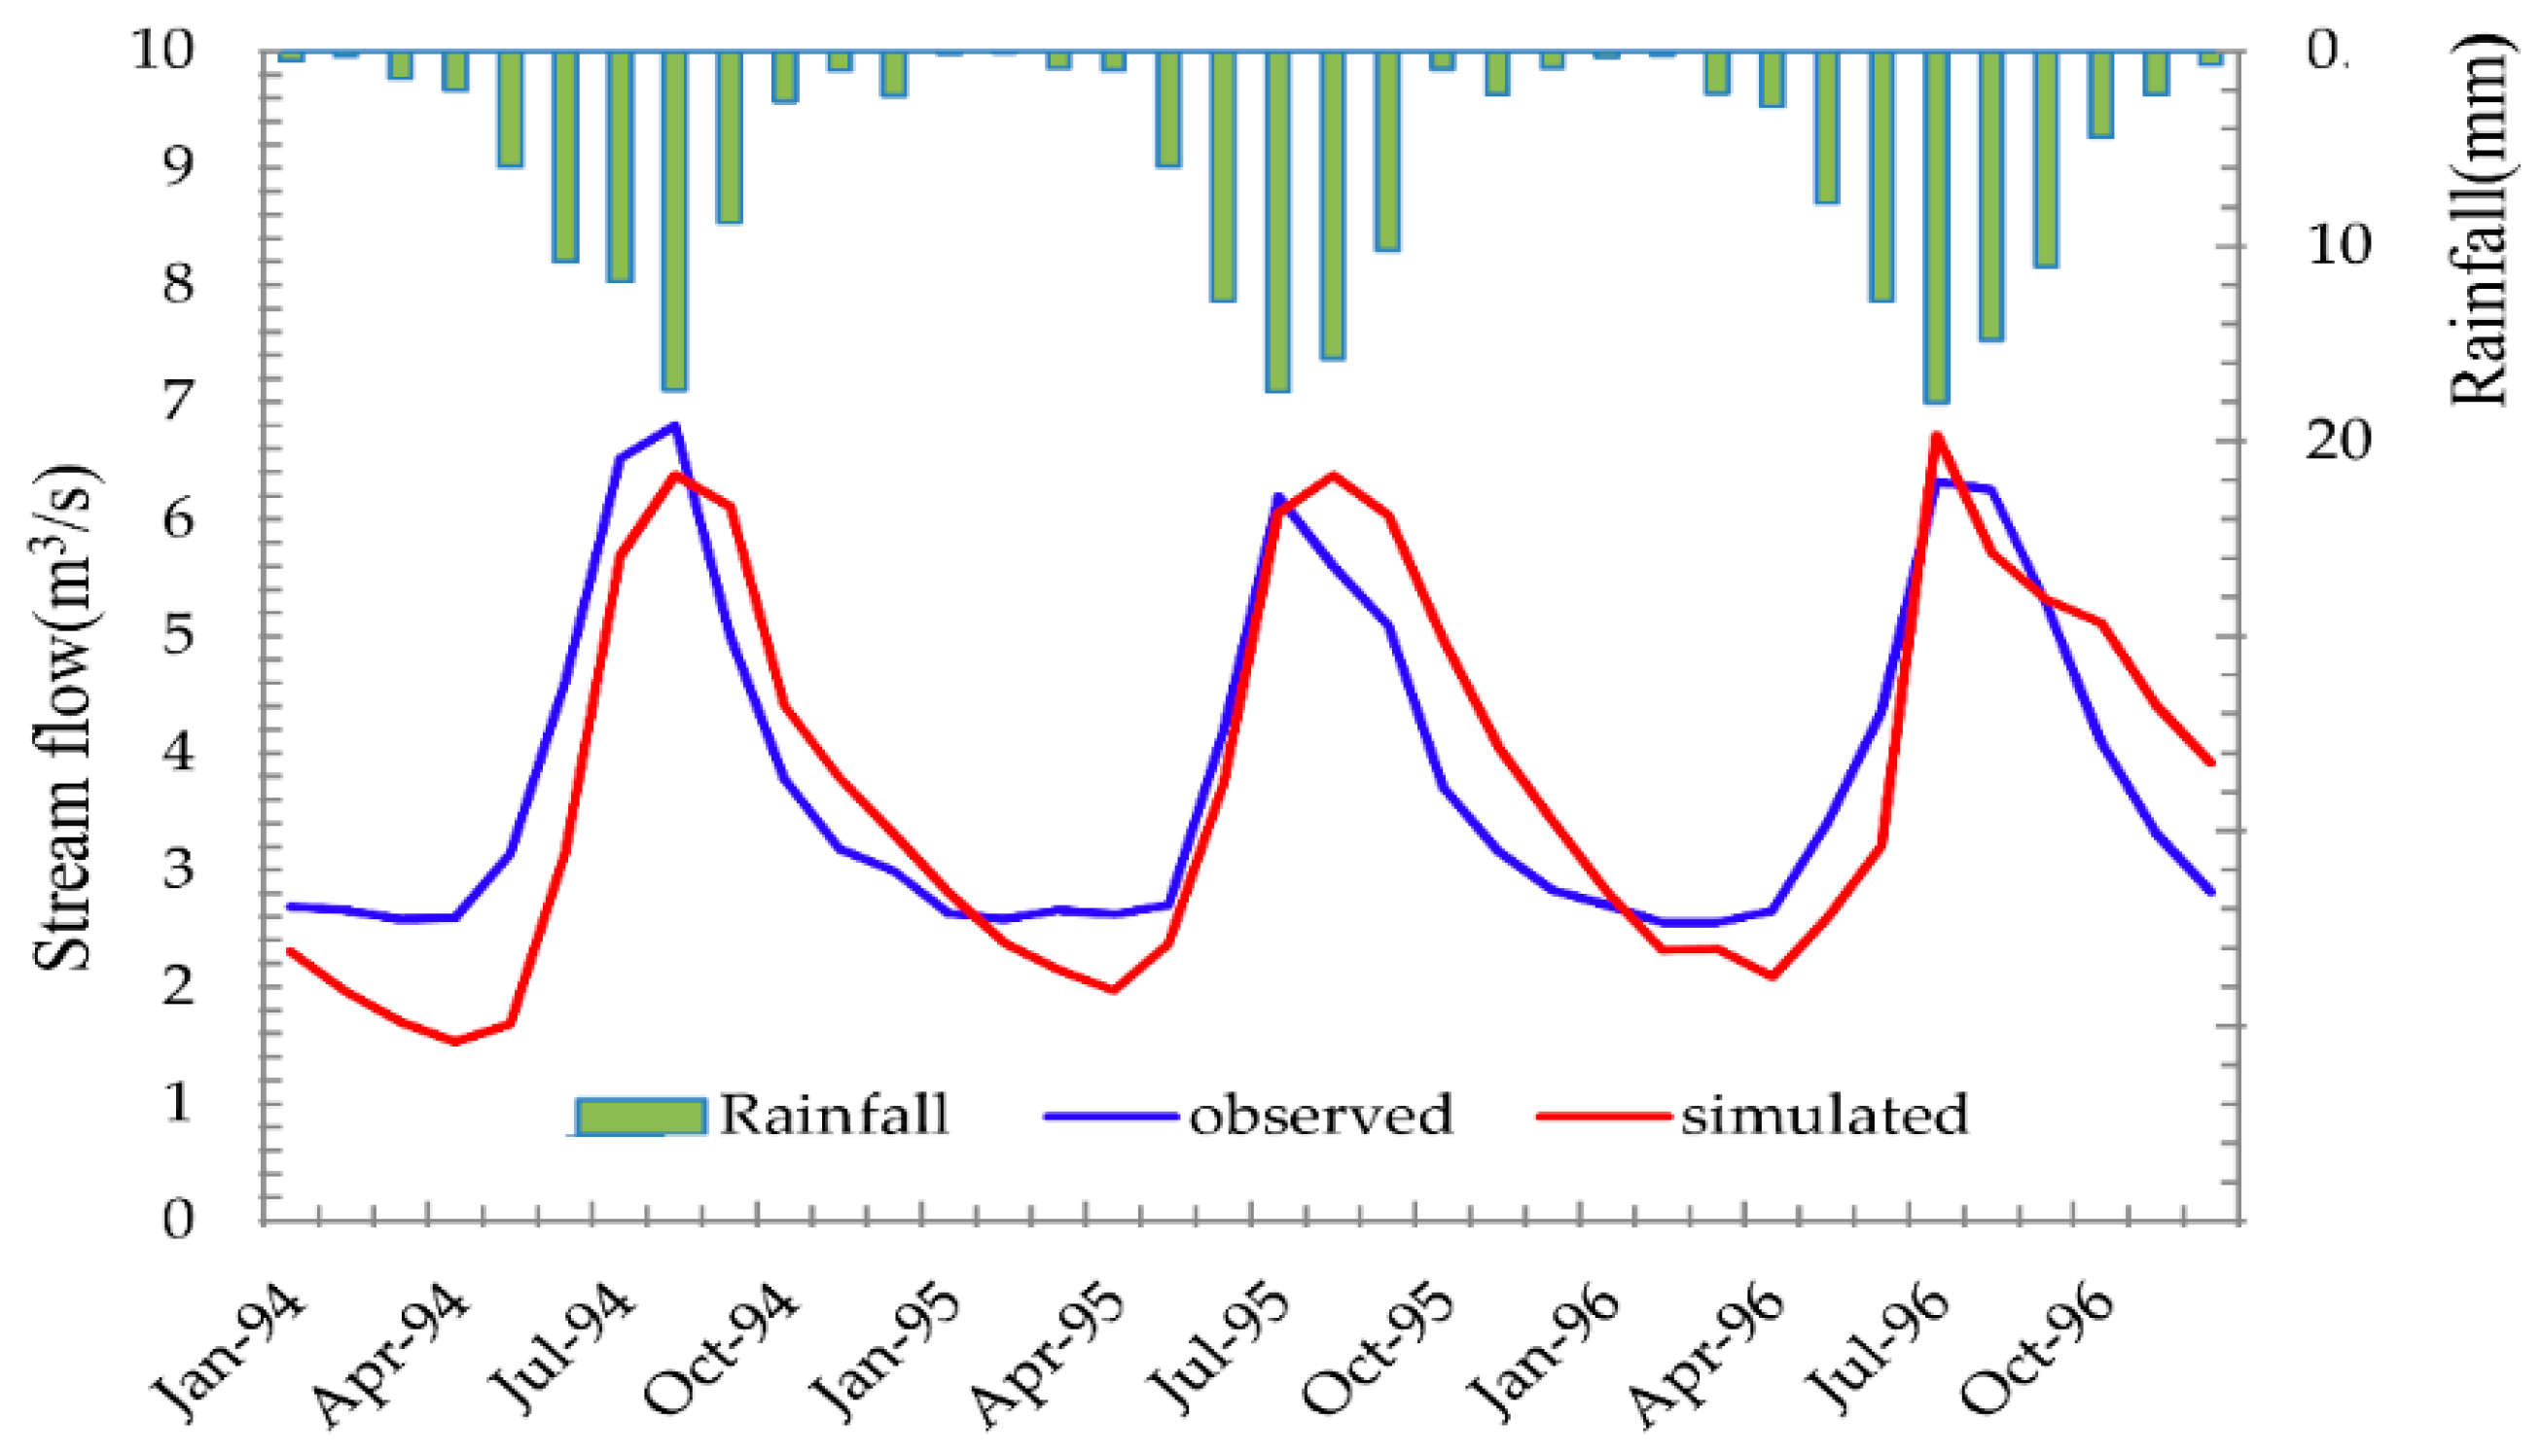
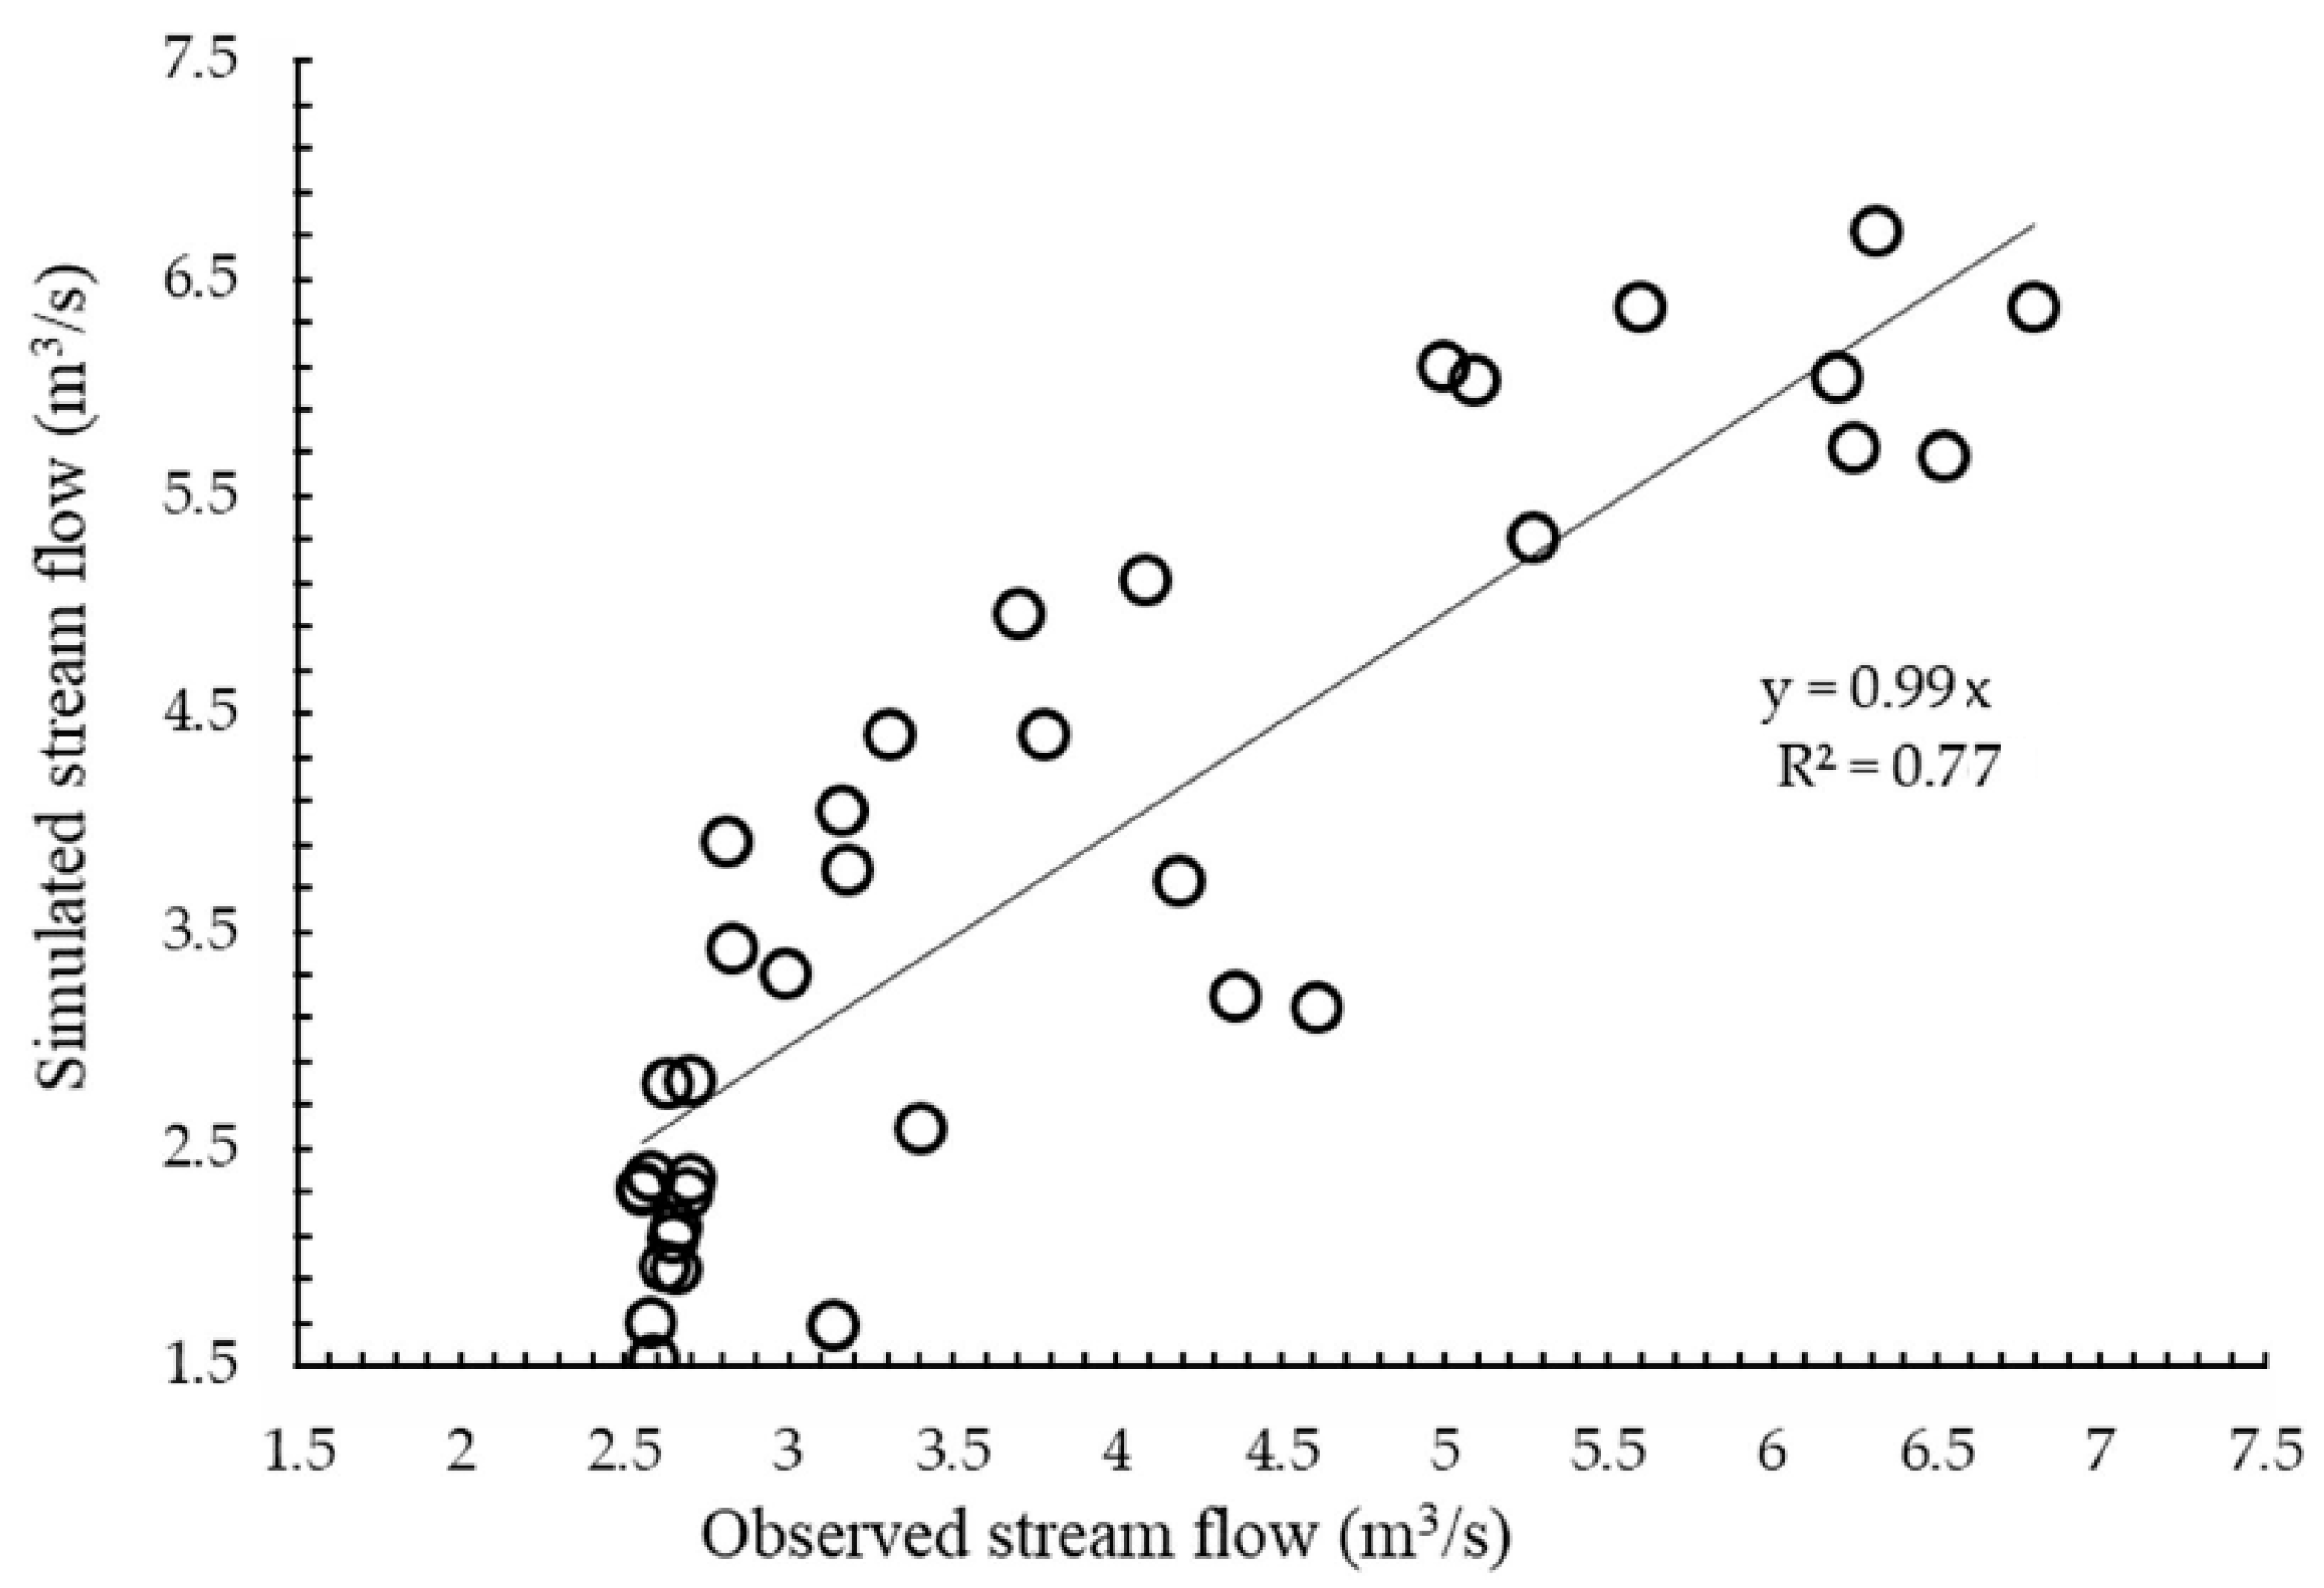
Sensitivity Analysis, Calibration and Validation
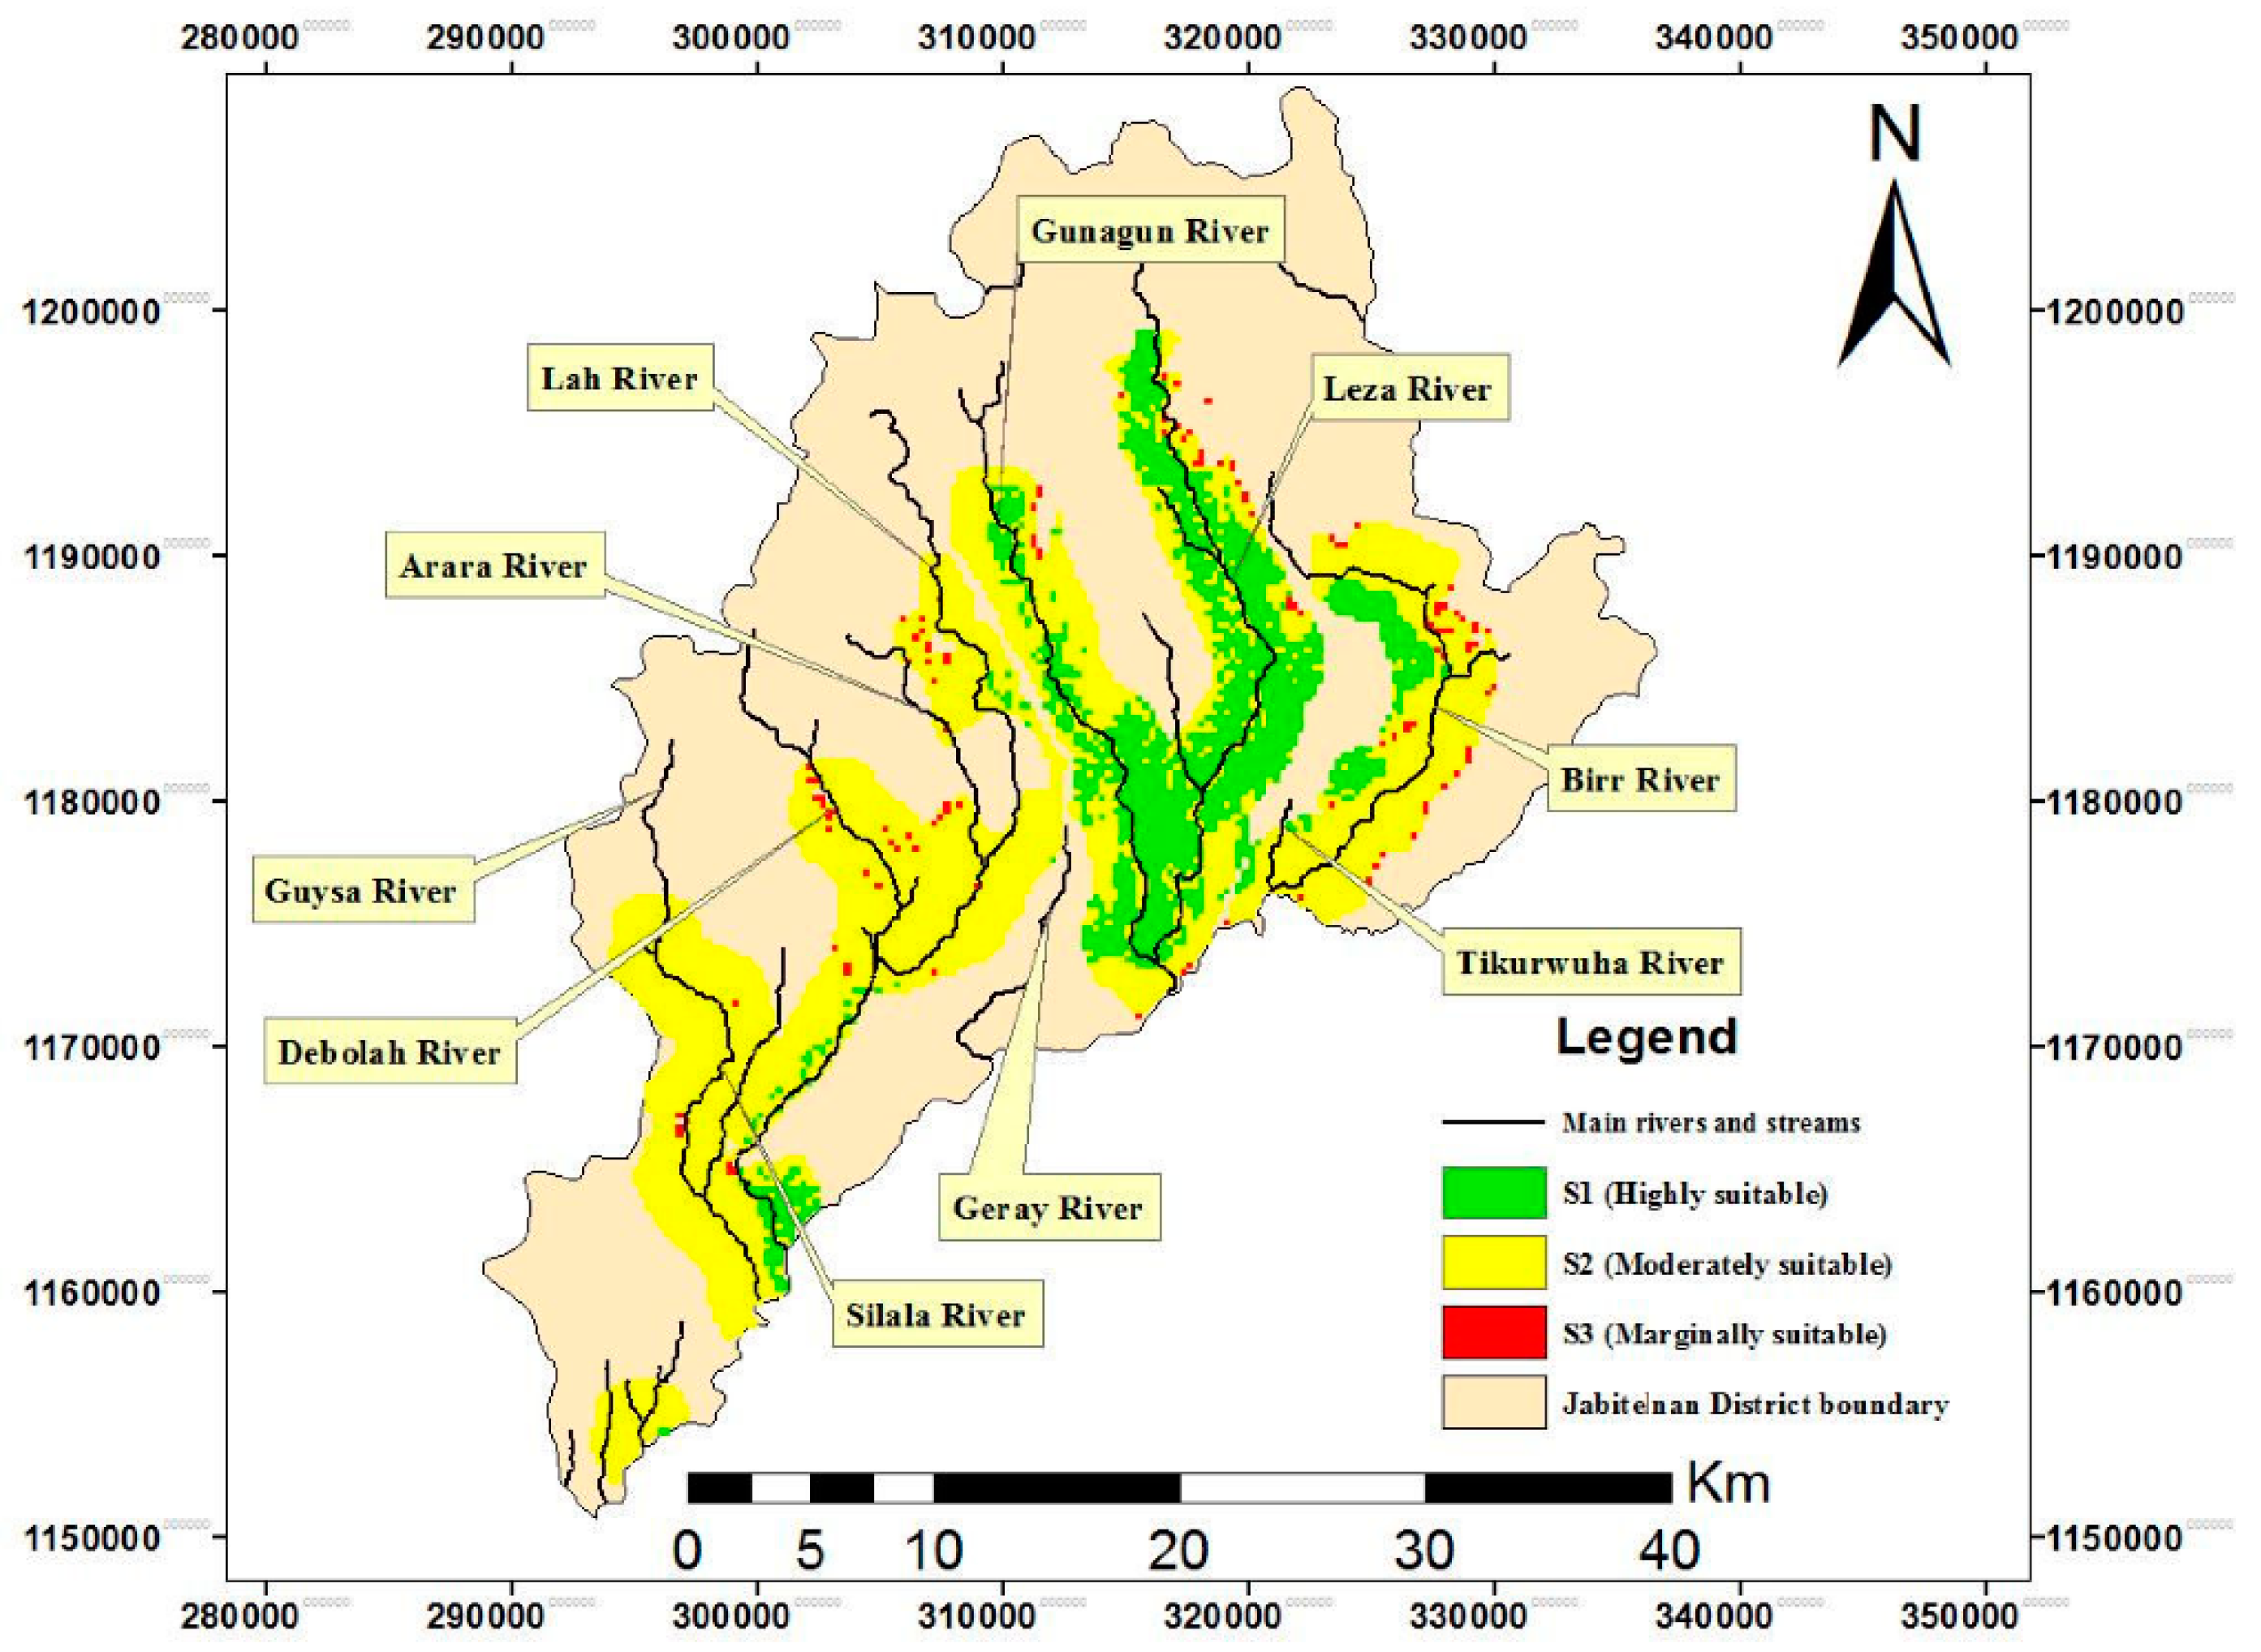
3.2. Ungauged Catchments Water Yield Simulation
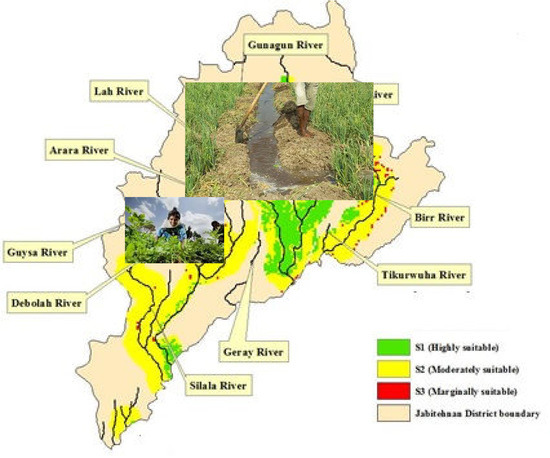
3.3. Irrigation Suitability Evaluation
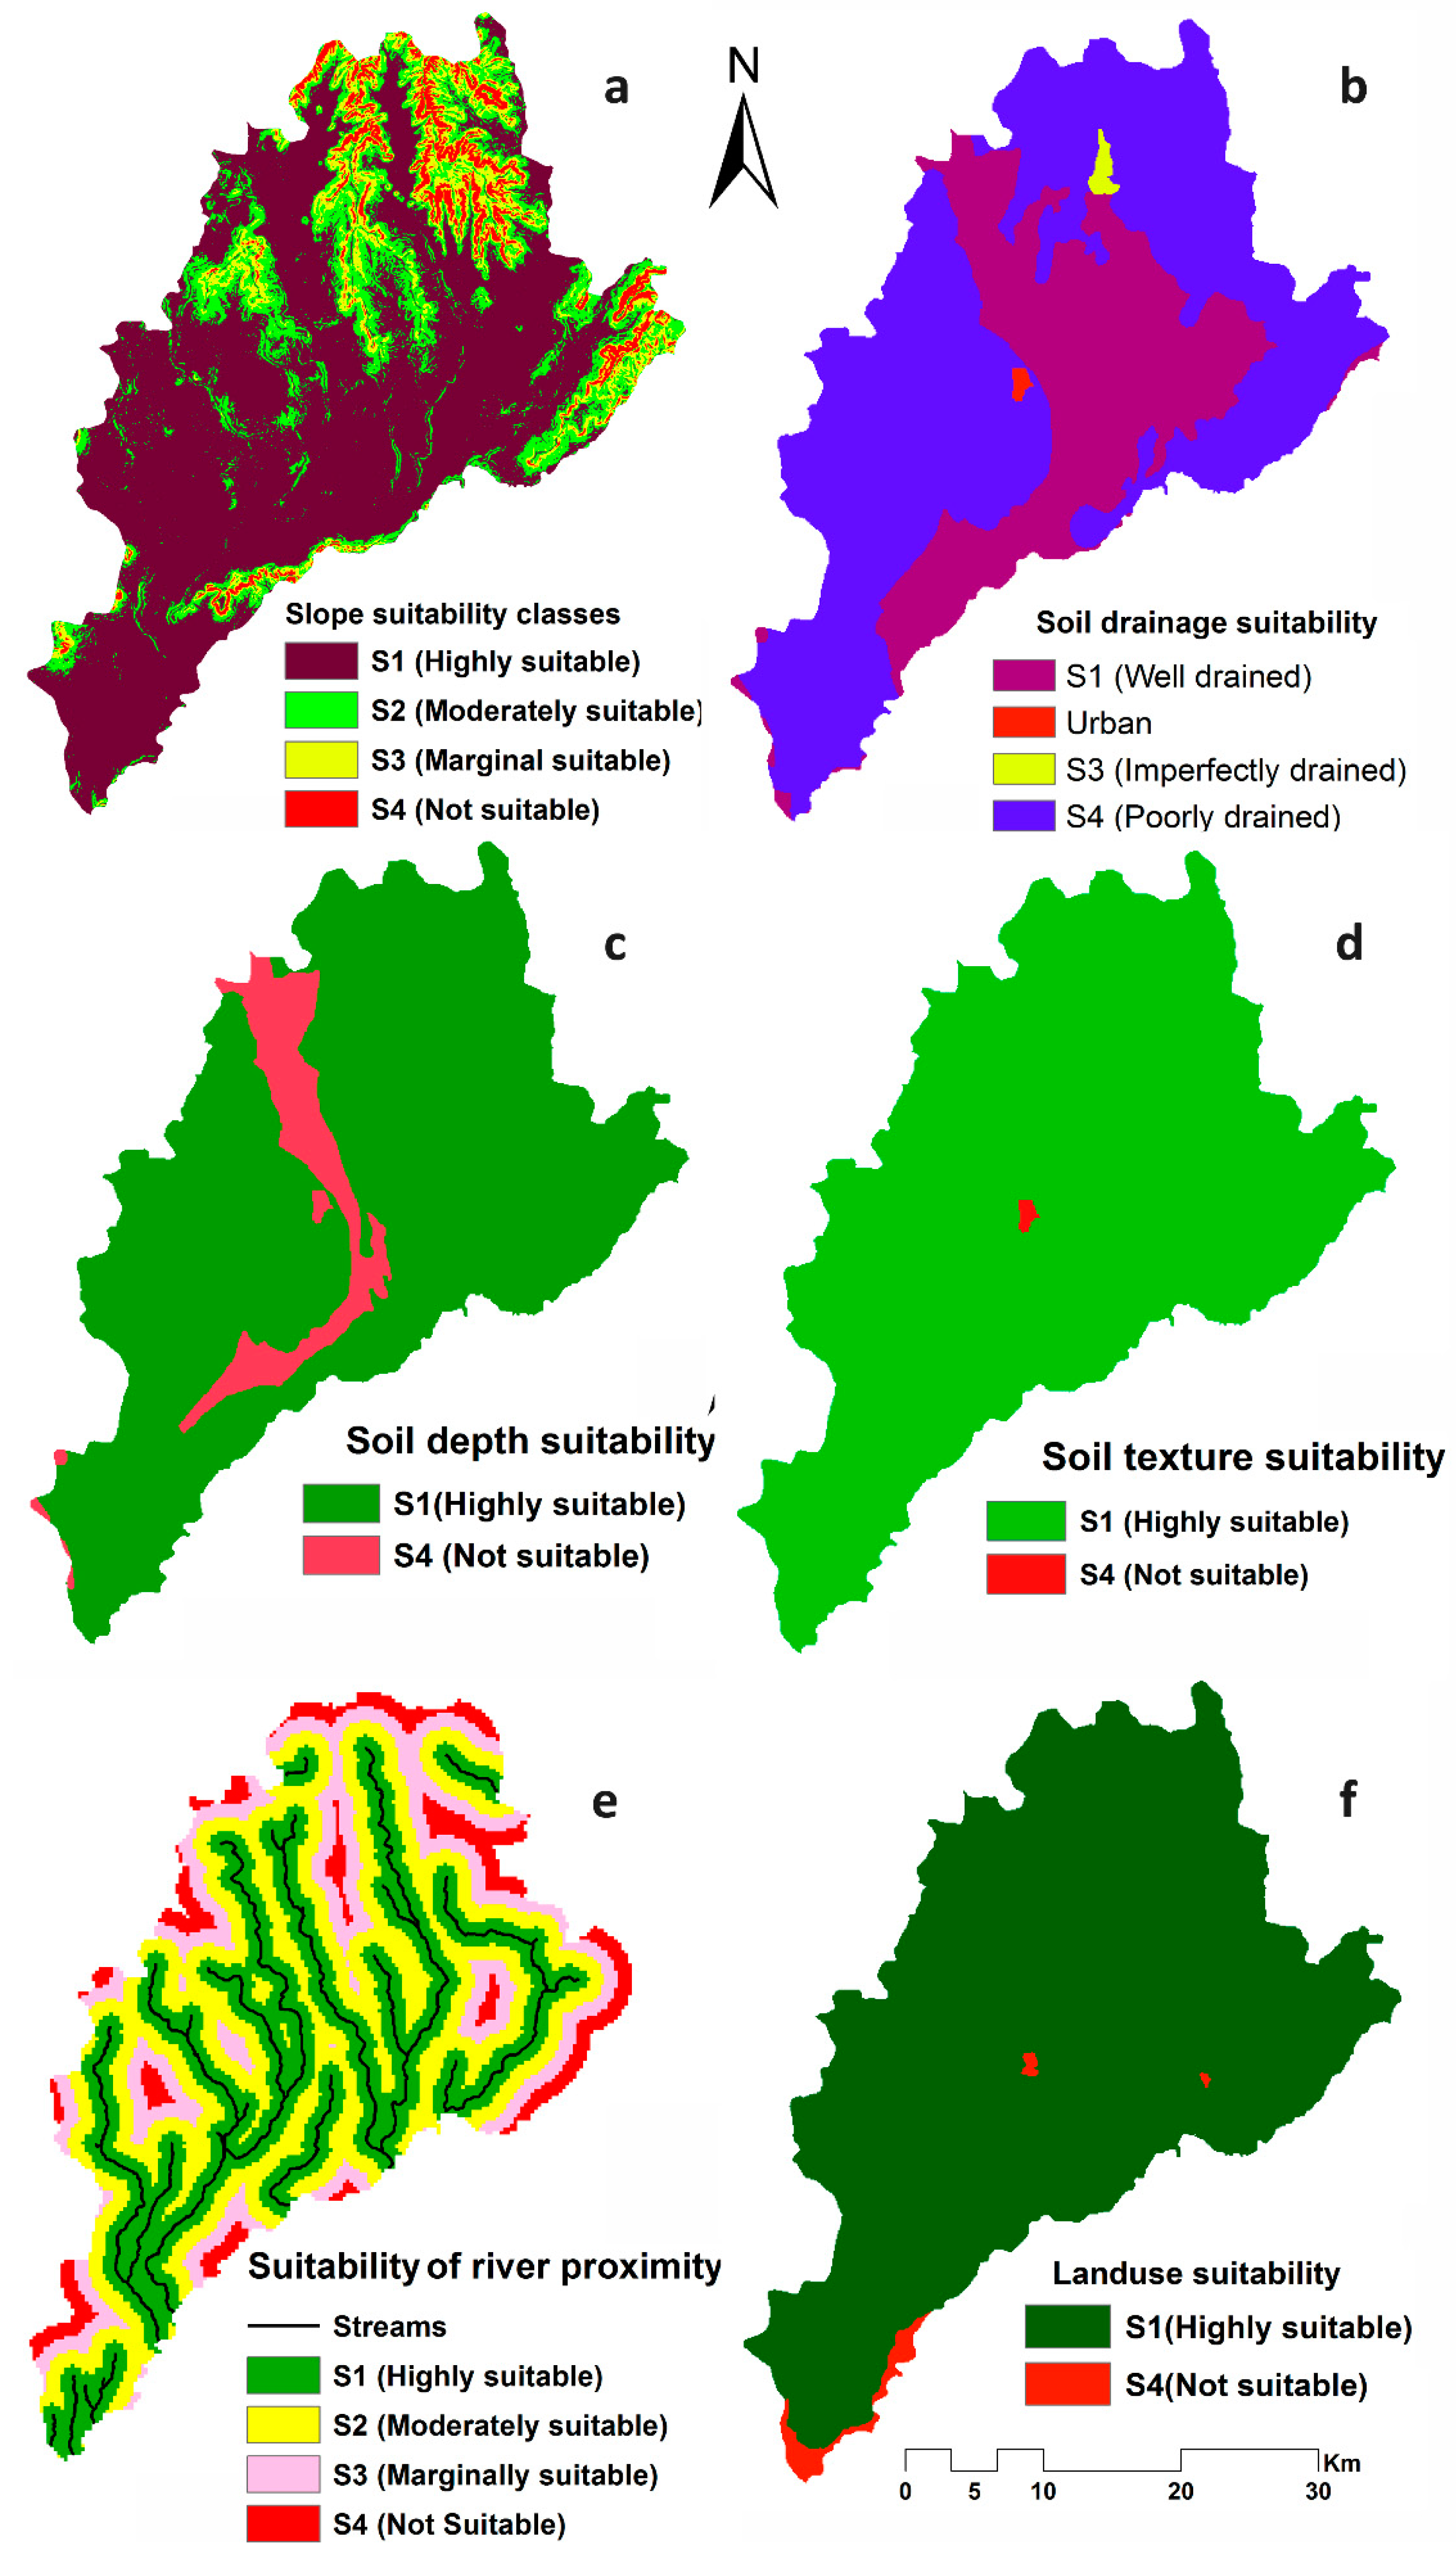
3.3.1. Slope Suitability
3.3.2. Soil Suitability
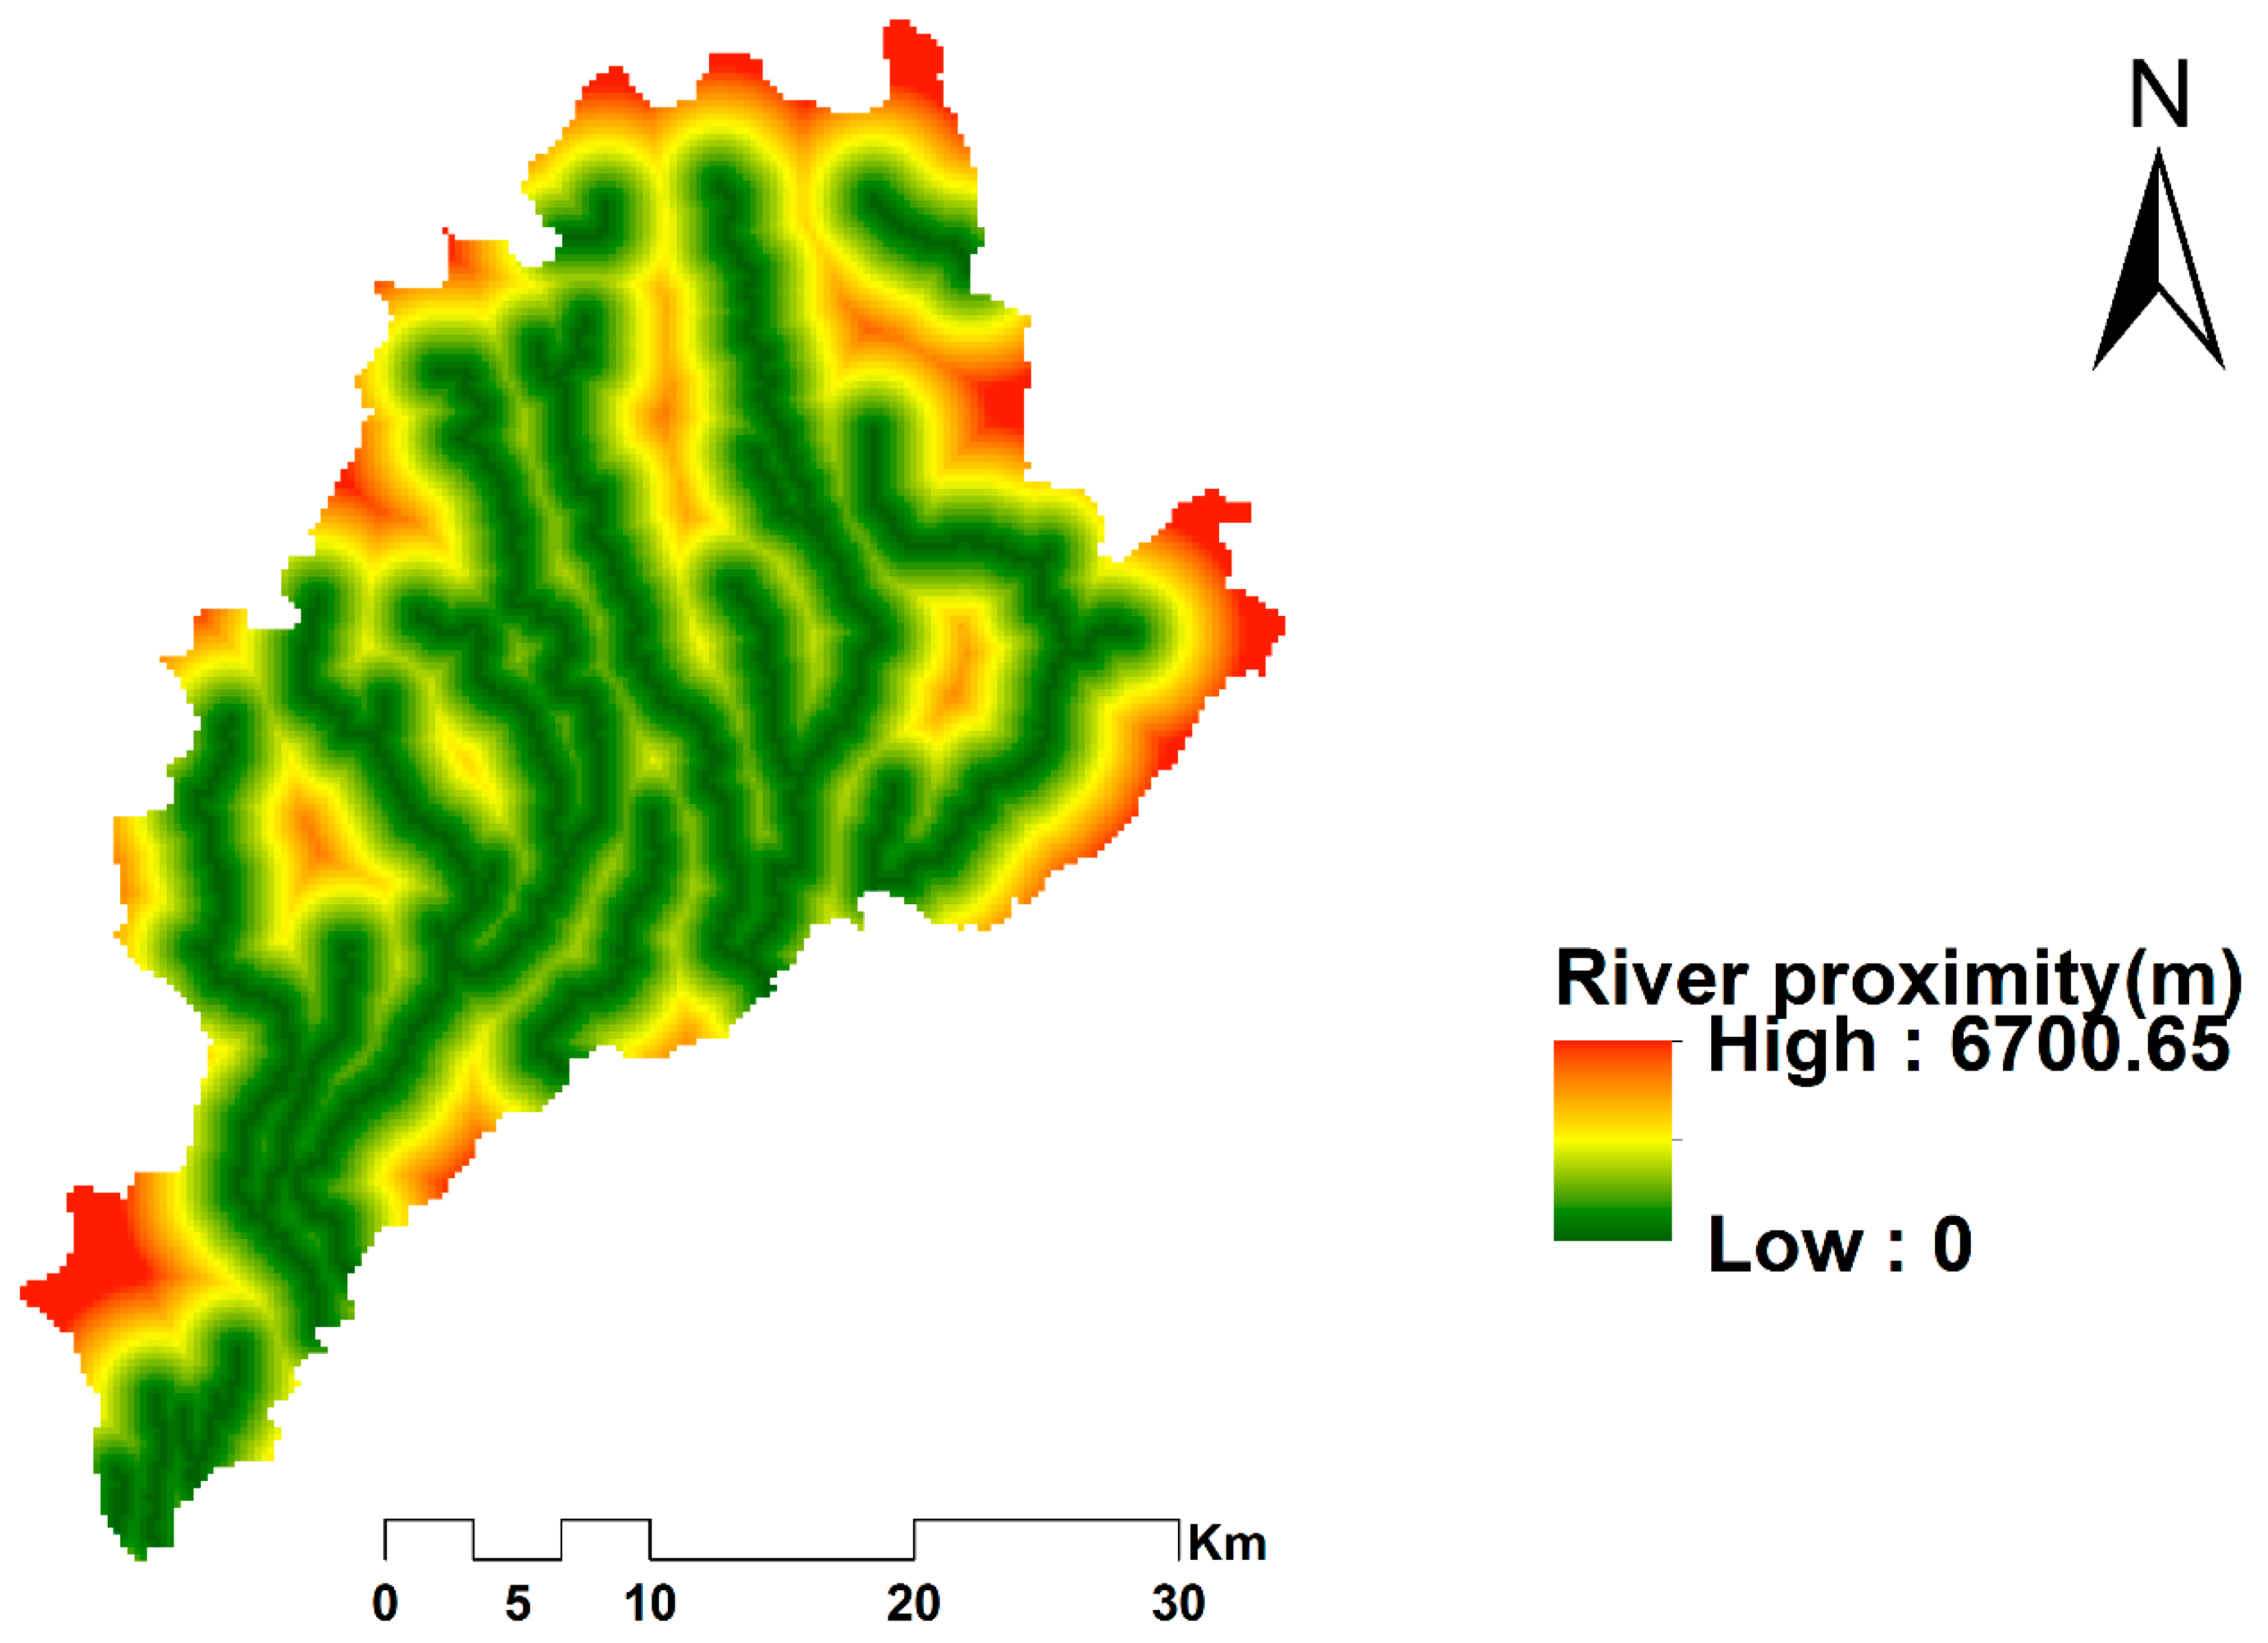
3.3.3. River Proximity
3.3.4. Land Use Suitability
3.4. Weighting of Factors and Suitable Areas for Irrigation
3.5. Irrigation Water Requirements and Irrigation Potential
4. Conclusions
Author Contributions
Funding
Acknowledgments
Conflicts of Interest
References
- Food and Agriculture Organization. Irrigation Potential in Africa. A Basin Approach. Land Water Bull. 1997, 4. [Google Scholar]
- Ayele, G.K. The Impact of Selected Small-Scale Irrigation Schemes on Household Income and the Likelihood of Poverty in the Lake Tana Basin of Ethiopia. Master’s Thesis, Cornell University, Ithaca, NY, USA, 2015. [Google Scholar]
- Awulachew, S.B.; Yilma, A.D.; Loulseged, M.; Loiskandl, W.; Ayana, M.; Alamirew, T. Water Resources and Irrigation Development in Ethiopia; International Water Management Institute: Washington, DC, USA, 2007. [Google Scholar]
- Makombe, G.; Kelemework, D.; Aredo, D. A comparative analysis of rainfed and irrigated agricultural production in Ethiopia. Irrig. Drain. Syst. 2007, 21, 35–44. [Google Scholar] [CrossRef]
- Worqlul, A.W.; Collick, A.S.; Rossiter, D.G.; Langan, S.; Steenhuis, T.S. Assessment of surface water irrigation potential in the Ethiopian highlands: The Lake Tana Basin. Catena 2015, 129, 76–85. [Google Scholar] [CrossRef]
- Berry, L. Land degradation in Ethiopia: Its extent and impact. Comm. GM WB Support 2003, 2–7. [Google Scholar]
- Fasil, K. Analysis of Yield Gap for Wheat Cultivation in the Highlands of North Ethiopia. Ph.D. Thesis, Gent University, Gent, Belgium, 2002. [Google Scholar]
- Davidson, D.A. The Evaluation of Land Resources; Stirling University Press: Stirling, Scotland, UK, 1992. [Google Scholar]
- Arnold, J.G.; Srinivasan, R.; Muttiah, R.S.; Williams, J.R. Large Area Hydrologic Modeling and Assessment Part I: Model Development; Wiley Online Library: Hoboken, NJ, USA, 1998. [Google Scholar]
- Aguilar-Manjarrez, J.; Ross, L.G. Geographical information system (GIS) environmental models for aquaculture development in Sinaloa State, Mexico. Aquac. Int. 1995, 3, 103–115. [Google Scholar] [CrossRef]
- Fasina, A.; Awe, G.; Aruleba, J. Irrigation suitability evaluation and crop yield–An example with Amaranthus cruentus in Southwestern Nigeria. Afr. J. Plant Sci. 2008, 2, 61–66. [Google Scholar]
- Bhunya, P.K.; Jain, S.; Singh, P.; Mishra, S. A simple conceptual model of sediment yield. Water Res. Manag. 2010, 24, 1697–1716. [Google Scholar] [CrossRef]
- Abbaspour, K.C.; Rouholahnejad, E.; Vaghefi, S.; Srinivasan, R.; Yang, H.; Kløve, B. A continental-scale hydrology and water quality model for Europe: Calibration and uncertainty of a high-resolution large-scale SWAT model. J. Hydrol. 2015, 524, 733–752. [Google Scholar] [CrossRef]
- Song, X.; Zhang, J.; Zhan, C.; Xuan, Y.; Ye, M.; Xu, C. Global sensitivity analysis in hydrological modeling: Review of concepts, methods, theoretical framework, and applications. J. Hydrol. 2015, 523, 739–757. [Google Scholar] [CrossRef]
- Chen, Y.; Yu, J.; Khan, S. Spatial sensitivity analysis of multi-criteria weights in GIS-based land suitability evaluation. Environ. Model. Softw. 2010, 25, 1582–1591. [Google Scholar] [CrossRef]
- Gitau, M.W.; Chaubey, I. Regionalization of SWAT model parameters for use in ungauged watersheds. Water 2010, 2, 849–871. [Google Scholar] [CrossRef]
- Jajarmizadeh, M.; Harun, S.; Abdullah, R.; Salarpour, M. Using soil and water assessment tool for flow simulation and assessment of sensitive parameters applying SUFI-2 algorithm. Casp. J. Appl. Sci. Res. 2012, 2, 37–47. [Google Scholar]
- Worqlul, A.W.; Ayana, E.K.; Maathuis, B.H.P.; MacAlister, C.; Philpot, W.D.; Steenhuis, T.S. Performance of bias corrected MPEG rainfall estimate for rainfall-runoff simulation in the upper Blue Nile Basin, Ethiopia. J. Hydrol. 2018, 556, 1182–1191. [Google Scholar] [CrossRef]
- Worqlul, A.W.; Ayana, E.K.; Yen, H.; Jeong, J.; Steenhuis, T.S. Evaluating hydrologic responses to soil characteristics using SWAT model in a paired-watersheds in the Upper Blue Nile Basin. Catena 2018, 163, 332–341. [Google Scholar] [CrossRef]
- Lenhart, T.; Eckhardt, K.; Fohrer, N.; Frede, H.G. Comparison of two different approaches of sensitivity analysis. Phys. Chem. Earth 2002, 27, 645–654. [Google Scholar] [CrossRef]
- Santhi, C.; Arnold, J.G.; Williams, J.R.; Dugas, W.A.; Srinivasan, R.; Hauck, L.M. Validation of the SWAT model on a large river basin with point and nonpoint sources. JAWRA J. Am. Water Resour. Assoc. 2001, 37, 1169–1188. [Google Scholar] [CrossRef]
- Moriasi, D.N.; Arnold, J.G.; Van Liew, M.W.; Bingner, R.L.; Harmel, R.D.; Veith, T.L. Model evaluation guidelines for systematic quantification of accuracy in watershed simulations. Trans. ASABE 2007, 50, 885–900. [Google Scholar] [CrossRef]
- Krause, P.; Boyle, D.; Bäse, F. Comparison of different efficiency criteria for hydrological model assessment. Adv. Geosci. 2005, 5, 89–97. [Google Scholar] [CrossRef]
- Nash, J.E.; Sutcliffe, J.V. River flow forecasting through conceptual models part I—A discussion of principles. J. Hydrol. 1970, 10, 282–290. [Google Scholar] [CrossRef]
- Merz, R.; Blöschl, G. Regionalization of catchment model parameters. J. Hydrol. 2004, 287, 95–123. [Google Scholar] [CrossRef]
- Food and Agriculture Organization. The Future of our Land: Facing the Challenges, Guidelines for Sustainable Management of Land Resources; Food & Agricultural Organization and United Nations Environment Program: Rome, Italy, 1999. [Google Scholar]
- Food and Agriculture Organization. World Reference Base for Soil Resources 2014 International Soil Classification System for Naming Soils and Creating Legends for Soil Maps; FAO: Rome, Italy, 2014. [Google Scholar]
- Food and Agriculture Organization. A framework for land evaluation. FAO Soils Bull. 1976, 32. [Google Scholar]
- Saaty, T.L. A scaling method for priorities in hierarchical structures. J. Math. Psychol. 1977, 15, 234–281. [Google Scholar] [CrossRef]
- Eastman, J.R. Guide to GIS and Image Processing Volume; Clark University: Worcester, NE, USA, 2001. [Google Scholar]
- Wind, Y.; Saaty, T.L. Marketing applications of the analytic hierarchy process. Manag. Sci. 1980, 26, 641–658. [Google Scholar] [CrossRef]
- Allen, R.G.; Pereira, L.S.; Raes, D.; Smith, M. Crop Evapotranspiration-Guidelines for Computing Crop Water Requirements; FAO Irrigation and drainage paper 56; FAO: Rome, Italy, 1998; Volume 300, p. D05109. [Google Scholar]
- Food and Agriculture Organization. FAOSTAT: FAO Statistical Databases; FAO: Rome, Italy, 2001. [Google Scholar]
- Smith, M. The application of climatic data for planning and management of sustainable rain fed and irrigated crop production. Agric. Forest Meteorol. 2000, 103, 99–108. [Google Scholar] [CrossRef]


| Class | Index (I) | Sensitivity |
|---|---|---|
| I | I = 1 | Very high |
| II | 0.2 < I < 1 | High |
| III | 0.05 < I < 0.2 | Medium |
| IV | 0.00 < I < 0.05 | Small to negligible |
| Performance Rating | NS | PBIAS |
|---|---|---|
| Very good | 0.75 < NS < 1.0 | PBIAS < ±10 |
| Good | 0.65 < NS < 0.75 | ±10 < PBIAS < ±15 |
| Satisfactory | 0.5 < NS < 0.65 | ±15 < PBIAS < ±25 |
| Unsatisfactory | NS < 0.5 | PBIAS > ±25 |
| Factor | Specific Factor | Factor Derivation | Sources |
|---|---|---|---|
| Slope factor | Slope | Digital Elevation Model(DEM) | http://earthexplorer.usgs.gov/ |
| Soil factor | Soil drainage | Soil map | [26,27] |
| Soil depth | Soil physical characteristics | [26,27] | |
| Soil texture | Soil physical characteristics | [26,27] | |
| Land use | Land use | Land use Land cover map | Ministry of Water Irrigation and Electricity MoWIE |
| Water | River proximity | DEM and River network | http://earthexplorer.usgs.gov/ and MoWIE |
| Suitability Order (S and N) | Suitability Class | Description |
|---|---|---|
| S | S1 (highly suitable) | Land having no significant limitation to sustained application of a given use. |
| S | S2 (moderately suitable) | Land having limitation which in aggregate are moderately severe for a sustained application of a given use |
| S | S3 (marginally suitable) | Land having limitation which in aggregate are severe for a sustained application of a given use and will reduce productivity or benefits. |
| N | N1 or S (temporarily not suitable) | Land having limitations which may be surmountable in time, but which cannot be corrected with existing knowledge at currently acceptable cost |
| N | N2 (permanently not suitable) | Land having limitations which appear as severe as to preclude any possibilities of successful sustained use of the land of a given land use. |
| Soil Code | Soil Type | Texture | Depth (cm) | Drainage | Irrigation Suitability | Area | |
|---|---|---|---|---|---|---|---|
| km2 | % | ||||||
| FLe | EutricFluvisols | C | 125 | P | S2 | 219 | 18 |
| ALh | HaplicAlisols | C | 125 | P | S2 | 594 | 49 |
| CMe | Eutric Cambisols | C | 200 | W | S1 | 3 | 0.2 |
| LPe | Eutric Leptosols | CL | 200 | W | S2 | 21 | 1.8 |
| LPd | DystricLeptosols | C | 30 | W | N | 3 | 0.2 |
| LPq | Lithic Leptosols | C | 10 | W | N | 106 | 8.8 |
| NTh | HaplicNitisols | C | 150 | W | S1 | 249 | 21 |
| VRe | EutricVertisols | C | 125 | I | S2 | 5 | 0.4 |
| UR | Urban | N | 2 | 0.2 | |||
| Total | 1202 | 100 | |||||
| Intensity of Importance | Definition | Explanation |
|---|---|---|
| 1 | Equal importance | Two factors contribute equally to the objective. |
| 3 | Somewhat more important | Experience and judgment slightly favorable one over the other. |
| 5 | Much more important | Experience and judgment strongly favorable one over the other. |
| 7 | Very much more important | Experience and judgment very strongly favorable one over the other. Its importance is demonstrated in practice |
| 9 | Absolutely more important | The evidence favoring one over the other is of the highest possible validity. |
| 2, 4, 6, 8 | Intermediate values | When compromise is needed. |
| Factors | Slope | Soil Drainage | Soil Depth | Soil Texture | Land Use | River Proximity |
|---|---|---|---|---|---|---|
| Slope | 1 | 3 | 3 | 3 | 7 | 7 |
| Soil drainage | 1/3 | 1 | 3 | 3 | 5 | 5 |
| Soil depth | 1/3 | 1/3 | 1 | 3 | 3 | 3 |
| Soil texture | 1/3 | 1/3 | 1/3 | 1 | 3 | 3 |
| Land use | 1/7 | 1/5 | 1/3 | 1/3 | 1 | 3 |
| River proximity | 1/7 | 1/5 | 1/3 | 1/3 | 1/3 | 1 |
| Rank | Parameter | Minimum Value | Maximum Value | Initial | Fitted | |
|---|---|---|---|---|---|---|
| 1 | SOL_Z | Depth from soil surface to bottom of layer. | 0 | 3500 | 1700 | 170 |
| 2 | CN2 | Soil Conservation Services(SCS) runoff curve number | 35 | 98 | 60 | 78 |
| 3 | CH_K2 | Effective hydraulic conductivity channel | −0.01 | 500 | 200 | 327 |
| 4 | CANMX | Maximum canopy storage | 0 | 100 | 65 | 0.8 |
| 5 | GW_DELAY | Groundwater delay | 0 | 500 | 200 | 171 |
| 6 | ALPHA_BNK | Baseflow alpha factor for bank storage. | 0 | 1 | 0.6 | 0.3 |
| 7 | CH_N2 | Manning’s “n” value for the main channel. | −0.01 | 0.3 | 0.18 | 0.16 |
| 8 | REVAPMN | Revap threshold shallow aquifer wat. depth | 0 | 500 | 200 | 21 |
| Period | Model Performance Measures | ||
|---|---|---|---|
| R2 | NS | PBIAS (%) | |
| Calibration | 0.92 | 0.87 | 0.2 |
| Validation | 0.77 | 0.68 | −1.4 |
| Month | River Catchments Mean Monthly Stream Flow (m3/s) | ||||||
|---|---|---|---|---|---|---|---|
| Arara | Debolah | Geray | Gunagun | Guysa | Silala | Tikurwuha | |
| January | 0.33 | 0.49 | 0.5 | 0.58 | 0.27 | 0.55 | 0.23 |
| February | 0.25 | 0.41 | 0.4 | 0.46 | 0.22 | 0.44 | 0.19 |
| March | 0.2 | 0.34 | 0.32 | 0.36 | 0.19 | 0.36 | 0.15 |
| April | 0.2 | 0.3 | 0.27 | 0.35 | 0.16 | 0.33 | 0.14 |
| May | 0.23 | 0.29 | 0.29 | 0.38 | 0.2 | 0.33 | 0.16 |
| June | 0.42 | 0.96 | 1.1 | 0.63 | 0.74 | 0.85 | 0.35 |
| July | 0.99 | 1.98 | 2.39 | 1.34 | 1.42 | 1.92 | 0.68 |
| August | 1.51 | 2.47 | 2.27 | 2.23 | 1.34 | 2.61 | 0.92 |
| September | 0.89 | 1.55 | 1.79 | 1.55 | 1.28 | 1.64 | 0.63 |
| October | 0.66 | 0.97 | 1.03 | 1.14 | 0.62 | 1.11 | 0.46 |
| November | 0.5 | 0.74 | 0.76 | 0.88 | 0.39 | 0.83 | 0.35 |
| December | 0.42 | 0.61 | 0.6 | 0.74 | 0.32 | 0.69 | 0.29 |
| Annual | 6.6 | 11.1 | 11.7 | 10.6 | 7.2 | 11.65 | 4.55 |
| Factors | Weight (W) |
|---|---|
| Slope | 0.39 |
| Soil drainage | 0.25 |
| Soil depth | 0.15 |
| Soil texture | 0.11 |
| Land use | 0.06 |
| River proximity | 0.04 |
| CR | 0.067 |
| No | River Catchment | Command Area (km2) |
|---|---|---|
| 1 | Birr and Tikurwuha | 78 |
| 2 | Gunagun and Leza | 177 |
| 3 | Lah, Geray, Arara, Debolah, Guysa, and Silala | 201 |
| Total | 456 |
| River Name | Monthly Stream Flow and Gross Irrigation Demand (m3 s−1) | ||||||
|---|---|---|---|---|---|---|---|
| January | February | March | April | May | |||
| 1 | Birr and Tikurwuha | Available flow | 1.45 | 0.70 | 0.65 | 0.63 | 1.79 |
| Gross Irrigation Requirement | 1.15 | 2.90 | 4.47 | 4.77 | 2.71 | ||
| 2 | Gunagun and Leza | Available flow | 1.2 | 1.1 | 0.9 | 0.8 | 0.9 |
| Gross Irrigation Requirement | 2.60 | 6.54 | 10.08 | 10.76 | 6.12 | ||
| 3 | Lah, Geray, Arara, Debolah, Guysa Silala | Available flow | 4.27 | 3.75 | 3.40 | 3.30 | 3.98 |
| Gross Irrigation Requirement | 3.52 | 7.46 | 11.36 | 12.16 | 6.17 | ||
| River Catchment | Crop Type | Irrigation Potential (km2) | |
|---|---|---|---|
| 1 | Birr and Tikurwuha | Cabbage, onion and tomato | 5.2 |
| 2 | Gunagun and Leza | Cabbage, onion and tomato | 6.5 |
| 3 | Lah, Geray, Arara, Debolah, Guysa and Silala | Cabbage, onion and tomato | 27.2 |
| Total | 38.9 |
© 2019 by the authors. Licensee MDPI, Basel, Switzerland. This article is an open access article distributed under the terms and conditions of the Creative Commons Attribution (CC BY) license (http://creativecommons.org/licenses/by/4.0/).
Share and Cite
Nigussie, G.; Moges, M.A.; Moges, M.M.; Steenhuis, T.S. Assessment of Suitable Land for Surface Irrigation in Ungauged Catchments: Blue Nile Basin, Ethiopia. Water 2019, 11, 1465. https://doi.org/10.3390/w11071465
Nigussie G, Moges MA, Moges MM, Steenhuis TS. Assessment of Suitable Land for Surface Irrigation in Ungauged Catchments: Blue Nile Basin, Ethiopia. Water. 2019; 11(7):1465. https://doi.org/10.3390/w11071465
Chicago/Turabian StyleNigussie, Getenet, Mamaru A. Moges, Michael M. Moges, and Tammo S. Steenhuis. 2019. "Assessment of Suitable Land for Surface Irrigation in Ungauged Catchments: Blue Nile Basin, Ethiopia" Water 11, no. 7: 1465. https://doi.org/10.3390/w11071465
APA StyleNigussie, G., Moges, M. A., Moges, M. M., & Steenhuis, T. S. (2019). Assessment of Suitable Land for Surface Irrigation in Ungauged Catchments: Blue Nile Basin, Ethiopia. Water, 11(7), 1465. https://doi.org/10.3390/w11071465