Assessment of the Impact of Forestry and Settlement-Forest Use of the Catchments on the Parameters of Surface Water Quality: Case Studies for Chechło Reservoir Catchment, Southern Poland


Abstract
1. Introduction
2. Materials and Methods
2.1. Descprition of the Study Catchments
2.2. Sampling and Analytical Methods
2.3. Data Analysis
2.3.1. Basic Data Analysis
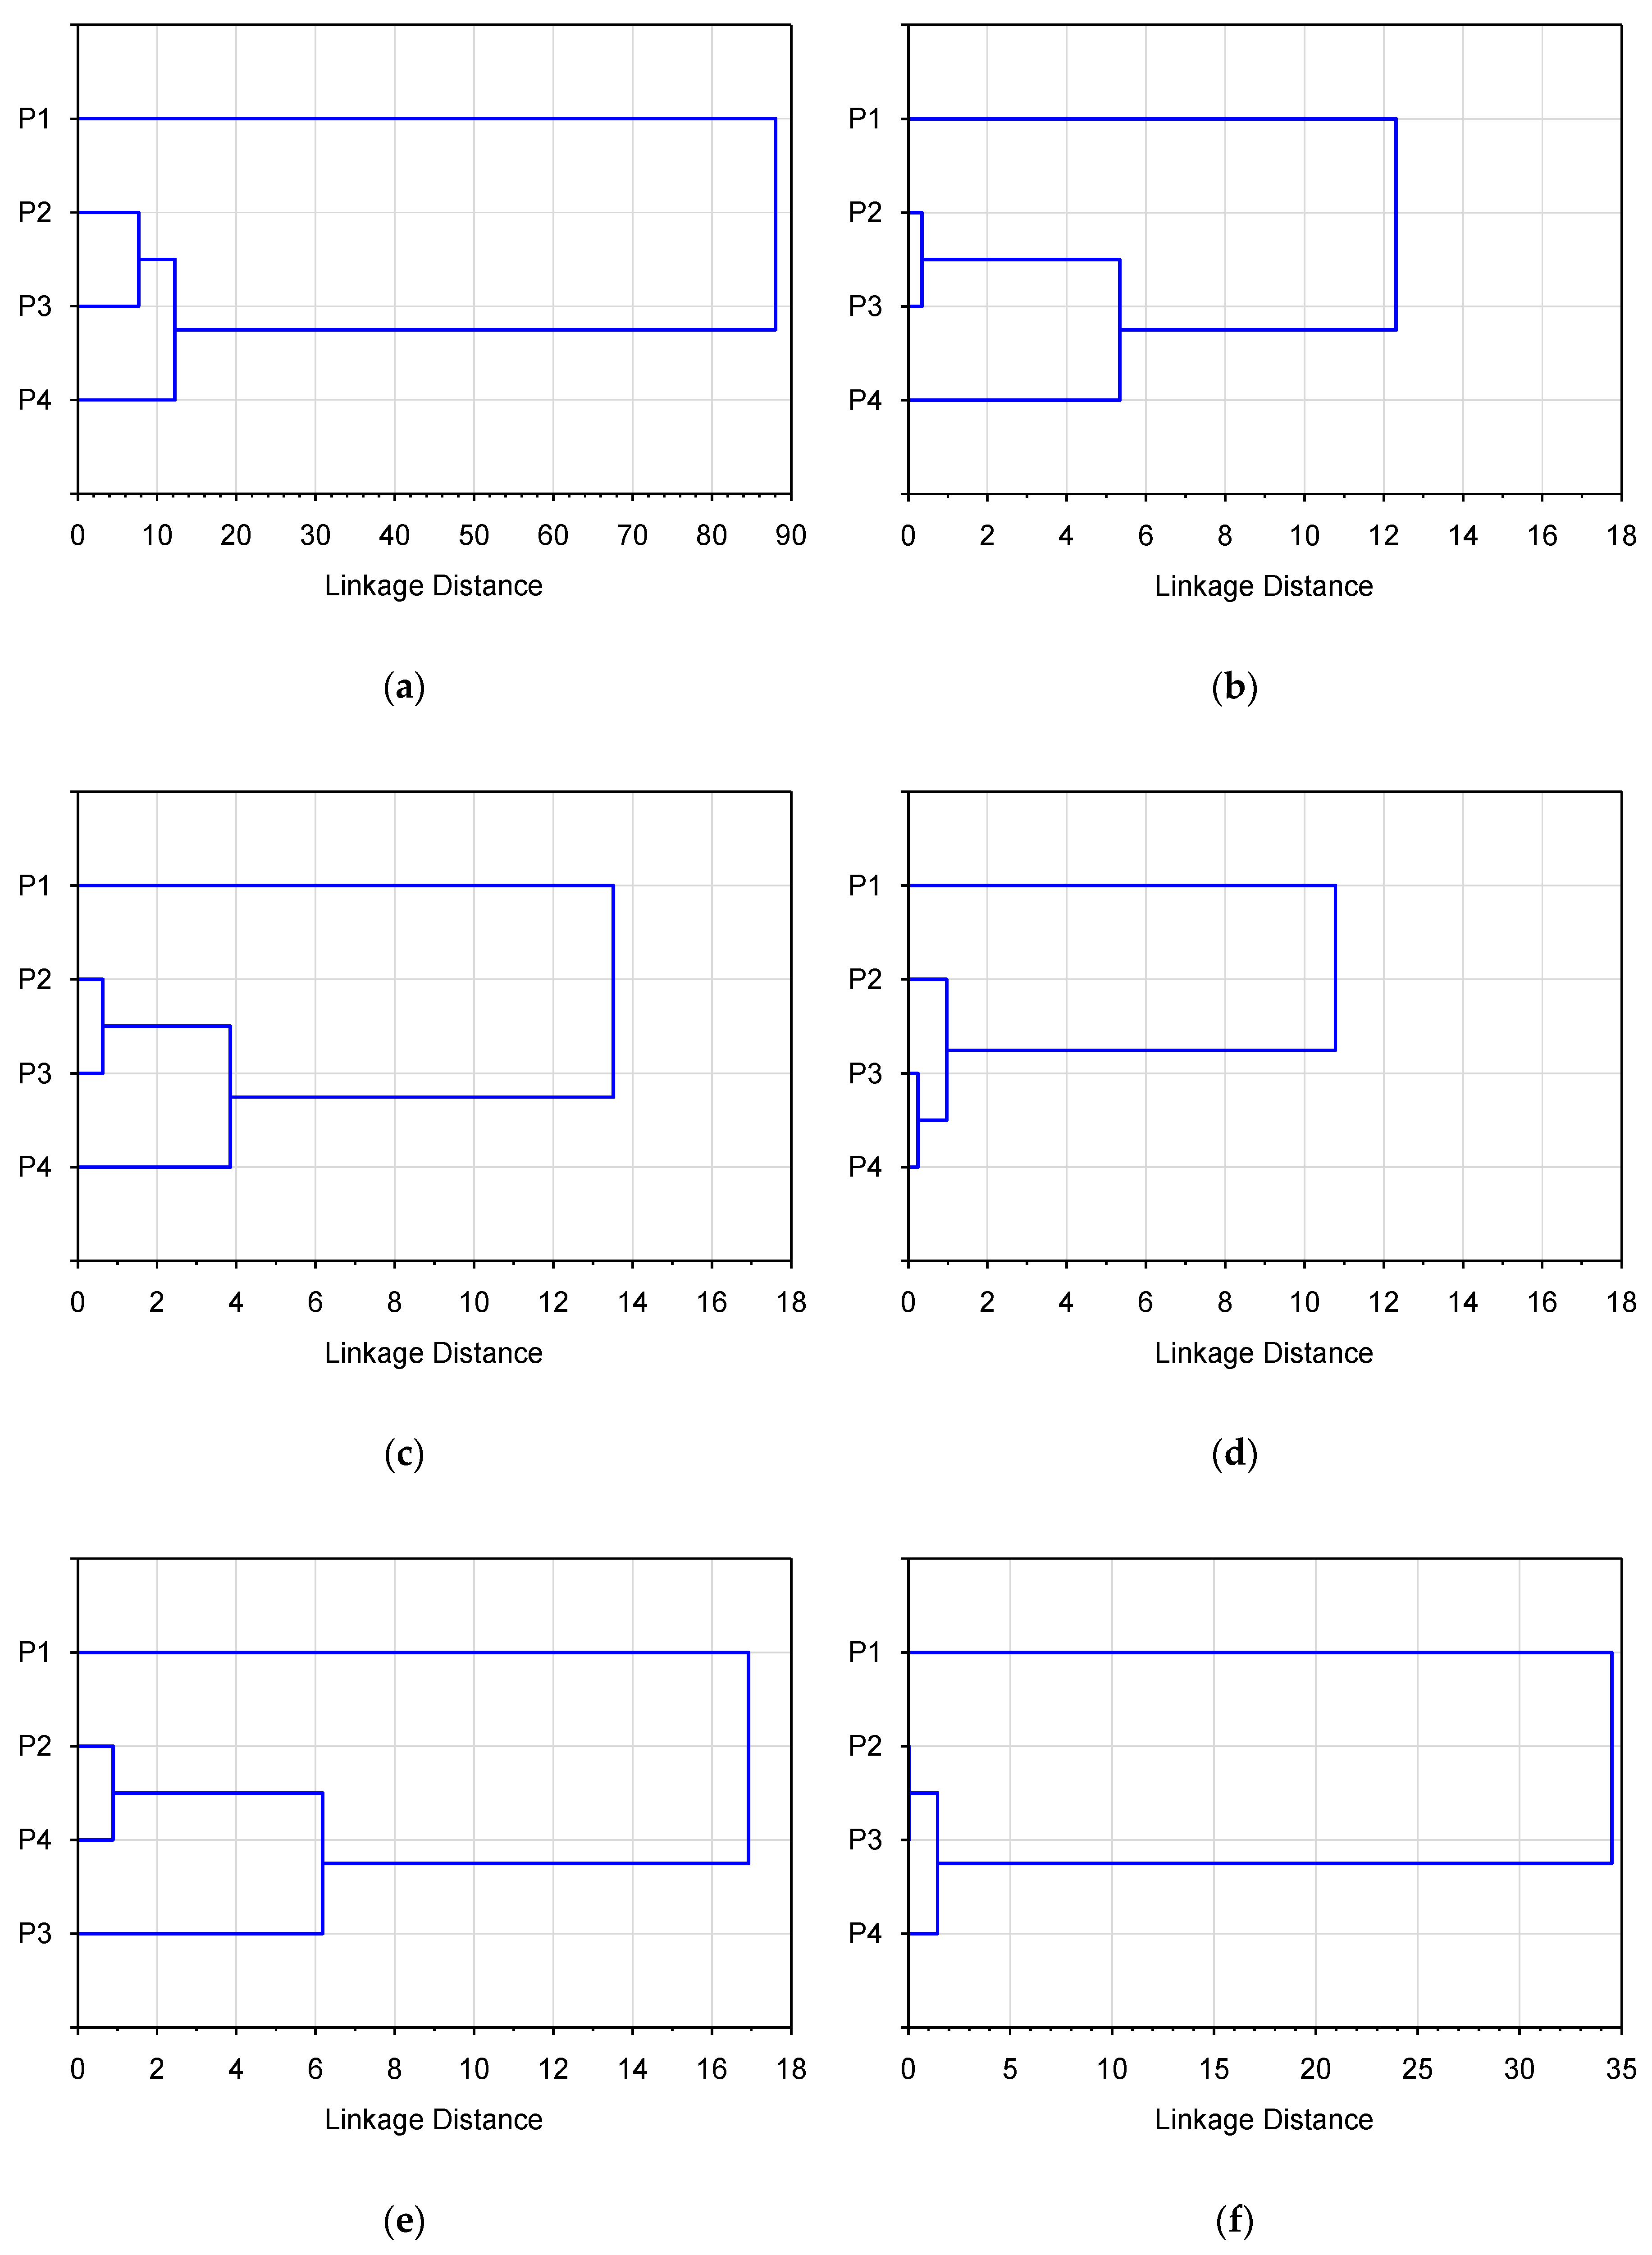
2.3.2. Cluster Analysis
- all examined physicochemical indicators (mentioned below),
- physical and acidification indicators (temperature, TSS, pH),
- oxygen indicators (DO, BOD5, CODCr),
- phosphorus indicators (TP, PO43−),
- nitrogen indicators (Org–N, N–NH4+, N–NO2−, N–NO3−),
- salinity indicators (SO42−, Cl−, Ca2+, Mg2+, Na+, K+).
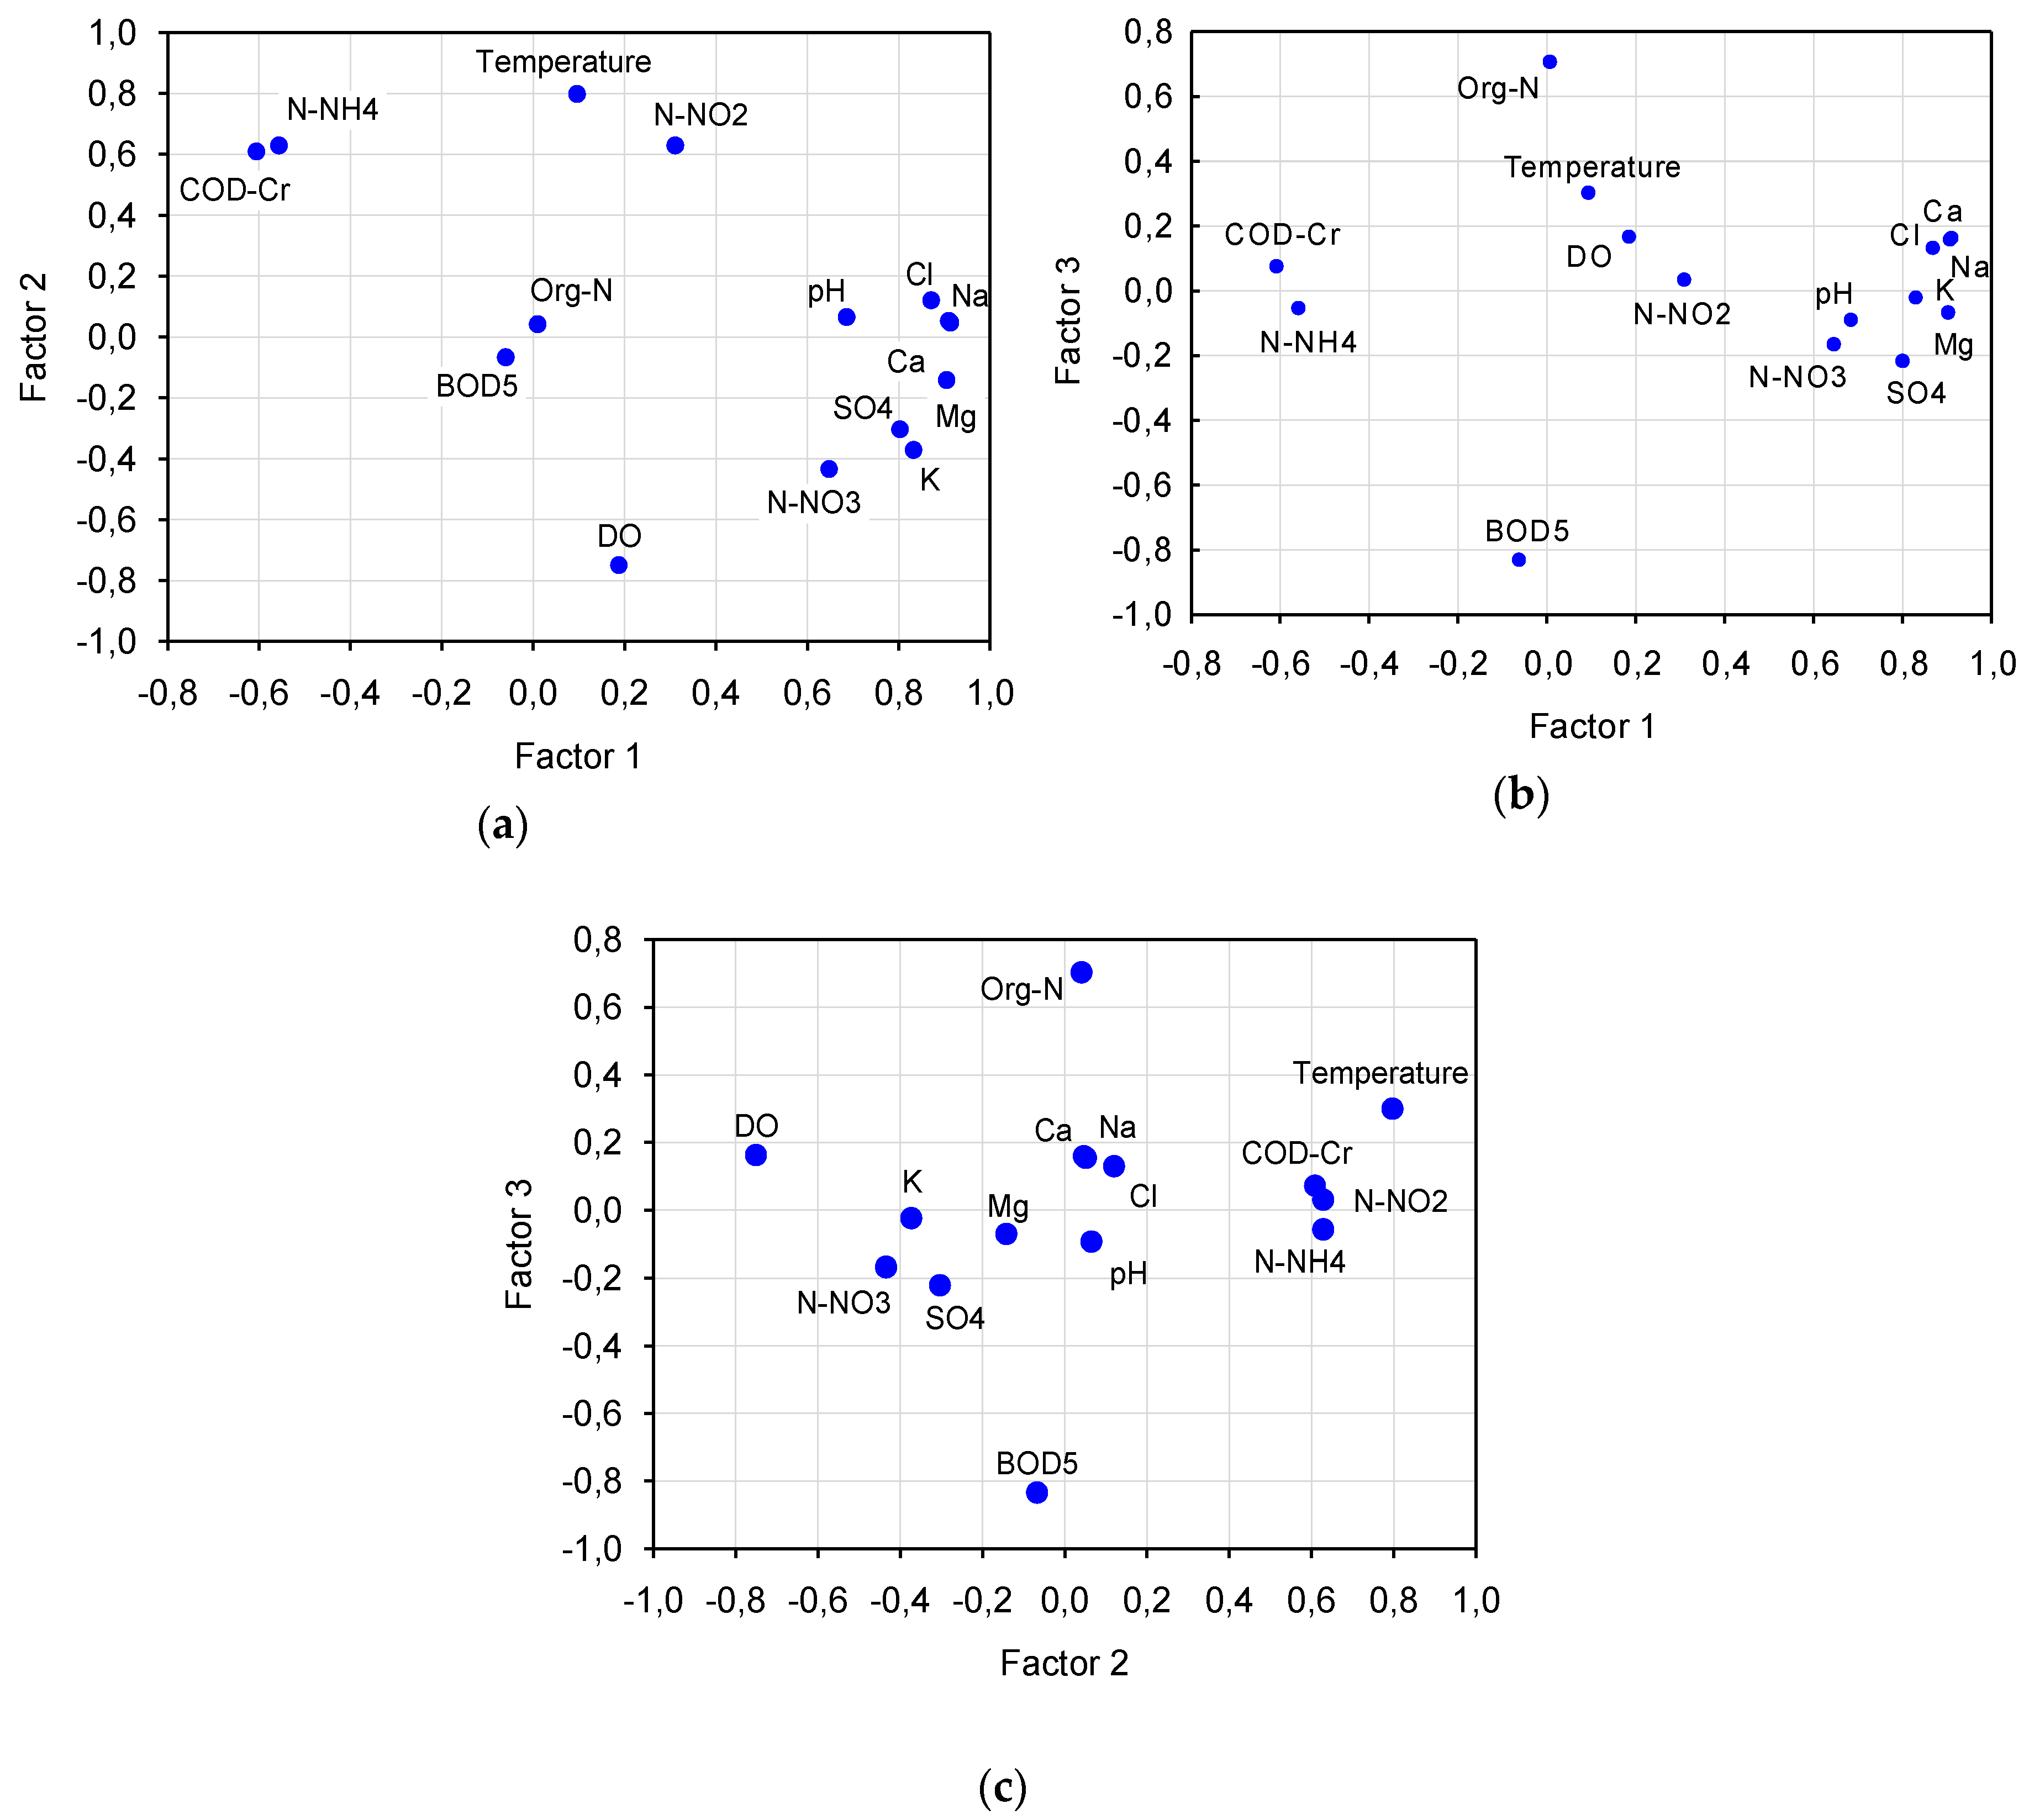
2.3.3. Factor Analysis
3. Results and Discussion
4. Conclusions
Author Contributions
Funding
Acknowledgments
Conflicts of Interest
References
- Wardas, M.; Aleksander-Kwaterczak, U.; Jusik, S.; Hryc, B.; Zgoła, T.; Sztuka, M.; Kaczmarska, M.; Mazurek, M. An attempt to assess the impast of anthropopressure on the ecological state of urbanized watercourses of Krakow conurbation and the difficulties encountered. J. Elementol. 2010, 15, 725–743. [Google Scholar] [CrossRef]
- Bogdał, A.; Kowalik, T.; Ostrowski, K.; Skowron, P. Seasonal variability of physicochemical parameters of water quality on length of Uszwica river. J. Ecol. Eng. 2016, 17, 161–170. [Google Scholar] [CrossRef]
- Bulut, V.N.; Bayram, A.; Gundogdu, A.; Soylak, M.; Tufekci, M. Assessment of water quality parameters in the stream Galyan, Trabzon, Turkey. Environ. Monit. Assess. 2010, 165, 1–13. [Google Scholar] [CrossRef] [PubMed]
- Kanownik, W.; Kowalik, T.; Bogdał, A.; Ostrowski, K. Quality Categories of Stream Water Included in a Small Retention Program. Pol. J. Environ. Stud. 2013, 22, 159–165. [Google Scholar]
- Kiryluk, A.; Leszczyński, J.; Łukowski, A.; Miłaszewski, R.; Piekutin, J.; SIemieniuk, A.; Skorbiłowicz, E.; Skorbiłowicz, M.; Szczykowska, J.; Wiater, J.; et al. Źródła zanieczyszczeń wód powierzchniowych i wybrane metody ich oczyszczania. Budownictwo i Inżynieria Środowiska 2014, 5, 49–57. (In Polish) [Google Scholar]
- Liu, X.; Li, G.; Liu, Z.; Guo, W.; Gao, N. Water pollution characteristics and assessment of lower reaches in Haihe River basin. Procedia Environ. Sci. 2010, 2, 199–206. [Google Scholar] [CrossRef]
- Al-Shami, S.A.; Rawi, C.S.M.; Ahmad, A.H.; Hamid, S.A.; Nor, S.A.M. Influence of agricultural, industrial, and anthropogenic stresses on the distribution and diversity of macro invertebrates in Juru River basin, Penang, Malaysia. Ecotoxicol. Environ. Saf. 2011, 74, 1195–1202. [Google Scholar] [CrossRef]
- Policht-Latawiec, A.; Kapica, A. Influence of Hard Coal Mine on Water Quality in the Vistula River. Annu. Set Environ. Prot. Rocznik Ochrona Środowiska 2013, 15, 2640–2651. (In Polish) [Google Scholar]
- Mrozińska, N.; Glińska-Lewczuk, K.; Burandt, P.; Kobus, S.; Gotkiewicz, W.; Szymańska, M.; Bąkowska, M.; Obolewski, K. Water Quality as an Indicator of Stream Restoration Effects—A Case Study of the Kwacza River Restoration Project. Water 2018, 10, 1249. [Google Scholar] [CrossRef]
- Bahar, M.M.; Ohmori, H.; Yamamuro, M. Relationship between river water quality and land use in a small river basin running through the urbanizing area of Central Japan. Limnology 2008, 9, 19–26. [Google Scholar] [CrossRef]
- Bogdał, A.; Ostrowski, K. Loads of selected components supplied with precipitation and flowing away from the area of two small catchments with diversified use. Acta Sci. Pol. Formatio Circumiectus 2009, 8, 35–45. [Google Scholar]
- Lai, Y.C.; Tu, Y.T.; Yang, C.P.; Surampalli, R.Y.; Kao, C.M. Development of a water quality modeling system for river pollution index and suspended solid loading evaluation. J. Hydrol. 2013, 478, 89–101. [Google Scholar] [CrossRef]
- Hutchins, M.G. What impact might mitigation of diffuse nitrate pollution have on river water quality in a rural catchment? J. Environ. Manag. 2012, 109, 19–26. [Google Scholar] [CrossRef] [PubMed]
- Mouri, G.; Shinoda, S.; Oki, T. Assessing environmental improvement options from a water quality perspective for an urbane rural catchment. Environ. Model. Softw. 2012, 32, 16–26. [Google Scholar] [CrossRef]
- Bakarat, A.; El Baghdadi, M.; Meddah, R.; Rais, J.; Nadem, S.; Afdali, M. Evaluation of water quality in open channels flowing through Beni-Mellal City (Morocco). J. Water Land Dev. 2013, 19, 3–11. [Google Scholar] [CrossRef]
- Kowalik, T.; Bogdał, A.; Borek, Ł.; Kogut, A. The effect of treated sewage outflow from a modernized sewage treatment plant on water quality on the Breń river. J. Ecol. Eng. 2015, 16, 96–102. [Google Scholar] [CrossRef]
- Sakinatu, I.; Muhammad, A.A. Impact of soil erosion and degradation on water quality: A review. Geol. Ecol. Landsc. 2017, 1, 1–11. [Google Scholar] [CrossRef]
- Halecki, W.; Kruk, E.; Ryczek, M. Estimations of nitrate nitrogen, total phosphorus flux and suspended sediment concentration (SSC) as indicators of surface-erosion processes using an ANN (Artificial Neural Network) based on geomorphological parameters in mountainous catchments. Ecol. Indic. 2018, 91, 461–469. [Google Scholar] [CrossRef]
- Miller, J.D.; Schoonover, J.E.; Williard, K.W.J.; Hwang, C.R. Whole catchment land cover effects on water quality in the Lower Kaskaskia River Watershed. Water Air Soil Pollut. 2011, 221, 337–350. [Google Scholar] [CrossRef]
- Tu, J. Spatially varying relationships between land use and water quality across an urbanization gradient explored by geographically weighted regression. Appl. Geogr. 2011, 31, 376–392. [Google Scholar] [CrossRef]
- Kowalik, T.; Kanownik, W.; Bogdał, A.; Policht-Latawiec, A. Wpływ zmian użytkowania zlewni wyżynnej na kształtowanie jakości wody powierzchniowej. Rocznik Ochrona Środowiska 2014, 16, 223–238. (In Polish) [Google Scholar]
- Misztal, A.; Kuczera, M. Impact of land use method in a catchments area on the dynamics of the nitrogen compounds in the outflowing water. Ecol. Chem. Eng. 2010, 17, 642–649. [Google Scholar]
- Kanownik, W.; Kowalik, T. Variability of Water Resources Flowing Away from Small Agricultural Catchment. Pol. J. Environ. Stud. 2010, 19, 65–71. [Google Scholar]
- Kopacz, M.; Twardy, S. Zmiany użytkowania ziemi z zlewni Górnego Dunajca w aspekcie wybranych parametrów jakościowych wód powierzchniowych. Woda-Środowisko-Obszary Wiejskie 2006, 6, 191–202. (In Polish) [Google Scholar]
- Gülbaz, S.; Kazezyilmaz-Alhan, C.M. Impact of land use/cover changes on water quality and quantity in a calibrated hydrodynamic model. In Proceedings of the 10th International Congress on Advances in Civil Engineering, Middle East Technical University, Ankara, Turkey, 17–19 October 2012. [Google Scholar]
- Bogdał, A.; Kowalik, T. Variability of values of physicochemical water quality indices along the length of the Iwoniczanka stream. J. Ecol. Eng. 2015, 16, 168–175. [Google Scholar] [CrossRef][Green Version]
- Zhou, T.; Wu, J.; Peng, S. Assessing the effects of landscape pattern on river water quality at multiple scales: A case study of the Dongjiang River watershed, China. Ecol. Indic. 2012, 23, 166–170. [Google Scholar] [CrossRef]
- Kändler, M.; Blechinger, K.; Seidler, C.; Pavlů, V.; Šanda, M.; Dostál, T.; Krása, J.; Vitvar, T.; Štich, M. Impact of land use on water quality in the upper Nisa catchment in the Czech Republic and in Germany. Sci. Total Environ. 2017, 586, 1316–1325. [Google Scholar] [CrossRef]
- Kowalik, T.; Bogdał, A.; Kanownik, W.; Ostrowski, K.; Rajda, W. Quality and Functional Values of Waters Flowing away from Catchments of Planned Small Retention Storage Reservoirs in the Beskid Makowski and Żywiecki Mts; The University of Agriculture in Krakow: Krakow, Poland, 2010. [Google Scholar]
- Kondracki, J. Geografia Regionalna Polski; Wydawnictwo Naukowe PWN: Warszawa, Poland, 2011; ISBN 9788301160227. [Google Scholar]
- Directive 2000/60/EC of the European Parliament and of the Council Establishing a Framework for Community Action in the Field of Water Police. Available online: https://eur-lex.europa.eu/resource.html?uri=cellar:5c835afb-2ec6-4577-bdf8-756d3d694eeb.0004.02/DOC_1&format=PDF (accessed on 7 May 2019).
- Chełmicki, W. Woda: Zasoby, Degradacja, Ochrona; PWN: Warszawa, Poland, 2019; ISBN 9788301135577. (In Polish) [Google Scholar]
- Rao, A.R.; Srinivas, V.V. Regionalization of watersheds by hybrid-cluster analysis. J. Hydrol. 2006, 318, 37–56. [Google Scholar] [CrossRef]
- Cupak, A. Initial results of nonhierarchical cluster methods use for low flow grouping. J. Ecol. Eng. 2017, 18, 44–50. [Google Scholar] [CrossRef]
- Stanisz, A. Przystępny Kurs Statystyki z Zastosowaniem STATISTICA PL na Przykładach z Medycyny. Analizy Wielowymiarowe; StatSoft: Kraków, Poland, 2007; Volume 3. (In Polish) [Google Scholar]
- Brzeziński, J. Wielozmiennowe Modele Matematyczne w Badaniach Psychologicznych; PWN: Warszawa, Poland, 1987. (In Polish) [Google Scholar]
- Cupak, A. Regionalization of catchments with use hierarchical cluster analysis methods. Teka Komisji Ochrony i Kształtowania Środowiska Przyrodniczego 2013, 10, 5–13. [Google Scholar]
- Cupak, A.; Wałęga, A.; Michalec, B. Cluster analysis in determination of hydrologically homogeneous regions with low flow. Acta Sci. Pol. Formatio Circumiectus 2017, 16, 53–63. [Google Scholar] [CrossRef]
- Yu, S.; Shang, J.; Zhao, J.; Guo, H. Factor analysis and dynamics of water quality of the Songhua River, Northeast China. Wate Air Soil Pollut. 2003, 144, 159–169. [Google Scholar] [CrossRef]
- Pekey, H.; Karakaş, D.; Bakoglu, M. Source apportionment of trace metals in surface waters of a polluted stream using multivariate statistical analyses. Mar. Pollut. Bull. 2004, 49, 809–818. [Google Scholar] [CrossRef]
- Zhang, C.; Wu, L.; Luo, Y.; Zhang, H.; Christie, P. Identifying sources of soil inorganic pollutants on a regional scale using a multivariate statistical approach: Role of pollutant migration and soil physicochemical properties. Environ. Pollut. 2008, 151, 470–476. [Google Scholar] [CrossRef] [PubMed]
- Iliopoulou, T.; Aguilar, C.; Arheimer, B.; Bermúdez, M.; Bezak, N.; Ficchì, A.; Koutsoyiannis, D.; Parajka, J.; Polo, M.J.; Thirel, G.; et al. A large sample analysis of European rivers on seasonal river flow correlation and its physical drivers. Hydrol. Earth Syst. Sci. 2019, 23, 73–919. [Google Scholar] [CrossRef]
- Wyżga, B.; Kundzewicz, Z.W.; Ruiz-Villanueva, V.; Zawiejska, J. Flood Generation Mechanisms and Changes in Principal Drivers. In Flood Risk in the Upper Vistula Basin, GeoPlanet: Earth and Planetary Sciences; Springer: Berlin, Germany, 2016. [Google Scholar]
- Maidment, D.R. Handbook of Hydrology; McGraw-Hill, Inc.: New York, NY, USA, 1993. [Google Scholar]
- Hume, P.E. Adapting to climate change: Is there scope for ecological Management in the face of global threat. J. Appl. Ecol. 2005, 42, 784–794. [Google Scholar] [CrossRef]
- Moreno-Mateos, D.; Comín, F.A.; Pedrocchi, C.; Causapé, J. Effect of Wetlands on water quality of an agricultural catchment in a semi-arid area under land use transformation. Wetlands 2009, 29, 1104–1113. [Google Scholar] [CrossRef]
- Wałęga, A.; Radecki-Pawlik, A.; Kaczor, G. Naturalne Sposoby Zagospodarowania wód Opadowych; The University of Agriculture in Krakow: Krakow, Poland, 2013. (In Polish) [Google Scholar]
- Hua, A.K. Land Use Land Cover Changes in Detection of Water Quality: A Study Based on Remote Sensing and Multivariate Statistics. J. Environ. Public Health 2017, 2017, 7515130. [Google Scholar] [CrossRef]
- Williams, T.M.; Amatya, D.M.; Hitchcock, D.R.; Edwards, A.E. Streamflow and nutrients from a Karst watershed with a downstream embayment: Chapel Branch Creek. J. Hydrol. Eng. 2014, 19, 428–438. [Google Scholar] [CrossRef]
- Muwamba, A.; Amatya, D.M.; Trettin, C.C.; Glover, J.B. Comparing nutrient export from first, second and third order watersheds in the South Carolina Atlantic coastal plain. In Headwaters to Estuaries: Advances in Watershed Science and Management, Proceedings of the Fifth Interagency Conference on Research in the Watersheds, Asheville, NC, USA, 2–5 March 2015; U.S. Department of Agriculture Forest Service, Southern Research Station: Asheville, NC, USA, 2015; pp. 82–88. [Google Scholar]
- Singh, K.P.; Malik, A.; Mohan, D.; Sinha, S. Multivariate statistical techniques for the evaluation of spatial and temporal variations in water quality of Gomti River (India)—A case study. Water Res. 2004, 38, 3980–3992. [Google Scholar] [CrossRef]
- Sotomayor, G.; Hampel, H.; Vázquez, R.F. Water quality assessment with emphasis in parameter optimization using pattern recognition methods and genetic algorithm. Water Res. 2018, 130, 353–362. [Google Scholar] [CrossRef]
- Rodríguez-Romero, A.J.; Rico-Sánchez, A.E.; Mendoza-Martínez, E.; Gómez-Ruiz, A.; Sedeño-Díaz, J.E.; López-López, E. Impact of Changes of Land Use on Water Quality, from Tropical Forest to Anthropogenic Occupation: A Multivariate Approach. Water 2018, 10, 1518. [Google Scholar] [CrossRef]
- Turner, W.R.; Brandon, K.; Brooks, T.M.; Costanza, R.; da Fonseca, G.A.B.; Portela, R. Global Conservation of Biodiversity and Ecosystem Services. BioScience 2007, 57, 868–873. [Google Scholar] [CrossRef]
- Zhao, J.; Lin, L.; Yang, K.; Liu, Q.; Qian, G. Influences of land use on water quality in a reticular river network area: A case study in Shanghai, China. Landsc. Urban Plan. 2015, 137, 20–29. [Google Scholar] [CrossRef]
- Wan, R.; Cai, S.; Li, H.; Yang, G.; Li, Z.; Nie, X. Inferring land use and land cover impact on stream water quality using a Bayesian hierarchical modeling approach in the Xitiaoxi River Watershed, China. J. Environ. Manag. 2014, 133, 1–11. [Google Scholar] [CrossRef]
- Nilsson, C.; Renöfält, B.M. Linking flow regime and water quality in rivers: A challenge to adaptive catchment management. Ecol. Soc. 2008, 13, 18. [Google Scholar] [CrossRef]
- Zhang, F.; Wang, J.; Wang, X. Recognizing the Relationship between Spatial Patterns in Water Quality and Land-Use/Cover Types: A Case Study of the Jinghe Oasis in Xinjiang, China. Water 2018, 10, 646. [Google Scholar] [CrossRef]
- Kosmowska, A.; Żelazny, M.; Małek, S.; Stańczyk, T. Impact of deforestation on water chemistry in the western Tatras and Beskid Śląski range in the Polish Carpathians. Acta Sci. Pol. Formatio Circumiectus 2018, 18, 89–99. [Google Scholar] [CrossRef]
- Mello, K.; Valente, R.A.; Randhir, T.O.; Dos Santos, A.C.A.; Vettorazzi, C.A. Effects of land use and land cover on water quality of low-order streams in Southeastern Brazil: Watershed versus riparian zone. Catena 2018, 167, 130–138. [Google Scholar] [CrossRef]
- Mello, K.; Valente, R.A.; Randhir, T.O.; Vettorazzi, C.A. Impacts of tropical forest cover on water quality in agricultural watersheds in southeastern Brazil. Ecol. Indic. 2018, 93, 1293–1301. [Google Scholar] [CrossRef]
- Namugize, J.N.; Jewitt, G.; Graham, M. Effects of land use and land cover changes on water quality in the uMngeniriver catchment, South Africa. Phys. Chem. Earth 2018, 105, 247–264. [Google Scholar] [CrossRef]
- Wijesiri, B.; Deilami, K.; Goonetilleke, A. Evaluating the relationship between temporal changes in land use and resulting water quality. Environ. Pollut. 2018, 234, 480–486. [Google Scholar] [CrossRef]
- Selle, B.; Schwientek, M.; Lischeid, G. Understanding processes governing water quality in catchments using principal component scores. J. Hydrol. 2013, 486, 31–38. [Google Scholar] [CrossRef]
- Carey, R.O.; Hochmuth, G.J.; Martinez, C.J.; Boyer, T.H.; Dukes, M.D.; Toor, G.S.; Cisar, J.L. Evaluating nutrient impacts in urban watersheds: Challenges and research opportunities. Environ. Pollut. 2013, 173, 138–149. [Google Scholar] [CrossRef]
- Sojka, M.; Siepak, M.; Zioła, A.; Frankowski, S.; Siepak, J. Application of multivariate statistical techniques to evaluation of water quality in the Mała Wełna River (Western Poland). Environ. Monit. Assess. 2008, 147, 159–170. [Google Scholar] [CrossRef]
- Wąsik, E.; Chmielowski, K.; Operacz, A. PCA as a data mining tools characterizing the work of nitrification reactors in the sewage treatment plant in Trepcza. Acta Scientiarum Polonorum Formatio Circumiectus 2017, 16, 209–222. (In Polish) [Google Scholar] [CrossRef]


| Parameter | Unit | Catchment of | |
|---|---|---|---|
| Chechło River | Młoszówka Stream | ||
| Area | km2 | 32.32 | 8.35 |
| Average length | km | 8.67 | 6.05 |
| Maximum length | km | 9.04 | 7.96 |
| Average width | km | 3.58 | 1.05 |
| Circumference | km | 29.85 | 18.06 |
| Form index | – | 0.40 | 0.13 |
| Elongation index | – | 0.71 | 0.41 |
| Circularity index | – | 0.46 | 0.32 |
| Gravelius index | – | 1.48 | 1.76 |
| Minimum elevation | m a.s.l. | 275.0 | 275.0 |
| Weighted average elevation | m a.s.l. | 300.9 | 347.4 |
| Maximum elevation | m a.s.l. | 418.4 | 419.2 |
| Weighted average land slope | % | 3.5 | 7.5 |
| Average precipitation (1971–2010) | mm | 739 | |
| Average temperature (1971–2010) | °C | 8.3 | |
| Land use | |||
| forest and tree planting | % | 66.7 | 40.2 |
| arable lands | % | 8.5 | 14.8 |
| grassy ecosystems | % | 14.9 | 24.3 |
| Orchards | % | 0.6 | 3.1 |
| areas under standing waters | % | 0.3 | 0.0 |
| built-up areas | % | 6.3 | 15.1 |
| communication areas | % | 2.7 | 2.5 |
| Length of main watercourse | km | 8.330 | 5.398 |
| Length of tributaries | km | 92.068 | 11.064 |
| Total lenght | km | 100.398 | 16.462 |
| Water network density | km⋅km−2 | 3.11 | 1.97 |
| Average slope of the main watercourse | % | 0.5 | 1.2 |
| Lakeity index | % | 0.3 | 0.0 |
| Fragility index | % | 5.1 | 2.4 |
| Flow | |||
| Average annual | m3⋅s−1 | 0.272 | 0.071 |
| Average low | m3⋅s−1 | 0.079 | 0.019 |
| Maximum with average return period (1/year) 200 | m3⋅s−1 | 38.61 | 10.10 |
| 100 | m3⋅s−1 | 33.00 | 8.63 |
| 50 | m3⋅s−1 | 27.55 | 7.21 |
| 25 | m3⋅s−1 | 20.53 | 5.37 |
| 10 | m3⋅s−1 | 15.31 | 4.00 |
| 5 | m3⋅s−1 | 10.30 | 2.69 |
| 2 | m3⋅s−1 | 4.22 | 1.11 |
| Parameters | Units | Sampling Location | |||||||||||
|---|---|---|---|---|---|---|---|---|---|---|---|---|---|
| P1 | P2 | P3 | P4 | ||||||||||
| Range | Mean ± SD | CV (%) | Range | Mean ± SD | CV (%) | Range | Mean ± SD | CV (%) | Range | Mean ± SD | CV (%) | ||
| Chla | μg⋅dm−3 | LD 2–11.8 | 5.0 ± 5.8 | 117 | LD–16.2 | 5.1 ± 7.4 | 145 | LD–16.6 | 7.9 ± 7.5 | 95 | LD–4.7 | 1.7 ± 2.3 | 139 |
| Temperature | °C | 0.3–22.5 | 11.4 ± 6.4 | 56 | 0.0–22.6 | 12.3 ± 7.1 | 58 | 0.0–21.3 | 12.1 ± 6.8 | 56 | 0.0–20.9 | 11.6 ± 6.8 | 59 |
| TSS | mg⋅dm−3 | 0.1–8.7 | 3.7 ± 2.0 | 56 | 0.3–5.3 | 2.7 ± 1.7 | 62 | 0.9–10.7 | 2.8 ± 2.4 | 85 | 0.1–4.2 | 1.6 ± 1.2 | 75 |
| pH | pH unit | 7.1–8.1 | 7.7 ± 0.3 | 4 | 6.6–7.7 | 7.3 ± 0.3 | 4 | 6.6–7.7 | 7.2 ± 0.3 | 5 | 6.4–7.6 | 7.1 ± 0.4 | 5 |
| DO | mg O2⋅dm−3 | 7.3–13.5 | 9.7 ± 1.6 | 17 | 5.4–12.3 | 8.3 ± 1.9 | 23 | 2.4–12.0 | 7.8 ± 2.7 | 34 | 2.0–12.8 | 7.9 ± 2.6 | 34 |
| DOsat | % | 73–110 | 89 ± 1 | 13 | 30–115 | 79 ± 115 | 19 | 28–99 | 70 ± 19 | 27 | 23–111 | 73 ± 211 | 29 |
| BOD5 | mg O2⋅dm−3 | 1.0–10.0 | 3.9 ± 2.8 | 73 | 1.0–10.0 | 4.2 ± 3.0 | 71 | 1.0–15.0 | 4.2 ± 3.4 | 80 | 1.2–10.0 | 4.7 ± 2.6 | 55 |
| CODCr | mg O2⋅dm−3 | 1.8–33.1 | 16.4 ± 8.0 | 49 | 25.2–80.0 | 40.6 ± 17.0 | 42 | 16.1–125.2 | 51.1 ± 30.6 | 60 | 25.8–118.0 | 60.4 ± 29.7 | 49 |
| TP | mg⋅dm−3 | 0.10–0.93 | 0.26 ± 0.27 | 105 | 0.04–0.93 | 0.20 ± 0.24 | 117 | 0.03–0.59 | 0.17 ± 0.17 | 97 | 0.04–0.82 | 0.16 ± 0.19 | 123 |
| PO43− | mg⋅dm−3 | LD–0.095 | 0.038 ± 0.027 | 71 | LD–0.080 | 0.020 ± 0.027 | 134 | LD–0.062 | 0.018 ± 0.023 | 124 | LD–0.089 | 0.022 ± 0.028 | 128 |
| TN | mg⋅dm−3 | 1.06–3.82 | 2.42 ± 0.61 | 25 | 0.97–4.92 | 1.97 ± 0.91 | 46 | 1.02–3.76 | 1.80 ± 0.63 | 35 | 1.23–3.74 | 1.93 ± 0.62 | 32 |
| Org–N | mg⋅dm−3 | 0.38–1.74 | 1.06 ± 0.38 | 36 | 0.27–4.11 | 1.10 ± 0.89 | 81 | 0.16–2.97 | 0.82 ± 0.64 | 78 | 0.49–2.95 | 1.05 ± 0.60 | 57 |
| N–NH4+ | mg⋅dm−3 | 0.03–0.40 | 0.19 ± 0.10 | 53 | 0.16–0.90 | 0.48 ± 0.22 | 46 | 0.21–0.95 | 0.48 ± 0.20 | 42 | 0.24–1.33 | 0.60 ± 0.31 | 51 |
| N–NO2− | mg⋅dm−3 | LD–0.029 | 0.014 ± 0.009 | 66 | LD–0.019 | 0.005 ± 0.007 | 142 | LD–0.060 | 0.009 ± 0.016 | 177 | LD–0.065 | 0.008 ± 0.017 | 205 |
| N–NO3− | mg⋅dm−3 | 0.28–2.10 | 1.16 ± 0.46 | 40 | 0.06–1.23 | 0.39 ± 0.36 | 91 | 0.09–1.23 | 0.49 ± 0.38 | 79 | 0.01–1.38 | 0.27 ± 0.34 | 124 |
| DS | mg⋅dm−3 | 360–628 | 432 ± 68 | 16 | 180–296 | 254 ± 35 | 14 | 148–284 | 242 ± 32 | 13 | 142–314 | 251 ± 47 | 19 |
| SO42− | mg⋅dm−3 | 34.8–101.0 | 81.0 ± 18.6 | 23 | 14.8–71.5 | 40.0 ± 15.1 | 38 | 18.1–74.9 | 41.6 ± 17.7 | 42 | 11.9–77.8 | 40.4 ± 19.1 | 47 |
| Cl− | mg⋅dm−3 | 36.0–95.3 | 64.7 ± 13.3 | 21 | 28.6–54.5 | 44.8 ± 7.77 | 17 | 29.6–60.4 | 45.4 ± 8.8 | 19 | 27.7–46.4 | 38.1 ± 5.5 | 15 |
| Ca2+ | mg⋅dm−3 | 54.9–87.4 | 73.4 ± 10.0 | 14 | 19.7–51.2 | 36.8 ± 7.4 | 20 | 17.4–41.4 | 34.0 ± 5.9 | 17 | 16.1–66.9 | 39.0 ± 11.7 | 30 |
| Mg2+ | mg⋅dm−3 | 6.5–10.6 | 8.1 ± 1.0 | 13 | 2.4–5.3 | 4.3 ± 0.7 | 17 | 2.0–5.2 | 4.2 ± 0.8 | 19 | 1.9–5.7 | 4.1 ± 0.9 | 22 |
| Na+ | mg⋅dm−3 | 26.3–45.9 | 32.5 ± 5.6 | 17 | 11.3–25.3 | 20.3 ± 4.0 | 20 | 11.4–28.7 | 20.9 ± 4.4 | 21 | 10.6–20.8 | 15.6 ± 2.8 | 18 |
| K+ | mg⋅dm−3 | 3.2–8.0 | 4.9 ± 1.2 | 25 | 1.2–3.6 | 2.2 ± 0.6 | 27 | 1.1–3.7 | 2.2 ± 0.6 | 28 | 0.6–3.1 | 1.6 ± 0.7 | 41 |
| Parameter | Test Probability Values (p) in Variants | |||||
|---|---|---|---|---|---|---|
| P1–P2 | P1–P3 | P1–P4 | P2–P3 | P2–P4 | P3–P4 | |
| Chla | 0.84 | 0.69 | 0.54 | 0.55 | 0.69 | 0.31 |
| Temperature | 0.68 | 0.71 | 0.84 | 0.87 | 0.81 | 0.87 |
| TSS | 0.35 | 0.06 | 0.05 1 | 0.87 | 0.04 | 0.02 |
| pH | 0.00 | 0.00 | 0.00 | 0.35 | 0.41 | 1.00 |
| DO | 0.09 | 0.10 | 0.07 | 0.84 | 0.57 | 0.94 |
| DOsat | 0.02 | 0.00 | 0.01 | 0.37 | 0.46 | 0.74 |
| BOD5 | 0.81 | 0.68 | 0.20 | 1.00 | 0.46 | 0.46 |
| CODCr | 0.00 | 0.00 | 0.00 | 0.31 | 0.08 | 0.41 |
| TP | 0.12 | 0.12 | 0.01 | 0.84 | 0.54 | 0.84 |
| PO43− | 0.05 | 0.05 | 0.05 | 0.84 | 0.90 | 0.81 |
| TN | 0.00 | 0.00 | 0.01 | 0.41 | 0.90 | 0.39 |
| Org–N | 0.37 | 0.02 | 0.49 | 0.11 | 0.84 | 0.05 |
| N–NH4+ | 0.00 | 0.00 | 0.00 | 0.90 | 0.41 | 0.31 |
| N–NO2− | 0.01 | 0.07 | 0.04 | 0.74 | 1.00 | 0.87 |
| N–NO3− | 0.00 | 0.00 | 0.00 | 0.51 | 0.09 | 0.02 |
| DS | 0.00 | 0.00 | 0.00 | 0.27 | 0.94 | 0.49 |
| SO42− | 0.00 | 0.00 | 0.00 | 0.84 | 0.94 | 0.71 |
| Cl− | 0.00 | 0.00 | 0.00 | 1.00 | 0.01 | 0.02 |
| Ca2+ | 0.00 | 0.00 | 0.00 | 0.24 | 0.71 | 0.23 |
| Mg2+ | 0.00 | 0.00 | 0.00 | 0.94 | 0.31 | 0.39 |
| Na+ | 0.00 | 0.00 | 0.00 | 0.71 | 0.00 | 0.00 |
| K+ | 0.00 | 0.00 | 0.00 | 0.94 | 0.00 | 0.01 |
| Parameters | Temperature | pH | DO | BOD5 | CODCr | PO43− | Org–N | N–NH4+ | N–NO2− | N–NO3− | SO42− | Cl− | Ca2+ | Mg2+ | Na+ | K+ |
|---|---|---|---|---|---|---|---|---|---|---|---|---|---|---|---|---|
| Temperature | 1.000 | 0.142 | −0.564 1 | −0.272 | 0.355 | 0.149 | 0.182 | 0.321 | 0.324 | −0.384 | −0.252 | 0.192 | 0.195 | −0.078 | 0.157 | −0.225 |
| pH | 0.142 | 1.000 | 0.114 | 0.108 | −0.465 | 0.465 | 0.105 | −0.311 | 0.142 | 0.260 | 0.574 | 0.425 | 0.611 | 0.661 | 0.510 | 0.479 |
| DO | −0.564 | 0.114 | 1.000 | −0.101 | −0.530 | −0.291 | −0.003 | −0.420 | −0.192 | 0.348 | 0.370 | 0.095 | 0.155 | 0.262 | 0.193 | 0.364 |
| BOD5 | −0.272 | 0.108 | −0.101 | 1.000 | −0.017 | 0.096 | −0.264 | −0.025 | −0.136 | 0.124 | 0.107 | −0.204 | −0.146 | 0.046 | −0.207 | −0.011 |
| CODCr | 0.355 | −0.465 | −0.530 | −0.017 | 1.000 | −0.166 | 0.140 | 0.688 | 0.258 | −0.554 | −0.700 | −0.456 | −0.429 | −0.605 | −0.545 | −0.667 |
| PO43− | 0.149 | 0.465 | −0.291 | 0.096 | −0.166 | 1.000 | −0.098 | −0.017 | 0.258 | 0.152 | 0.253 | 0.404 | 0.346 | 0.414 | 0.348 | 0.190 |
| Org–N | 0.182 | 0.105 | −0.003 | −0.264 | 0.140 | −0.098 | 1.000 | −0.039 | 0.049 | −0.068 | −0.144 | −0.007 | 0.149 | 0.001 | 0.045 | −0.022 |
| N–NH4+ | 0.321 | −0.311 | −0.420 | −0.025 | 0.688 | −0.017 | −0.039 | 1.000 | 0.303 | −0.616 | −0.524 | −0.374 | −0.521 | −0.602 | −0.446 | −0.740 |
| N–NO2− | 0.324 | 0.142 | −0.192 | −0.136 | 0.258 | 0.258 | 0.049 | 0.303 | 1.000 | 0.036 | 0.058 | 0.300 | 0.264 | 0.179 | 0.309 | 0.047 |
| N–NO3− | −0.384 | 0.260 | 0.348 | 0.124 | −0.554 | 0.152 | −0.068 | −0.616 | 0.036 | 1.000 | 0.658 | 0.516 | 0.520 | 0.590 | 0.537 | 0.748 |
| SO42− | −0.252 | 0.574 | 0.370 | 0.107 | −0.700 | 0.253 | −0.144 | −0.524 | 0.058 | 0.658 | 1.000 | 0.617 | 0.686 | 0.733 | 0.664 | 0.736 |
| Cl− | 0.192 | 0.425 | 0.095 | −0.204 | −0.456 | 0.404 | −0.007 | −0.374 | 0.300 | 0.516 | 0.617 | 1.000 | 0.764 | 0.690 | 0.949 | 0.641 |
| Ca2+ | 0.195 | 0.611 | 0.155 | −0.146 | −0.429 | 0.346 | 0.149 | −0.521 | 0.264 | 0.520 | 0.686 | 0.764 | 1.000 | 0.857 | 0.781 | 0.734 |
| Mg2+ | −0.078 | 0.661 | 0.262 | 0.046 | −0.605 | 0.414 | 0.001 | −0.602 | 0.179 | 0.590 | 0.733 | 0.690 | 0.857 | 1.000 | 0.762 | 0.815 |
| Na+ | 0.157 | 0.510 | 0.193 | −0.207 | −0.545 | 0.348 | 0.045 | −0.446 | 0.309 | 0.537 | 0.664 | 0.949 | 0.781 | 0.762 | 1.000 | 0.712 |
| K+ | −0.225 | 0.479 | 0.364 | −0.011 | −0.667 | 0.190 | −0.022 | −0.740 | 0.047 | 0.748 | 0.736 | 0.641 | 0.734 | 0.815 | 0.712 | 1.000 |
| Parameter | Factor 1 | Factor 2 | Factor 3 |
|---|---|---|---|
| Temperature | 0.097 | 0.798 1 | 0.299 |
| pH | 0.687 | 0.065 | −0.094 |
| DO | 0.188 | −0.750 | 0.163 |
| BOD5 | −0.060 | −0.066 | −0.834 |
| CODCr | −0.605 | 0.610 | 0.072 |
| Org–N | 0.010 | 0.042 | 0.703 |
| N–NH4+ | −0.556 | 0.629 | −0.058 |
| N–NO2− | 0.312 | 0.630 | 0.030 |
| N–NO3− | 0.648 | −0.434 | −0.169 |
| SO42− | 0.804 | −0.303 | −0.221 |
| Cl− | 0.872 | 0.120 | 0.129 |
| Ca2+ | 0.910 | 0.053 | 0.155 |
| Mg2+ | 0.906 | −0.142 | −0.071 |
| Na+ | 0.914 | 0.047 | 0.160 |
| K+ | 0.833 | −0.372 | −0.024 |
© 2019 by the authors. Licensee MDPI, Basel, Switzerland. This article is an open access article distributed under the terms and conditions of the Creative Commons Attribution (CC BY) license (http://creativecommons.org/licenses/by/4.0/).
Share and Cite
Bogdał, A.; Wałęga, A.; Kowalik, T.; Cupak, A. Assessment of the Impact of Forestry and Settlement-Forest Use of the Catchments on the Parameters of Surface Water Quality: Case Studies for Chechło Reservoir Catchment, Southern Poland. Water 2019, 11, 964. https://doi.org/10.3390/w11050964
Bogdał A, Wałęga A, Kowalik T, Cupak A. Assessment of the Impact of Forestry and Settlement-Forest Use of the Catchments on the Parameters of Surface Water Quality: Case Studies for Chechło Reservoir Catchment, Southern Poland. Water. 2019; 11(5):964. https://doi.org/10.3390/w11050964
Chicago/Turabian StyleBogdał, Andrzej, Andrzej Wałęga, Tomasz Kowalik, and Agnieszka Cupak. 2019. "Assessment of the Impact of Forestry and Settlement-Forest Use of the Catchments on the Parameters of Surface Water Quality: Case Studies for Chechło Reservoir Catchment, Southern Poland" Water 11, no. 5: 964. https://doi.org/10.3390/w11050964
APA StyleBogdał, A., Wałęga, A., Kowalik, T., & Cupak, A. (2019). Assessment of the Impact of Forestry and Settlement-Forest Use of the Catchments on the Parameters of Surface Water Quality: Case Studies for Chechło Reservoir Catchment, Southern Poland. Water, 11(5), 964. https://doi.org/10.3390/w11050964