Article

Assessment of Climate Change Impact on Future Groundwater-Level Behavior Using SWAT Groundwater-Consumption Function in Geum River Basin of South Korea

1
Graduate School of Civil, Environmental and Plant Engineering, Konkuk University, 120 Neungdong-ro, Gwangjin-gu, Seoul 05029, Korea
2
Agricultural and Water Resources Engineering, Texas A&M AgriLife Research Center at El Paso, 1380 A&M Circle, El Paso, TX 79927–5020, USA
3
School of Civil and Environmental Engineering, College of Engineering, Konkuk University, 120 Neungdong-ro, Gwangjin-gu, Seoul 05029, Korea
*
Author to whom correspondence should be addressed.
Water 2019, 11(5), 949; https://doi.org/10.3390/w11050949
Submission received: 27 March 2019 / Revised: 3 May 2019 / Accepted: 5 May 2019 / Published: 6 May 2019

Abstract

:
This study was to evaluate the groundwater-level behavior in Geum River Basin (9645.5 km2) of South Korea with HadGEM3-RA RCP 4.5 and 8.5 climate change scenarios and future groundwater use data using the soil and water assessment tool (SWAT). Before evaluating future groundwater behavior, the SWAT model was calibrated and validated using the daily inflows and storage of two dams (DCD and YDD) in the basin for 11 years (2005–2015), the daily groundwater-level observation data at five locations (JSJS, OCCS, BEMR, CASS, and BYBY), and the daily inflow and storage of three weir locations (SJW, GJW, and BJW) for three years and five months (August 2012 to December 2015). The Nash–Sutcliffe efficiency (NSE) and the coefficient of determination (R2) of two dam inflows was 0.55–0.70 and 0.67–0.75. For the inflows of the three weirs, NSE was 0.57–0.77 and R2 was 0.62–0.81. The average R2 value for the groundwater levels of the five locations ranged from 0.53 to 0.61. After verifying the SWAT for hydrologic components, we evaluated the behavior of future groundwater levels by future climate change scenarios and estimated future ground water use by Korean water vision 2020 based on ground water use monitoring data. The future groundwater-level decreased by −13.0, −5.0, and −9.0 cm at three upstream locations (JSJS, OCCS, and BEMR) among the five groundwater-level observation locations and increased by +3.0 and +1.0 cm at two downstream locations (CASS and BYBY). The future groundwater level was directly affected by the groundwater recharge, which was dependent on the seasonal and spatial precipitations in the basin.

1. Introduction

Changes in available water resources due to spatiotemporal changes in the precipitation pattern have been selected as the part most vulnerable to future climate changes [1]. In particular, the establishment of response strategies by region, water-resource diversification, including water recycling, and integrated water-resource management was advised for Asian countries [2]. Changes in the groundwater hydrological system, among the effects of climate change, have been observed in wide areas, and sensitive problems have been occurring, especially in regions where most of the water resources depend on groundwater [3].
Groundwater is a useful water resource especially for upland crop cultivation and during drought periods [4,5,6,7]. The annual groundwater use in South Korea is approximately 3.7 billion m3. This represents only around 10% of the total water resource use but exceeds 35% of the totally available groundwater amount in the country [8]. In particular, a survey reported that the groundwater use in the Geum River Basin has increased by 11.6% over the last 10 years (2005–2015) [9]. However, based on the groundwater-level data for the last 10 years obtained from the nationwide national groundwater monitoring network, approximately a 0.58 m decrease in the groundwater level for the next 20 years has been predicted [10]. Excessive groundwater collection and a decrease in the groundwater recharge caused by climate change were qualitatively estimated as the causes.
For elements with slow and continuous flow, such as changes in groundwater, the influence of climate change on the ground surface cannot be easily recognized. However, once the fluctuations caused by changes in ground surface begin to be observed in the groundwater environment, the impact is much longer compared to that on the ground surface. Therefore, continuous attempts have been made to quantify the runoff or inflow of groundwater [11].
Several studies recently assessed the groundwater behavior using hydrological models, Kim et al. [12] developed a daily distributed model that applied the groundwater recharge estimation method, using soil moisture tracking, to the Bocheongchun watershed. Kwon et al. [13] assessed the groundwater development amount using a daily distributed rainfall runoff model, which considers the topographic and soil characteristics of a basin. Kim et al. [14], Kim et al. [10], Chung et al. [15], and Chung et al. [16] quantitatively analyzed groundwater by calculating the surface runoff, lateral runoff, and groundwater runoff components from precipitation after linking the SWAT and MODFLOW models and by estimating the groundwater recharge. Kim et al. [17] estimated the hydrologic parameters for the Jeju area by using a groundwater-level variation analysis model. Ahn et al. [18] presented a groundwater-level estimation method in the SWAT model by calibrating and validating the groundwater level using the hydrological response unit (HRU) of the SWAT model. Shirmohammadi et al. [19], Pfannerstill et al. [20], Izady et al. [21], Jin et al. [22], and Sun et al. [23] conducted research to estimate the groundwater recharge and groundwater flow using the simulation results of the SWAT model.
As for the studies that assessed the future groundwater recharge due to climate change, Ahn et al. [24] estimated the groundwater recharge for the Gyeongancheon watershed by using the SLURP model. Lee et al. [8] developed a climate change recharge estimation model using detailed climate change scenarios and GIS and estimated the groundwater recharge throughout the country according to the future climate change scenarios. Lee et al. [25] forecasted the groundwater recharge in the steep watersheds of coastal areas due to climate change using the SWAT model, and Park et al. [26] analyzed the groundwater runoff of the Yongdam Dam Basin using climate change scenarios, the SWAT model, and the analysis of hydrological elements. As for overseas studies on groundwater analysis using SWAT, Dessu et al. [27] analyzed the groundwater flow due to climate change through flow-duration and hydrological analyses, and Awan et al. [28] created a groundwater recharge distribution map of irrigation regions due to climate change. Fiseha et al. [29] and Verma et al. [30] estimated the groundwater recharge due to climate change through hydrological analysis, while Goodarzi et al. [31] estimated it by linking SWAT and MODFLOW models. Although domestic and overseas studies on the groundwater analysis through hydrological models and on the assessment of the effects of climate change have been actively conducted, studies that assessed the groundwater behavior caused by climate change are still not sufficient.
This study aimed to reproduce a reliable hydrologic cycle by using the SWAT model, which is a physical semi-distributed continuous rainfall runoff model at multi-purpose dams and multi-function weirs in the Geum River Basin (9645.5 km2). To do this, the specific objectives of the study were as follows: (1) to calibrate and validate of streamflow considering groundwater consumption with observed groundwater-level data; (2) to estimate the future runoff characteristics applying future climate change and the groundwater-consumption scenarios including groundwater level.
Data requirements for MODFLOW were to define the aquifer properties such as the hydraulic conductivity and the boundary conditions such as recharge and constant heads. Although the previous research using SWAT-MODFLOW has been conducted in South Korea [10,14,15,16], but the application of large basins is limited. The Geum River Basin is the third largest basin in South Korea, there is not enough input data (i.e., stream bed thickness, hydraulic conductivity, riverbed filtration) for the MODFLOW, we analyzed using SWAT only.

2. Materials and Methods

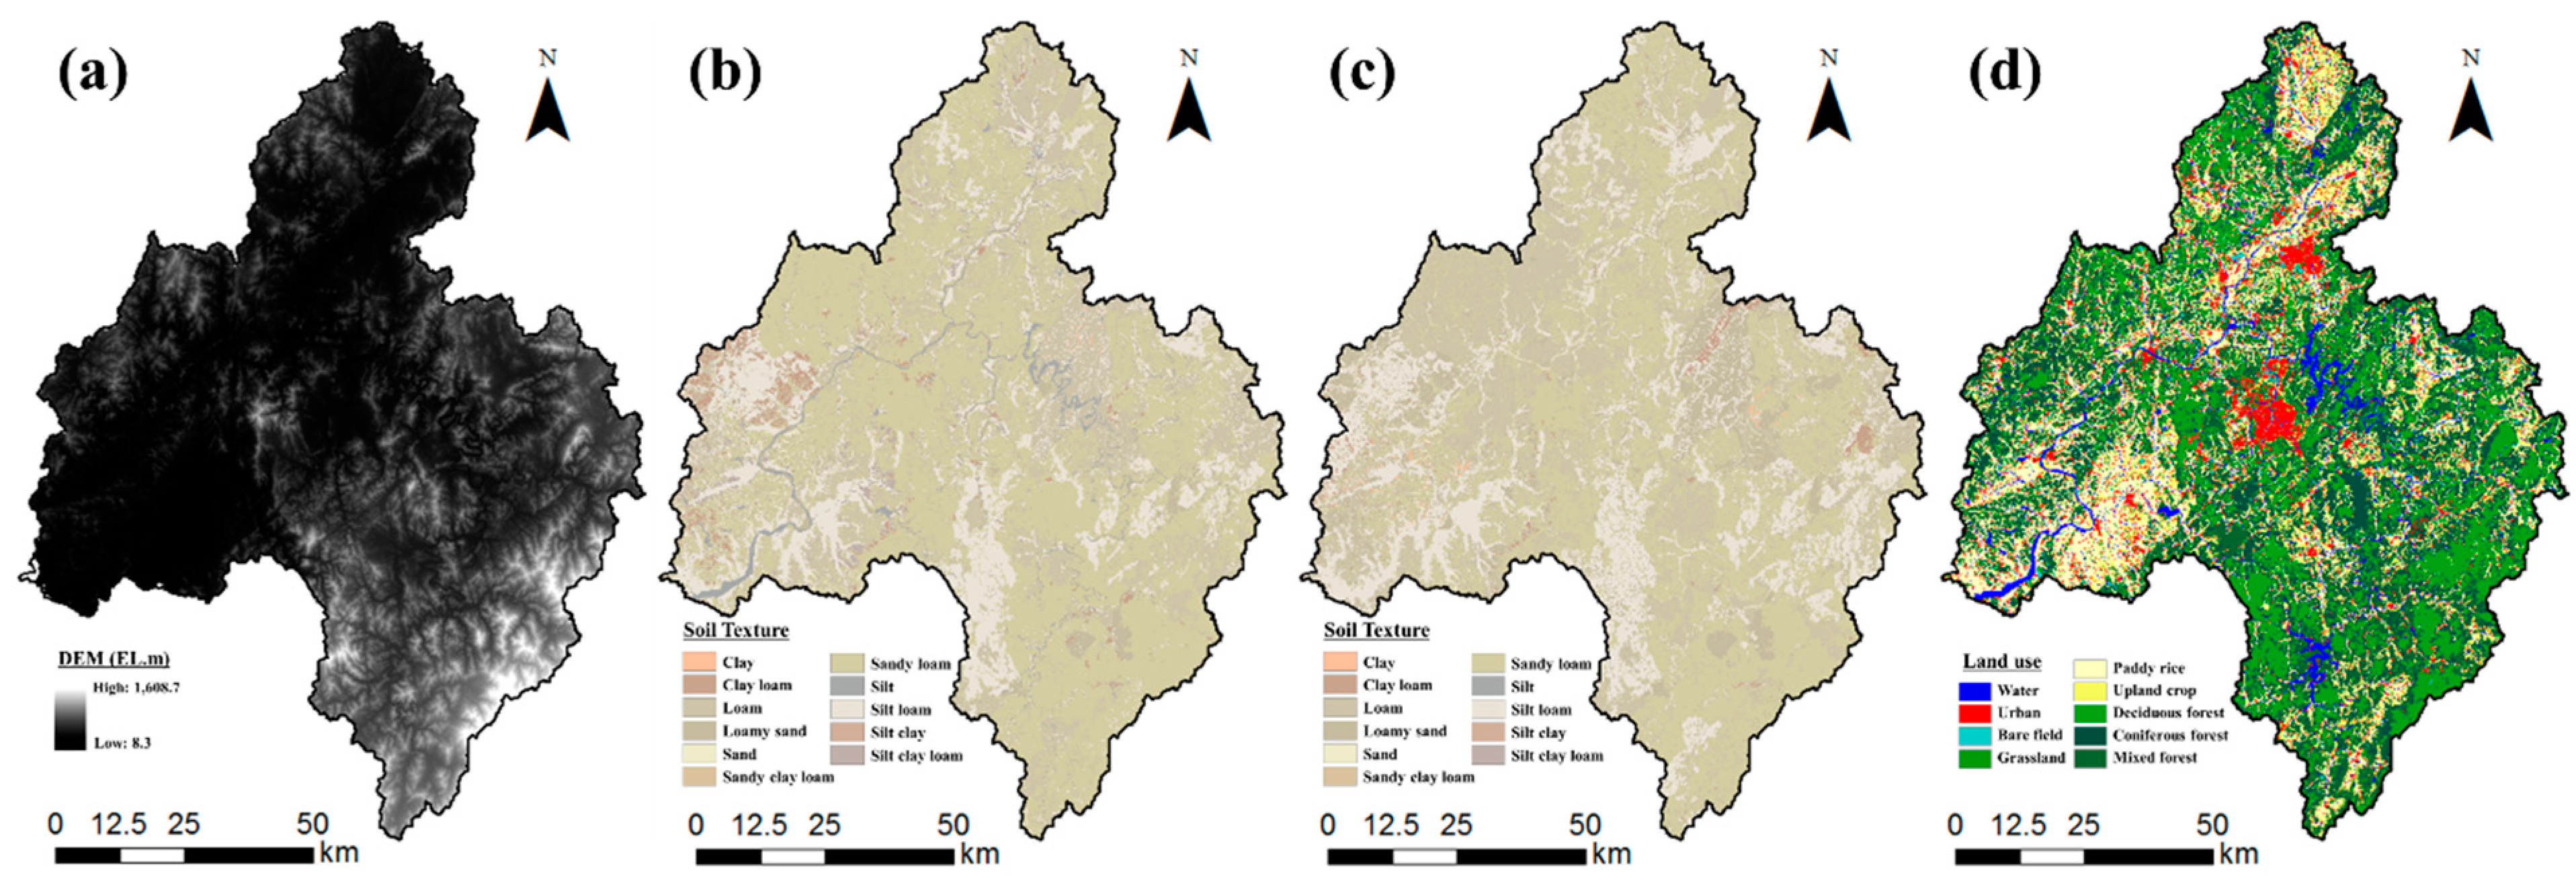
2.1. Study Area Description

The study area of this study is the Geum River Basin, which originates from Jangsu-gun, Jeollabuk-do, and reaches the West Sea at the Gunsan Bay through Muju, Geumsan, Yeongdong, Okcheon, Boeun, Cheongju, Daejeon, Sejong, Gongju, Cheongyang, Nonsan, Buyeo, Seocheon, and Iksan. The basin has an area of 9645.5 km2 and length of 384.8 km. In the basin, two multi-purpose dams, i.e., Yongdam Dam (YDD) and Daecheong Dam (DCD), and three multi-function weirs, i.e., Sejong Weir (SJW), Gongju Weir (GJW), and Baekjae Weir (BJW), are in operation. Forests account for 62% of the total basin area, followed by paddy fields (15%), fields (11%), cities, grasslands, and bare lands (3–5%).
Geologically, Korea is comprised mainly of Precambriam gneiss and Jurassic granite in the middle area. Quaternary alluvial deposits with high permeability and high groundwater yield (up to 800 m3/day) are mostly found along large rivers [7]. Alluvial aquifers are composed of unconsolidated sediments and are widely distributed within the Geum River Basin. The average annual precipitation of the Geum River Basin is 1323.1 mm, the average annual temperature is 12.2 °C and the average evapotranspiration is 533.2 mm. As of 2015, the groundwater use of the Geum River Basin was 525.9 million m3/year and the groundwater use per unit area was 1808.3 m3/day/km2, which was the second largest among the five major regions (Han River, Nakdong River, Geum River, Seomjin River, and Yeongsan River) [9]. Figure 1 shows the 78 sub-watersheds divided to be applied to the SWAT model as well as dams, weirs, and groundwater calibration and validation locations.

2.2. SWAT Model Descriptionl

In this study, SWAT [33] developed by the Agricultural Research Service of U.S Department of Agriculture (USDA) was selected to simulate the daily runoff of the target basin for a long period. The SWAT model, a physical semi-distributed continuous rainfall runoff model, simulates runoff under various soil types, land uses, and land management conditions. Based on the hydrologic equation, the model can perform the simulation of precipitation, evapotranspiration, surface runoff, base runoff, and groundwater for each HRU [34].
In the SWAT model, the daily runoff is calculated using the soil conservation service curve number method and the kinematic storage model is used for the lateral inflow. Penetration is calculated by subdividing the soil layer into a maximum of 10 and using the linear storage amount tracking method. Groundwater is divided into shallow and deep aquifers. Shallow aquifers are flows that penetrate from the ground surface to aquifers and supply river return flows in the basin. Some of the shallow aquifers are supplied to the deep aquifers and flow out of the basin. In this case, the groundwater recharge and level are calculated using the following equations [33].
Q gw   =   8 × d e × K sat L gw 2   h wtbl , i
h wtbl , i = h wtbl , i 1 × exp [ α gw × Δ t ] +   [ w rchrg × ( 1 exp [ α gw × Δ t ] )   800 × μ × α gw ]
where Qgw is the groundwater or base runoff (mm/day) introduced to the river each day, de is initial depth of water in the deep aquifer (mm), Ksat is the hydraulic conductivity of the aquifer (mm/day), Lgw is the distance from the split boundary for the groundwater system and the sub-watershed to the main river (m), hwtbl,i is the groundwater level on day i (m), hwtbl,i-1 is the groundwater level on day i − 1 (m), αgw is the baseflow recession constant, ∆t is unit time (1 day), wrchrg is the penetration amount into the aquifer on day i (mm water), and μ is the specific yield of shallow aquifers (m/m).
SWAT does not currently print groundwater height in the output file; the water table height is updated daily by the model [33]. The HRU output files contains summary information for each of the hydrologic response units in the watershed. In this study, the result of SA_ST (shallow water storage, mm) in HRU were used, which is calculated as the initial value of the GWQMN (threshold water level in shallow aquifer for base flow, mm) parameter. The groundwater level (EL.m) was taken from SA_ST (mm) minus GWQMN (mm) as the amount of groundwater-level variation (mm), and the initial value of the monitoring groundwater level (EL.m) was added [18].

2.3. Data Collection and Analysis Method

2.3.1. GIS, Weather and Hydrological Monitoring Data

As the GIS spatial data of the SWAT model, the 30 m × 30 m digital elevation model and 1:25,000 precision soil map of the Water Management Information System was used (Figure 2a,b). For the land use map, the 2008 classification data of the Ministry of Environment were used and classified into nine classifications (deciduous forest, coniferous forest, mixed forest, urban, paddy, crop areas, grasslands, bare fields, and water), and then inputted into the model (Figure 2c). As for the surface soil types in the Geum River Basin, the sandy loam and loam represented high proportions (58% and 24%, respectively). Sandy loam and loam occupy 42% and 27%, respectively, of subsoil textures. As for the land use, forests accounted for 62% and paddy and crop areas accounted for 15%.
As for the weather data for the calibration and validation of SWAT, the daily data of weather stations in nine areas (Cheonju, Daejeon, Chupungryeong, Gunsan, Boeun, Cheonan, Buyeo, Geumsan, and Jangsu), including the precipitation (mm), highest and lowest temperatures (°C), wind speed (m/s), relative humidity (%), and solar radiation (MJ/m2), for 11 years (2005–2015) were used. The daily dam inflow and storage data of YDD and DCD collected during this period were used. For SJW, GJW, and BJW, daily weir inflow and storage data collected for three years and five months (August 2012 to December 2015) were used (http://www.water.or.kr).
In the hydrology and water balance assessment for a basin, groundwater level is important. Owing to the insufficient observation data, however, values estimated by empirical equations have been used [18]. Therefore, in this study, the groundwater values measured in the basin were used for model verification. The groundwater-level data observed by the groundwater-level observation stations of the National Groundwater Information Center (GIMS) were collected. In the Geum River Basin, 18 groundwater-level observation stations were in operation, and five locations (Jangsujangsu (JSJS), Okcheoncheongseong (OCCS), Boeunmaro (BEMR), Cheonansushin (CASS), and Buyeobuyeo (BYBY)), without missing data for more than two years during the calibration and validation period of the model (2005–2015), were selected (Figure 1).
In this study, we set the hydrologic response units (HRU) threshold to 0%, and the HRUs in the Geum River basin were divided into 27,173. The average area per HRU was 0.3 km2, which was divided within the radius influence of South Korea’s ground water (0.5 km).

2.3.2. Groundwater Use Data (GWU)

Groundwater use estimation methods have been dealt with by several researchers, and these methods have inherent uncertainties [35,36,37,38]. Given the groundwater use estimating system and realistic conditions, it is necessary to estimate the groundwater use by raising the reliability of prediction of the utilization rate by making a reasonable method. However, as the purpose of this study was not to compare the accuracy of the data, we used the national reports published in South Korea.
The Ministry of land, Infrastructure, and Transport (MOLIT) conducts a basic investigation regarding the reserve characteristics and the available volume of ground water throughout the country [7]. National Groundwater Information Center (NGIC) provides monthly and annual GWU data. In this study, we collected GWU data over the past 40 years (1976–2015) [39] and future groundwater use data collected by comprehensive water resources plan water vision 2020 published by MOLIT. These data were estimated by considering the watershed area and water return ratio.
According to NGIC, the use of groundwater in the Geum River Basin increased 11.6 % over the last 10 years (2006–15). The use of groundwater in the Geum River Basin increased gradually as the water supply rate increased to 10% increase last 10 years (2007–2016) [40]. For evaluating the future groundwater level, the projection period was divided into 2020s (2010–2039), 2050s (2040–2069), and 2080s (2070–2099). The results of the average groundwater use were calculated as 4.9 × 10⁴ m3 in Historical period and 6.8 × 10⁴ m3 in 2020s, 7.6 × 10⁴ m3 in 2050s and 8.1 × 10⁴ m3 for 2080s respectively.
Water enters groundwater storage mainly through infiltration and percolation, although recharging through seepage from surface water bodies can occur. The SWAT model simulates shallow aquifer and deep aquifer of a subbasin. A shallow aquifer is an unconfined aquifer that contributes to the flow in a main channel or reaches a subbasin and a deep aquifer is a confined aquifer. The water entering a deep aquifer is assumed to contribute to the streamflow somewhere outside of a given watershed [41,42].
Consumptive water use is a management tool that removes water from the basin. Water use is used to simulate removal of water for irrigation outside the watershed or removal of water for urban/industrial use. SWAT allows water to be removed from the shallow aquifer within any subbasin in the watershed [33]. In this study, we applied to water use (.WUS) parameters of SWAT. Figure 3 shows the spatial distribution of future GWU by season and projection periods.

2.3.3. Climate Change Scenario

Climate change scenarios are subject to uncertainty due to limitations such as the selection of future virtual scenarios, incomplete physical understanding of various self-connections, and computational capabilities [43,44,45,46]. Convenience corrections need to be made to minimize uncertainty in these climate change scenarios.
In this study, the HadGEM3-RA RCP (Representative Concentration Pathway) 4.5 and 8.5 scenario data (precipitation, lowest/highest temperatures, wind speed, and relative humidity) with 12.5 km resolution provided by the Korea Meteorological Administration (KMA) were used, and the precipitation and temperature were corrected conveniently using the quantile mapping and change factor techniques, respectively. The projection period was divided into 2020s (2010–2039), 2050s (2040–2069), and 2080s (2070–2099). Two RCPs were compared with the measured temperature and precipitation over the past 31 years (1981–2011), and the RCPs were observed to underestimate these variables. Therefore, the future temperature and precipitation data were regenerated using a statistical bias correction based on historical observation data and the detailed technical procedures can be found in Ahn et al. [47,48].
Table 1 compares the seasonal precipitations and temperatures of the ground observation data (1975–2005, Baseline), the past data of the RCP 4.5 and 8.5 scenarios (1975–2005, Historical), and 2020s, 2050s, and 2080s. In the 2080s RCP 8.5 scenario, the future temperature and precipitation increased by 5.3 °C and 11.5% (160.3 mm) compared to Historical, and by 5.5 °C and 63.5% (141.9 mm) in spring. In summer, the future temperature increased by 6.1 °C, but the precipitation decreased by 5.3% (44.3 mm).

3. Results and Discussion

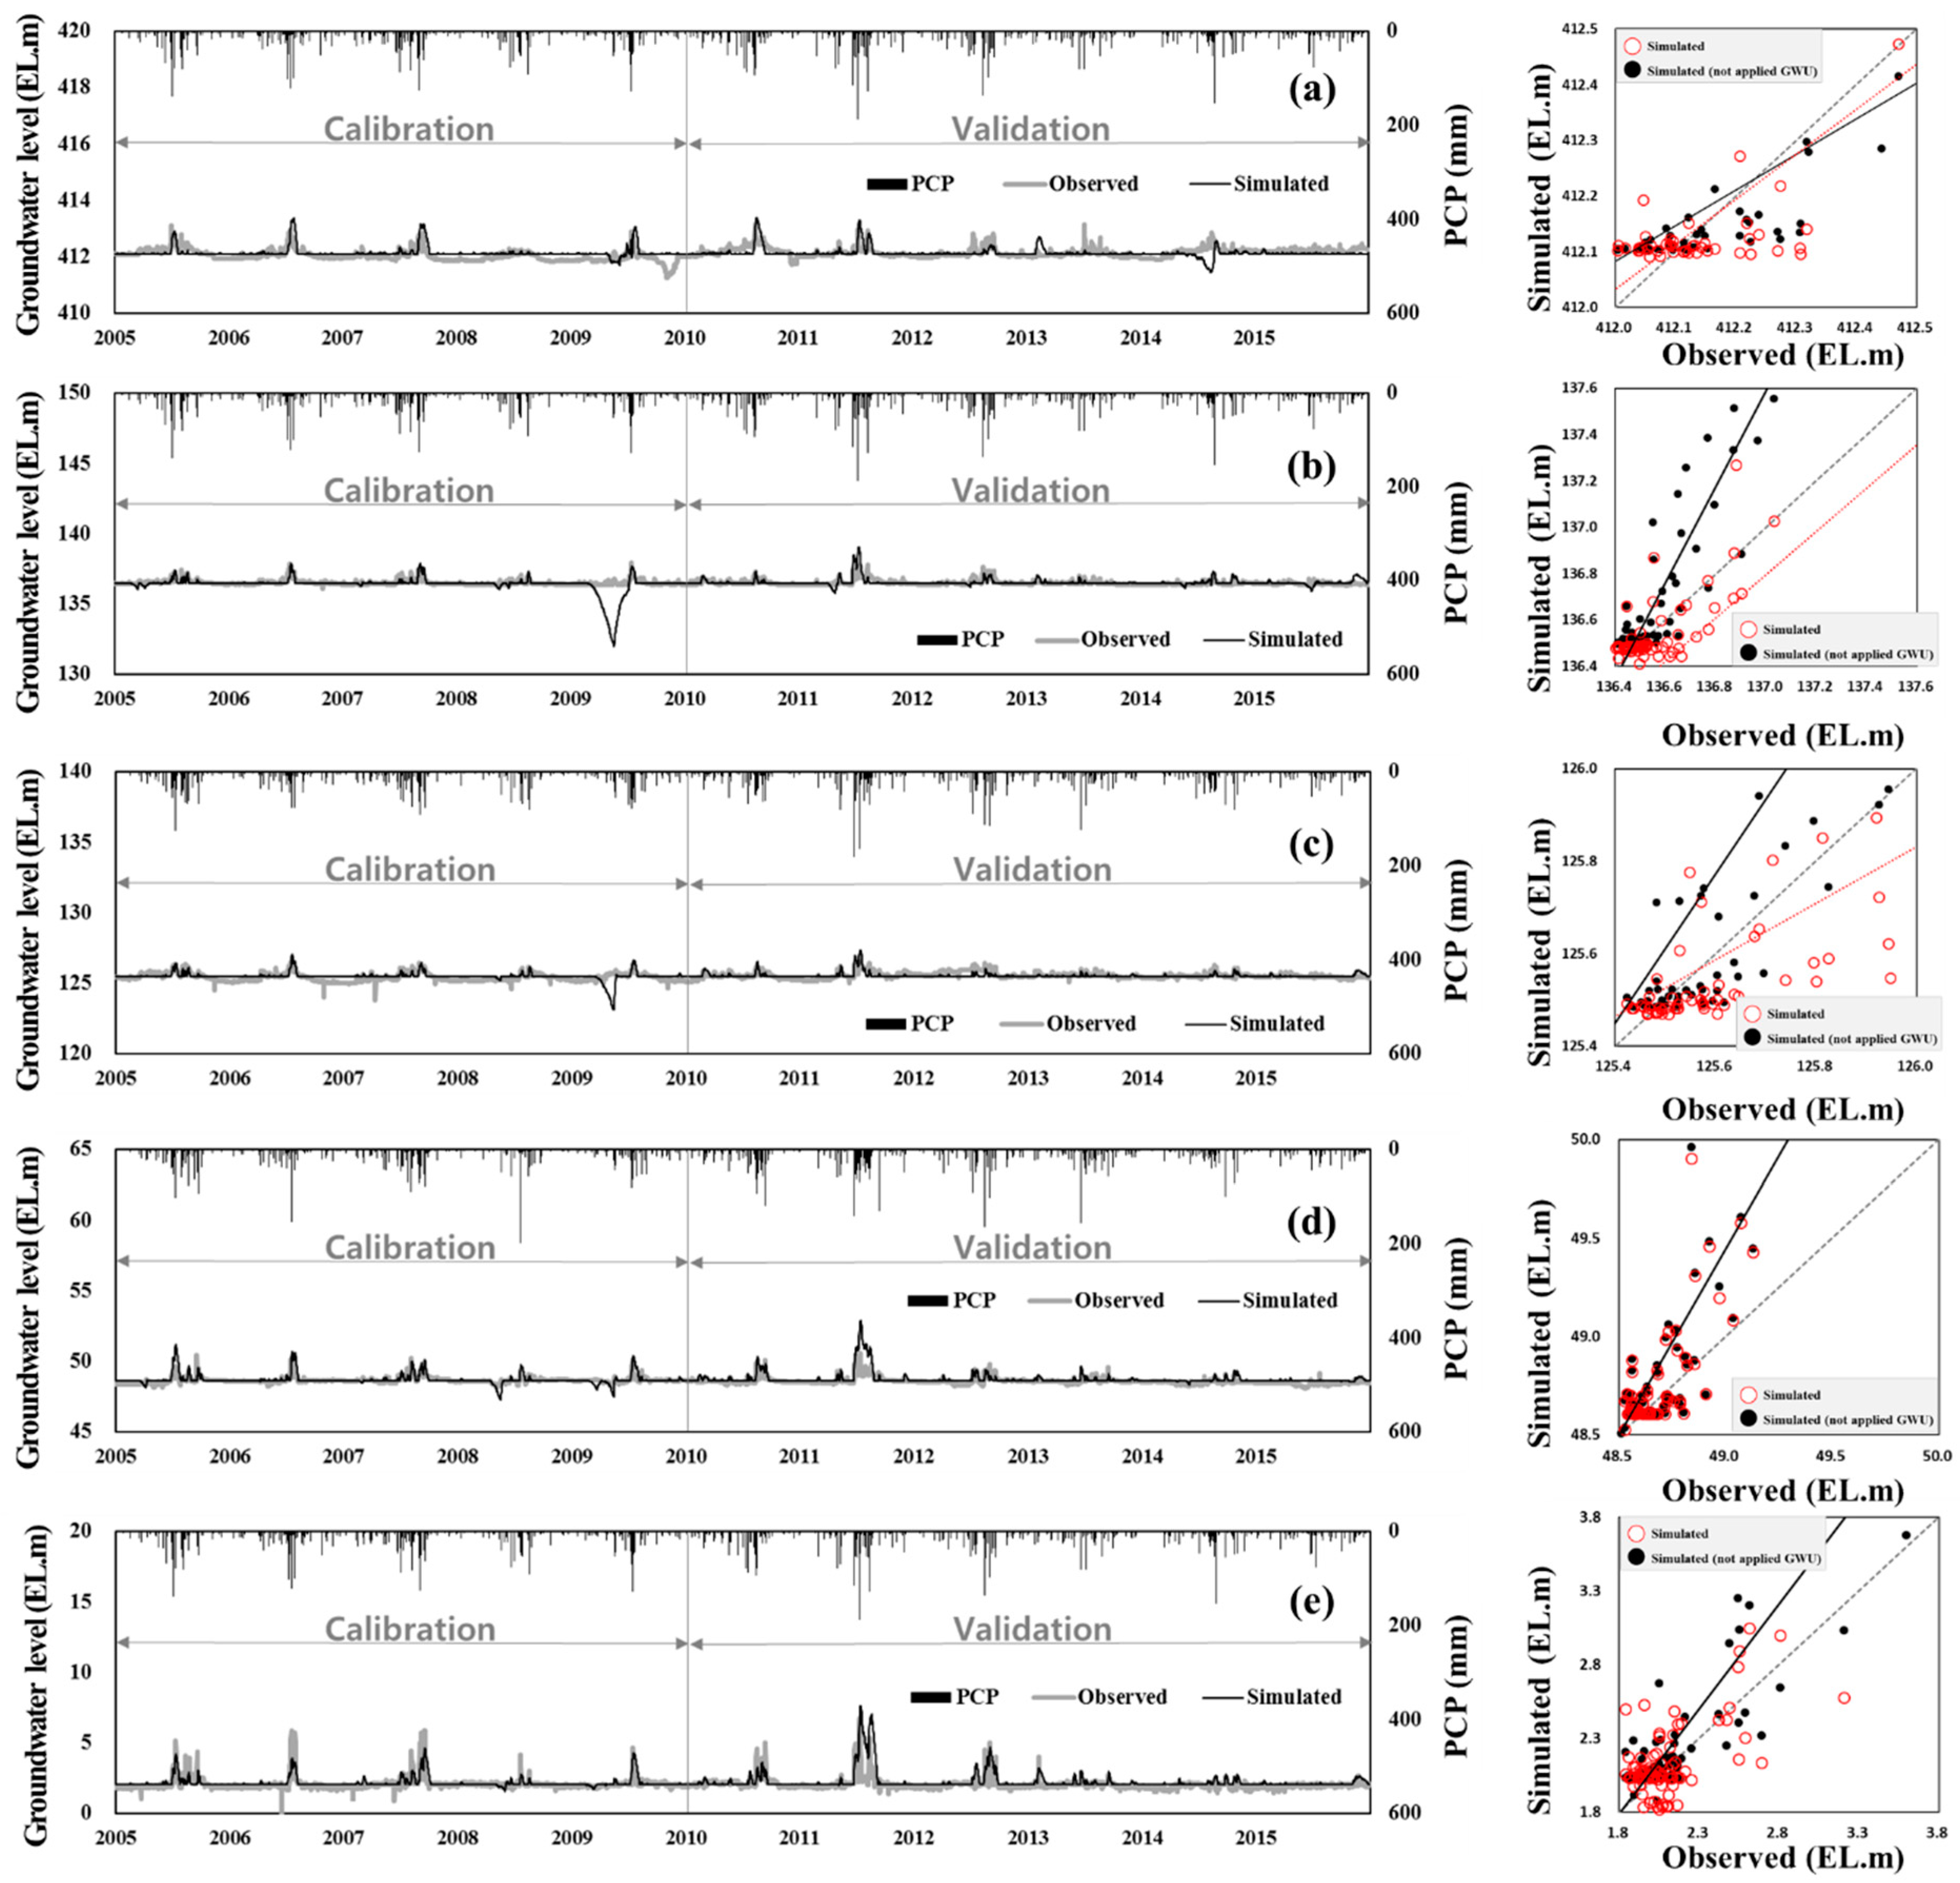
3.1. Calibration and Validation of the Model

In this study, prior to the calibration and validation of the model, the parameter sensitivity for the Geum River Basin was performed. Through this, optimal parameters were selected. Table 2 summarizes the parameters used for the calibration and validation of the SWAT. The parameter related to the surface runoff is CH_N(2), while that related to evapotranspiration is ESCO; the parameters related to groundwater are GW_DELAY, GWQMN, ALPHA_BF, REVAPMN, and GW_REVAP. Seven parameters (RES_ESA, RES_EVOL, RES_PSA, RES_PVOL, RES_VOL, RES_K, and EVRSV) were selected as the reservoir operation parameters. As for the estimation, calibration, and validation of the parameters, the method of Ahn et al. [18] was applied.
The calibration period of the SWAT model was set to five years (2005–2009) and its validation period was set to six years (2010–2015). However, as the three weirs (SJW, GJW, and BJW) were operated from August 2012, the year 2013 was set as the calibration period and 2014–2015 was set as the validation period for the analysis. For assessing the applicability of the model, the coefficient of determination (R2), Nash and Sutcliffe (1970) model efficiency (NSE), root-mean-square error (RMSE), and percent bias (PBIAS) were used. R2 indicates that the observed and simulated values are in perfect agreement as it is closer to 1. The NSE assesses the efficiency of the model in the range of −∞ to 1. As it is higher than 0, the applicability of the model can be said to be higher [49]. The RMSE represents the error between the measured and simulated values. As it approaches 0, the error decreases. PBIAS represents the error between the observed value and the simulated value as a percentage. A smaller error value means higher efficiency of the model.
Table 3 summarizes the statistical analysis values for the inflows, storage and groundwater level among the calibration and validation results. The dam inflow ratios of YDD and DCD for the entire calibration and validation period were estimated to be +1.4% and +3.4% higher than the measured values and the storage were estimated to be 2.2% and 3.7% larger than the measured values. The weir inflow ratios of SJW and GJW were estimated to be +1.4% and +0.4% higher than the measured values. However, the ratio of BJW located in the downstream area of the Geum River was simulated to be −4.3% lower. Apparently, the inflows of SJW and GJW, which are upstream areas, have affected BJW, which is a downstream area.
As for the dam inflow statistical analysis results, the R2 values were analyzed to be 0.67, 0.75, 0.75, 0.80, and 0.81 for the calibration period and 0.70, 0.71, 0.64, 0.61, and 0.62 for the validation period at YDD, DCD, SJW, GJW, and BJW, respectively. The NSE values were analyzed to be 0.55, 0.70, 0.69, 0.76, and 0.77 for the calibration period and 0.58, 0.64, 0.64, 0.57, and 0.50 for the validation period at YDD, DCD, SJW, GJW, and BJW. For 2014 and 2015, which were drought years in the validation period, the average precipitation was 941.0 mm and R2 and NSE were found to be low. The RMSE values for the entire period were 1.67, 1.42, 0.94, 1.02, and 1.18 mm/day at YDD, DCD, SJW, GJW, and BJW, and the PBIAS values showed the statistical values of 4.45%, 7.86%, 4.67%, −3.35%, and −2.06%. For all calibration and validation locations, the statistical analysis results were found to be statistically significant.
Among the statistical analysis results of the dam storage amount, the R2 values were analyzed to be 0.68, 0.65, 0.55, 0.55, and 0.57 for the calibration period and 0.78, 0.68, 0.70, 0.72, and 0.31 for the validation period at YDD, DCD, SJW, GJW, and BJW, respectively. For 2014 and 2015, which were drought years in the validation period, the average precipitation was 941.0 mm and R2 was found to be low. The NSE values were analyzed to be 0.79, 0.95, 0.92, 0.98, and 0.99 for the calibration period and 0.94, 0.93, 0.98, 0.99, and 1.00 for the validation period at YDD, DCD, SJW, GJW, and BJW. The RMSE values for the entire period were 1.85, 2.07, 0.13, 0.26, and 0.23 mm/day at YDD, DCD, SJW, GJW, and BJW, and the PBIAS values exhibited the statistical values of 5.48%, −9.38%, 3.89%, 1.44%, and 0.36%. The statistical analysis results were analyzed to be statistically significant for all calibration and validation locations.
In case of variation in the groundwater-level, the calculation results of HRUs of the corresponding locations were used for calibration and validation. HRU, a hydrological response unit, comprises a combination of the same land use and soil characteristics within the sub-watershed. OCCS, BEMR, and BYBY were classified as forest areas (mixed forest), while JSJS and CASS were classified as paddy field areas for the analysis. The average R2 values during the calibration and validation period were analyzed to be 0.51–0.64, 0.60, 0.51–0.56, 0.58–0.68, and 0.57–0.68 at JSJS, OCCS, BEMR, CASS, and BYBY (Table 3).
Figure 4 shows the groundwater-level calibration and validation results. The red line is the result of considering the groundwater use. When simulated without considering of groundwater use (black line), it was found that the variation in the groundwater level was large due to precipitation. It was found that the groundwater-level increase response due to the precipitation was faster in the forest areas (OCCS, BEMR, and BYBY) than in the paddy field areas (JSJS and CASS). In particular, we found that the variation was larger when the groundwater use was not considered. Compared with SWAT modeling results for groundwater level, the results of GWU consideration was 0.3 cm higher than the observation data and the results of GWU not consideration was 10.6 cm higher at five stations.
In case of JSJS, which is the top upstream location of the Geum River, the water level decreased in the observation data of 2008 and 2009, but the SWAT simulation remained constant. This appears to be because 150 days were applied to GW_DELAY, a groundwater-related parameter, as shown in Table 2, and the groundwater flow was calculated to be slowly flowing within the sub-watershed owing to the influence of the parameter.
The depth of the main groundwater table in an alluvial aquifer becomes slightly deeper toward the river, indicating the overall groundwater flow toward the river. Therefore, groundwater levels near stream are greatly affected by precipitation and changes in stream levels. BYBY located in the floodplains, the groundwater levels responded rapidly to precipitation recharge and return flow.
In SWAT, groundwater use is a management that removes water from the basin by monthly. Although these monthly statistics data to not match the observed statistics exactly, the statistical analysis results of the simulated and measured values indicate that SWAT accurately reflects the inflows and storage amounts of the dams and weirs as well as the groundwater-level variation characteristics.

3.2. Changes in Hydrology Component by Climate Change

Prior to the analysis of the groundwater level due to climate change, simulation was performed by applying the parameters of the calibration and validation period (2005–2015) to the periods of Historical (1975–2005), 2020s (2010–2039), 2050s (2040–2069), and 2080s (2070–2099). Table 4 summarizes the results (precipitation, temperature, total runoff, groundwater recharge, and evapotranspiration) of operating the SWAT model using the climate change scenarios as the average values of the basin.
The precipitation increased in all scenarios and assessment periods compared to Historical. In particular, it exhibited the largest increment of 13.6% in RCP 4.5 2080s. Due to the influence of precipitation, the total runoff and groundwater recharge increased by 17.2% and 11.7% compared to Historical in the assessment period of the same scenario.
The evapotranspiration increased in all scenarios and assessment periods and exhibited the largest increment of 15.1% in RCP 8.5 2080s. In addition, the average temperature of the basin increased by 5.4 °C compared to that of Historical. The increase in evapotranspiration due to an increase in the temperature caused by climate change apparently affected the total runoff and groundwater recharge.
Figure 5 shows the total runoff and groundwater recharge change in projection periods by the standard watershed. In the case of the upstream area of the BEMR, it was found that the total runoff and groundwater recharge decreased in all climate change scenarios and projection periods. As shown in Table 4, it was analyzed that the average total runoff and groundwater recharge were analyzed to have increased, but as a result of the spatial distribution, regional variations have been shown. As shown in Figure 3, the subbasins surrounding BEMR was analyzed to have an effect on the groundwater recharge as the use of future groundwater use tend to increase.
In particular, when 2020s of the RCP 8.5 scenario, which showed the largest decrease, was examined from a spatial perspective, it was found that the groundwater recharge decreased not only in the upstream area of the BEMR but also in the sub-watershed, which included farmlands around the downstream areas of the BYBY. These results also affect the change in the groundwater level at the subbasin. As 49.1% of the groundwater in the Geum River Basin was used as agricultural water in 2014 [50], the groundwater in the Geum River Basin significantly contributed to the cultivation of crops. Therefore, the lack of groundwater recharge due to climate change may cause secondary damage, such as damage to crops.
According to Kumar and Seethapath [51], in evaluation of groundwater resources, the rate of aquifer recharges is one of the most difficult factors to measure and as such aquifer recharge rate estimation by any other method is always characterized with uncertainties and errors. This was due to the fact that recharge variable is a complex function of multiple factors such as meteorological conditions, soil, vegetation, physiographic characteristics, and properties of the geologic material within the paths of flow [52]. The SWAT model is a physically based, continuous, long-term, distributed parameter model that is designed to predict the hydrology under varying soil, land use, and climate [33]. This study is a method to simulate reliable groundwater recharge and groundwater flow considering groundwater use. Changes in groundwater flow and groundwater recharge in each future projection periods will be able to track vulnerable groundwater sub-watershed.

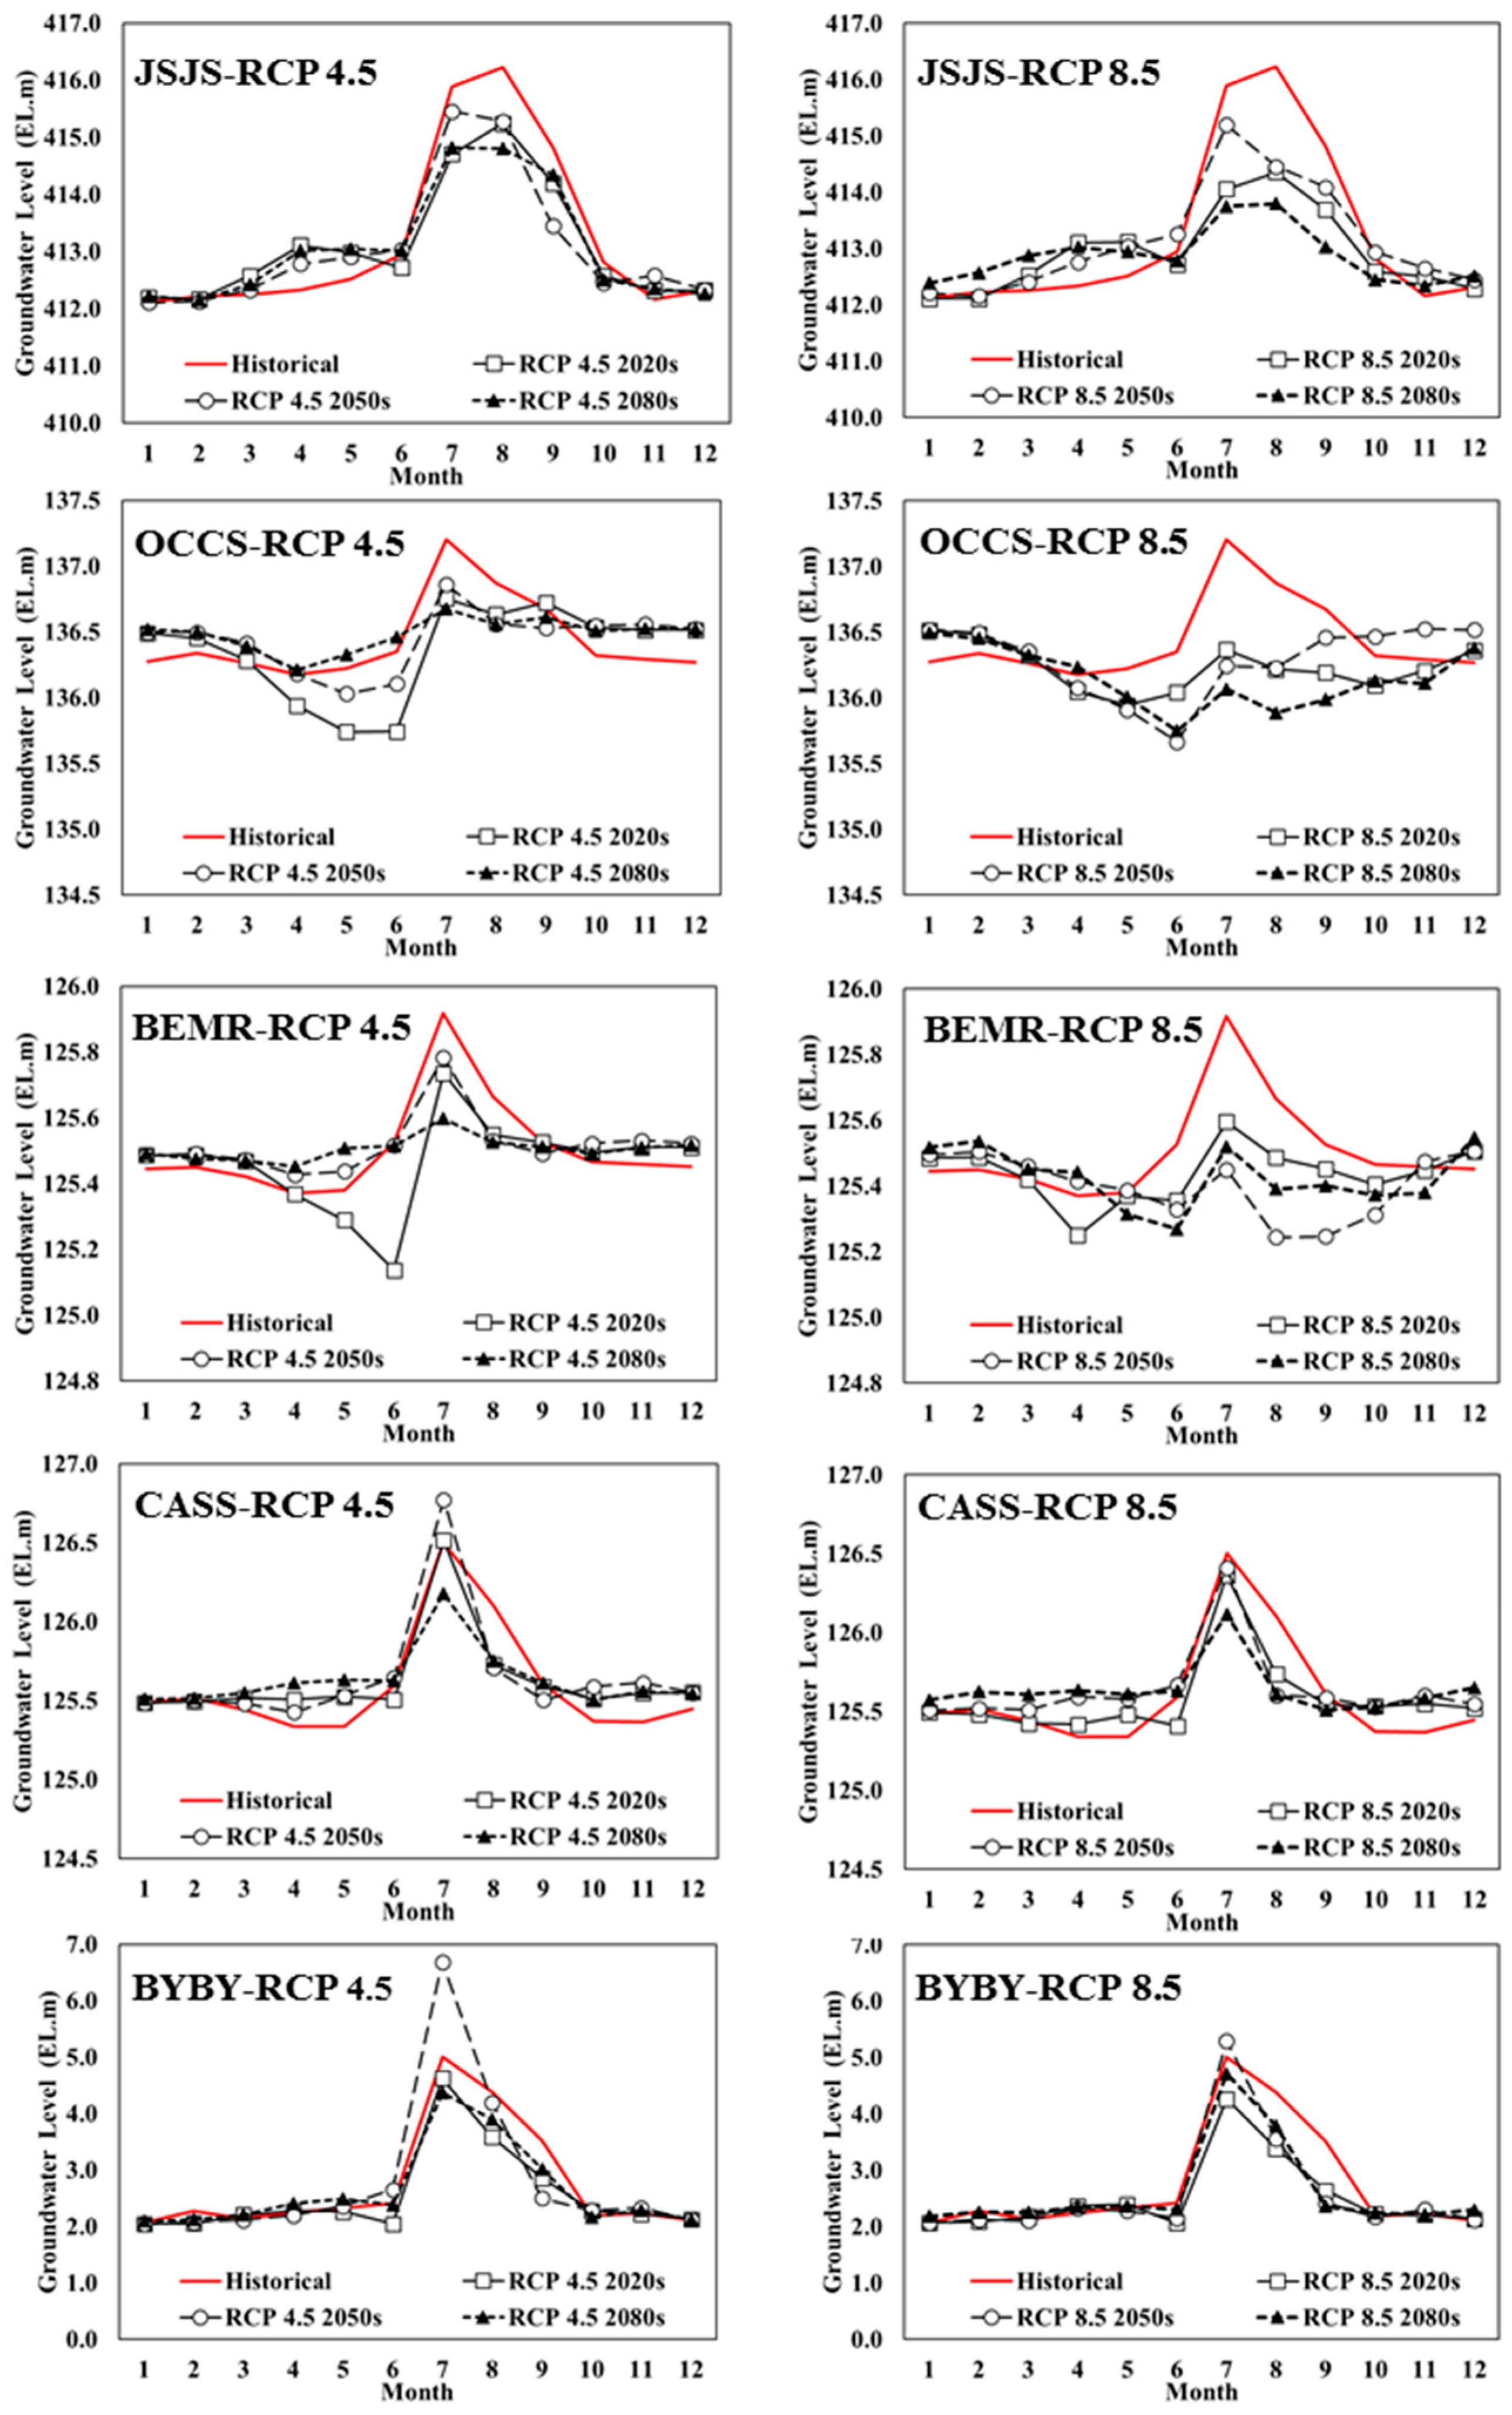
3.3. Changes in Groundwater Level by Climate Change

The groundwater-level variation due to climate change was summarized by extracting the same HRU for the five groundwater-level calibration and validation locations. Table 5 summarizes the groundwater-level change by season according to the scenario and projection period, and Figure 6 shows the change by month. Spring was from March to May, summer was from June to August, autumn was from September to November, and winter was from December to February.
At JSJS located in the upstream of the Geum River, the average annual groundwater levels of 2020s, 2050s, and 2080s of the RCP 8.5 scenarios decreased by 0.29, 0.08, and 0.34 cm compared to Historical. The groundwater level of spring increased, but that of summer significantly decreased (2020s: −1.31 cm, 2080s: −1.57 cm), indicating the consecutive influence of autumn (Table 5). At OCCS and BEMR, which were the groundwater observation locations in the upstream of the DCD, the average annual groundwater-level decreased in RCP 8.5 scenario. In particular, the groundwater level of May tended to rapidly decrease (Figure 6). The precipitation increased at OCCS and BEMR as their HRU land use attribute was mixed forest. However, as the evapotranspiration increased due to the change in the moisture use efficiency of forest caused by the temperature increase, it appears that the total runoff and groundwater recharge, as well as the groundwater level, decreased.
At CASS, where the future groundwater use has not increased significantly, the groundwater level increased in the assessment periods of all scenarios except for summer. The precipitation in July from the future summer period increased compared to Historical but decreased in August. Therefore, the groundwater level in summer decreased. In autumn, however, as the overall precipitation increased, the groundwater level also exhibited the same pattern (Figure 6). In the simulation results of BYBY, located in the downstream area of the Geum River Basin, the groundwater level in autumn increased in the assessment periods of all scenarios. This appears to be because BYBY was located in an area with a gentle slope and the groundwater by summer precipitation slowly flowed and affected the groundwater in autumn.
Summarizing the future groundwater-level changes in the five observation stations in this study, it can be seen that while the groundwater level in spring (March–May) and summer (June–August) decreased due to an increase in evapotranspiration caused by the temperature rise and groundwater use increase. The average annual groundwater-level variation ranged from −19.5 to 5.9 cm in RCP 4.5 and −28.5 to 4.8 cm in RCP 8.5, confirming that the overall groundwater level was low in RCP 8.5.
Groundwater is a crucial component of the hydrologic cycle and many water-resource projects. Therefore, potential effects of climate change on recharge deserve more attention than have been received to date [53]. The Korean peninsula is known to be severe in managing water resources because of climate change causing extreme drought and floods. Because managed aquifer recharge (MAR) can be an adaptive method to climate change in Korea, and it can give us some buffering time and space to manage water resources, the development of various types of MAR schemes based on site-specific conditions in Korea is suggested for the future [54].
Scientists currently lack the necessary tools and data, such as long-term continuous monitoring of recharge processes, to confidently predict recharge responses to future climate change in most environments. To date, it is unknown in many regions of the world whether recharge will increase or decrease under predicted climate change [55]. Therefore, the results of this study are can be available as basic data and analysis methods for future climate change adaptation.

4. Conclusions

In this study, a reliable hydrologic cycle was reproduced by using the SWAT model, which is a physical semi-distributed continuous rainfall runoff model and performing calibration and validation with the operation and groundwater-level observation data of the multi-purpose dams and multi-function weirs in the Geum River Basin (9645.5 km2). In addition, the future ground water level was estimated by applying climate change scenarios. The main results of this study are as follows:
(1)
Calibration (2005–2009) and validation (2010–2015) were performed using the inflow and storage amount data of two multi-purpose dams (Yongdam Dam and Daecheong Dam) and three multi-function weirs (Sejong Weir, Gongju Weir, and Baekjae Weir). As a result of assessing the applicability of the model, R2 was 0.85, NSE was 0.66, RMSE was 1.24 mm/day, and PBIAS was 2.32%. It was found that the statistical analysis results were statistically significant for all calibration and validation locations.
(2)
After performing offset calibration so that the past data (Historical) and past meteorological data (baseline) of climate change scenarios could have similarity, the three periods in the future, i.e., 2020s (2010–2039), 2050s (2040–2069), and 2080s (2070–2099), were analyzed based on Historical. As a result of analyzing climate change in the RCP 4.5 and 8.5 scenarios, the future precipitation increased by 4.7–13.6% compared to Historical in RCP 4.5 and by 1.3–13.0% in RCP 8.5. The future temperature increased by 0.9–2.4 °C compared to Historical in RCP 4.5 and by 1.2–5.3 °C in RCP 8.5.
(3)
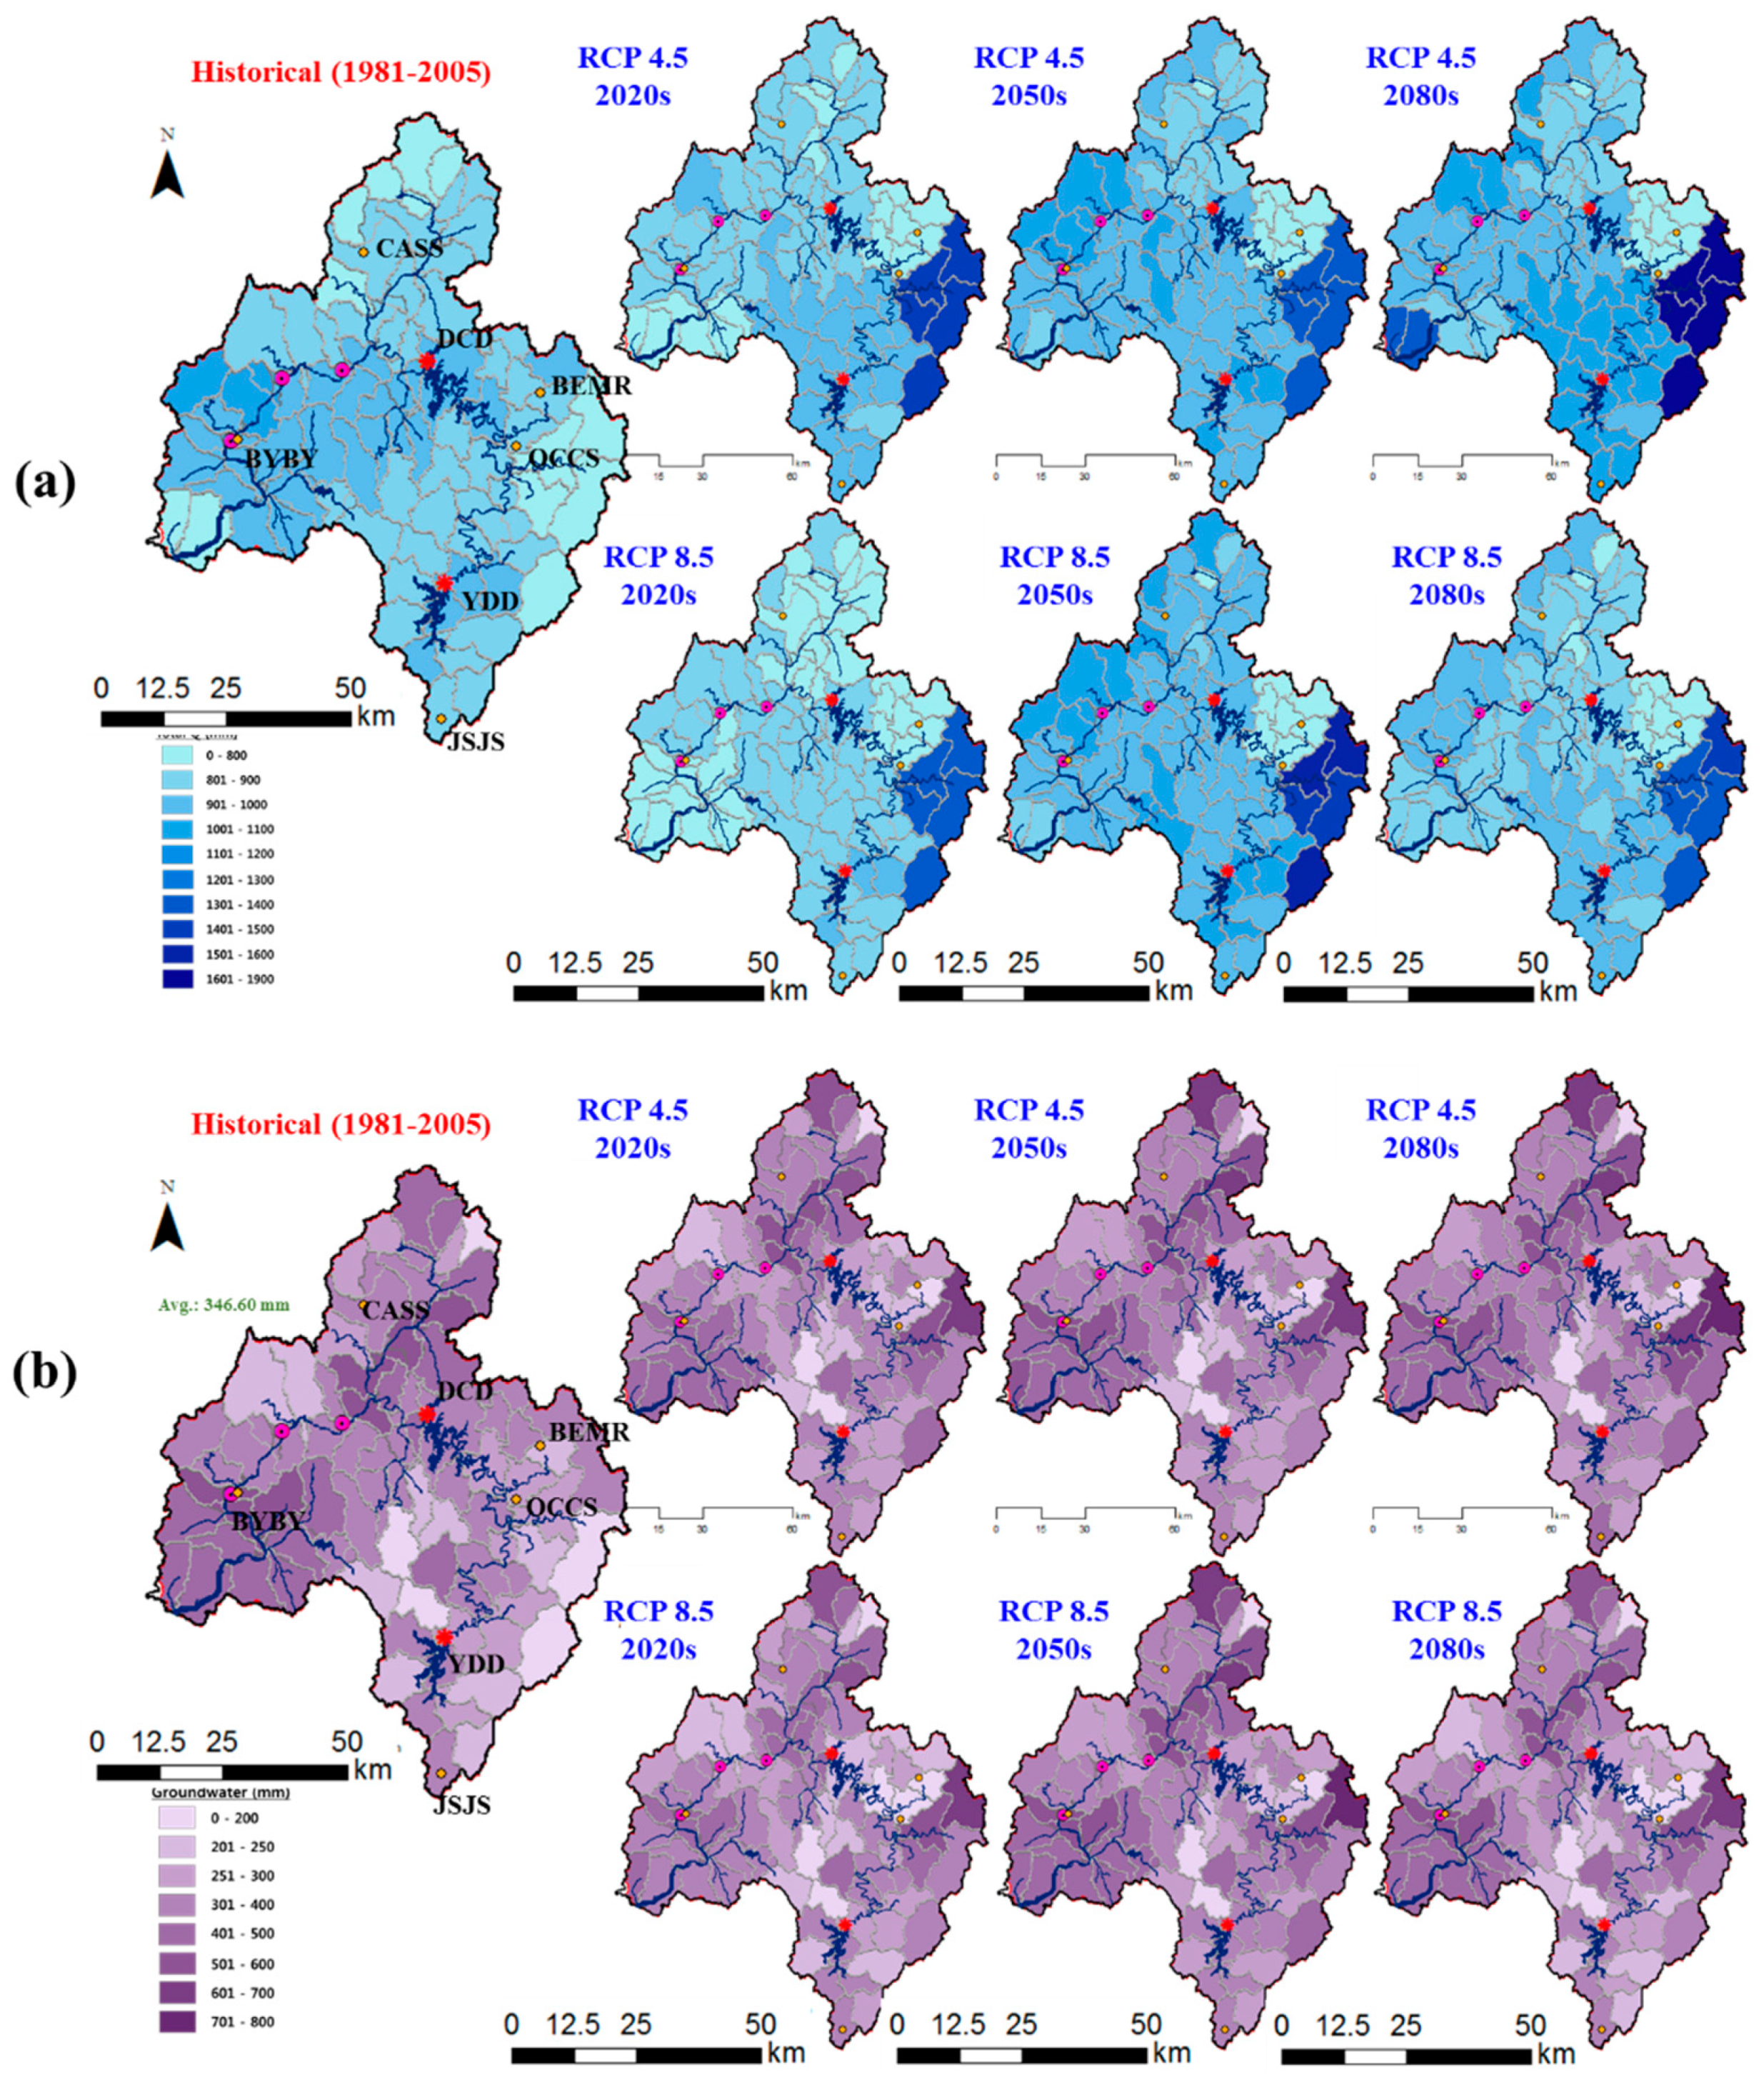
As a result of analyzing changes in the runoff characteristics due to climate change, the total runoff, groundwater recharge, and evapotranspiration increased by 14.6%, 10.2%, and 17.2% compared to Historical in RCP 4.5 2080s. In particular, as a result of analyzing changes in the groundwater recharge compared to Historical from a spatial perspective, the groundwater recharge decreased in all climate scenarios and assessment periods in the case of Bocheongchun Watershed in the upstream area of the Daecheong Dam. In particular, when 2020s of the RCP 8.5 scenario, which exhibited the largest decrease, was examined from a spatial perspective, it was found that the groundwater recharge decreased not only in the upstream area of the Daecheong Dam but also in the sub-watershed that included farmlands around the downstream areas of the Geum River and Nonsancheon.
(4)
As a result of collecting the national annual groundwater survey data for the past 40 years, and estimating the groundwater use in the future climate change assessment periods, the results increased by 4.6%, 7.7%, and 9.6% compared to the data in Historical. In the SWAT simulation results, however, the groundwater recharge for 2020s decreased by −0.4% and −6.2% compared to Historical in the RCP 4.5 and 8.5 scenarios, indicating that the groundwater amount will be further reduced if the increase trend of the groundwater usage is considered in the future.
(5)
Summarizing the groundwater-level variation due to climate change revealed that the groundwater level of spring (March–May) and summer (June–August) decreased, while that of autumn (September–November) increased due to an increase in precipitation. The average annual groundwater-level variation ranged from −19.5 to 5.9 cm in RCP 4.5 and −28.5 to 8.5 cm in RCP 8.5.
The groundwater-level change is a very important element for identifying the increase and decrease in groundwater amount in aquifers. While the decrease in groundwater level represents that the groundwater amount in aquifers is being depleted, the increase means that groundwater is being introduced to aquifers and the groundwater amount is increasing [56]. Among the results of this study, the groundwater-level variation in all scenarios ranged from −13.0 to 8.0 cm when the groundwater usage was considered. Although the variation was not significantly felt, the problem of pumping water in excess of the previous usage may occur in the event of extreme water shortage, such as a drought. In this case, the groundwater level will sharply drop, which can cause a serious problem with the management of water resources in the basin. Moreover, even in watersheds located within the same boundaries, changes in the groundwater recharge and groundwater level can be different depending on the land use status or soil quality of the corresponding sub-watershed, as shown in Figure 5 and Table 5. Therefore, studies on the groundwater recharge and groundwater level must be systematically conducted to respond to climate change and secure water resources in the future by establishing guidelines on groundwater management for each small watershed.
The results of this study have limitations in perfectly reproducing some groundwater descent characteristics because the groundwater level was estimated by extracting the calculation results of HRU at locations with a groundwater-level observation station and adding changes to the parameter value. In addition, the results contain uncertainties of the applied climate change scenarios and hydrological simulation results. However, it is expected that the results of this study will be positively used for an efficient management of water resources for adaptation to climate change by suggesting a method for identifying and predicting the behavior of the groundwater and groundwater level due to climate change, using the standard units of watersheds and statistical analysis results for each watershed, day, year, and season.

Author Contributions

J.L. and S.K. (Seongjoon Kim) conceived and designed the experiments, S.K. (Sehoon Kim) and C.J. analyzed the data, and J.L., C.J. and S.K. (Seongjoon Kim) wrote the paper.

Funding

This subject is supported by Korea Ministry of Environment (MOE) as “Water Management Research Program (RE201901080)”.

Acknowledgments

This subject is supported by Korea Ministry of Environment (MOE) as “Water Management Research Program (RE201901080)”.

Conflicts of Interest

The authors declare no conflicts of interest.

References

  1. IPCC. Comtribution of working groups I, II and III to the Fourth Assessment Report of the Intergovernmental Panel on Climate Change, Core Writing Team; Pachauri, R.K., Reisinger, A., Eds.; IPCC: Geneva, Switzerland, 2007; p. 102. [Google Scholar]
  2. IPCC. Contribution of Working Groups I, II and III to the Fifth Assessment Report of the Intergovernmental Panel on Climate Change, Core Writing Team; Pachauri, R.K., Meyer, L.A., Eds.; IPCC: Geneva, Switzerland, 2013; p. 151. [Google Scholar]
  3. Song, S.-H.; Choi, K.-J. An Appropriate Utilization of Agricultural Water Resources of Jeju Island with Climate Change (I). J. Soil Groundw. 2012, 17, 62–70. [Google Scholar] [CrossRef] [Green Version]
  4. Chung, I.-M.; Kim, J.; Lee, J.; Chang, S.W. Status of Exploitable Groundwater Estimations in Korea. J. Eng. Geol. 2015, 25, 403–412. [Google Scholar] [CrossRef] [Green Version]
  5. Won, K.-S.; Chung, S.Y.; Lee, C.-S.; Jeong, J.-H. Replacement of Saline Water through Injecting Fresh Water into a Confined Saline Aquifer at the Nakdong River Delta Area. J. Eng. Geol. 2015, 25, 215–225. [Google Scholar] [CrossRef]
  6. Lee, J.-Y. Lessons from three groundwater disputes in Korea: Lack of comprehensive and integrated investigation. Int. J. Water 2017, 11, 59. [Google Scholar] [CrossRef]
  7. Lee, J.-Y.; Kwon, K.D. Current Status of Groundwater Monitoring Networks in Korea. Water 2016, 8, 168. [Google Scholar] [CrossRef]
  8. Lee, M.J.; Lee, J.H. Coupled Model Development between Groundwater Recharge Quantity and Climate Change Using GIS. J. Korea Assoc. Geogr. Inf. Studies 2011, 14, 36–51. [Google Scholar] [CrossRef] [Green Version]
  9. Ministry of Land Infrastructure and Transport (MOLIT). Groundwater Annual Report; MOLIT: Sejong, Korea, 2016.
  10. Kim, N.W.; Chung, I.M.; Won, Y.S.; Arnold, J.G. Development and application of the integrated SWAT–MODFLOW model. J. Hydrol. 2008, 356, 1–16. [Google Scholar] [CrossRef]
  11. Church, T.M. An underground route for the water cycle. Nat. Cell Boil. 1996, 380, 579–580. [Google Scholar] [CrossRef]
  12. Kim, S.J.; Choi, H.S. Groundwater Recharge Assessment via Grid-based Soil Moisture Route Modeling. J. Korea Water Resour. Assoc. 2000, 33, 61–72. [Google Scholar]
  13. Kwon, H.J.; Lim, H.J.; Park, N.S.; Kim, S.J. Assessment of Available Ground Water Resources based on Topographical and Soil Characteristics in a Watershed. J. Korea Soc. Civ. Eng. 2005, 25, 19–25. [Google Scholar]
  14. Kim, N.-W.; Chung, I.-M.; Lee, J.-W.; Won, Y.-S. Analysis of Hydrological Processes for Musim River Basin by Using Integrated Surface water and Groundwater Model. J. Korea Water Resour. Assoc. 2007, 40, 419–430. [Google Scholar] [CrossRef]
  15. Chung, I.M.; Kim, N.W. Method of advancing groundwater management in Korea. J. Korea Water Resour. Assoc. 2011, 41, 10–14. [Google Scholar]
  16. Chung, I.M.; Lee, J.W.; Kim, N.W. Estimating Exploitable groundwater Amount in Musimchen Watershed by Using an Integrated Surface Water-Groundwater model. The Econ. Environ. Geol. 2011, 44, 433–442. [Google Scholar] [CrossRef]
  17. Kim, N.W.; Kim, Y.J.; Chung, I.M. Sensitivity Analysis of Hydrogeologic Parameters by Groundwater Table Fluctuation Model in Jeju Island. J. Korea Soc. Civ. Eng. 2014, 34, 1409–1420. [Google Scholar] [Green Version]
  18. Ahn, S.R.; Lee, J.W.; Jang, S.S.; Kim, S.J. Large Scale SWAT Watershed Modeling Considering Multi-purpose Dams and Multi-function Weirs Operation—For Namhan River Basin. J. Korea Soc. Agric. Eng. 2016, 58, 21–35. [Google Scholar]
  19. Shirmohammadi, B.; Vafakhah, M.; Moosavi, V.; Moghaddamnia, A. Application of several data-driven techniques for predicting groundwater level. Water Resour. Manag. 2013, 27, 419–432. [Google Scholar] [CrossRef]
  20. Pfannerstill, M.; Guse, B.; Fohrer, N. A multi-storage groundwater concept for the SWAT model to emphasize nonlinear groundwater dynamics in lowland catchments. Hydrol. Process. 2014, 28, 5599–5612. [Google Scholar] [CrossRef]
  21. Izady, A.; Davary, K.; Alizadeh, A.; Ziaei, A.N.; Akhavan, S.; Alipoor, A.; Brusseau, M.L. Groundwater conceptualization and modeling using distributed SWAT-based recharge for the semi-arid agricultural Neishaboor plain. J. Hydrogeol. Iran. 2015, 23, 47–68. [Google Scholar] [CrossRef]
  22. Jin, G.; Shimizu, Y.; Onodera, S.; Saito, M.; Matsumori, K. Evaluation of drought impact on groundwater recharge rate using SWAT and Hydrus models on an agricultural island in western Japan. Proc. Int. Assoc. Hydrol. Sci. 2015, 371, 143–148. [Google Scholar] [CrossRef] [Green Version]
  23. Sun, X.; Bernard-Jannin, L.; Garneau, C.; Volk, M.; Arnold, J.G.; Srinivasan, R.S.; Sauvage Sánchez-Pérez, J.M. Improved simulation of river water and groundwater exchange in an alluvial plain using the SWAT model. J. Hydrol. Process. 2016, 30, 187–202. [Google Scholar] [CrossRef]
  24. Ahn, S.-R.; Park, M.-J.; Park, G.-A.; Kim, S.-J. Assessing Future Climate Change Impact on Hydrologic Components of Gyeongancheon Watershed. J. Korea Water Resour. Assoc. 2009, 42, 33–50. [Google Scholar] [CrossRef] [Green Version]
  25. Lee, J.M.; Jung, Y.; Park, Y.; Kang, H.; Lim, K.J.; Kim, H. Assessment of Future Climate Change Impact on Groundwater recharge, Baseflow and Sediment in Steep Sloping Watershed. J. Wetl. 2014, 16, 173–185. [Google Scholar] [CrossRef] [Green Version]
  26. Park, J.-Y.; Jung, H.; Jang, C.-H.; Kim, S.J. Assessing Climate Change Impact on Hydrological Components of Yongdam Dam Watershed Using RCP Emission Scenarios and SWAT Model. J. Korea Soc. Agric. Eng. 2014, 56, 19–29. [Google Scholar]
  27. Dessu, S.B.; Melesse, A.M. Impact and uncertainties of climate change on the hydrology of the Mara River basin, Kenya/Tanzania. J. Hydrol. Process. 2013, 27, 2973–2986. [Google Scholar] [CrossRef]
  28. Awan, U.K.; Ismaeel, A. A new technique to map groundwater recharge in irrigated areas using a SWAT model under changing climate. J. Hydrol. 2014, 519, 1368–1382. [Google Scholar] [CrossRef]
  29. Fiseha, B.M.; Setegn, S.G.; Melesse, A.M.; Volpi, E.; Fiori, A. Impact of Climate Change on the Hydrology of Upper Tiber River Basin Using Bias Corrected Regional Climate Model. Water Resour. Manag. 2014, 28, 1327–1343. [Google Scholar] [CrossRef]
  30. Verma, S.; Bhattarai, R.; Bosch, N.S.; Cooke, R.C.; Kalita, P.K.; Markus, M. Climate Change Impacts on Flow, Sediment and Nutrient Export in a Great Lakes Watershed Using SWAT. CLEAN–Soil Air Water 2015, 43, 1464–1474. [Google Scholar] [CrossRef]
  31. Goodarzi, M.; Abedi-Koupai, J.; Heidarpour, M.; Safavi, H.R. Evaluation of the effects of climate change on groundwater recharge using a hybrid method. Water Resour. Manag. 2016, 30, 133–148. [Google Scholar] [CrossRef]
  32. Lee, J.W.; Jung, C.G.; Kim, D.R.; Kim, S.J. Assessment of Future climate change impact on groundwater level behavior in Geum river basin using SWAT. J. Korea Water Resour. Assoc. 2018, 51, 247–261. [Google Scholar]
  33. Arnold, J.G.; Williams, J.R.; Srinivasan, K.; King, W. SWAT manual, USDA; Agricultural Research Service and Black land Research Center: Temple, TX, USA, 2005. [Google Scholar]
  34. Neitsch, S.L.; Arnold, J.G.; Kiniry, J.R.; Williams, J.R. Soil and Water Aseessment Tool (SWAT) Theoretical Documentation. In Texas Water Reosurces Institute Technical Report; Texas A&M University: Temple, TX, USA, 2001; pp. 340–367. [Google Scholar]
  35. Lee, D.R.; Yoon, Y.N. Estimation and Analysis of Groundwater Recharge in Korea. J. Korea Soc. Civ. Eng. 1996, 16, 321–334. [Google Scholar]
  36. Bastiaanssen, W.G.; Feddes, R.A. A new technique to estimate net groundwater use across large irrigated areas by combining remote sensing and water balance approaches, Rechna Doab, Pakistan. Hydrogeol. J. 2005, 13, 653–664. [Google Scholar]
  37. Kim, J.W.; Jun, H.P.; Lee, C.J.; Kim, N.J.; Kim, G.B. Groundwater-use Estimation Method Based on Field Monitoring Data in South Korea. The J. Eng. Geol. 2013, 23, 467–476. [Google Scholar] [CrossRef] [Green Version]
  38. Crosbie, R.S.; Peeters, L.J.; Herron, N.; McVicar, T.R.; Herr, A. Estimating groundwater recharge and its associated uncertainty: Use of regression kriging and the chloride mass balance method. J. Hydrol. 2018, 561, 1063–1080. [Google Scholar] [CrossRef]
  39. Yoo, J.H.; Kim, K.H.; Park, Y.G.; Lee, G.H.; Kim, S.J.; Jung, C.G. A Study on the Use of GIS-based Time Series Spatial Data for Streamflow Depletion Assessment. J. Korean Assoc. Geogr. Inf. Studies. 2018, 21, 50–63. [Google Scholar]
  40. Ministry of Land, Infrastructure and Transportation of Korea (MOLIT). The Long-Term Comprehensive Water Resource Plan (2011–2020): The Second Revised Water Vision 2020; MOLIT: Sejong, Korea, 2011. (In Korean)
  41. Burroughs, E.R.; Marsden, M.A.; Haupt, H.F. Volume of snowmelt intercepted by logging roads. J. Irrig. Drain. Div. Am. Soc. Civ. Eng. 1972, 98, 1–12. [Google Scholar]
  42. Jung, C.G.; Lee, J.W.; Lee, Y.G.; Kim, S.J. Quantification of Stream Drying Phenomena Using Grid-Based Hydrological Modeling via Long-Term Data Mining throughout South Korea including Ungauged Areas. Water 2019, 11, 477. [Google Scholar] [CrossRef]
  43. Giorgi, F.; Francisco, R. Evaluating uncertainties in the prediction of regional climate change. Geophys. Lett. 2000, 27, 1295–1298. [Google Scholar] [CrossRef] [Green Version]
  44. Aggarwal, P.K.; Mall, R.K. Climate Change and Rice Yields in Diverse Agro-Environments of India. II. Effect of Uncertainties in Scenarios and Crop Models on Impact Assessment. Clim. Chang. 2002, 52, 331–343. [Google Scholar] [CrossRef]
  45. Velázquez, J.A.; Schmid, J.; Ricard, S.; Muerth, M.; St-Denis, B.G.; Minville, M.; Chaumont, D.; Caya, D.; Ludwig, R.; Turcotte, R. An ensemble approach to assess hydrological models’ contribution to uncertainties in the analysis of climate change impact on water resources. Hydrol. Earth Sci. 2013, 17, 565–578. [Google Scholar] [CrossRef]
  46. Kum, D.; Lim, K.J.; Jang, C.H.; Ryu, J.; Yang, J.E.; Kim, S.J.; Kong, D.S.; Jung, Y. Projecting Future Climate Change Scenarios Using Three Bias-Correction Methods. Adv. Meteorol. 2014, 2014, 1–12. [Google Scholar] [CrossRef]
  47. Ahn, S.R.; Park, G.A.; Kim, S.J. Assessment of Agricultural Water Supply Capacity Using MODSIM-DSS Coupled with SWAT. J. Korean Soc. Civ. Eng. 2013, 33, 507–519. [Google Scholar] [CrossRef] [Green Version]
  48. Ahn, S.R.; Jeong, J.H.; Kim, S.J. Assessing drought threats to agricultural water supplies under climate change by combining the SWAT and MODSIM models for the Geum River basin, South Korea. Hydrol. Sci. J. 2016, 61, 2740–2753. [Google Scholar] [CrossRef]
  49. Mkhwanazi, M.; Chavez, J.L.; Rambikur, E.H. Comparison of Large aperture scintillometer and satellitebased energy balance models in sensible heat flux and crop evapotranspiration determination. J. Remote Sens. Appl. 2012, 12, 24–30. [Google Scholar]
  50. Ministry of Land Infrastructure and Transport (MOLIT). Groundwater Annual Report; MOLIT: Sejong, Korea, 2014.
  51. Kumar, C.P.; Seethapathi, P.V. Assessment of natural groundwater recharge in Upper Ganga Canal command area. J. Appl. Hydrol. 2002, 15, 13–20. [Google Scholar]
  52. Kumar, C.P. Climate change and its impact on groundwater resources. Int. J. Eng. Sci. 2012, 1, 43–60. [Google Scholar]
  53. Dettinger, M.D.; Earman, S. Western Ground Water and Climate Change—Pivotal to Supply Sustainability or Vulnerable in Its Own Right? Association of Ground Water Scientists and Engineers: San Francisco, CA, USA, 2007. [Google Scholar]
  54. Lee, J.Y.; Lee, K.K.; Hamm, S.Y.; Kim, Y. Fifty years of groundwater science in Korea: A review and perspective. Geosci. J. 2017, 21, 951–969. [Google Scholar] [CrossRef]
  55. Green, T.R.; Taniguchi, M.; Kooi, H.; Gurdak, J.J.; Allen, D.M.; Hiscock, K.M.; Treidel, H.; Aureli, A. Beneath the surface of global change: Impacts of climate change on groundwater. J. Hydrol. 2011, 405, 532–560. [Google Scholar] [CrossRef]
  56. Cho, B.W.; Yun, U.; Lee, B.D.; Ko, K.S. Hydrogeological Characteristics of the Wangieon-ri PCWC area, Nonsan-city, with an Emphasis on water Level Variations. J. Eng. Geol. 2012, 22, 195–205. [Google Scholar] [CrossRef]
Figure 1. Study area and monitoring points [32].
Water 11 00949 g001
Figure 2. Geographic information system (GIS) data for Geum River Basin: (a) digital elevation model (DEM), (b) surface soil, (c) subsoil and (d) land use.
Water 11 00949 g002
Figure 3. Future ground water use data.
Water 11 00949 g003
Figure 4. Calibration and verification results for groundwater level at (a) JSJS, (b) OCCS, (c) BEMR, (d) CASS, and (e) BYBY.
Water 11 00949 g004
Figure 5. The results of total runoff (a) and ground recharge (b) by future climate change scenarios.
Water 11 00949 g005
Figure 6. Future groundwater level change by RCP climate change scenarios.
Water 11 00949 g006
Table 1. Changes in the future projected seasonal precipitation and temperature under the RCP 4.5 and 8.5 scenarios of the HadGEM3-RA.
PeriodsPrecipitation (mm)Temperature
Spr.Sum.Aut.Win.TotalSpr.Sum.Aut.Win.Total
Baseline
Historical
219.6
223.3
752.7
837.5
243.2
255.2
89.9
81.5
1305.3
1397.5
11.3
11.3
23.6
23.2
13.3
13.3
−0.6
−1.8
11.9
11.5
RCP 4.52020s351.6762.4259.189.61462.712.624.813.8−1.612.4
2050s340.6817.0268.387.21513.213.525.815.0−0.713.4
2080s380.3805.1297.2105.31587.913.926.515.6−0.313.9
RCP 8.52020s362.7718.1241.293.41415.413.125.514.3−1.912.7
2050s344.6835.1279.7119.61579.014.727.316.20.614.7
2080s365.0793.2258.4141.11557.816.829.418.52.816.9
Spr.: Spring (March–May), Sum.: Summer (June–August), Aut.: Autumn (September–November) and Win.: Winter (December–February).
Table 2. The calibrated parameters for the SWAT.
ParameterDefinitionRangeAdjusted Value
YDDDCDSJWGJWBJW
Runoff
CH_N(2)Manning’s “n” value for the tributary channel0.01–300.0160.0140.0140.0140.014
Evapotranspiration
ESCOSoil evaporation compensation coefficient0–10.950.950.950.950.95
Groundwater
GW_DELAYDelay time for aquifer recharge (days)0–50015050303131
GWQMNThreshold water level in shallow aquifer for base flow (mm)0–500010001000100010001000
ALPHA_BFBase flow recession constant0–10.20.20.20.20.2
REVAPMNThreshold water level in shallow aquifer for revap (mm)0–1000750750750750750
GW_REVAPGroundwater revap coefficient0.02–0.20.020.020.020.020.02
Reservoir
RES_ESAReservoir surface area when the reservoir is filled to the emergency spillway (ha)-37007420350350350
RES_EVOLVolume of water needed to fill the reservoir to the emergency spillway (104 m3)-81514905.715.625
RES_PSAReservoir surface area when the reservoir is filled to the principal spillway (ha)-33906750300300300
RES_PVOLVolume of water needed to fill the reservoir to the principal spillway (104 m3)-74212415.615.524
RES_VOLInitial reservoir volume (104 m3)-398765.415.524
RES_KHydraulic conductivity of the reservoir bottom (mm/h)0–10.30.10.10.10.1
EVRSVLake evaporation coefficient0–10.60.60.60.60.6
Table 3. Summary of model calibration and validation for dam inflow, dam storage and groundwater level (GWL).
Model OutputEvaluation CriteriaYDDDCDSJWGJWBJW
Cal.Val.Cal.Val.Cal.Val.Cal.Val.Cal.Val.
Dam inflow
(mm)
R20.670.700.750.710.750.640.800.610.810.62
NSE0.550.580.700.640.690.640.760.570.770.50
RMSE
(mm/day)
1.581.741.601.261.180.460.991.081.001.55
PBIAS (%)10.5−0.589.776.277.48−0.941.24−12.5−2.88−0.41
Dam storage
(106m3)
R20.680.780.650.680.550.700.550.720.570.31
NSE0.790.940.950.930.920.980.980.990.991.00
RMSE
(mm/day)
2.191.572.022.100.120.150.250.280.270.16
PBIAS (%)1.268.99−16.9−3.865.341.002.62−0.93−0.381.83
Model OutputEvaluation CriteriaJSJSOCCSBEMRCASSBYBY
Cal.Val.Cal.Val.Cal.Val.Cal.Val.Cal.Val.
GWL.R20.640.510.600.600.560.510.680.580.680.57
Cal.: Calibration (2005–2009), Val.: validation (2010–2015), and GWL: Ground water level.
Table 4. Summary of the future predicted annual hydrological component by climate change scenarios (values in parentheses indicated change based on Historical).
ScenarioTemperature
( °C)
Precipitation
(mm)
Total Runoff
(mm)
Groundwater Recharge (mm)ET
(mm)
Historical11.5 1398 866.2 346.6 520.1
RCP 4.52020s12.4(+0.9 °C)1463(4.7%)890.5(2.8%)353.7(2.1%)561.7(8.0%)
2050s13.4(+1.9 °C)1513(8.3%)959.9(10.8%)374.5(8.1%)576.3(10.8%)
2080s13.9(+2.4 °C)1588(13.6%)1015.0(17.2%)387.3(11.7%)584.2(12.3%)
RCP 8.52020s12.7(+1.2 °C)1415(1.3%)838.8(−3.2%)326.1(−5.9%)557.1(7.1%)
2050s14.7(+3.2 °C)1579(13.0%)975.9(12.7%)379.2(9.4%)590.5(13.5%)
2080s16.9(+5.4 °C)1558(11.5%)894.4(3.3%)342.1(−1.3%)598.7(15.1%)
Table 5. Summary of the future predicted seasonal groundwater level by climate change scenario.
STASeasonHistoricalRCP 4.5 (cm)RCP 8.5 (cm)
2020s2050s2080s2020s2050s2080s
JSJSSpring412.800.520.310.460.550.370.58
Summer413.68−0.80−0.43−0.80−1.31−0.72−1.57
Autumn412.76−0.24−0.44−0.20−0.34−0.04−0.66
Winter412.450.01−0.03−0.01−0.050.060.28
Avg.412.92−0.12−0.15−0.14−0.29−0.08−0.34
OCCSSpring136.22−23.3−1.29.0−11.5−10.6−3.1
Summer136.81−43.3−30.0−24.6−60.0−76.1−90.7
Autumn136.4315.911.411.6−26.75.4−35.3
Winter136.2919.221.322.116.021.815.0
Avg.136.44−7.90.44.5−20.5−14.9−28.5
BEMRSpring125.39−1.65.58.6−4.53.01.1
Summer125.70−22.9−9.3−15.7−22.4−36.2−31.0
Autumn125.482.73.22.2−4.9−13.9−9.9
Winter125.454.65.14.64.55.48.6
Avg.125.51−4.31.1−0.1−6.8−10.4−7.8
CASSSpring125.3714.510.822.56.919.024.5
Summer126.06−14.9−2.3−21.3−22.8−17.0−27.9
Autumn125.4510.112.111.19.512.49.3
Winter125.482.92.94.21.54.313.4
Avg.125.593.25.94.1−1.24.74.8
BYBYSpring2.231.1−1.213.07.40.18.7
Summer3.94−52.157.4−38.6−69.9−26.9−33.6
Autumn2.65−19.4−27.5−15.5−28.9−34.7−37.4
Winter2.15−7.6−7.5−3.4−5.6−4.79.7
Avg.2.74−19.55.3−11.1−24.2−16.6−13.1

