Article

The Impacts of Climate Variation and Land Use Changes on Streamflow in the Yihe River, China

1
College of Environment and Planning, Henan University, Kaifeng 475004, China
2
Key Laboratory of Geospatial Technology for the Middle and Lower Yellow River Regions, Ministry of Education, Kaifeng 475004, China
*
Authors to whom correspondence should be addressed.
Water 2019, 11(5), 887; https://doi.org/10.3390/w11050887
Submission received: 31 March 2019 / Revised: 17 April 2019 / Accepted: 22 April 2019 / Published: 27 April 2019
(This article belongs to the Special Issue Hydrological Impacts of Climate Change and Land Use/Land Cover Change)

Abstract

:
Climate variation and land use changes have been widely recognized as two major factors that impact hydrological processes. However, it is difficult to distinguish their contributions to changes in streamflow. Quantifying their contributions to alteration of streamflow is especially important for the sustainable management of water resources. In this study, the changes in streamflow for the period of 1960–2008 at two stations (Dongwan and Luhun) were analyzed in the Yihe watershed in China based on hydrological data series and climate parameters. Using a non-parametric Mann–Kendall (MK) and Pettitt’s test, as well as Budyko analysis, we first examined the trends of hydroclimatic variables and the breakpoint of annual streamflow over the past 50 years. Subsequently, we evaluated the contributions of annual precipitation (P), potential evapotranspiration (PET), and land use condition (represented by w), respectively, to streamflow variation. We observed a decreasing trend for P, as well as increasing trends for PET and w. Annual streamflow showed a significant downward trend with an abrupt change occurring in 1985 during the period of 1960–2008. Accordingly, we divided the studied period into two sub-periods: period I (1960–1985) and period II (1986–2008). The sensitivity of the streamflow to the different environmental factors concerned in this study differed. Streamflow was more sensitive to P than to PET and w. The decrease in P was the greatest contributor to the decline in streamflow, which accounted for 50.01% for Dongwan and 55.36% for Luhun, followed by PET, which accounted for 24.25% for Dongwan and 24.45% for Luhun, and land use change was responsible for 25.25% for Dongwan and 20.19% for Luhun. Although land use change plays a smaller role in streamflow reduction, land use optimization and adjustment still have great significance for future water resource management, since climate variation is difficult to control; however, the pattern optimization of land use can be achieved subjectively.

1. Introduction

It is widely documented that changes in climate and land use are key factors that modify flow regimes [1,2]. On the one hand, climate variation, reflected by the rising temperature and evapotranspiration, as well as by the intensities and patterns of rainfall, is considered to have a significant impact on local, regional, and even global hydrological processes [3]. For example, Mexico and Turkey have suffered much damage from decreasing precipitation [4,5]. Drought stress has increased in southern Europe due to greater atmospheric evaporative demand as a result of temperature rise [6]. On the other hand, land use changes, primarily caused by human activities [7], can influence water distribution along different hydrological pathways through vegetation interception, soil water infiltration, and streamflow, hence altering hydrological processes [8]. One of the well-known examples of such land use change-induced effects in the world is the Aral Sea in Eurasia [9,10], where ~92% of the total water volume has been lost over the past four decades [11]. This has been put down to large-scale irrigation water consumption due to the increase of paddy field areas [12,13]. In addition, the impact of land use on hydrological processes is also well-supported by the evidence from hydrological changes caused by dam construction [14,15]. It can be seen that the effect of climate variation and land use changes on hydrological regimes are significant, and that such effects will likely continue to increase. Therefore, there is a need to investigate the hydrological response to these two factors.
Many previous studies have focused on changes in hydrological processes induced by climate variation or land use change. For instance, streamflow variation is closely related to precipitation, temperature, and evapotranspiration. The response of streamflow to changes in precipitation has been shown to be more sensitive than to changes in temperature and evapotranspiration, despite the fact that the latter two factors can also increase or decrease streamflow [16,17,18]. In terms of the effect of land use change on streamflow, rangeland makes a great contribution to streamflow decrease; in contrast, the expansion of cultivated and built-up land areas and the shrinking of forest areas will increase streamflow [19,20]. These findings show a consistency with the results reported by Nunes et al. [21]. Although these studies have provided crucial insights into the ongoing changes in hydrological processes, they focus only on the qualitative evaluation of streamflow change with a single factor (either land use or climate). Few quantitative attempts have been made to thoroughly understand the effects of changes in climate and land use on hydrological process, because their contributions to hydrological alterations are difficult to separate and change over time.
According to previous studies, paired catchments have been widely studied to compare the impacts of climate (mainly precipitation and temperature) and human activities (mainly land use) on hydrological alteration. For instance, Huang et al. [22] demonstrated that cumulative runoff yield in a afforestation watershed was reduced by 32% compared with that in a natural grassland watershed. Arrigoni et al. [23] and Vogel et al. [24] found that human activities had greater effects on the changes in streamflow and flood peaks in the United States. This method, however, requires a long duration and is only available in small catchments, since significant differences in the underlying surface exists in large catchments [25]. In reality, it is also difficult to find a comparable catchment free of human influence for such an experiment. With further research, based on GIS technology, some physical-based hydrological models have been established and applied to identify the contribution of climate and land use to streamflow changes in a specific catchment. Such models include SWAT (Soil Water Assessment Tool) [14], the Precipitation–Runoff Modeling System [26], the BASINS (Better Assessment Science Integrating Point and Non-point Sources) model [27], and MIKE (Alluvial River and Floodplain Model) [28], which provide effective tools for promoting the development of hydrological research. However, too many parameters are needed to implement these models, involving hydrological, meteorological, remote sensing, and topographical details for hydrological study of long-time series. Anyway, the lack of standard paired catchments and sufficient data has partly impeded the development of hydrology. Consequently, an alternative is desirable to counter these deficiencies. The method proposed by Budyko [29] based on water balance was a useful approach to normalize hydrological observation among a wide range of ecological and hydroclimatic conditions, and it could assess the secondary controls of climate, vegetation, and landscape on water balance at the watershed scale [30,31]. Although the Budyko framework was only meant to explain the long-term or mean annual water balance in a certain catchment, it has been developed to account for temporal and spatial variability [32]. This method has been confirmed to be applicable in northern and southern China [33,34], though not in central China, especially in the hilly watershed.
Notable evidence of economic and demographic changes has been found in the hilly areas during the past decades [35]. The hilly regions, especially in China, have suffered depopulation and abandonment of traditional farming practices because a large number of farmers have migrated to cities. The reduction in population and agricultural activities has negatively affected the extension and intensity of agricultural drainage systems, hence ditching and channelization activity has decreased accordingly [36]. As a result, the lack of runoff controlling facilities (i.e., favorable drainage systems) and other conservation practices (i.e., afforestation) lead a hilly watershed to be less resilient to heavy rainfall and lead to the increased frequency of extreme events. As such, it is necessary to carry out research in hilly watershed areas.
Some attempts have been made to analyze the streamflow alteration caused by climate variation and land use change for the representative rivers worldwide, such as the Nile [20], Amazon River [37], Yangtze River [38], and Yellow River [39,40]. Among these, more attention has been paid to the Yellow River in China. Many investigations have been dedicated to the primary tributaries (e.g., Weihe, Qinhe, and Wudinghe) [41,42,43], while less have been dedicated to the smaller tributaries. Yihe River, a second-order tributary of the Yellow River originating from Xionger Mountain in Henan Province, China, is a typical hilly watershed. Great changes have taken place in terms of climate and land use in this watershed under the influence of global change and human activities [44]. Zhang et al. [45] found that the annual mean temperature in the 2000s was 1° higher than that in the 1980s in Luoyang City, in which the watershed is located. The annual mean precipitation presented a nearly 7% increase by the early 21st century, which also contributed to flood occurrence. Additionally, driven by socio-economic development, land use has undergone great changes in this watershed. For example, the increase in built-up land caused by a thriving tourism industry [46] has altered the runoff-generation condition of the underlying surface, making hydrological processes much more complicated. Previous studies conducted within this watershed have made little progress on the driving force of landscape dynamics [47], landscape simulation [44], and the hydrological alteration induced by land use with the SWAT model and statistical analysis [48]. Not only is there little research in this area, but the information on how much of the change in the historical streamflow record was caused by either climate variation or land use change is lacking. Therefore, the present study aims to thoroughly investigate the streamflow variation with a long-term time series in this hilly watershed, as well as provide some theoretical and methodological references for the study of same-scale hilly watersheds. The objectives of this study are (1) to investigate the spatiotemporal changes in streamflow, precipitation, and potential evapotranspiration with long historical data series, (2) to assess the sensitivity of streamflow to climatic factors and land use change, and (3) to quantify the contributions of climate variation and land use change to streamflow alteration.

2. Data collection and Analytical Methods

2.1. Study Area

Yihe River, situated in Luoyang City, Henan Province, in the central part of China (33°39′–34°41′ N, 111°19′–112°54′ E), originates from the Xionger Mountains, traveling 268 km from southwest to northeast with an average annual streamflow of 368 million cubic meters and flows across Luachuan, Songxian, Yichuan, and Yanshi counties before draining into the Yellow River and converging with the Luohe River (Figure 1a). The study area is subject to a temperate continental monsoon climate with hot-rainy summers and cold-rainless winters, accompanied by a mean annual temperature of 13 °C and a mean annual precipitation of 800 mm, mainly occurring during the rainy season from July to September. Land use types are dominated by forest and cultivated land, accounting more than 50% and 30%, respectively, followed by less than 10% of grass and built-up land areas. The reservoir, built in 1959, was located in the lower part of the watershed with a total storage of 1320 × 106 m3. It has played an important role in irrigation, flood control, and water supply around the area. This region covers an area of about 5538 km2 and is composed of mountains, hills, and plains, with elevations of 200–2159 m [47]. The mountainous area is generally confronted with the acute contradictions between more population and less land, followed by land fragmentation with human interference. In order to highlight the hilly watershed and reduce the limitation of available data, we selected the upper part of this watershed, mainly encompassing hills and mountains, as the study area (Figure 1b).

2.2. Data Collection

Daily streamflow records for the period from 1960 to 2008 obtained from Luhun and Dongwan gauging stations (Figure 1) were made available by the Yellow River Conservancy Commission of the Ministry of Water Resources. Short gaps in the daily data (approximately 3 days) were filled with linear interpolation. The daily streamflow data were aggregated into mean annual discharge in depth (mm) so as to be consistent with the units (mm) of precipitation and PET. Daily meteorological data composed of precipitation, mean, maximum, and minimum air temperatures, sunshine duration, wind speed, and relative humidity were used to calculate potential evapotranspiration using the Penman-Monteith equation [49]. This method involves all climatic and biological factors influencing evapotranspiration and has been widely recognized to provide better estimates of PET [50]. Dongwan is located in the upper part of the study area and its annual precipitation and PET were estimated with the data from five meteorological stations above this gauge station. Luhun lies in the main stream, and its meteorological parameters were obtained based on all the meteorological stations in the study area.
In addition, we collected land use data from two periods (1985 and 2005) retrieved from Landsat TM images based on the abrupt point to assess the impact of land use change on the hydrological regime. These images were processed by combining the visual interpretation with supervised classification supported by a geospatial analysis platform in ArcGIS 10.2 and ENVI 5.3 to identify the land cover categories. Six land use types were classified according to the measured vegetation cover and field investigation: forest land, cultivated land, grassland, built-up land, water body, and unused land (Figure A1).

2.3. Trend Test and Abrupt Point Detection for Hydroloclimatic Series

The significance of trends in annual hydrometeorological time series (such as temperature, precipitation, and streamflow over a long period) was estimated by the non-parametric Mann-Kendall (MK) test [51,52]. This rank-based statistical method is extensively applied to series data that neither follow certain distribution rules nor are affected by a small number of outliers, thereby performing well with robustness for non-normally distributed and censored data [34]. A Z statistic and the slope (β) of the trend were assessed based on the M-K test. The detailed calculation can be obtained from Zhang et al. [30] and Wu et al. [53]. The non-parametric Mann–Kendall–Sneyers test (MKS) proposed by Sneyers [54] was applied to locate the abrupt change points. For more detailed information on the MKS algorithm, the reports by Mwangi et al. [55] and Zhang et al. [56] can be referenced. In order to further verify the abrupt location, Pettitt’s test was used to determine the change point more certainly. This method is a sort of non-parametric trend test and is commonly applied to detect a single change point in hydrometeorological time series [14,15]. The null hypothesis in this test is H0—some T variables follow one or more distributions that have the same location parameters (therefore, no change); the other alternative hypothesis is HA—a change point exists in the time series. This method was defined in Equation (1). The change point is detected at KT if the values are significant. The probable significance of KT is estimated in Equation (2).
K T = max | U t , T | ,   U t , T = i = 1 t j = t + 1 T s g n ( x i x j )
p 2 exp ( 6 k T 2 T 3 + T 2 )

2.4. Attribution Analysis of Streamflow Variation

The Budyko analysis has been well reported to estimate the relative contribution of climate- and land use-induced alteration to streamflow between two time periods spilt by a demarcation point. Prior to this, the sensitivity of streamflow to climate variation and land use change was also analyzed to identify the high elasticity factor for further attribution analysis.

2.4.1. Budyko Analysis

The Budyko framework was designed to derive the climate sensitivity of the streamflow based on the water balance:
Q = P A E T + Δ S
where P is precipitation, AET is actual evapotranspiration, Q is streamflow, and ΔS refers to the change in water storage. For the long-term water balance in a watershed (e.g., over 10 years), soil water storage can be neglected (i.e., assuming that its value is 0) [57].
Budyko is a recommended method to demonstrate that the ratio of AET to P is primarily controlled by the water–energy balance of a watershed, while PET is proposed to measure the available energy, and P can be used to measure the availability of water. Therefore, the Budyko hypothesis can be expressed as:
A E T = P × P E T ( P w + P E T w ) 1 w
where w primarily represents the integrated landscape characteristics of a watershed, mainly concerning topography, soil properties, and land use condition. The change in w is generally considered to be largely due to land use change, since the topography and soil remain almost unchanged in a short time [58].
Combined with Equations (3) and (4), the water balance equation can, therefore, be expressed as:
Q = P P × P E T ( P w + P E T w ) 1 w
According to Equation (5), the annual value of w can be estimated using the annual data for Q, P, and PET.
In order to explore the impacts of different land use types on streamflow, the relative effect of each kind of land use type can be estimated by comparing the different characteristics of the underlying surface (i.e., the values of w). The value of w was set to be 2.8 for forest, and 1.5 for grass, construction land, and cropland based on related research [33]. The following formula can be used to define the ratio of streamflow change caused by different land use types:
A E T = A E T × F i
where i refers to the land use types (including the several categories mentioned above) and Fi is the percentage of each land use area.

2.4.2. Sensitivity Analysis

Because the water balance equation can be rewritten as Q = f(P, PET, w), the total differential of Q can be written as:
d Q = Q P d P + Q P E T d P E T + Q w d w
This equation can be described briefly as:
d Q Q = ε p d P P + ε p E T d P E T P E T + ε w d w w
in which εp, εpet, and εw denote the sensitivity coefficient of the three factors (P, PET, and land use change) to streamflow change. Assuming that ∅ = AET/P, the sensitivity coefficients of Equation (8) are as follows [59]:
ε p = ( 1 + ω ) 1 / ω + 1 ω + 1 ( 1 + ω ) [ ( 1 + ω ) 1 / ω + 1 ]
ε p e t = 1 ( 1 + ω ) [ 1 ( 1 + ω ) 1 / ω ]
ε ω = ln ( 1 + ω ) + ω ln ( 1 + ω ) ω [ ( 1 + ω ) ( 1 + ω ) 1 / ω + 1 ]
A positive or negative sensitivity coefficient of a certain variable means that Q will increase or decrease with the change of the variable. According to the above equations, the annual or periodic sensitivity coefficients of streamflow concerning P, PET, and w can be determined for different hydrological stations, and the temporal evolution of the sensitivity coefficients can also be assessed.

2.4.3. Quantification of Contribution

The streamflow’s alteration can be measured according to its observed change before and after the abrupt point (Q1 and Q2) [60], which can be expressed as:
Δ Q = Q 2 Q 1
Since the total streamflow consists of two parts, meaning that its change is caused by climate change and by land use, Equation (12) can be converted into:
Δ Q = Δ Q c + Δ Q w
where ΔQc and ΔQw are streamflow change induced by climate and land use, respectively. The former (ΔQc) mainly includes streamflow change due to precipitation variation (ΔQP) and that due to potential evapotranspiration variation (ΔQpet).
The streamflow change induced, respectively, by the three factors before and after the abrupt point can be estimated as:
Δ Q p = ε p   Q P   Δ P
Δ Q p e t = ε p e t   Q P E T   Δ P E T
Δ Q w = ε w   Q w   Δ w
where ΔP = P2P1, ΔPET = PET2PET1 and Δw = w2w1 denote the changes in annual precipitation, potential evapotranspiration, and land use from period I to period II.
The individual contributions of the three variables to streamflow alteration can be defined as ηp, ηpet, and ηw, and can be estimated using the following expression.
η p = Δ Q p Δ Q × 100 %
η p e t = Δ Q p e t Δ Q × 100 %
η w = Δ Q w Δ Q × 100 %

3. Results Analysis

3.1. Identification of the Breakpoint

The trend analysis of annual streamflow changes over the study period is shown in Figure 2. The intersection of the forward and backward curves within the confidence lines determines a starting point for the abrupt change in the time series. Furthermore, the breakpoint in streamflow is statistically significant only if at least one point in the curve uf (solid line) falls outside the confidence interval.
The results indicated that streamflow in the two stations generally experienced a downward trend after 1985, and it was significant after 1993 in Luhun and 1998 in Dongwan for most values outside the confidence interval. It also can be seen that two intersections appeared within the confidence intervals for the two stations. One fell in 1976 for Luhun and 1972 for Dongwang, and the other occurred in both stations in 1985. Since almost no uf values in the nearly 10 years from 1972 to 1985 surpassed the 95% confidence level for the two stations, it is appropriate to define 1985 as the change point after which the streamflow showed an overall declined.
Pettitt’s test at the 5% significance level was also performed to further confirm the specific location of the change point (Table 1). The result of Pettitt’s test was similar to that of Mann-Kendall analysis. The results drawn from the two methods indicated that the abrupt point fell in 1985.
Therefore, based on the analysis of the abrupt change of annual streamflow, the evolution of the streamflow can be divided into two time series: period I (1960–1985) and period II (1986–2008).

3.2. Hydroclimatic Trend and Sensitivity of Streamflow to Environmental Factors

As shown in Table 2, the annual streamflow had a downward trend for the two stations in the different periods, except for the slight upward trend for Dongwan in period I, while the decline was only significant over the whole period. The variation in magnitude was the largest for Luhun (β = −0.21). Precipitation exhibited a decreasing trend in all the periods, and it was significant for Dongwan in period II. The largest magnitude occurred in Luhun (β = −1.39). Contrary to streamflow and precipitation, PET showed a significant upward trend in period II for the two stations with Z values of 1.69 and 3.59, respectively. However, it was the complete opposite in period I, with a significant downward trend. In general, the combined effect of a downward trend in period I and an upward trend in period II caused an overall increasing trend for the whole study period for the two stations (Z = 0.13, 1.54), with significance for Dongwan. However, the increase in w was insignificant for the two stations in all periods.
The sensitivity of the streamflow to environmental factors with respect to P, PET, and w is also presented in Table 2 for the whole period and the sub-periods at the two stations. It was found that streamflow was positively correlated with P, but negatively correlated with PET and w. The absolute values of the sensitivity coefficients were largest for P, intermediate for PET, and smallest for w, ranging from 1.89 to 4.91 for P, from −1.53 to −2.36 for PET, and from −0.74 to −1.68 for w. This suggests that a 1% increase in P, PET, or w would result in a 1.89–3.91% increase, 1.53–2.36% decrease, or 0.74–1.68% decrease in streamflow, respectively. The coefficients were greater for Luhun than Dongwan in most periods, and they were general larger in period II than in period I.
To further estimate the temporal evolution of the impacts of climate variation and land use change on streamflow, the annual sensitivity coefficients for the period of 1960–2008 for the two stations were obtained (Figure 3). The change magnitude for absolute values of εp and εpet in Luhun was greater than that in Dongwan (Figure 3a,b), which suggests that streamflow became more sensitive to climate variation in Luhun but less sensitive in Dongwan. The change magnitude for absolute values of εw exhibited a similar trend to that of climate variables (Figure 3c), indicating that the sensitivity of the streamflow to land use change in Luhun was greater than that in Dongwan.

3.3. Quantitative Attribution Analysis of the Streamflow Decline

Based on the estimated sensitivity of streamflow and the change in mean annual precipitation, potential evapotranspiration, and parameter w from period I to period II (Table 2), the streamflow variation due to the changes in P, PET, and w was also estimated using Equations (14)–(16), respectively. The total change in the modeled streamflow was denoted as the sum of ΔQp, ΔQpet, and ΔQw. The correlation between the modeled streamflow and the observed one (estimated as the difference between the two sub-periods) over the study period was analyzed (Figure 4) and it was revealed that the modeled streamflow had a significant linear correlation with the observed streamflow (R2 ≥ 0.8, p < 0.01), suggesting that this method was capable of estimating streamflow change in the present study. Also, the similar changes between the calculated values (ΔQ) and the observed values (ΔQ’) (Table 3) further support the feasibility of the method.
Streamflow changes caused by climate variation mainly include changes in P and PET, and those caused by land use change refer to changes in w. The relative contribution of each factor to streamflow decline was also calculated (Table 3). Over the study period of 1960–2008, both climate variation and land use change decreased streamflow. In terms of the impact of climate variation on streamflow at the two stations, changes in P made the greatest contribution to streamflow decline, accounting for 50.01% in Dongwan and 55.36% in Luhun. Potential evapotranspiration reduced streamflow by 13.53 mm (24.25%) in Dongwan and 17.76 mm (24.45%) in Luhun. Regarding the contribution of land use change to streamflow decline at the two stations, land use caused reductions in streamflow by 14.09 mm and 14.67 mm and was responsible for 25.25% and 20.19% decline, respectively, in Dongwan and Luhun.
The main factor controlling the changes in streamflow was climate variation (including P and PET) at the two stations. The effect of P on streamflow change was more significant than that of PET. However, land use change was less responsible for streamflow change at the two stations.

4. Discussion

In the present study, a decrease in precipitation and an increase in PET were found; these findings corresponded to the results of a study in northeast China reported by Li et al. [61]. Apart from the decreasing trend in streamflow in this area, as revealed by Liang [62], our study located the abrupt change point in the year 1985 for streamflow, suggesting that the streamflow has declined since 1985 when compared with that of the previous 26 years before 1985. The abrupt change analysis is in accordance with that of Dai et al. [38], indicating that the change point occurred between the 1980s and 1990s. The two stations had similar trends in P, PET, and w despite the slight differences between them.
Although the change in streamflow was closely related to the variations of P and PET, land use changes also played an important role in streamflow alteration. In this section, we mainly focus on how the streamflow responds to land use change and climate variation based on our findings.

4.1. Land Use Change and Its Impact on Streamflow Decline

There was a small change in land use type from period I to period II (Table 4). The cultivated and forest land were the dominant land use types, with cultivated land (forest land) showing a slight decrease (increase), while there was a noticeable increase in built-up area at a rate of 23.70%. The increase in such land revealed an increasing water requirement that could aggravate the conflict between water supply and demand. In addition, the increased built-up land was mainly from the decline in cultivated and forest areas (Table 5), which affected the interception, infiltration, and evaporation of precipitation, hence altering streamflow.
Meanwhile, grassland was the third major land use type with an area of 389.01 km2 in 1985 and an area of 350.73 km2 in 2005. The grass land area decreased at a rate of 9.02%, mainly due to the transition to cropland and forest land with flow-out areas of 22.09 km2 and 15.92 km2 (Table 5). This increased streamflow interception and infiltration to a certain extent, hence resulting in a greater decline for streamflow in period II (Table 2). Additionally, the increasing water body area from 87.38 km2 in 1985 to 95.63 km2 in 2005 also contributed to the increase in evapotranspiration, thereby reducing streamflow [55].
To further explore the impact of different land use types on streamflow before and after the change point over the study period, we only quantified the contributions of cultivated land, forest, grass, and built-up land to streamflow decline, considering the lower proportion of water body and unused land (Table 6).
The impacts of different land use types on the reduction in streamflow were quite dissimilar. The contribution of forest land was the largest in both periods, followed by grass land, implying that forest and grass plays an important role in streamflow decline in the study. On the one hand, forest and grass areas occupied a larger proportion of the total area (Table 4). On the other hand, the forest and grass cover increase the surface roughness, and thus intercept more precipitation, hence reducing surface streamflow.
However, the development of cultivated land and built-up land increases landscape fragmentation. In particular, the patchy distribution in relatively flat locations further decreased the slope streamflow by hindering the effective area for streamflow convergence, which was also slightly responsible for the reduction of streamflow (Table 2) [53], but this contribution was relatively small.

4.2. The Impact of Climate Variation on Streamflow Change

Generally, climate variation is the primary reason for streamflow alteration in the study area. This finding is in agreement with the results of a study conducted in northwestern China by Yin et al. [63], indicating that the contribution of climate change to streamflow increase was 14.08%, while land use change only accounted for 7.12%. Precipitation was the major factor controlling streamflow change. The significant downward trend for the two stations (Table 2) could be partly caused by the decline of precipitation, since precipitation and streamflow were well synchronized and they had a strong positive correlation [53]. There was a significant upward trend for PET in the whole period, which was consistent with the results from Zhang et al. [56] and Piao et al. [64], suggesting that most parts of China have been become warmer and PET has increased accordingly in recent years. However, land use condition (w) although showed an upward trend but without significance in different periods. This is primarily due to less interference of human activities on land use [32], and the changes reported by Liang [62], similar to those shown in Table 4 and Table 5, further confirm this. In general, the sensitivity of streamflow to P was much greater than that to PET and w (Table 2, Figure 3), and the similar findings have been well documented by other researchers [41,58].
The attribution analysis indicated some differences between the two stations (Table 3). It was found that the change in P was still the major contributor to streamflow change, which also confirmed the proposition that the evolution of streamflow was mainly impacted by natural factors, especially precipitation [65]. However, the precipitation change in Dongwan was greater than that in Luhun (Table 2), while the streamflow variation induced by precipitation in Dongwan was smaller than that in Luhun (Table 3). The possible reasons for this can be attributed to the different elevation and land use types. Dongwan is located in the upper part of the study area with high elevation (Figure 1), which made streamflow more prone to flowing downhill [66], whereas Luhun is located in the lower part of the study area accompanied by relatively flat terrain, with patchy distribution of grass and forest land (Figure A1) contributing to increases in interception and infiltration. Moreover, the previous studies suggested that grass and forest played important roles in water-holding [67,68]. In addition, the reservoir located above the Luhun station intercepts the flow path, hence decreasing runoff downstream [14]. The same holds true in the present study. Land use change in Dongwan and Luhun was responsible for 14.09 mm and 14.76 mm reductions in streamflow, respectively. The change in streamflow caused by PET in Luhun (−17.76 mm and 24.45%) was greater than that in Dongwan (−13.53 mm and 25.25%), which was similar to PET variation. This finding was in good agreement with the results of Ning et al. [58] and Xu et al. [32], indicating that streamflow has a negative relationship with PET.

4.3. Uncertainty of Quantitative Assessment and Future Research

This study provides critical insight into the hydrological dynamics of the Yihe River watershed, but there are several limitations concerning the theoretical analysis. First, the available hydrological gauge stations and meteorological stations were limited; the results would be better if sub-basins could be divided to analyze the spatiotemporal change in streamflow in greater detail. For example, comparisons would be more evident if more ΔQp, ΔQpet, and ΔQw were found, hence more detailed information about streamflow and strategies can be detected and put forward. Secondly, the Budyko framework used in the present study is based on the assumption that land use change is independent from climate change, which may deviate from the fact that interactions are usually strong between the land and the climate system. In addition, the Budyko framework was mainly focused on long-term hydrology or climate changes at the annual scale. In fact, research on various time scales (such as monthly and seasonal scales) is also necessary, which requires further exploration. Thirdly, this study simplified the non-natural factors that affect streamflow into land use due to higher vegetation coverage and local land development, based on a field investigation. However, the comprehensive effects of a variety of specific non-natural factors involve many aspects, such as the implementation of water and soil conservation projects, the construction of dams, the Grain for Green program, etc. Therefore, in future work, more specific non-natural factors should be taken into account to further explore the isolated and joint effects of climate and non-natural factors on streamflow.
Although the streamflow alteration induced by land use change was not as noticeable as that reported in other research [69], its importance in streamflow decline cannot be ignored. Streamflow can be effectively inhibited through the adjustment of land type and the optimization of its spatial distribution. For instance, converting the sloping cultivated land to terraces, or converting orchards to forests can substantially decrease streamflow, especially for hilly watershed areas [70]. In addition, the parameters impacting climate change not only refer to P and PET but also include weed speed, relative humidity, and sunshine hours, therefore it would be better if the contribution of all the climate factors to streamflow change could be assessed in the future. It should be also acknowledged that the present study is a preliminarily tentative work for an attribution analysis of streamflow change. The impact of climate variation on streamflow is more evident than the impact of land use change but it is difficult to control, therefore more attention should be paid to land use optimization and management for the sustainable development of water resources.

5. Conclusions

The impact of climate variation and land use changes over a 50-year trend of streamflow in the Yihe River was investigated in the present study using a framework by Budyko. The impact of climate variation on streamflow was further partitioned into effects induced by changes in precipitation and those by changes in potential evapotranspiration. According to the findings derived from this work, the following conclusions can be made:
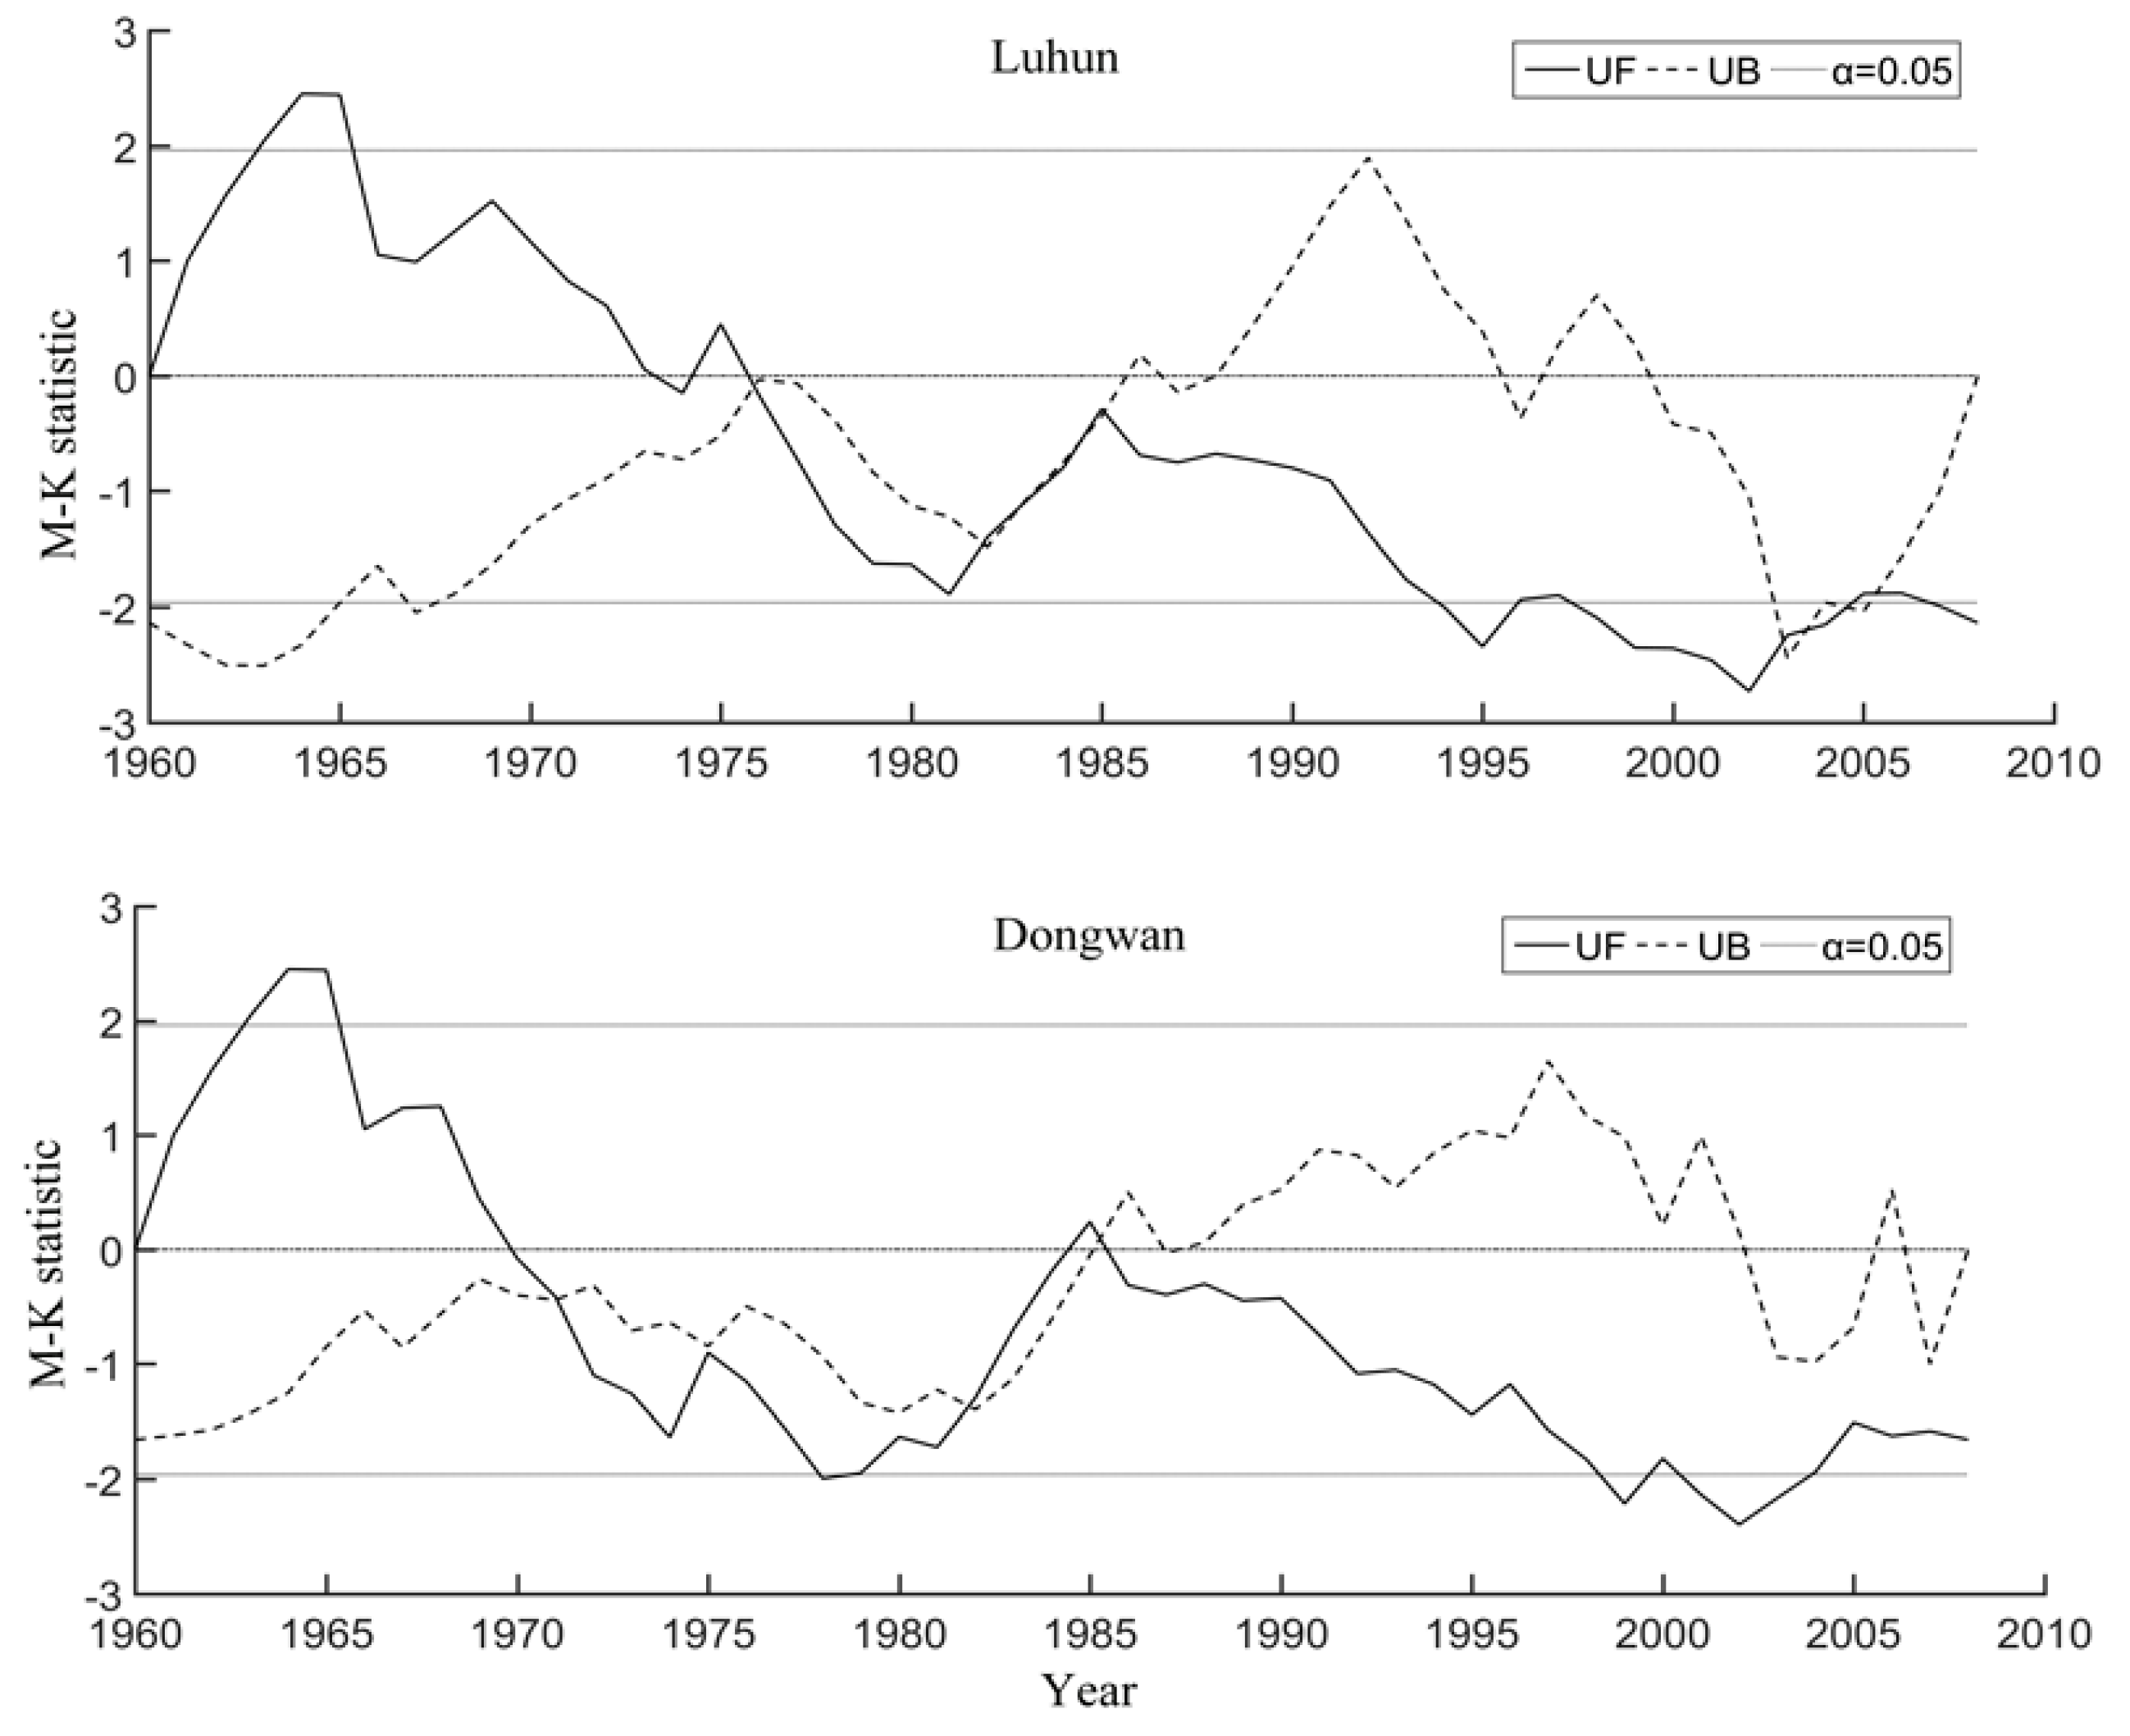
  • The trend analysis derived using Mann-Kendall tests indicated a significant downward trend in annual streamflow at the two stations. The abrupt point analyzed based on MKS and Pettitt’s test for the time series trend was detected in 1985.
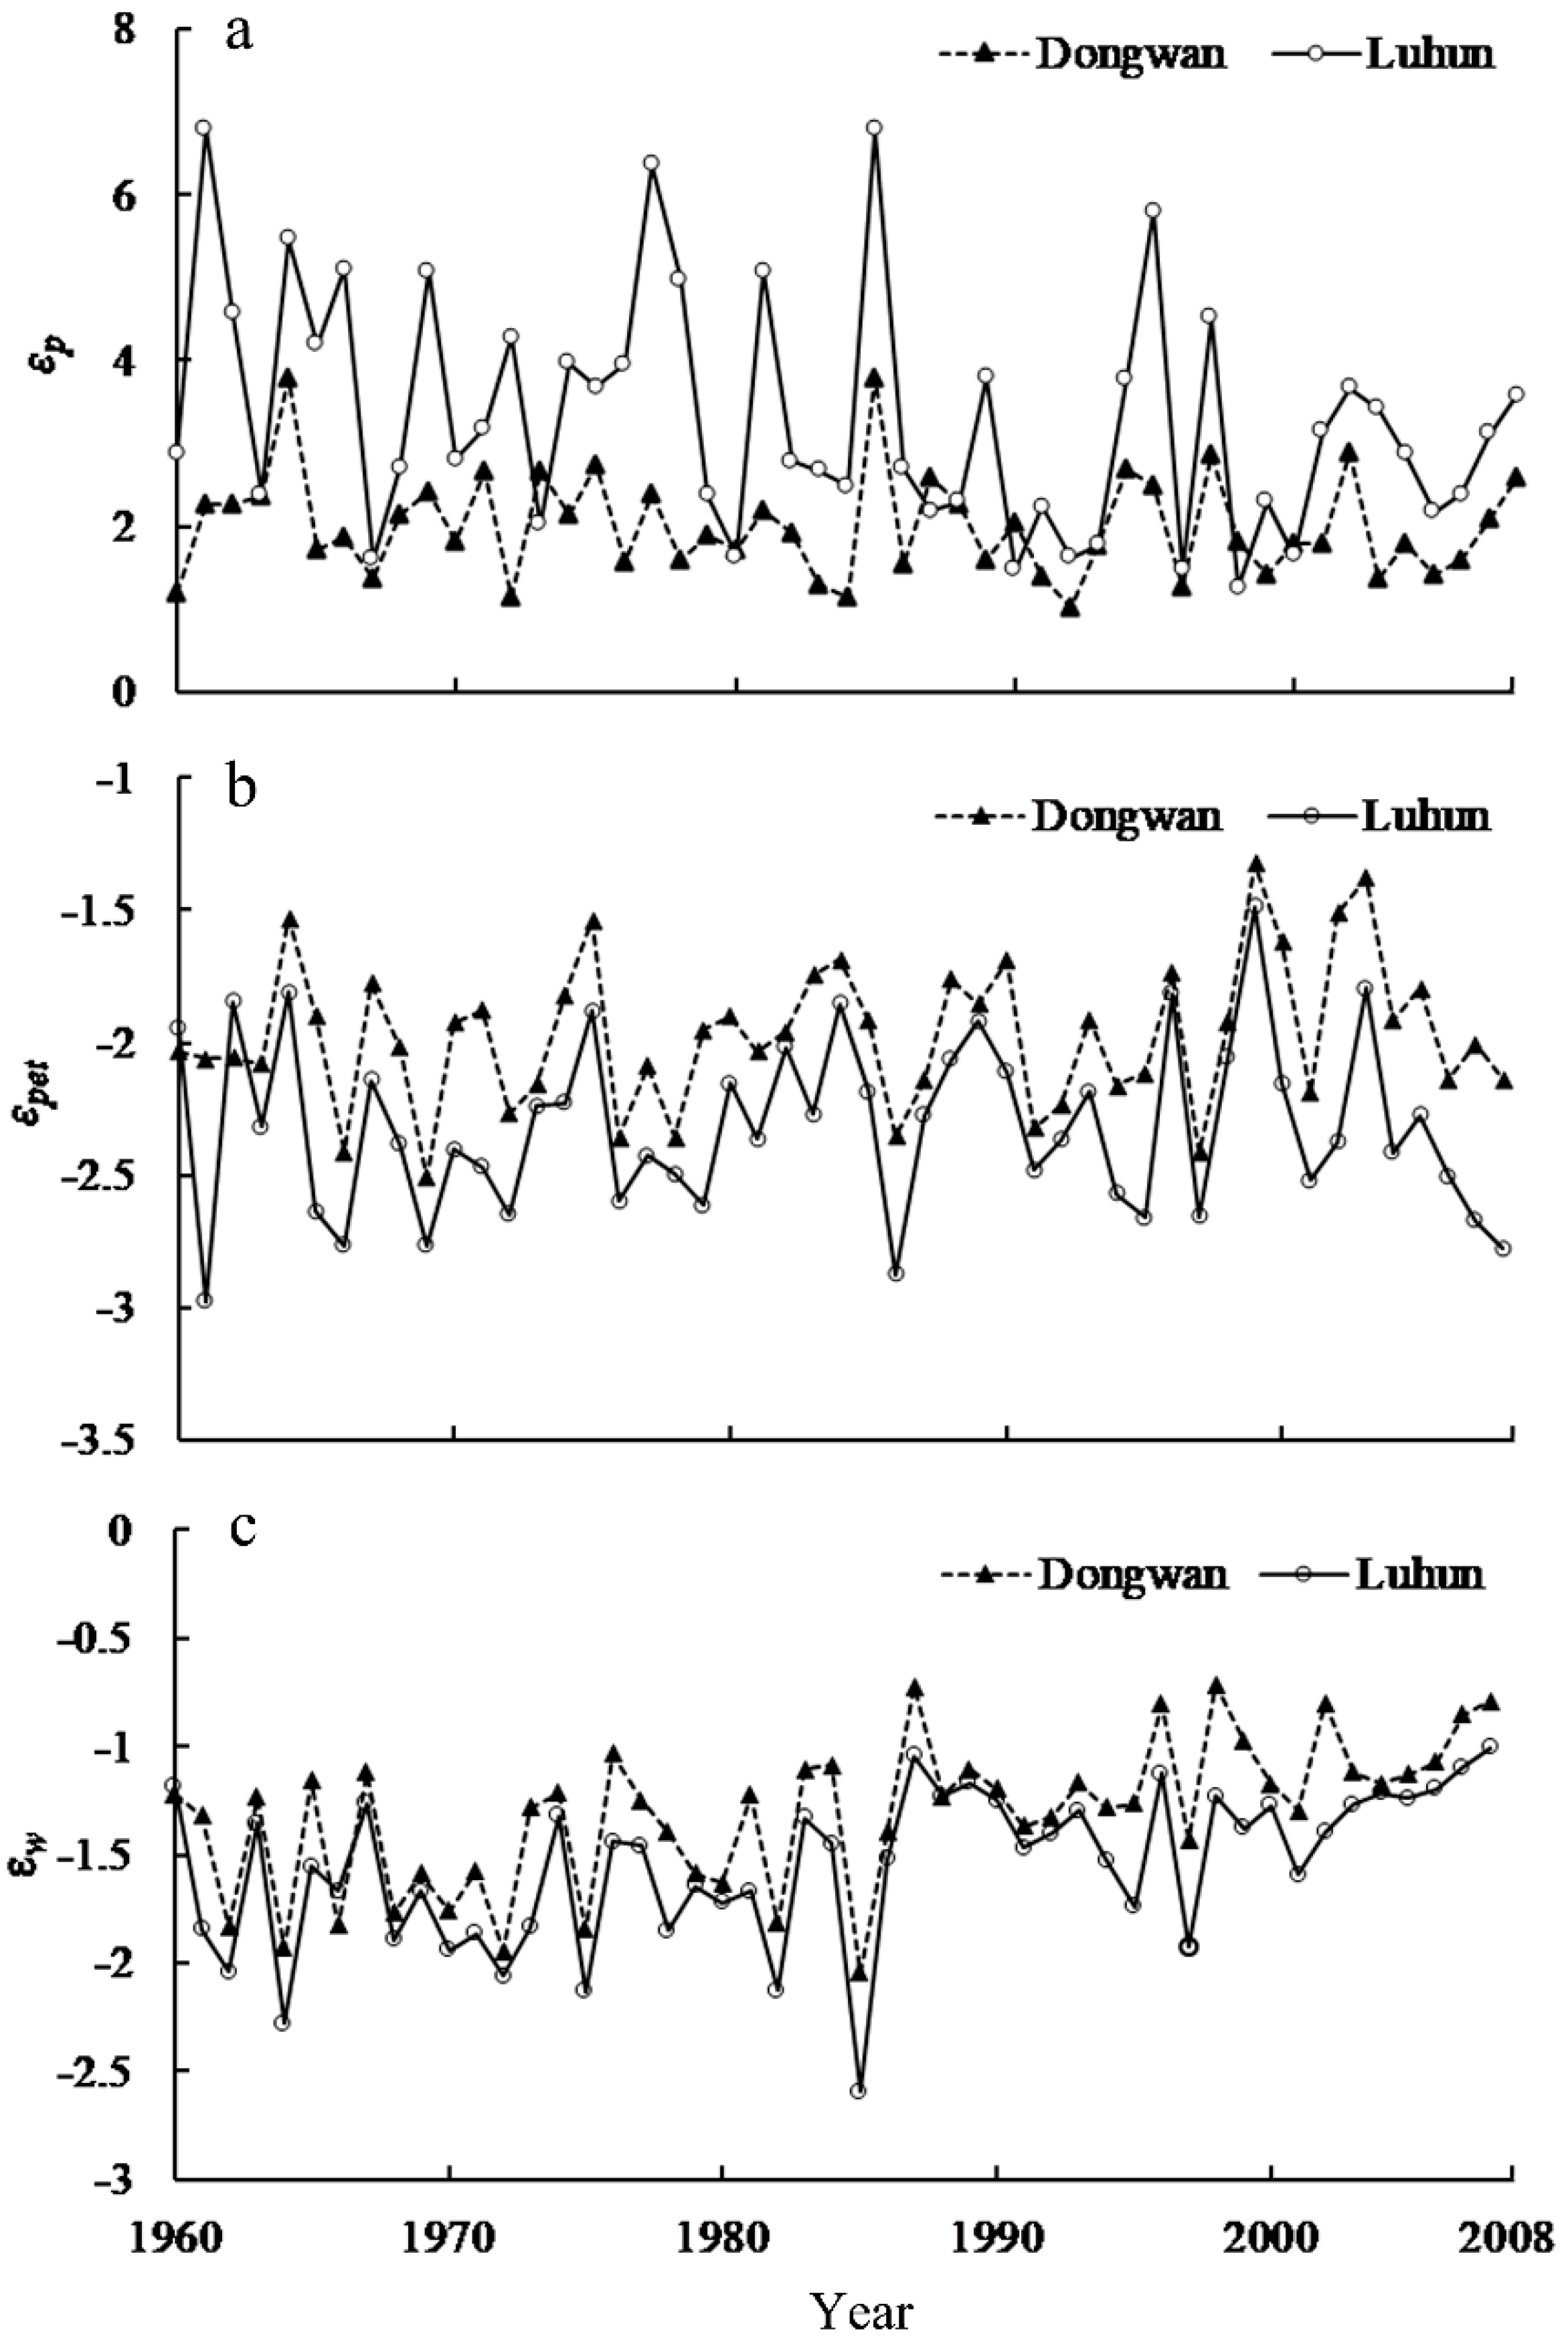
  • A reduction in P and an increase in PET was detected for two stations over most of the studied periods, except for in period I for PET. Land use change (w) increased in all the periods but without significance. The streamflow was found to be most sensitive to P, followed by PET and w for both periods and inter-annual change. The streamflow decline in Luhun was much more sensitive to the three variables than that in Dongwan.
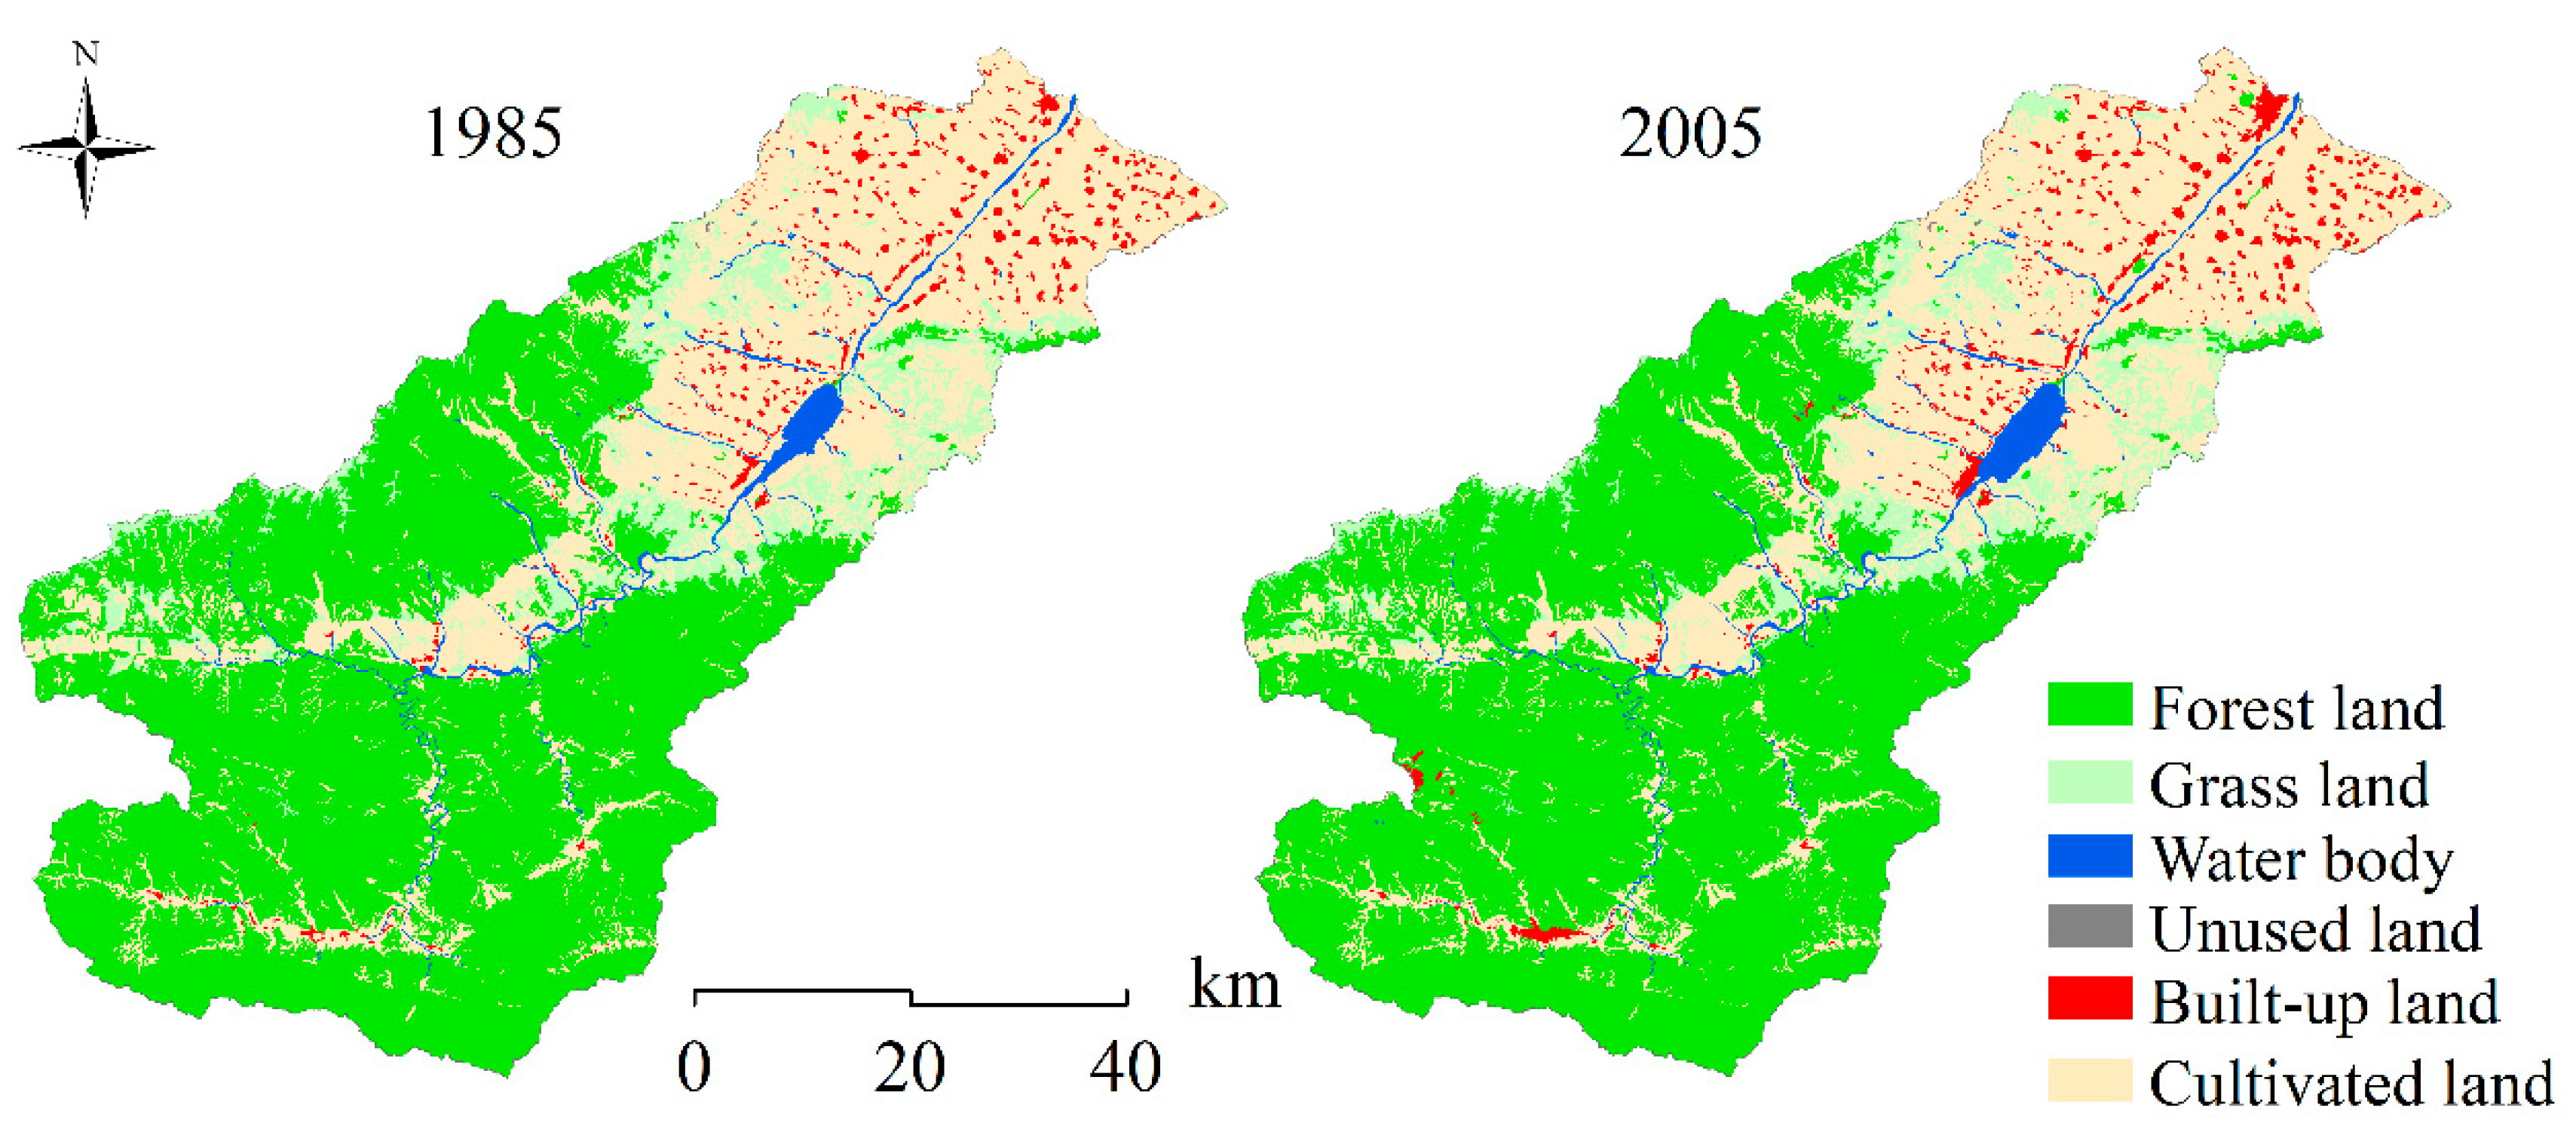
  • Climate change was the major contributor to streamflow alteration, which mainly comes from the increase in P and the decrease in PET, whose individual effects on streamflow change accounted for more than 50% and 20%, respectively. Land use change contributed to a small percentage of the change in streamflow at the two stations, which may be attributed to the small dynamic change of land use and less human interference in the study area.
  • Although climate variation is substantially responsible for the streamflow change in the Yihe watershed, much attention should still be paid to land use management, since climate change is difficult to control and streamflow can be regulated through artificial measures (such as reforestation and re-grassing) to promote sustainable development of water resources.
  • The variation in streamflow at various time scales (such as monthly and seasonal scales) is also very important for water resource planning and management. More attempts should be made to achieve this in future studies, for example by applying a hydrologic model (such as SWAT) to investigate the changes in streamflow at monthly scale.

Author Contributions

The analyses of the data and manuscript conception were done in cooperation with all authors. S.X. conceived the study, carried out formal analysis and wrote the draft. The manuscript was completed under the supervision by M.Q. and Q.Z.; M.Q. and Q.Z also provided some excellent field assistance. S.D. and H.L. supported programming and software application. C.L. and X.Y were responsible for pre- and post-processed and visualized the data. Y.L. and J.Y. contributed to investigation and data collection. X.J. checked the grammar and spelling mistakes in the manuscript. All authors have read and approved the final manuscript.

Funding

This research was funded by the National Natural Sciences Foundation of China (U1804119, 41771202 and 41601175), the Colleges and Universities Key Scientific Research Projects of Henan Province (18A170004), and the Science and Technology Project of Henan Province (192102310304).

Acknowledgments

The authors would like to thank Mingzhou Qin and Qinghe Zhao for the guidance of this research. The authors are also grateful to the insight and views of the reviewers and editors.

Conflicts of Interest

The authors declare no conflict of interest.

Appendix A

Figure A1. Land use maps in 1985 and 2005 in the study area.
Water 11 00887 g0a1

References

  1. Oki, T. Global hydrological cycles and world water resources. Science 2006, 313, 1068–1072. [Google Scholar] [CrossRef]
  2. Sherwood, S.; Fu, Q. A drier future? Science 2014, 343, 737–739. [Google Scholar] [CrossRef]
  3. Labat, D.; Goddéris, Y.; Probst, J.L.; Guyot, L.J. Evidence for global runoff increase related to climate warming. Adv. Water Resour. 2004, 27, 631–642. [Google Scholar] [CrossRef]
  4. Carlos, E.; Pedro, N. Meteorological drought features in northern and northwestern parts of Mexico under different climate change scenarios. J. Arid Land 2017, 9, 68–78. [Google Scholar] [CrossRef]
  5. Karabulut, M. Drought analysis in Antakya-Kahramanmara? Graben, Turkey. J. Arid Land 2015, 7, 741–754. [Google Scholar] [CrossRef]
  6. Vicente-Serrano, S.M.; López-Moreno, J.I.; Beguería, S.; Lorenzo-Lacruz, J. Evidence of increasing drought severity caused by temperature rise in southern Europe. Environ. Res. Lett. 2014, 9, 1–9. [Google Scholar] [CrossRef]
  7. Liu, X.P.; Li, X.; Shi, X.; Wu, S.K. Simulating complex urban development using kernel-based non-linear cellular automata. Ecol. Model. 2008, 211, 169–181. [Google Scholar] [CrossRef]
  8. Sterling, S.M.; Ducharne, A.; Polcher, J. The impact of global land-cover change on the terrestrial water cycle. Nat. Clim. Chang. 2012, 3, 385–390. [Google Scholar] [CrossRef]
  9. Stone, R. Saving Iran’s great salt lake. Science 2015, 349, 1044–1047. [Google Scholar] [CrossRef]
  10. Wurtsbaugh, W.A.; Miller, C.; Null, S.E.; DeRose, J.; Wilcock, P.; Hahnenberger, M.; Howe, F.; Moore, J. Decline of the world’s saline lakes. Nat Geosci. 2017, 10, 816–821. [Google Scholar] [CrossRef]
  11. Pokhrel, Y.; Hanasaki, N.; Koirala, S.; Cho, J. Incorporating anthropogenic water regulation modules into a land surface model. J. Hydrometeorol. 2017, 13, 255–269. [Google Scholar] [CrossRef]
  12. AghaKouchak, A.; Norouzi, H.; Madani, K.; Mirchi, A.; Azarderakhsh, M.; Nazemi, A.; Nasrollahi, N.; Farahmand, A.; Mehran, A.; Hasanzadeh, E. Aral Sea syndrome desiccates Lake Urmia: Call for action. J. Great Lakes Res. 2015, 41, 307–311. [Google Scholar] [CrossRef]
  13. Tan, C.; Ma, M.; Kuang, H. Spatial-temporal characteristics and climatic responses of water level fluctuations of global major lakes from 2002 to 2010. Remote Sens. 2017, 9, 150. [Google Scholar] [CrossRef]
  14. Lee, S.; Kim, S.U. Quantification of hydrological responses due to climate change and human activities over various ttime scales in South Korea. Water 2017, 9, 34. [Google Scholar] [CrossRef]
  15. Kim, S.U.; Y, X. Analysis of dam inflow variation using the hydrological sensitivity method in a trans-boundary river basin: Case study in the Korean Peninsula. Water 2019, 11, 395. [Google Scholar] [CrossRef]
  16. Mao, T.; Wang, G.; Zhang, T. Impacts of climatic change on hydrological regime in the Three-River Headwaters Region, China, 1960–2009. Water Resour. Manag. 2016, 30, 115–131. [Google Scholar] [CrossRef]
  17. Middelkoop, H.; Daamen, K.; Gellens, D.; Grabs, W.; Kwadijk, J.C.; Lang, H.; Parmet, B.W.; Schädler, B.; Schulla, J.; Wilke, K. Impact of climate change on hydrological regimes and water resources management in the Rhine Basin. Clim. Chang. 2001, 49, 105–128. [Google Scholar] [CrossRef]
  18. Chaemiso, S.E.; Abebe, A.; Pingale, S.M. Assessment of the impact of climate change on surface hydrological processes using SWAT: A case study of Omo-Gibe river basin, Ethiopia. Model. Earth Syst Environ. 2016, 2, 1–15. [Google Scholar] [CrossRef]
  19. Ghaffari, G.; Keesstra, S.D.; Ghoddousi, J.; Ahmadi, H. SWAT-simulated hydrological impact of land-use change in the Zanjanrood basin, Northwest Iran. Hydrol. Process. 2010, 24, 892–903. [Google Scholar] [CrossRef]
  20. Gashaw, T.; Tulu, T.; Argaw, M.; Worqlul, A.W. Modeling the hydrological impacts of land use/land cover changes in the Andassa watershed, Blue Nile Basin, Ethiopia. Sci. Total Environ. 2018, 619, 1394–1408. [Google Scholar] [CrossRef]
  21. Nunes, A.N.; Almeida, A.C.; Coelho, C. Impact of land use and cover type on runoff and soil erosion in a marginal area of Portugal. Appl. Geogr. 2011, 31, 687–699. [Google Scholar] [CrossRef]
  22. Huang, M.; Zhang, L.; Gallichand, J. Runoff responses to afforestation in a watershed of the Loess Plateau, China. Hydrol. Process. 2003, 17, 2599–2609. [Google Scholar] [CrossRef]
  23. Arrigoni, A.S.; Greenwood, M.C.; Moore, J.N. Relative impact of anthropogenic modifications versus climate change on the natural flow regimes of river in the Northern Rocky Mountains, United States. Water Resour. Res. 2010, 46, W12542. [Google Scholar] [CrossRef]
  24. Vogel, R.M.; Yaindl, C.; Walter, M. Nonstationarity: Flood magnification and recurrence reduction factors in the United States. J. Am. Water. Resour. Assoc. 2011, 47, 464–474. [Google Scholar] [CrossRef]
  25. Wang, S.; Kang, S.; Zhang, L.; Li, F.S. Modelling hydrological response to different land-use and climate change scenarios in the Zamu River Basin of Northwest China. Hydrol. Process. 2008, 22, 2502–2510. [Google Scholar] [CrossRef]
  26. Lafontaine, J.H.; Hay, L.E.; Viger, R.J.; Regan, R.S. Effects of climate and land cover on hydrology in the Southeastern U.S.: Potential impacts on watershed planning. J. Am. Water. Resour. Assoc. 2015, 51, 1235–1261. [Google Scholar] [CrossRef]
  27. Vaighan, A.A.; Talebbeydokhti, N.; Bavani, A.M. Assessing the impacts of climate and land use change on streamflow, water quality and suspended sediment in the Kor River Basin, Southwest of Iran. Environ. Earth Sci. 2017, 76, 543–560. [Google Scholar] [CrossRef]
  28. Karim, F.; Petheram, C.; Marvanek, S.; Ticehurst, C. Impact of climate change on floodplain inundation and hydrological connectivity between wetlands and rivers in a tropical river catchment. Hydrol. Process. 2016, 30, 1574–1593. [Google Scholar] [CrossRef]
  29. Budyko, M.I. Climate and Life; Academic: New York, NY, USA, 1974; 508p. [Google Scholar]
  30. Zhang, C.Q.; Zhang, B.; Li, W.H.; Liu, M.C. Response of streamflow to climate change and human activity in Xitiaoxi river basin in China. Hydrol Process. 2014, 28, 43–50. [Google Scholar] [CrossRef]
  31. Gao, G.Y.; Fu, B.J.; Wang, S.; Liang, W.; Jiang, X.H. Determining the hydrological responses to climate variability and land use/cover change in the Loess Plateau with the Budyko framework. Sci. Total Environ. 2016, 557, 331–342. [Google Scholar] [CrossRef]
  32. Xu, X.; Yang, D.; Yang, H. Attribution analysis based on the Budyko hypothesis for detecting the dominant cause of runoff decline in Haihe basin. J. Hydrol. 2014, 510, 530–540. [Google Scholar] [CrossRef]
  33. Zhao, Y.; Zhang, X.M.; Cao, W.C.; Yu, X.X.; Liu, B.; Zhu, B.S.; Cheng, C.; Yin, X.L.; Xie, G. Effect of climatic change and afforestation on water yield in the Rocky Mountain Area of North China. For. Syst. 2015, 24, 1–9. [Google Scholar] [CrossRef]
  34. Yuan, Y.J.; Zhang, C.; Zeng, G.M.; Liang, J.; Guo, S.L.; Huang, L.; Wu, H.P.; Hua, S.S. Quantitative assessment of the contribution of climate variability and human activity to streamflow alteration in Dongting Lake, China. Hydrol. Process. 2016, 30, 1929–1939. [Google Scholar] [CrossRef]
  35. Stonestrom, D.A.; Scanlon, B.R.; Zhang, L. Introduction to special section on Impacts of Land Use Change on Water Resources. Water Resour. Res. 2009, 45, 160–169. [Google Scholar] [CrossRef]
  36. Napoli, M.; Massetti, L.; Orlandini, S. Hydrological response to land use and climate changes in a rural hilly basin in Italy. Catena 2017, 157, 1–11. [Google Scholar] [CrossRef]
  37. Guimberteau, M.; Ronchail, J.; Espinoza, J.C.; Lengaigne, M.; Sultan, B.; Polcher, J.; Drapeau, G.; Guyot, J.L.; Ducharne, A.; Ciais, P. Future changes in precipitation and impacts on extreme streamflow over Amazonian sub-basins. Environ. Res. Lett. 2013, 8, 1–13. [Google Scholar] [CrossRef]
  38. Dai, S.B.; Lu, X.X.; Yang, S.L. A preliminary estimate of human and natural contributions to the decline in sediment flux from the Yangtze River to the East China Sea. Quat. Int. 2008, 186, 43–54. [Google Scholar] [CrossRef]
  39. Zhao, G.J.; Tian, P.; Mu, X.M.; Jiao, J.Y.; Wang, F.; Gao, P. Quantifying the impact of climate variability and human activities on streamflow in the middle reaches of the Yellow River basin, China. J. Hydrol. 2014, 519, 387–398. [Google Scholar] [CrossRef]
  40. He, Y.; Wang, F.; Mu, X.; Guo, L.Q. Human activity and climate variability impacts on sediment discharge and runoff in the Yellow River of China. Theor. Appl. Climatol. 2016, 129, 1–10. [Google Scholar] [CrossRef]
  41. Jiang, C.; Xiong, L.H.; Wang, D.B.; Liu, P. Separating the impacts of climate change and human activities on runoff using the Budyko-type equations with time-varying parameters. J. Hydrol. 2015, 522, 326–338. [Google Scholar] [CrossRef]
  42. Bai, P.; Liu, W.H.; Guo, M.J. Impacts of climate variability and human activities on decrease in streamflow in the Qinhe River, China. Theor. Appl. Climatol. 2014, 117, 293–301. [Google Scholar] [CrossRef]
  43. Xu, J. Variation in annual runoff of the Wudinghe River as influenced by climate change and human activity. Quat. Int. 2011, 244, 230–237. [Google Scholar] [CrossRef]
  44. Tian, L. The Simulation of Landscape Pattern in Yihe River Basin—A Case Study of Luanchuan County; Henan University: Kaifeng, China, 2010. [Google Scholar] [CrossRef]
  45. Zhang, J.J.; Gao, Y.B.; Xue, Y. Analysis of characteristics of climate change over last 46 years in Luoyang. Meteorol. Environ. Sci. 2008, 31, 138–141. [Google Scholar] [CrossRef]
  46. Zhao, X.F.; Zhang, M.Q. The ecosystem that the mineral development of LuoYang result in break and counterplan. J. Henan For. Sci. Technol. 2005, 25, 23–24. (In Chinese) [Google Scholar]
  47. Ren, J.Y.; Liu, H.M.; Ding, S.Y.; Wang, M.N.; Bian, Z.Q. Landscape pattern change and its driving mechanism in Yihe River basin, China. J. Appl. Ecol. 2017, 28, 2611–2620. [Google Scholar] [CrossRef]
  48. Du, F. The Response of Hydrological Effect to Land Use/Land Cover Change in the Yiluohe Basin; HohaiUniversity: Nanjing, China, 2007. [Google Scholar] [CrossRef]
  49. Allen, R.G.; Pereira, L.S.; Raes, D.; Smith, M. Crop Evapotranspiration—Guidelines for Computing Crop Water Requirements; FAO Irrigation and Drainage Paper 56; Food and Agriculture Organization of the United Nations: Rome, Italy, 1998; p. 300. [Google Scholar]
  50. Tegos, A.; Malamos, N.; Koutsoyiannis, D. A parsimonious regional parametric evapotranspiration model based on a simplification of the Penman-Monteith formula. J. Hydrol. 2015, 524, 708–717. [Google Scholar] [CrossRef]
  51. Mann, H.B. Nonparametric tests against trend. Econometrica 1945, 13, 245–259. [Google Scholar] [CrossRef]
  52. Kendall, M.G. Rank Correlation Measures; Charles Griffin: London, UK, 1975. [Google Scholar]
  53. Wu, L.H.; Wang, S.J.; Bai, X.Y.; Luo, W.J.; Tian, Y.C.; Zeng, C.; Luo, G.J.; He, S.Y. Quantitative assessment of the impacts of climate change and human activities on runoff change in a typical karst watershed, SW China. Sci. Total Environ. 2017, 601–602, 1449–1465. [Google Scholar] [CrossRef]
  54. Sneyers, R. Sur L’analyse Statistique des Séries D’observations; Tech. Note, 194; WMO: Geneva, Switzerland, 1975; pp. 9–12. [Google Scholar]
  55. Mwangi, H.M.; Julich, S.; Patil, S.D.; McDonald, M.A.; Feger, K.H. Relative contribution of land use change and climate variability on discharge of upper Mara River, Kenya. J. Hydrol. Reg. Stud. 2016, 5, 244–260. [Google Scholar] [CrossRef]
  56. Zhang, Y.; Guan, D.; Jin, C.; Wang, A.Z. Impacts of climate change and land use change on runoff of forest catchment in northeast China. Hydrol. Process. 2014, 28, 186–196. [Google Scholar] [CrossRef]
  57. Chen, Z.; Chen, Y.; Li, B. Quantifying the effects of climate variability and human activities on runoff for Kaidu River Basin in arid region of northwest China. Theor. Appl. Climatol. 2013, 111, 537–545. [Google Scholar] [CrossRef]
  58. Ning, T.; Li, Z.; Liu, W. Separating the impacts of climate change and land surface alteration on runoff reduction in the Jing River catchment of China. Catena 2016, 147, 80–86. [Google Scholar] [CrossRef]
  59. Yang, D.; Zhang, S.; Xu, X. Attribution analysis for runoff decline in Yellow River Basin during past fifty years based on Budyko hypothesis (in Chinse). Sci. Sin. Technol. 2015, 45, 1024–1034. [Google Scholar] [CrossRef]
  60. Wu, J.W.; Miao, C.Y.; Wang, Y.M.; Duan, Q.Y.; Zhang, X.M. Contribution analysis of the long-term changes in seasonal runoff on the Loess Plateau, China, using eight Budyko-based methods. J. Hydrol. 2017, 545, 263–275. [Google Scholar] [CrossRef]
  61. Li, F.P.; Zhang, G.X.; Yi, X. Separating the impacts of climate variation and human activities on runoff in the Songhua River basin, Northeast China. Water 2014, 6, 3320–3338. [Google Scholar] [CrossRef]
  62. Liang, G.F. landscape Pattern and Runoff Change in Yilhe Basin—A Case Study of the Upper Reaches; Henan University: Kaifeng, China, 2010. [Google Scholar] [CrossRef]
  63. Yin, Z.; Feng, Q.; Yang, L.; Wen, X.; Si, J.; Zou, S. Long term quantification of climate and land cover change impacts on streamflow in an Alpine River Catchment, northwestern China. Sustainability 2017, 9, 1278. [Google Scholar] [CrossRef]
  64. Piao, S.L.; Ciais, P.; Huang, Y.; Shen, Z.H.; Peng, S.S.; Li, J.S. The impacts of climate change on water resources and agriculture in China. Nature 2010, 467, 43–51. [Google Scholar] [CrossRef]
  65. Lan, K.; Hong, L. Analysis to runoff evolution features along time series in karst drainage basin—A case study in Guizhou province. Carsologica Sin. 2007, 26, 341–346. [Google Scholar] [CrossRef]
  66. Jencso, K.; Mcglynn, B.L. Hierarchical controls on runoff generation: Topographically driven hydrologic connectivity, geology, and vegetation. Water Resour. Res. 2011, 47, 431–435. [Google Scholar] [CrossRef]
  67. Ru, H.; Lin, H.; He, B.H. Effects of slope forest and grass vegetation on reducing rainfall-runoff erosivity in Three Gorges Reservoir Region. Trans. Chin. Soc. Agric. Eng. 2012, 28, 70–76. [Google Scholar] [CrossRef]
  68. El-Kateb, H.; Zhang, H.; Zhang, P. Soil erosion and surface runoff on different vegetation covers and slope gradients: A field experiment in Southern Shaanxi Province, China. Catena 2013, 105, 1–10. [Google Scholar] [CrossRef]
  69. Li, Q.Y.; Sun, Y.W.; Yuan, W.L.; Lyu, S.B.; Wan, F. Streamflow responses to climate change and LUCC in a semi-arid watershed of Chinese Loess Plateau. J. Arid Land 2017, 4, 139–151. [Google Scholar] [CrossRef]
  70. Han, Y.N.; Niu, J.Z.; Xin, Z.B.; Wei, Z. Optimization of land use pattern reduces surface runoff and sediment loss in a Hilly-Gully Watershed at the Loess Plateau, China. For. Syst. 2016, 25, 1–14. [Google Scholar] [CrossRef]
Figure 1. General location of Yihe watershed (a) and the study area (b).
Water 11 00887 g001
Figure 2. Sequential Mann-Kendall test for annual streamflow with forward trend uf (solid line) and backward trend ub (dashed line) at the 0.05 confidence level (dotted horizontal lines).
Water 11 00887 g002
Figure 3. Inter-annual changes in sensitivity coefficients for precipitation (a), potential evapotranspiration (b), and w (c).
Water 11 00887 g003
Figure 4. Correlation analysis between the modeled streamflow change and the observed change for Dongwan (a) and Luhun (b) stations.
Water 11 00887 g004
Table 1. Change point detection by Pettitt’s test for annual streamflow at the two stations.
Stationsp-ValueDecision
Luhun0.02Change point: 1985
Dongwan0.04Change point: 1985
Table 2. Hydroclimatic characteristics in the study area.
PeriodStationsQ (mm)P (mm)PET (mm)wSensitivity Coefficient
AverageZβAverageZβAverageZβAverageZβεpεpetεw
Whole periodDW125.39−1.77 **−0.17837.03−0.25−0.23420.531.54 *0.052.010.690.0051.89−1.65−1.23
LH150.94−1.97 **−0.21712.35−0.68−1.39441.370.130.592.141.180.023.22−1.53−1.42
Period IDW144.150.220.05861.97−0.48−0.21420.10−1.7 2 **−1.091.96−0.75-0.012.23−2.02−1.68
LH176.64−0.26−0.03718.04−0.26−0.20450.04−2.95 **−3.162.16−1.45-0.053.87−2.34−1.01
Period IIDW104.21−0.48−0.06808.83−1.74 **−0.71401.011.69 **1.312.080.050.0021.95−2.07−0.74
LH121.89−0.16−0.07703.310−0.03431.583.59 ***4.522.131.060.053.91−2.36−1.43
Note: * Significance at p < 0.05, ** significance at p < 0.01, *** significance at p < 0.001; DW refers to Dongwan station and LH is Luhun station. Q is streamflow; P is precipitation; PET is potential evapotranspiration; w is land use condition. Z refers to change trend; a positive or negative value of Z indicates an upward or downward trend; β refers to the magnitude of change trend. εp, εpet and εw refer to the sensitivity of precipitation, potential evapotranspiration and land use to streamflow change.
Table 3. Hydrometeorological change and attribution analysis.
StationsDifference between ΔQ and ΔQ’ from Period I to Period IIP/PET/Land Use Change Induced Streamflow Change (mm)Contribution to Streamflow Change (%)
ΔQΔQΔΔQpΔQpetΔQwηpηpetηw
Dongwan−55.53−56.551.02−27.91−13.53−14.0950.0124.2525.25
Luhun−72.65−72.880.23−40.22−17.76−14.6755.3624.4520.19
Note: Δ is the error between ΔQ’ (the observed streamflow change) and ΔQ (the modelled streamflow change).
Table 4. Changes in land use types in the study area.
Land Use TypeArea (km2)Percentage (%)
1985200519852005
Cultivated land1514.821503.1732.5632.31
Forest land2568.392588.6355.2055.64
Grass land389.01350.738.367.54
Water body87.3895.631.882.056
Built-up land94.24116.572.032.51
Unused land0.660.830.010.02
Table 5. Transition matrix of land use types for the period 1985–2005 in the study area (km2).
Land Use Type2005
Cultivated LandForest LandGrass LandWater BodyBuilt-Up LandUnused Land
1985Cultivated land1479.615.85010.7118.590.06
Forest land0.812563.8700.133.590
Grass land22.0915.92350.7300.160.10
Water body0.650084.7800
Built-up land000094.240
Unused land000000.67
Table 6. Effects of land use types on streamflow.
PeriodContribution of Different Land Use Types to Streamflow Decline/%
Cultivated LandForest LandGrass LandBuilt-Up Land
Period I15.5540.9620.4313.06
Period II15.4038.4134.7411.43

