Effects of Multi-Dike Protection Systems on Surface Water Quality in the Vietnamese Mekong Delta

 ,
,  ,
, 
 , ,
, ,  and
and
Abstract
1. Introduction
2. Materials and Methods
2.1. Site Description
2.2. Water Quality Sampling and Analysis
2.3. Spatial Pattern Water Quality Analysis
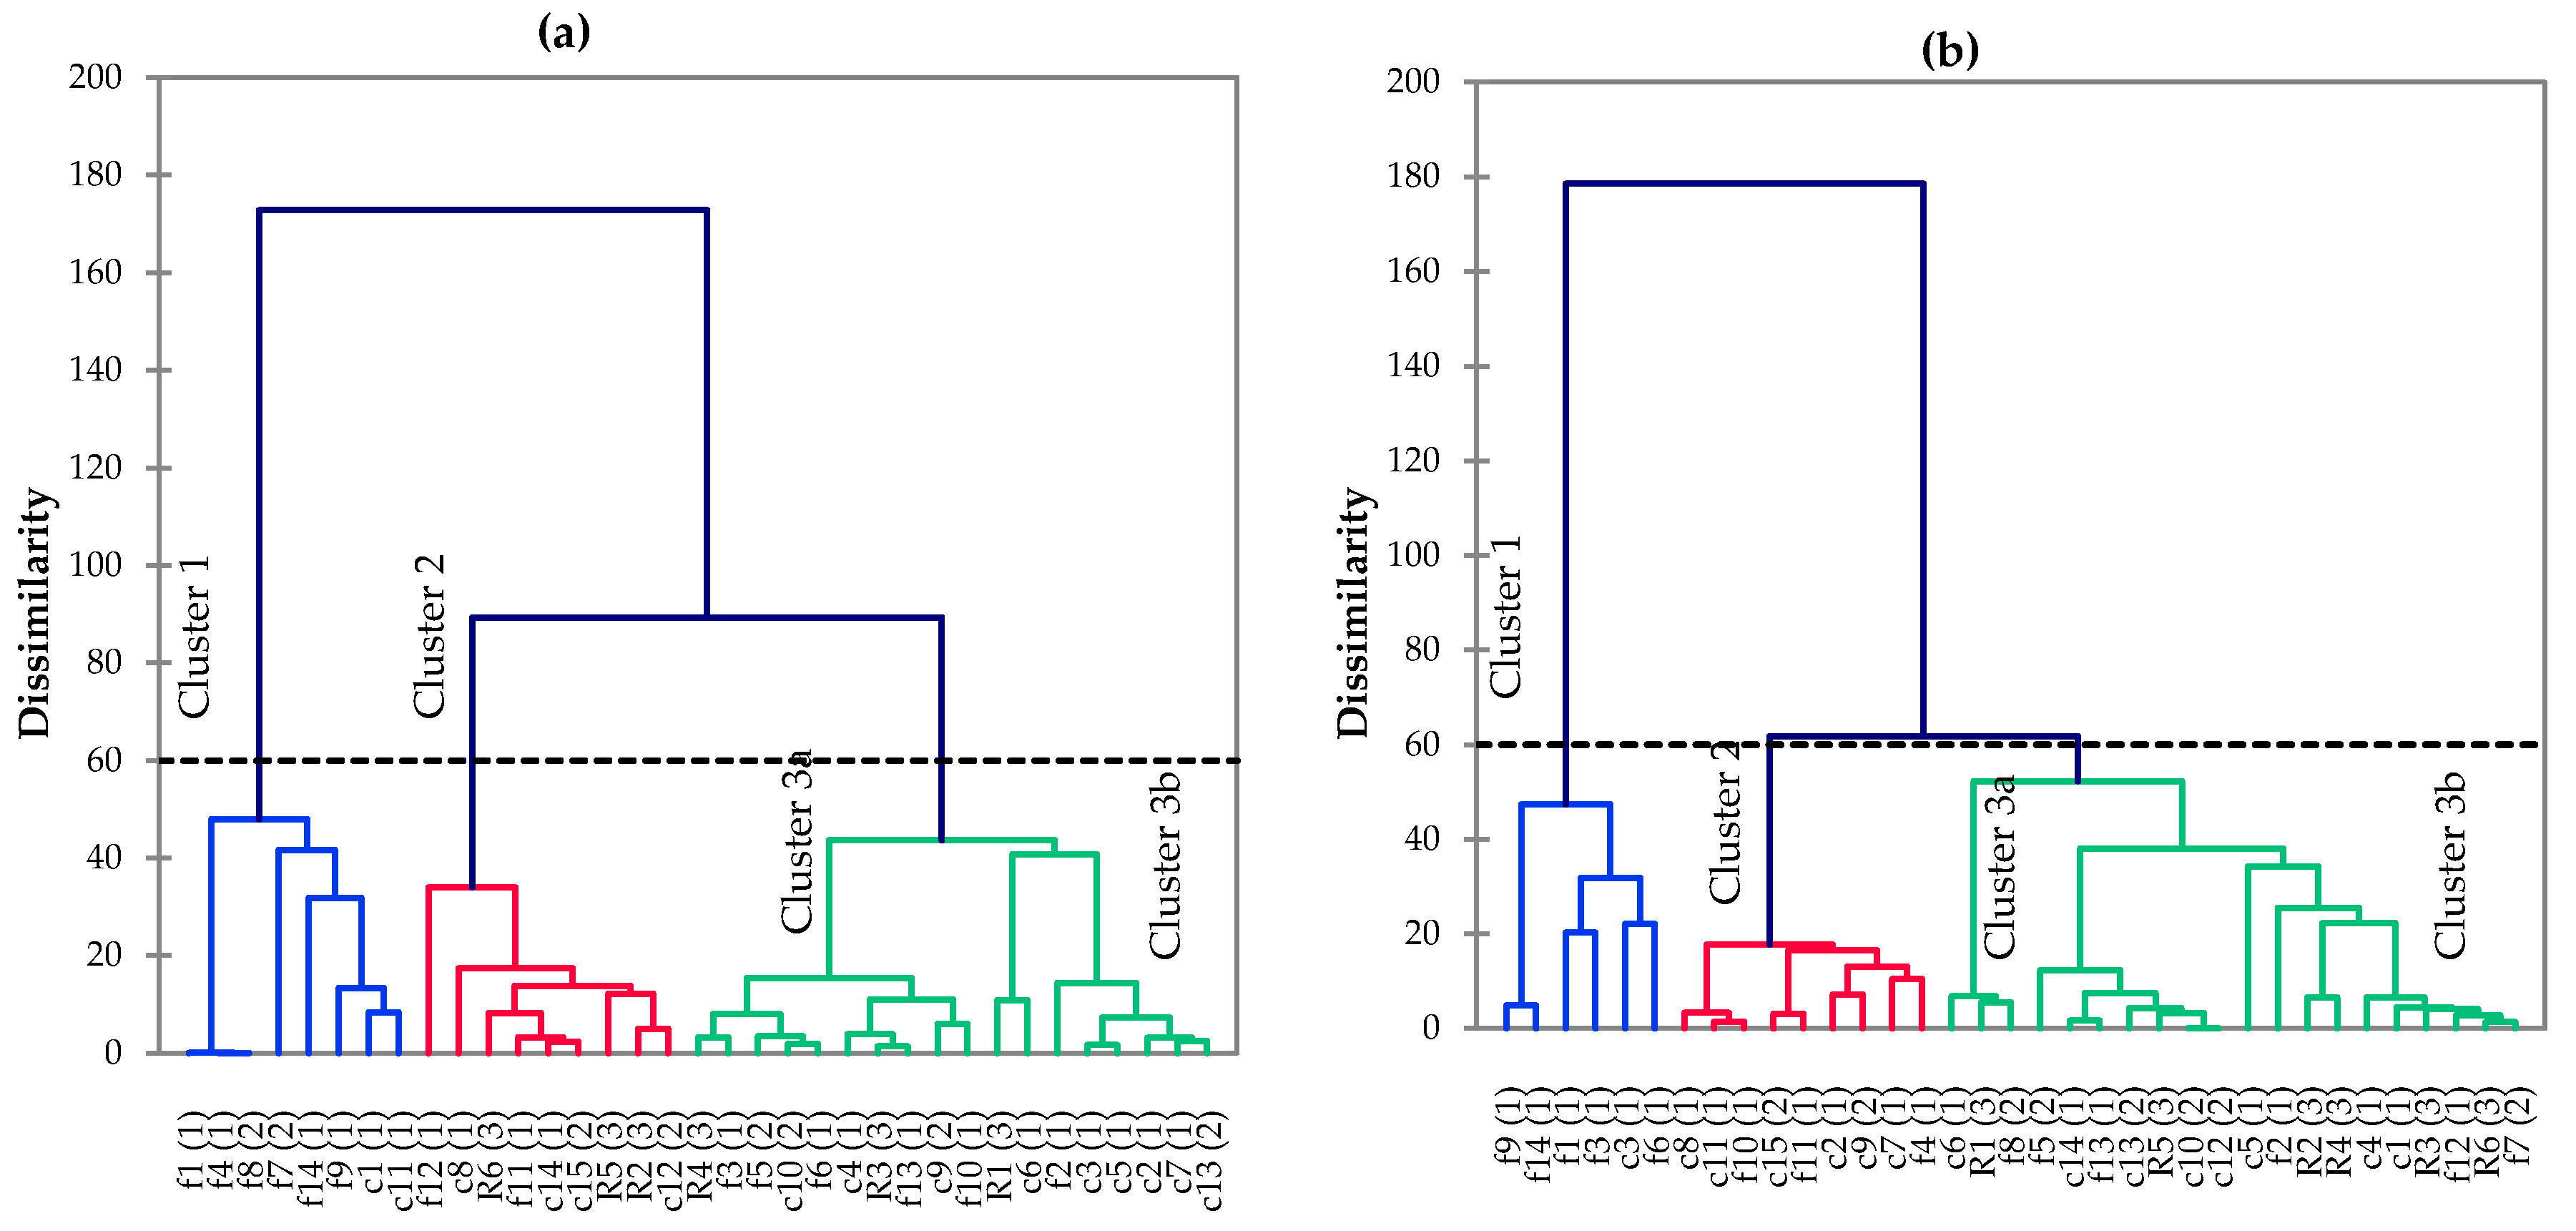
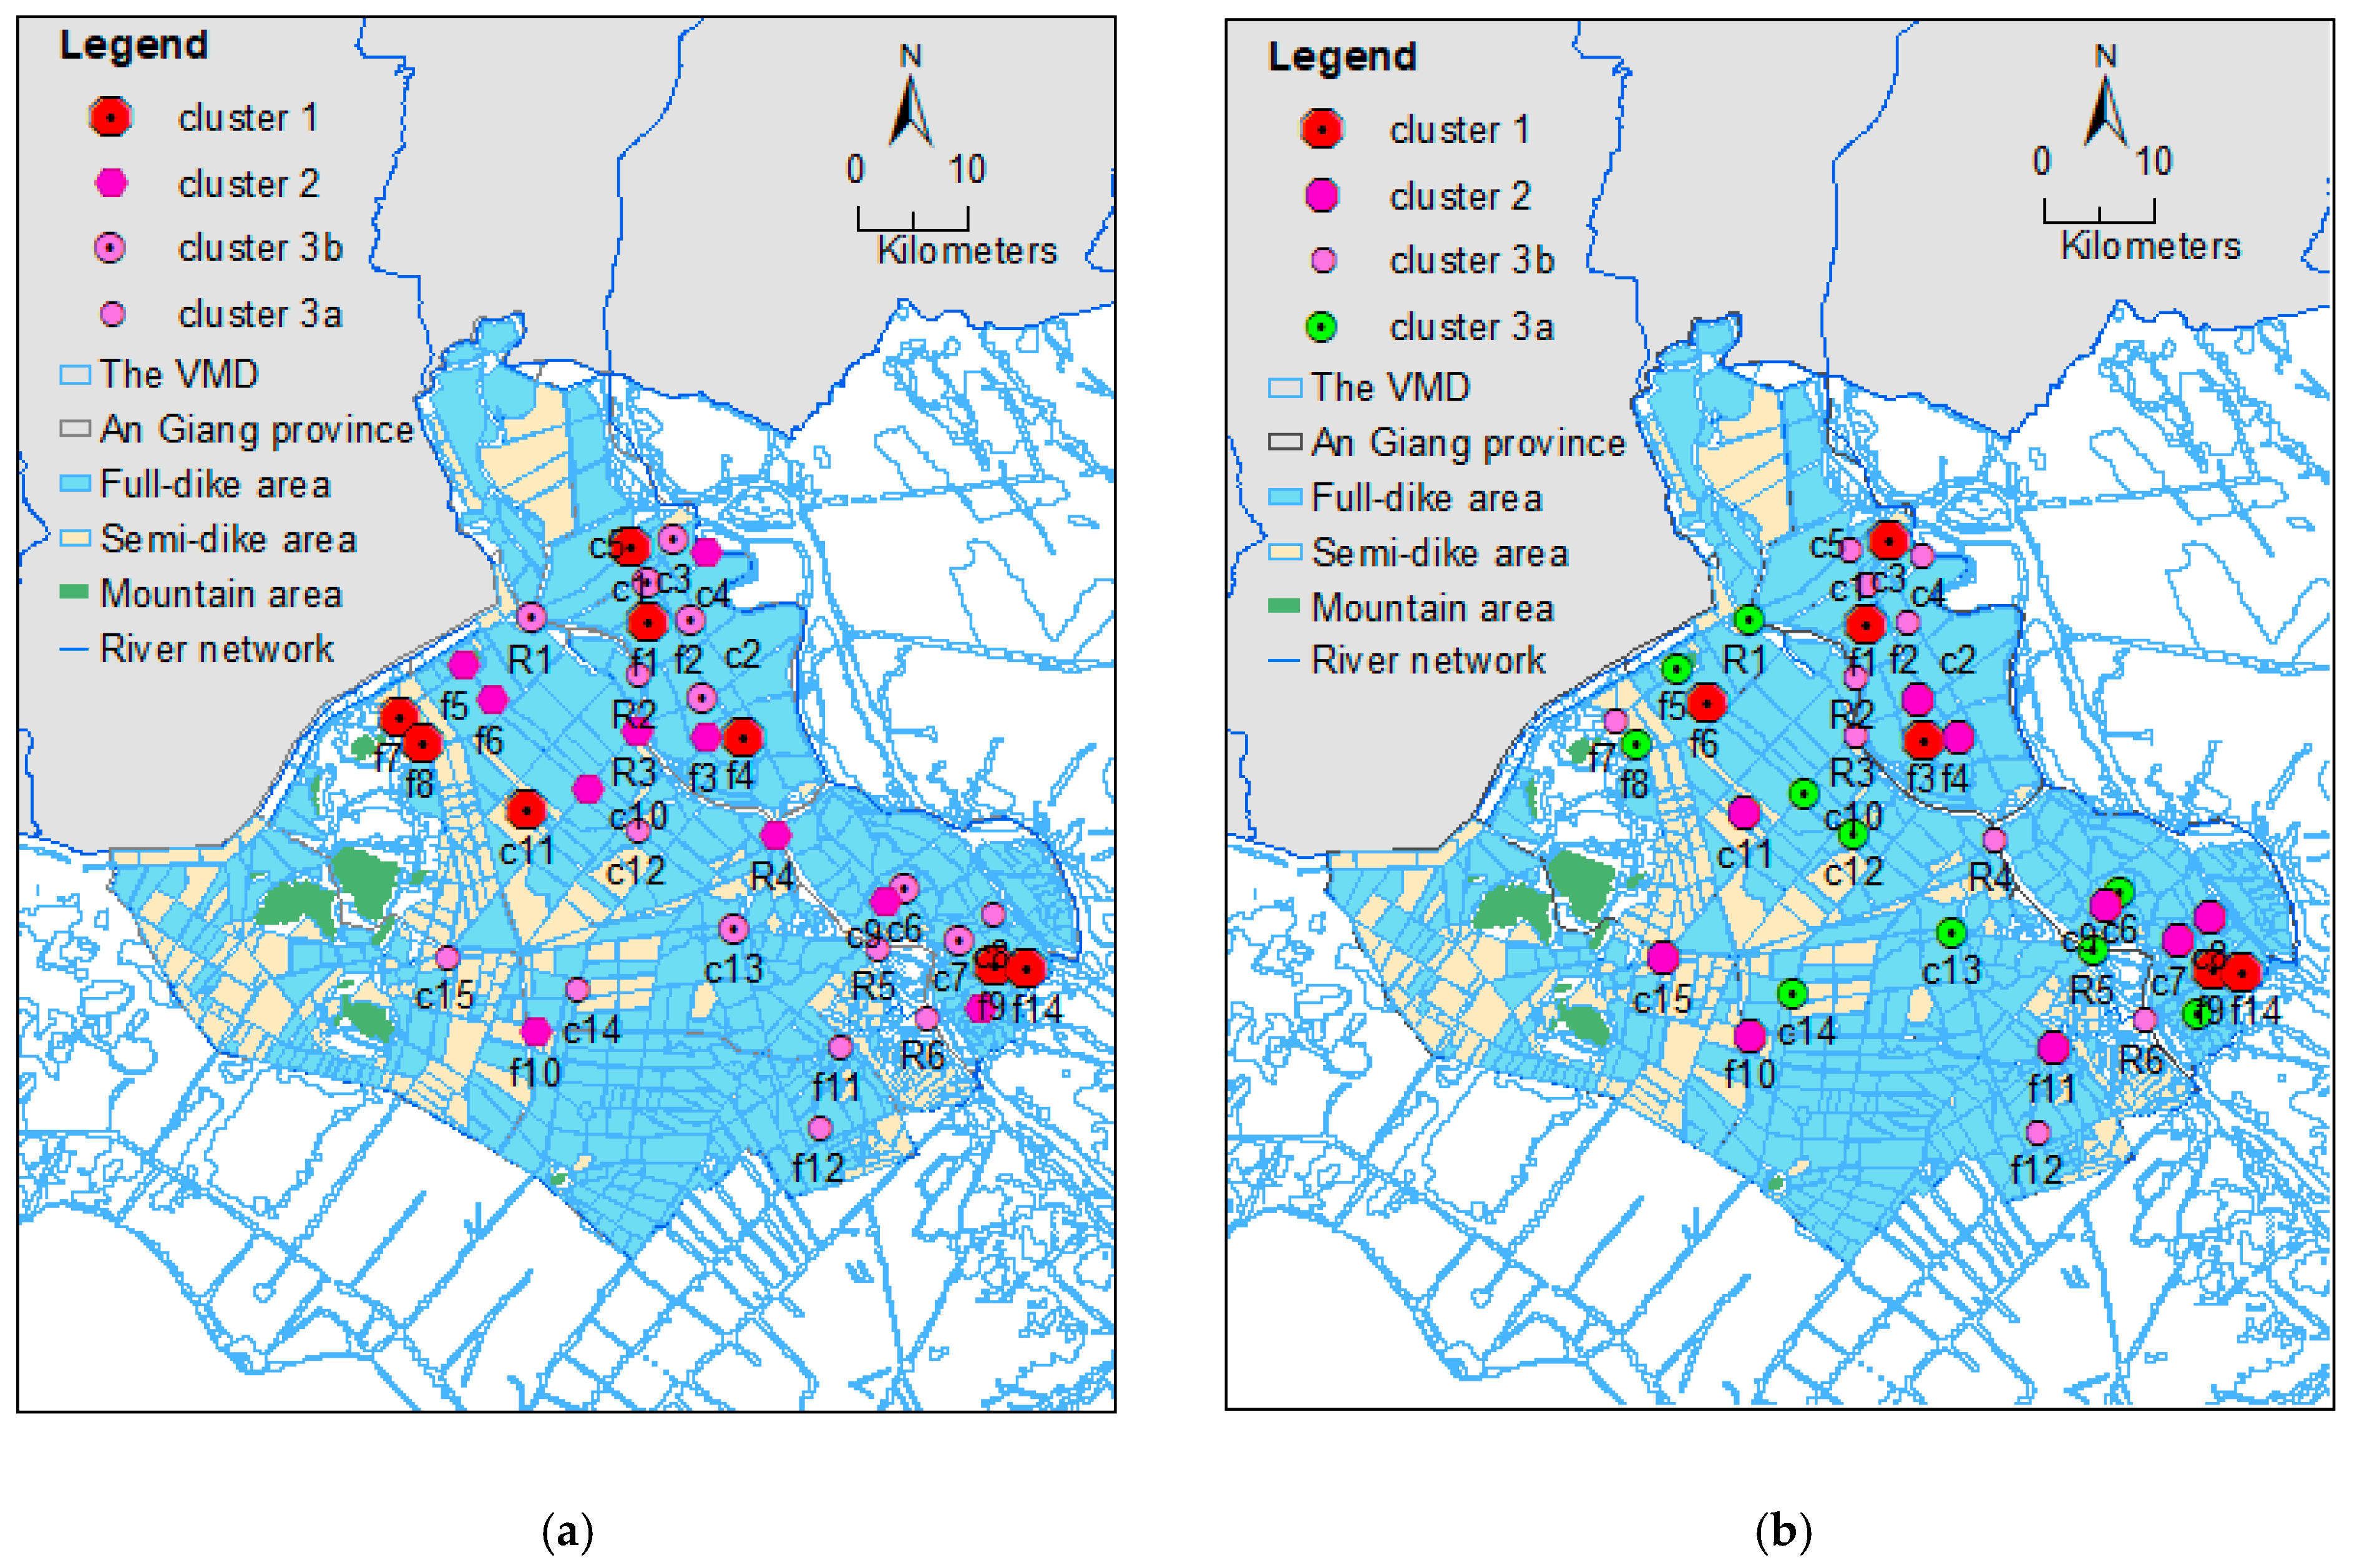
- The CA tool, an unsupervised model, was applied to examine the spatial and temporal differences. This tool had been applied previously for water quality assessment [52,53,57,58,59]. In this study, CA was chosen to divide the data set into clusters within 35 water sampling sites. The most common approach starts at each site with the cluster that is most similar to a predetermined selection criterion. Then, the sites are joined together in a separate cluster until only one cluster remains [51,52,53,60,61,62,63]. For example, agglomerative hierarchical clustering with a bottom-up approach was applied, wherein each site starts in its own cluster, and then pairs of clusters are merged, moving up the hierarchy. Ward’s method measures the distance between linked clusters, in which Dlink/Dmax represents the ratio of the linkage distances of the identified cluster to maximal linkage distance [50,53,62,64,65].
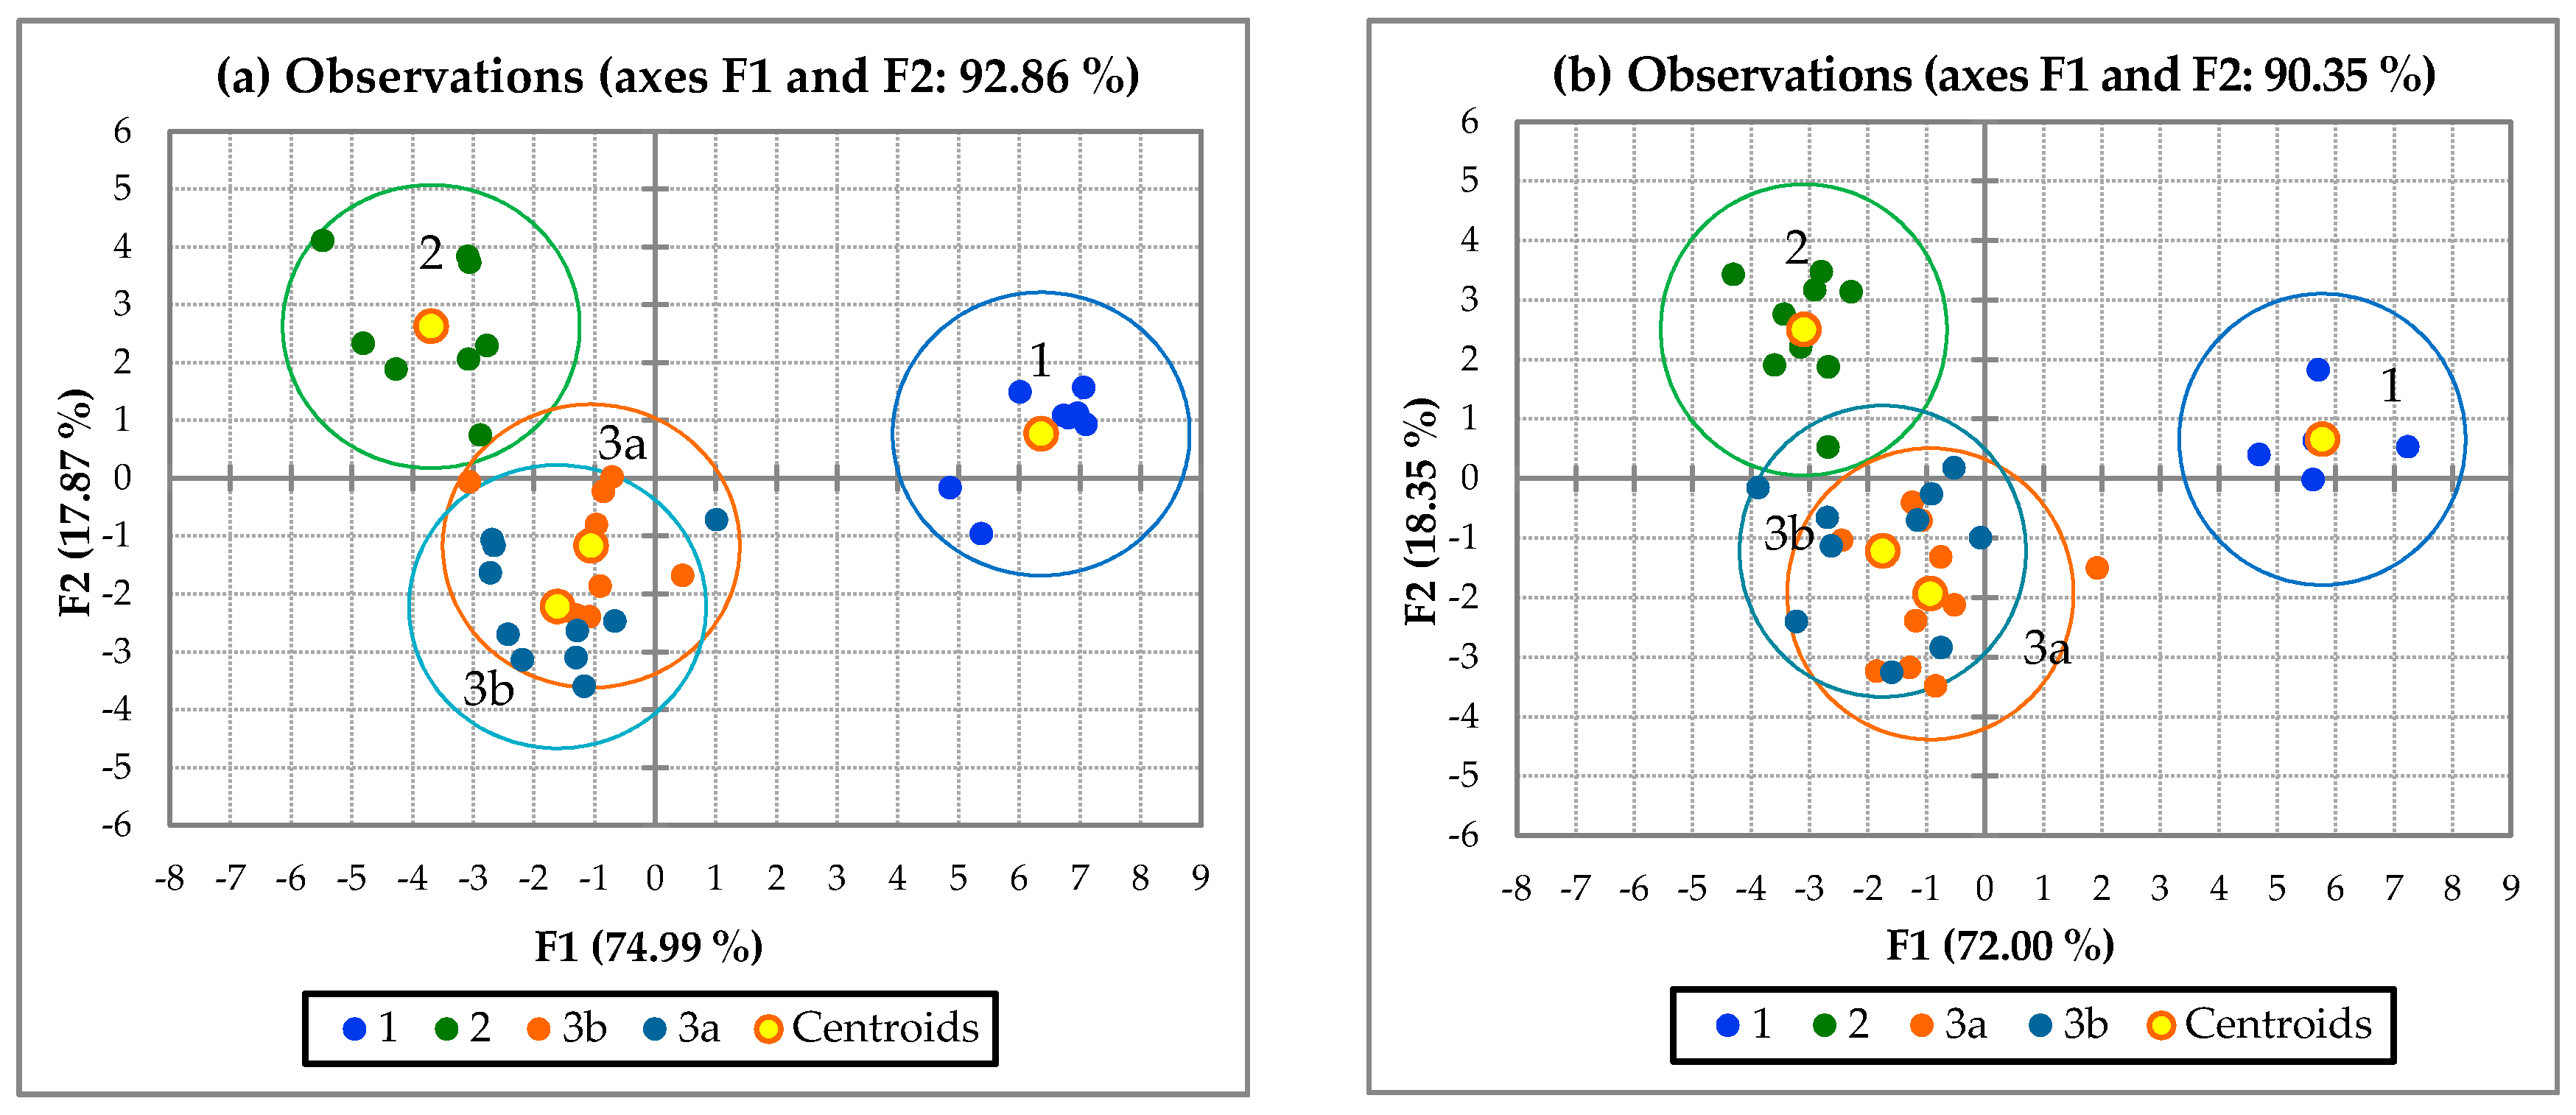
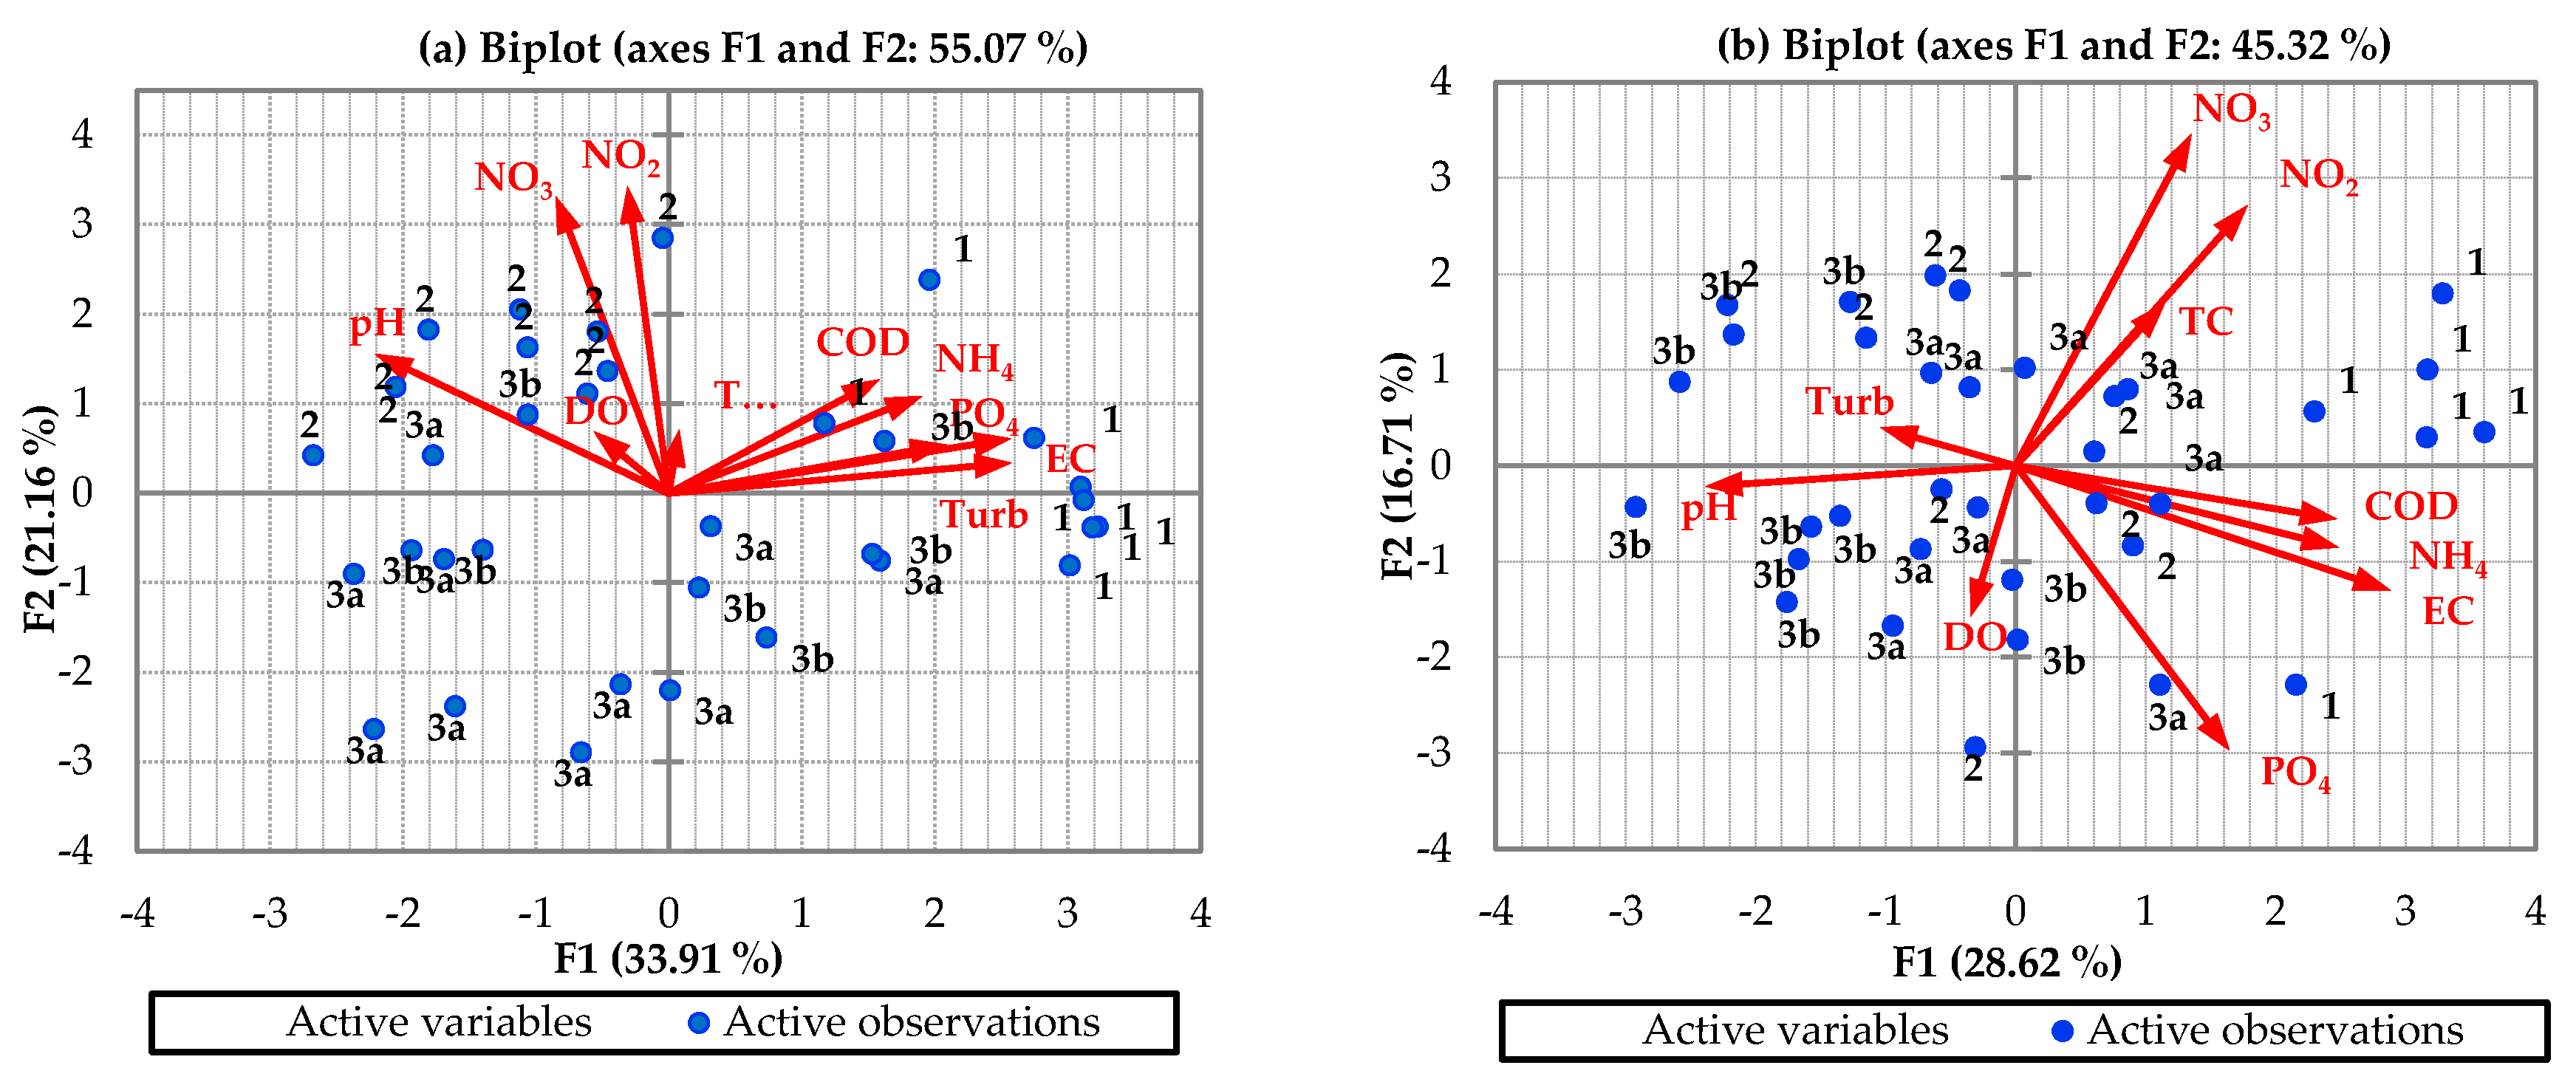
- PCA was used to transform the original variables into new principal components, performed along the directions of maximum variance. Additionally, ways were identified of reducing the contribution of the less significant variables with minimal information loss. In this study, the principal component was applied to identify which factors were the most important parameters of water quality, as expressed by Equation (2) [59,66,67,68,69,70,71,72,73].where Z is the component score, a is the component loading, x is the component number, j is the sample number, and m is the total number of variables.
- FA was used to reduce the contribution of less significant variables in order to further simplify the data structure produced by PCA. Factor analysis is expressed by Equation (3).where Z is the measured variable, a is the factor loading, f is the factor score, e is the residual term accounting for errors or other sources of variation, i is the sample number, and m is the total of the factors.
2.4. Water Quality Assessment
3. Results
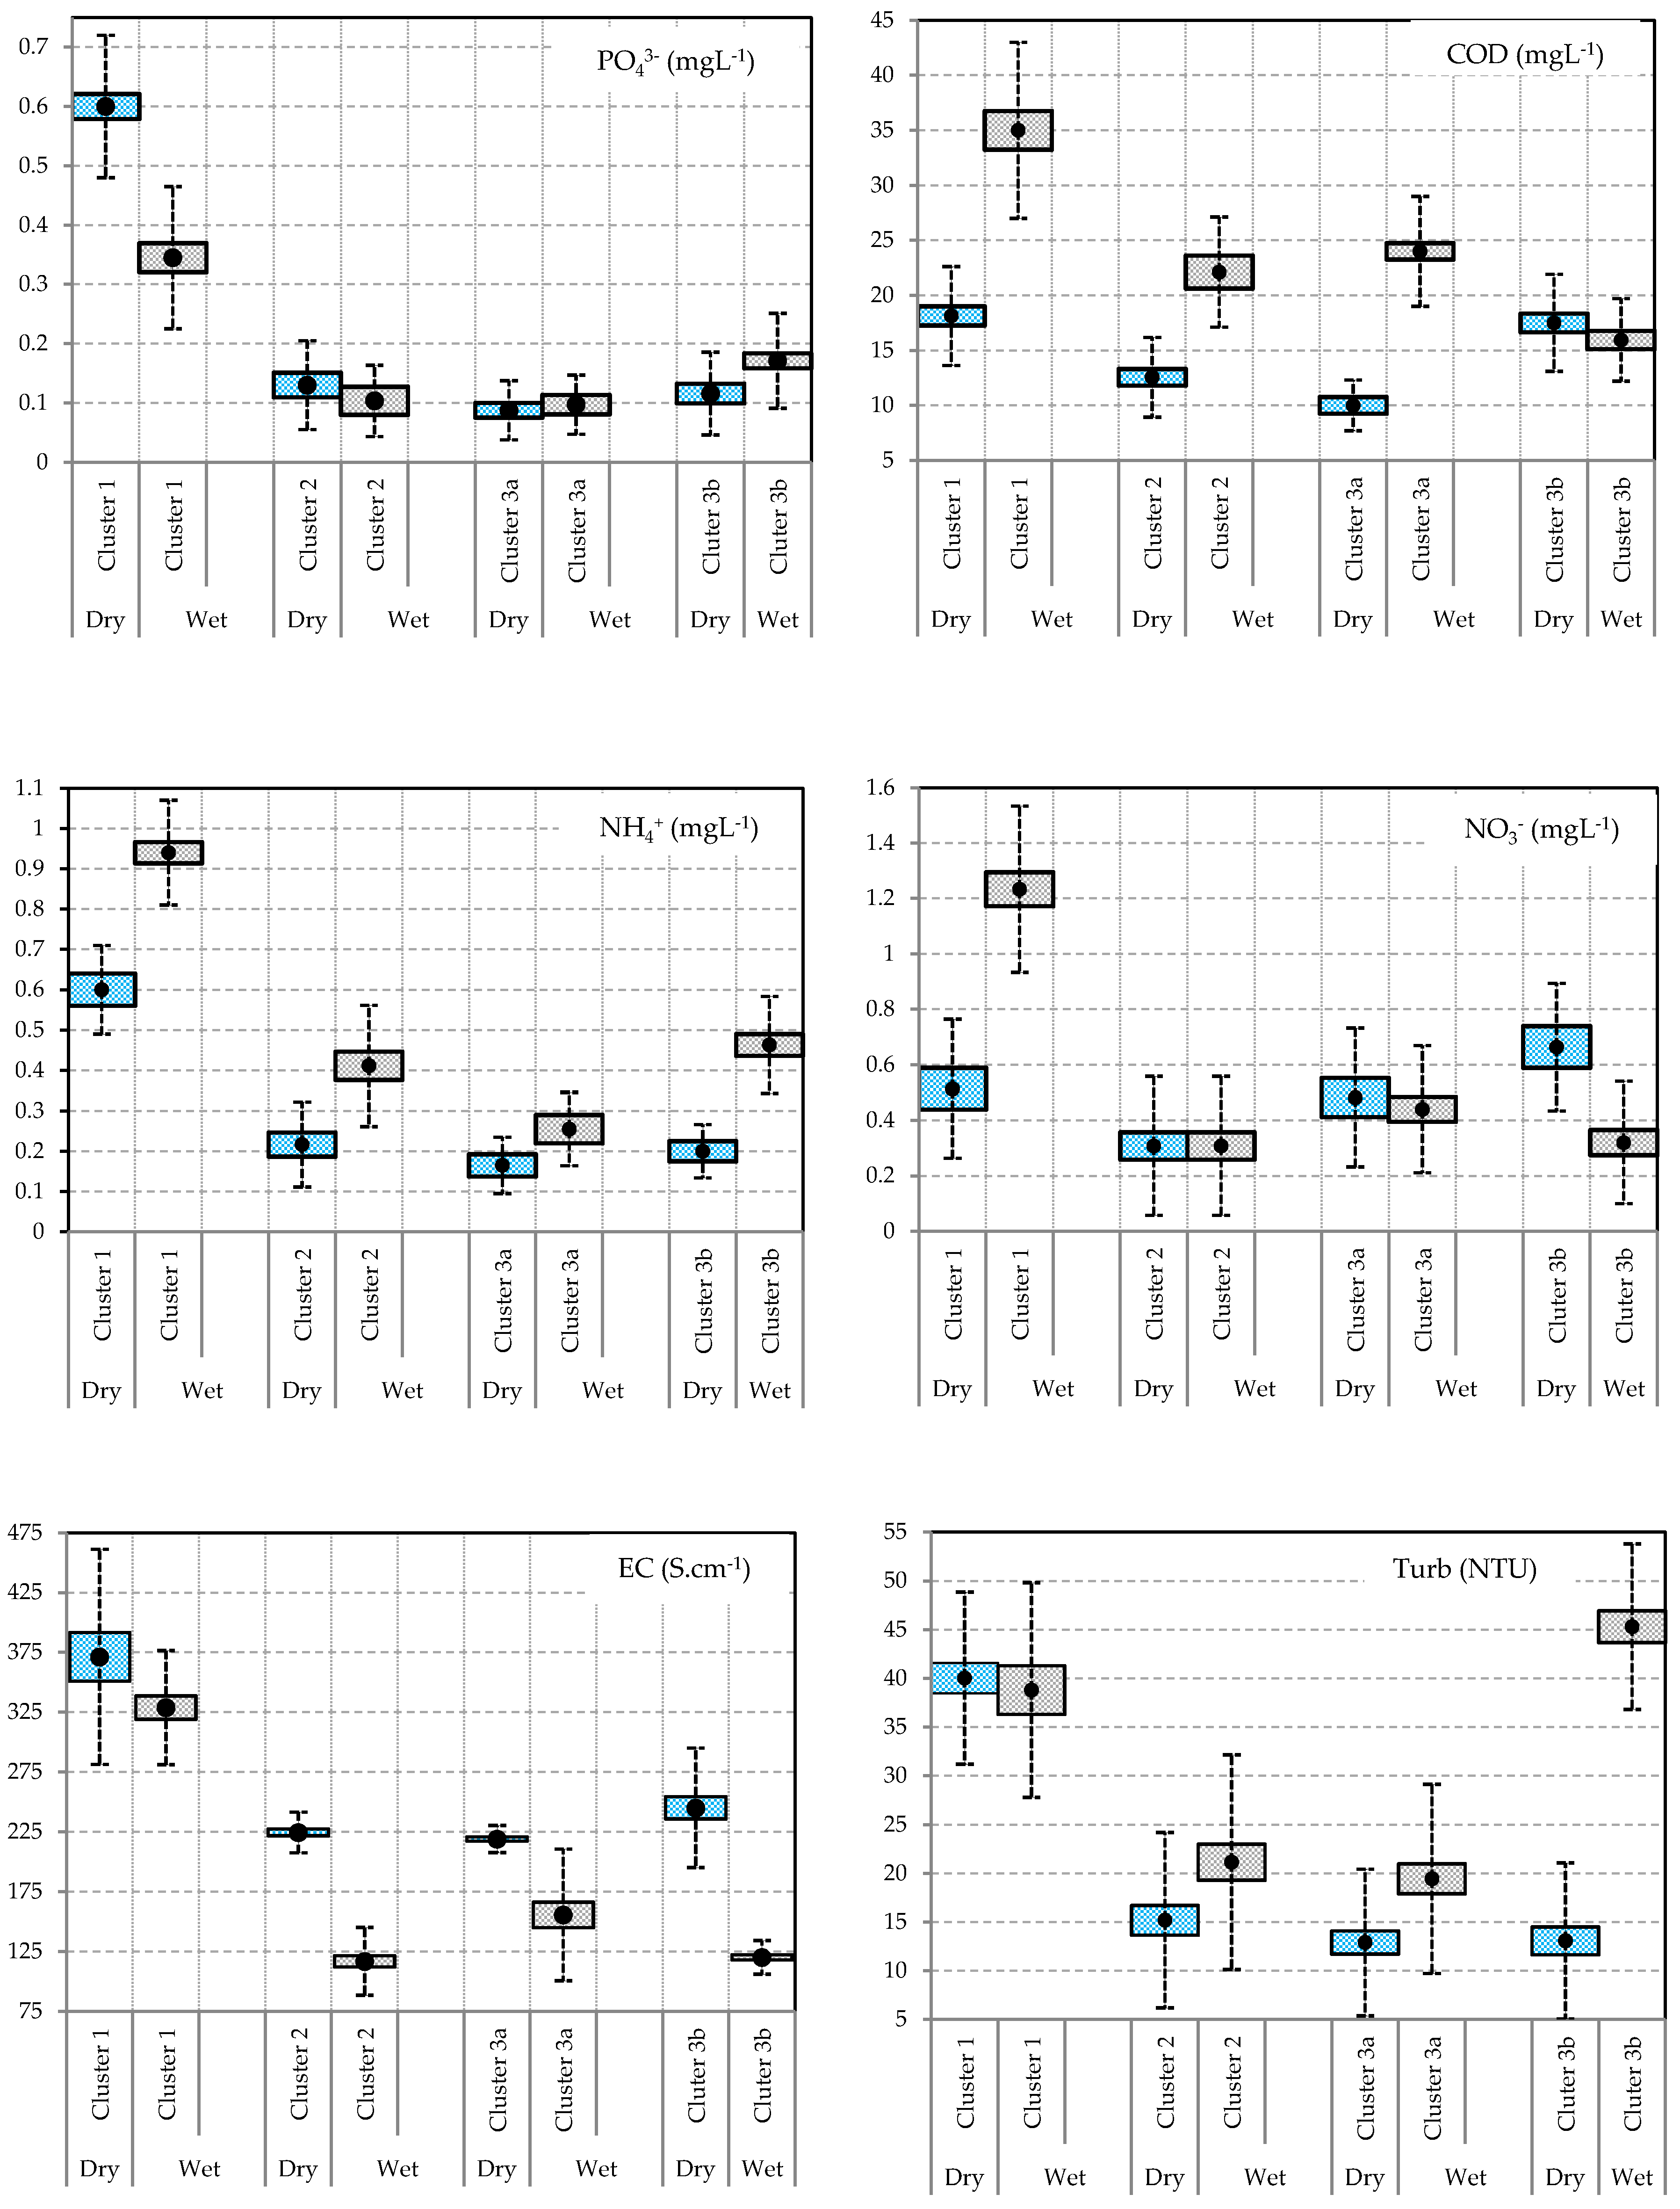
3.1. Temporal Variation of Water Quality Parameters
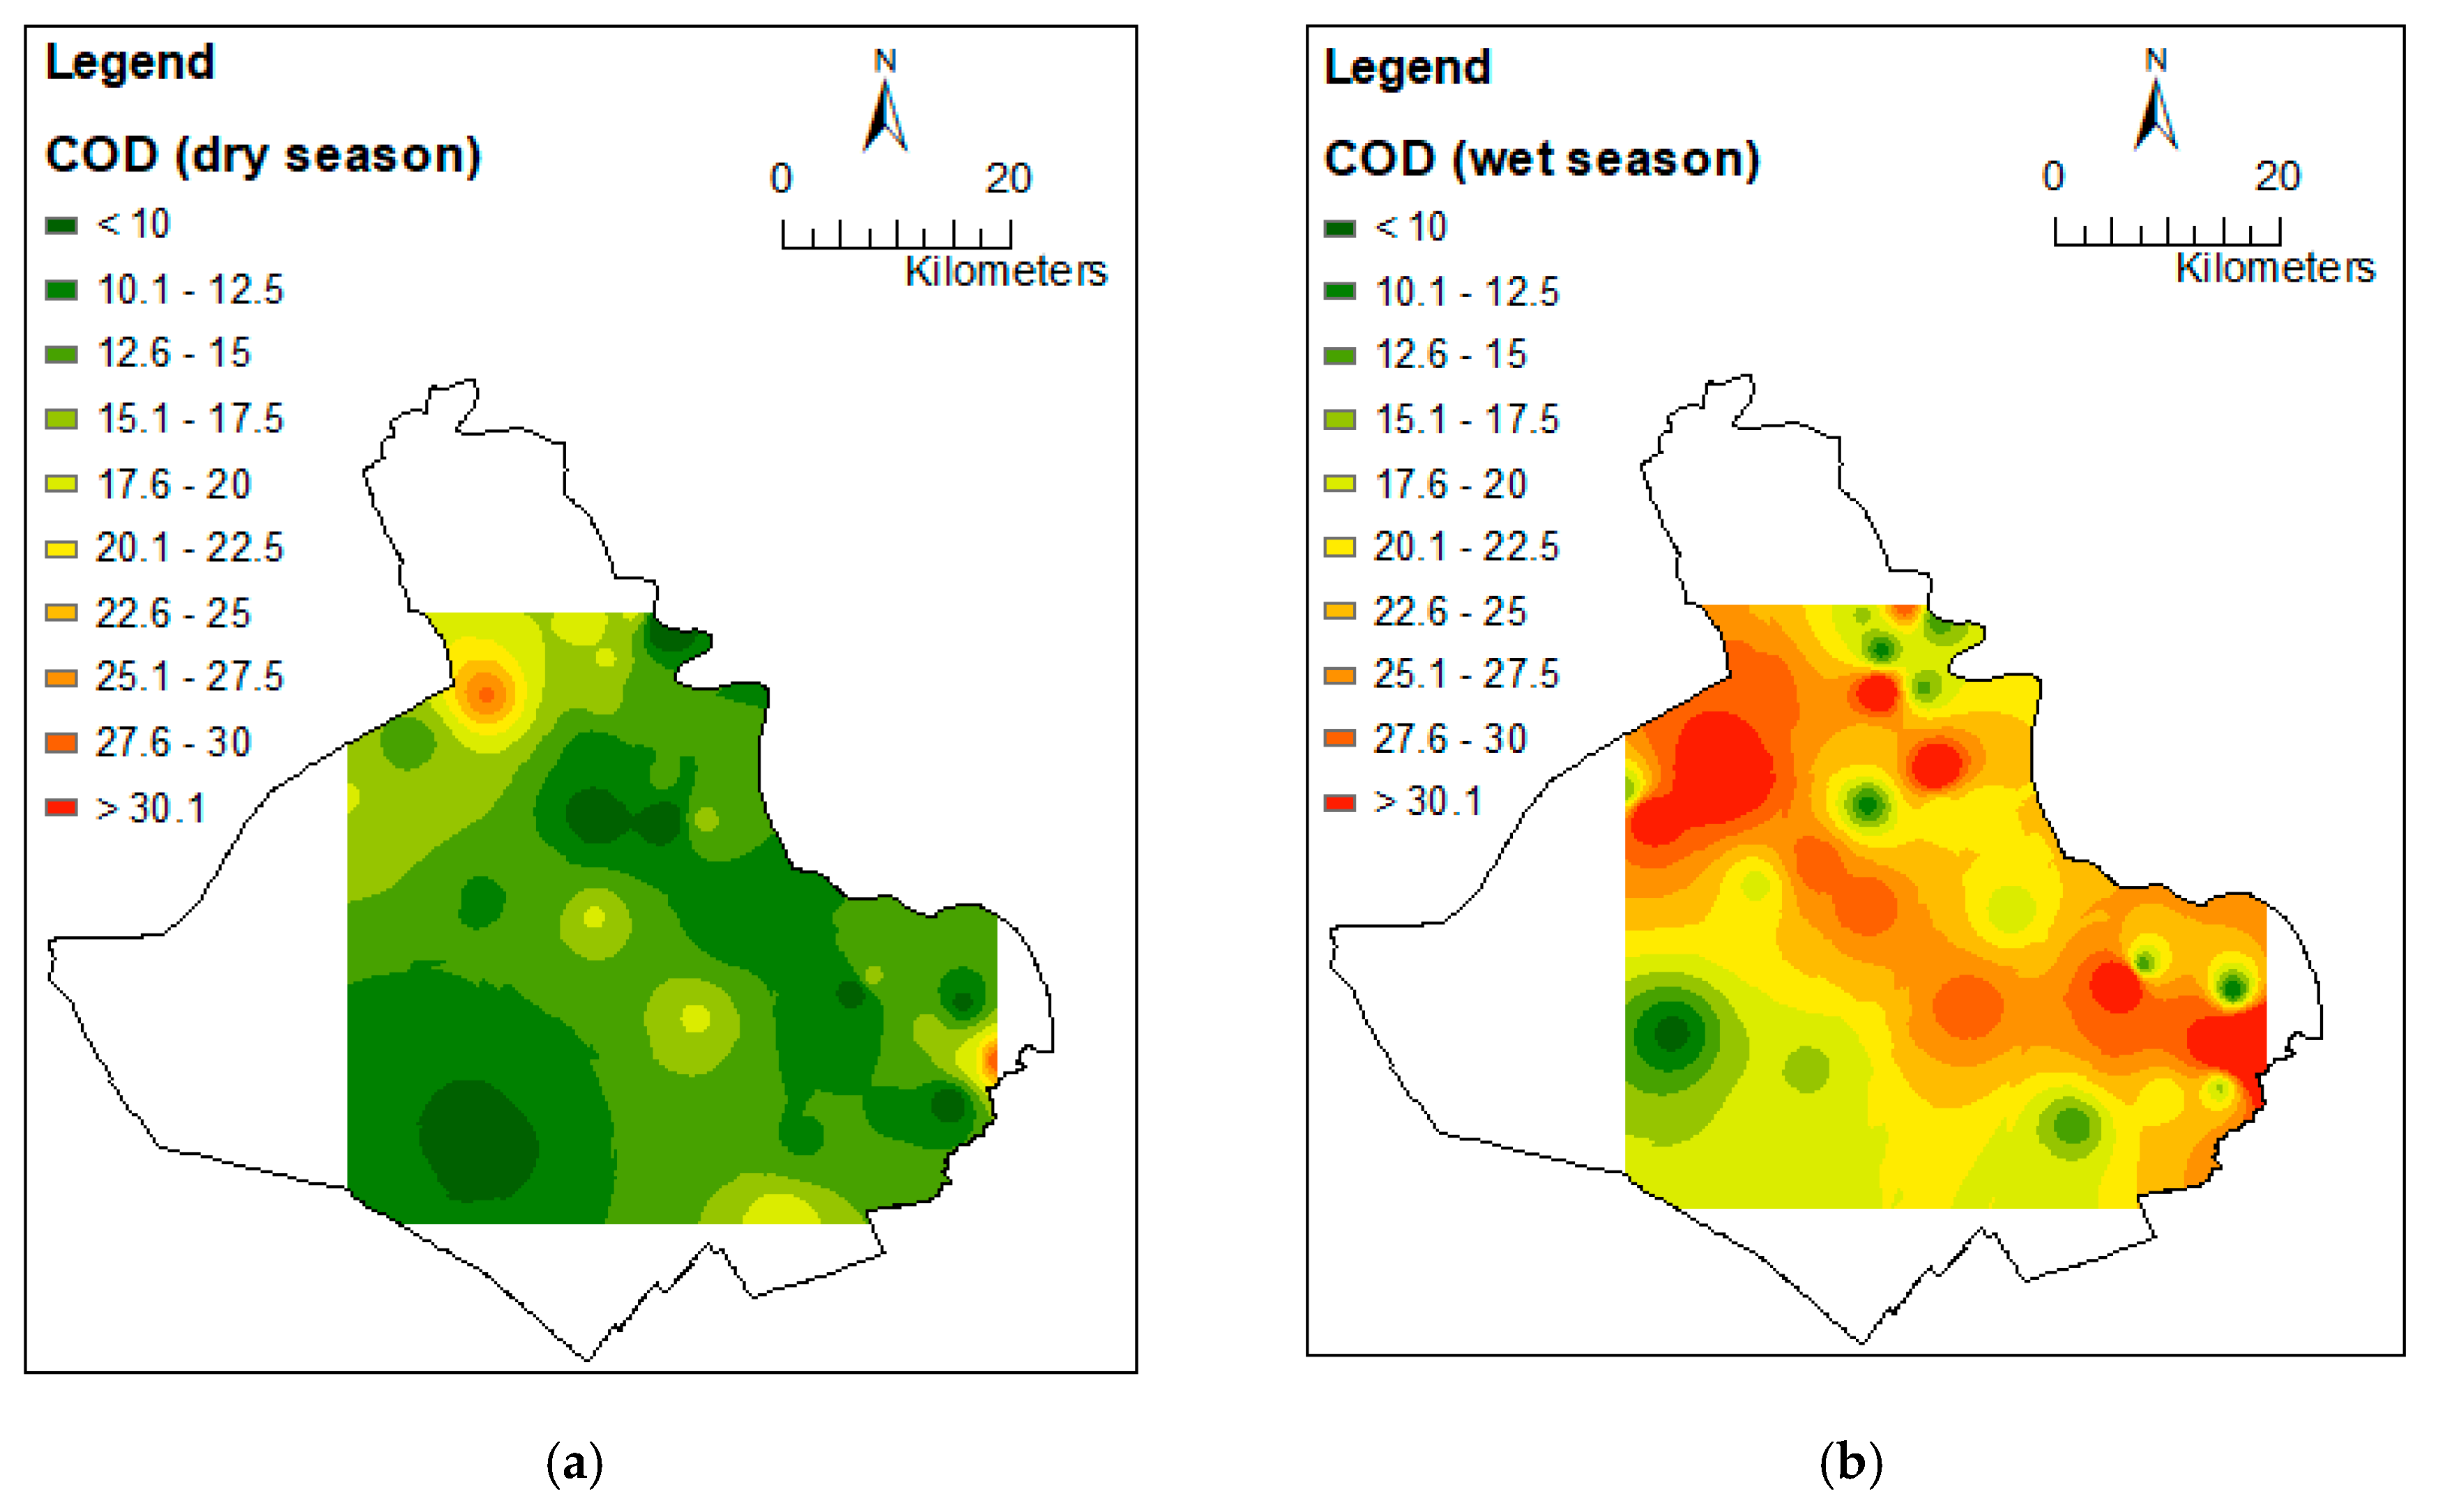
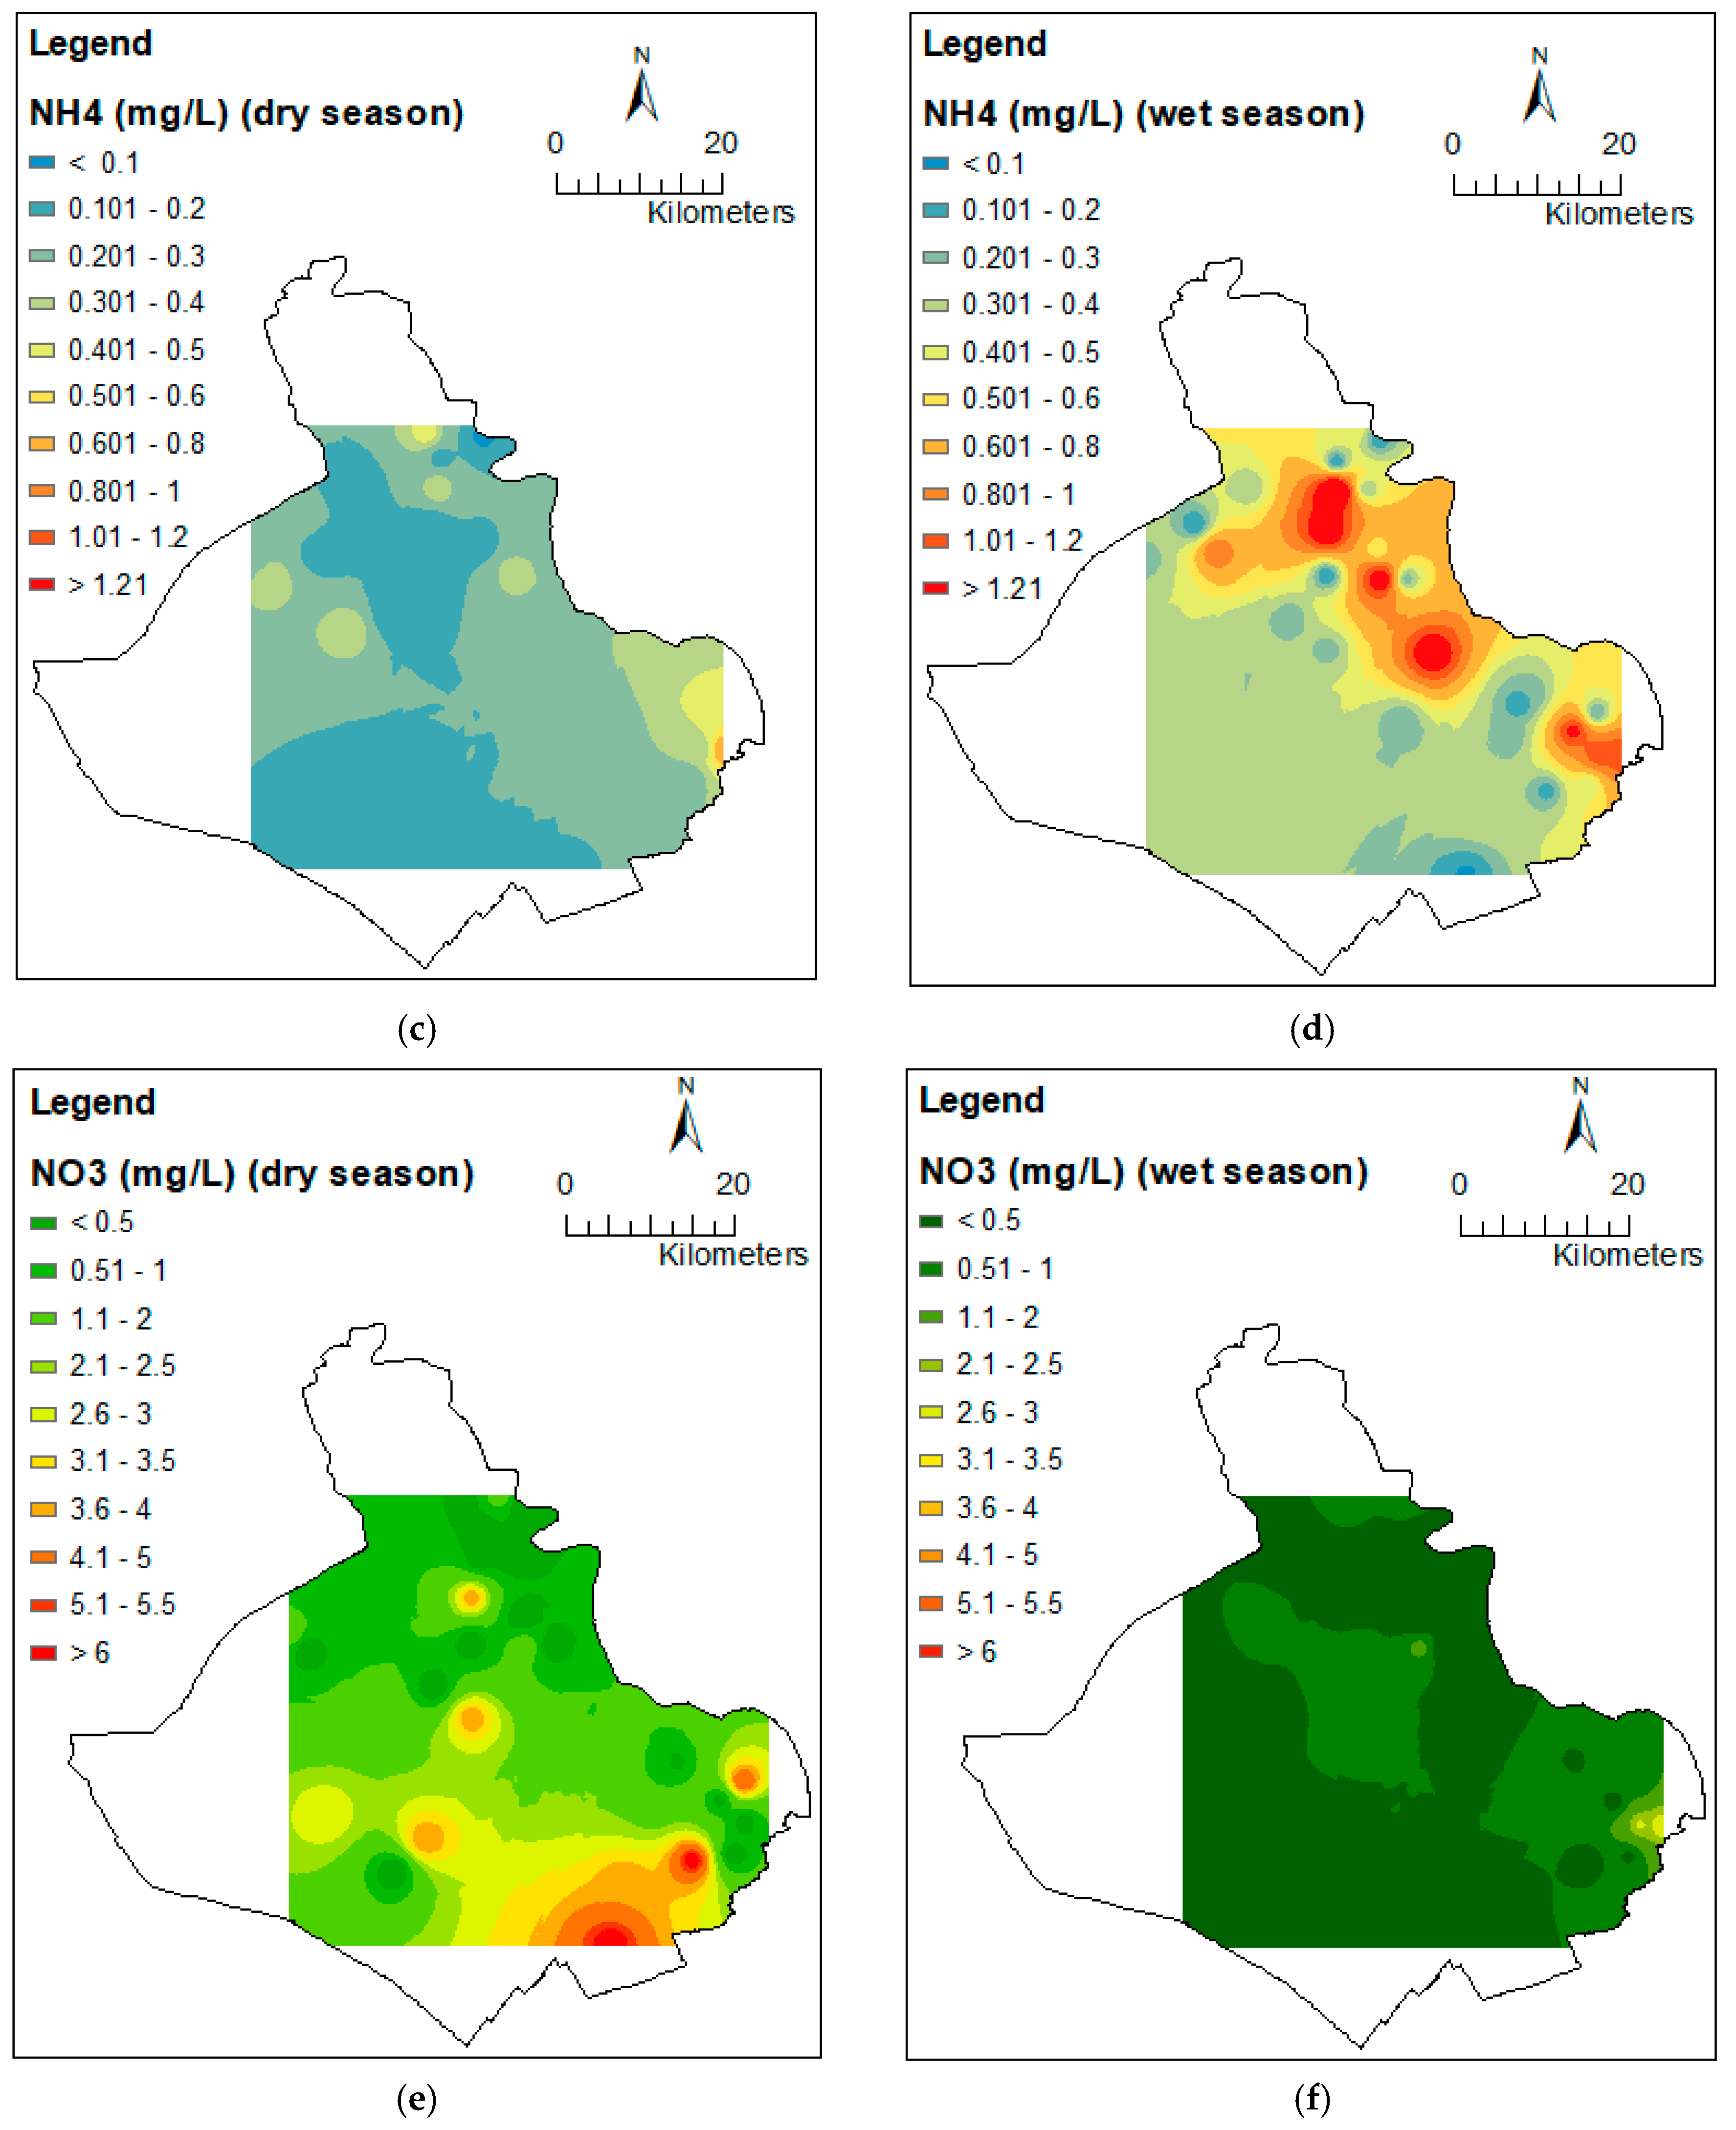
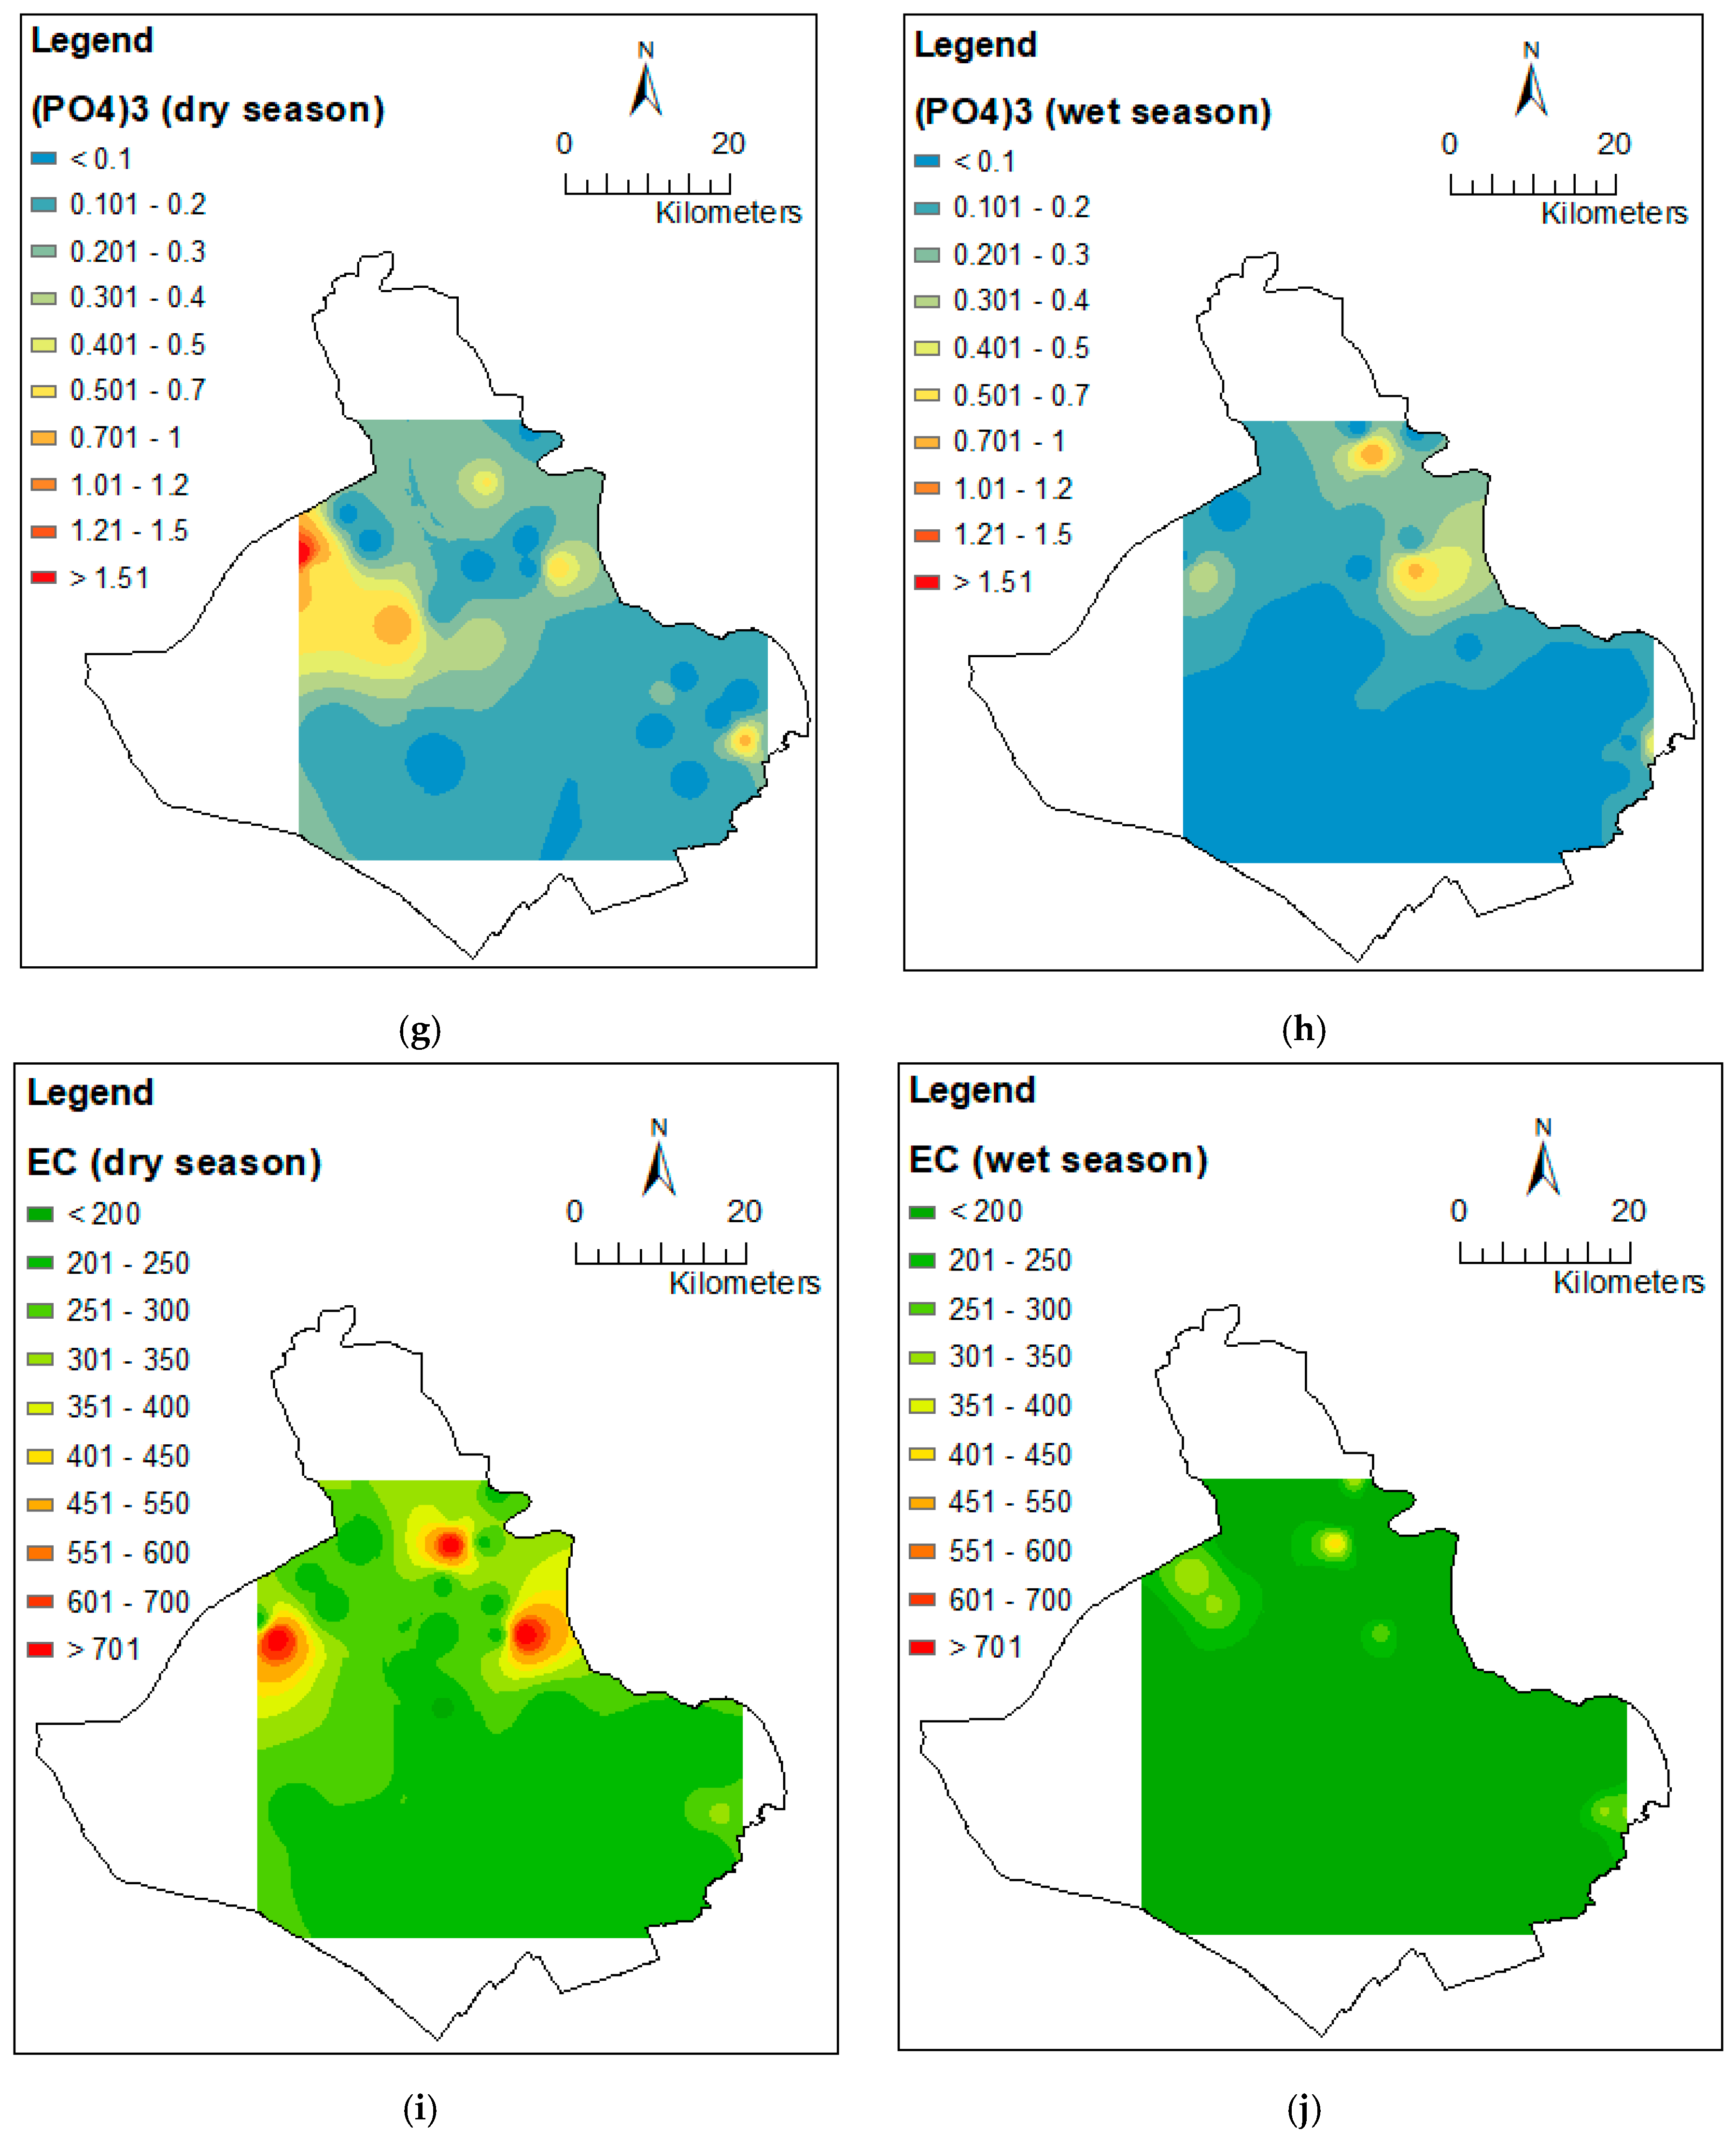
3.2. Spatial Variation of Water Quality Parameters
3.3. Data Structure Determination and Source Identification
3.4. Water Quality Assessment
4. Discussion
5. Conclusions
Author Contributions
Funding
Acknowledgments
Conflicts of Interest
Appendix A. Descriptive Statistics of the Collected Data

| From\to | Dry Season | Wet Season | Total | % Correct |
|---|---|---|---|---|
| Standard mode | ||||
| Dry season | 33 | 1 | 34 | 97.14% |
| Wet season | 2 | 32 | 34 | 93.94% |
| Total | 35 | 33 | 68 | 95.54% |
| Backward stepwise mode | ||||
| Dry season | 31 | 3 | 34 | 91.43% |
| Wet season | 2 | 32 | 34 | 93.94% |
| Total | 33 | 35 | 68 | 92.68% |
| Forward stepwise mode | ||||
| Dry season | 31 | 3 | 34 | 91.43% |
| Wet season | 2 | 32 | 34 | 93.94% |
| Total | 33 | 35 | 68 | 92.68% |
Appendix B. Values of Water Quality Parameters in Dry Season (a) and Wet Season (b)
| Variables | Cluster 1 | Cluster 2 | Cluster 3a | Cluster 3b | ||||||||||||
|---|---|---|---|---|---|---|---|---|---|---|---|---|---|---|---|---|
| Min | Max | Mean | SD | Min | Max | Mean | SD | Min | Max | Mean | SD | Min | Max | Mean | SD | |
| DO | 4.98 | 7.83 | 5.93 | 0.93 | 5.11 | 7.96 | 6.67 | 1.06 | 4.98 | 7.55 | 5.66 | 0.78 | 5.66 | 8.24 | 7.38 | 0.78 |
| pH | 6.8 | 8 | 7.21 | 0.43 | 7.8 | 8.5 | 8.17 | 0.25 | 7.30 | 8.60 | 7.69 | 0.39 | 7.20 | 9.4 | 7.84 | 0.89 |
| EC | 220 | 810 | 486 | 270 | 190 | 250 | 224 | 18.10 | 200 | 330 | 228 | 37.06 | 200 | 320 | 245 | 48.70 |
| Turbidity | 30 | 56 | 40 | 9 | 3.75 | 30 | 14 | 9.63 | 3.64 | 46.72 | 14.38 | 12.13 | 3.34 | 28.31 | 13 | 8.66 |
| COD | 12 | 30 | 18 | 5.25 | 9 | 20 | 12.56 | 3.84 | 4.50 | 18 | 10.35 | 4.67 | 13 | 28 | 17.5 | 4.72 |
| NH4+ | 0.2 | 0.8 | 0.43 | 0.18 | 0.1 | 0.5 | 0.22 | 0.11 | 0.05 | 0.30 | 0.17 | 0.09 | 0.1 | 0.3 | 0.2 | 0.07 |
| NO2− | 0.01 | 0.2 | 0.07 | 0.06 | 0.05 | 0.4 | 0.18 | 0.11 | 0.01 | 0.10 | 0.02 | 0.03 | 0.01 | 0.1 | 0.03 | 0.03 |
| NO3− | 0.01 | 1.5 | 0.58 | 0.65 | 1.5 | 6 | 4.17 | 1.41 | 0.01 | 1.5 | 0.36 | 0.53 | 0.00 | 2.00 | 0.66 | 0.75 |
| PO43− | 0.2 | 1.8 | 0.7 | 0.51 | 0.02 | 0.4 | 0.13 | 0.13 | 0.01 | 0.80 | 0.14 | 0.24 | 0.02 | 0.30 | 0.13 | 0.10 |
| TC | 170 | 856 | 490 | 218 | 200 | 1040 | 573 | 233 | 144 | 856 | 587 | 195 | 300 | 1200 | 634 | 257 |
| Variables | Cluster 1 | Cluster 2 | Cluster 3a | Cluster 3b | ||||||||||||
|---|---|---|---|---|---|---|---|---|---|---|---|---|---|---|---|---|
| Min | Max | Mean | SD | Min | Max | Mean | SD | Min | Max | Mean | SD | Min | Max | Mean | SD | |
| DO | 6.59 | 7.25 | 6.92 | 0.25 | 6.60 | 7.42 | 7.04 | 0.25 | 6.85 | 9.00 | 7.75 | 0.78 | 6.85 | 7.24 | 7.04 | 0.14 |
| pH | 7 | 7.60 | 7.37 | 0.22 | 7.50 | 8.70 | 7.94 | 0.38 | 7.20 | 8.00 | 7.60 | 0.27 | 7.60 | 8.60 | 8.06 | 0.28 |
| EC | 280 | 430 | 329 | 52.35 | 70 | 160 | 116.6 | 30 | 110 | 350 | 158 | 71.15 | 100 | 140 | 117.7 | 13.94 |
| Turbidity | 13.5 | 80 | 38.8 | 23.80 | 4.34 | 45.38 | 21.14 | 14.26 | 22.40 | 48.20 | 33.47 | 9.31 | 33.8 | 68 | 45.89 | 11.44 |
| COD | 20 | 55 | 39.67 | 13.37 | 9 | 40 | 22.11 | 11.91 | 13 | 35 | 26.20 | 7.51 | 11 | 20 | 15.17 | 3.28 |
| NH4+ | 0.50 | 2 | 1.23 | 0.5 | 0.1 | 1.3 | 0.41 | 0.35 | 0.10 | 0.40 | 0.26 | 0.10 | 0.08 | 1.5 | 0.34 | 0.46 |
| NO2− | 0.01 | 0.75 | 0.32 | 0.31 | 0.00 | 0.05 | 0.02 | 0.02 | 0.01 | 0.05 | 0.02 | 0.01 | 0.01 | 0.70 | 0.09 | 0.23 |
| NO− | 0.02 | 3 | 1.45 | 1.13 | 0.01 | 1 | 0.31 | 0.31 | 0.10 | 0.80 | 0.44 | 0.24 | 0.02 | 1 | 0.32 | 0.32 |
| PO43− | 0.07 | 0.80 | 0.35 | 0.26 | 0.02 | 0.50 | 0.10 | 0.15 | 0.03 | 0.40 | 0.10 | 0.11 | 0.02 | 1 | 0.18 | 0.31 |
| TC | 320 | 740 | 567 | 173 | 430 | 850 | 702 | 143 | 250 | 520 | 391 | 76 | 150 | 480 | 319 | 116 |
Appendix C. Different Spatial Distribution of Water Quality between Dry and Wet Seasons

Appendix D. Correlations between Variables and Factors
| Parameters | Dry Season | Wet Season | ||
|---|---|---|---|---|
| F1 | F2 | F1 | F2 | |
| DO | −0.191 | 0.184 | −0.097 | −0.336 |
| pH | −0.746 | 0.415 | −0.670 | −0.046 |
| EC | 0.907 * | 0.164 | 0.907 * | −0.278 |
| Turb | 0.870 * | 0.091 | −0.293 | 0.086 |
| COD | 0.534 | 0.339 | 0.691 | −0.119 |
| NH4+ | 0.642 | 0.290 | 0.695 | −0.182 |
| NO2− | −0.105 | 0.915 * | 0.499 | 0.582 |
| NO3− | −0.287 | 0.884 * | 0.378 | 0.741 |
| PO43− | 0.705 | 0.145 | 0.460 | −0.635 |
| TC | 0.025 | 0.190 | 0.321 | 0.364 |
References
- Dietz, T.; Stern, P.C.; Rycroft, R.W. Definitions of conflict and the legitimation of resources: The case of environmental risk. Sociol. Forum 1989, 4, 47–70. [Google Scholar] [CrossRef]
- Vörösmarty, C.J.; McIntyre, P.B.; Gessner, M.O.; Dudgeon, D.; Prusevich, A.; Green, P.; Glidden, S.; Bunn, S.E.; Sullivan, C.A.; Liermann, C.R.; et al. Global threats to human water security and river biodiversity. Nature 2010, 467, 555. [Google Scholar] [CrossRef]
- Vörösmarty, C.J.; Green, P.; Salisbury, J.; Lammers, R.B. Global Water Resources: Vulnerability from Climate Change and Population Growth. Science 2000, 289, 284. [Google Scholar] [CrossRef] [PubMed]
- Woodhouse, P.; Muller, M. Water Governance—An Historical Perspective on Current Debates. World Dev. 2017, 92, 225–241. [Google Scholar] [CrossRef]
- Beaulac, M.N.; Reckhow, K.H. An examination of land use nutrient export relationships. Water Resour. Bull. 1982, 18, 1013–1024. [Google Scholar] [CrossRef]
- Carpenter, S.R.; Caraco, N.F.; Correll, D.L.; Howarth, R.W.; Sharpley, A.N.; Smith, V.H. Non-Point Pollution of Surface Waters With Phosphorus and Nitrogen. Ecol. Appl. 1998, 8, 559–568. [Google Scholar] [CrossRef]
- Chiwa, M.; Onikura, N.; Ide, J.; Kume, A. Impact of N-Saturated Upland Forests on Downstream N Pollution in the Tatara River Basin, Japan. Ecosystems 2012, 15, 230–241. [Google Scholar] [CrossRef]
- Forti, M.C.; Neal, C.; Jenkins, A. Modeling perspective of the deforestation impact in stream water quality of small preserved forested areas in the amazonian rainforest. Water Air Soil Pollut. 1995, 79, 325–337. [Google Scholar] [CrossRef]
- Mehdi, B.; Ludwig, R.; Lehner, B. Evaluating the impacts of climate change and crop land use change on streamflow, nitrates and phosphorus: A modeling study in Bavaria. J. Hydrol. Reg. Stud. 2015, 4, 60–90. [Google Scholar] [CrossRef]
- Miller, J.D.; Schoonover, J.E.; Williard, K.W.J.; Hwang, C.R. Whole Catchment Land Cover Effects on Water Quality in the Lower Kaskaskia River Watershed. Water Air Soil Pollut. 2011, 221, 337–350. [Google Scholar] [CrossRef]
- Tayyebi, A.; Pijanowski, B.C.; Pekin, B.K. Land use legacies of the Ohio River Basin: Using a spatially explicit land use change model to assess past and future impacts on aquatic resources. Appl. Geogr. 2015, 57, 100–111. [Google Scholar] [CrossRef]
- USEPA. 2004 National Water Quality Inventory: Report to Congress; United States Environmental Protection Agency Office of Water: Washington, DC, USA, 2009; p. 43.
- Ramankutty, N.; Mehrabi, Z.; Waha, K.; Jarvis, L.; Kremen, C.; Herrero, M.; Rieseberg, L.H. Trends in Global Agricultural Land Use: Implications for Environmental Health and Food Security. Annu. Rev. Plant Biol. 2018, 69, 789–815. [Google Scholar] [CrossRef] [PubMed]
- Shouqiang, L. The Smart Growth of Ulanhot and Arlington. In Proceedings of the 3rd International Conference on Management Science and Innovative Education (MSIE 2017), Jinan, China, 14–15 October 2017. [Google Scholar]
- Mutert, E.; Fairhurst, T.H. Developments in rice production in Southeast Asia. Better Crops Int. 2002, 15, 12–17. [Google Scholar]
- Thakur, A.K.; Rath, S.; Mandal, K.G. Differential responses of system of rice intensification (SRI) and conventional flooded-rice management methods to applications of nitrogen fertilizer. Plant Soil 2013, 370, 59–71. [Google Scholar] [CrossRef]
- General Statistics Office of Vietnam (GSO). Statistical Year Book of Viet Nam 2014; General Statistics Office of Vietnam (GSO): Hanoi, Vietnam, 2014.
- Minister of Agriculture and Rural Development (MARD). The Action Plan Framework for Adaptation to Climate Change in the Agriculture and Rural Development Sector Period 2008–2020; Minister of Agriculture and Rural Development (MARD): Hanoi, Vietnam, 2008.
- Ministry of Planning and Investment (MPI). Decree; Ministry of Planning and Investment (MPI): Hanoi, Vietnam, 2006.
- Liew, S.C.; Kam, S.-P.; Tuong, T.-P.; Chen, P.; Minh, V.Q.; Lim, H. Application of multitemporal ERS-2 synthetic aperture radar in delineating rice cropping systems in the Mekong River Delta, Vietnam. IEEE Trans. Geosci. Remote Sens. 1998, 36, 1412–1420. [Google Scholar] [CrossRef]
- Vietnamese Government National Strategy on Climate Change. Hanoi, Vietnam. 2011. Available online: http://www.chinhphu.vn/portal/page/portal/English/strategies/strategiesdetails?categoryId=30&articleId=10051283 (accessed on 22 May 2019).
- Biggs, D.; Miller, F.; Hoanh, C.T.; Molle, F. The delta machine: Water management in the Vietnamese Mekong Delta in historical and contemporary perspectives. In Contested Waterscapes in the Mekong Region: Hydropower, Livelihoods and Governance; Routledge: Abingdon, UK, 2009; pp. 203–225. [Google Scholar]
- Fabrice, G.R.; Claudia, K. The Mekong Delta System; Springer: Dordrecht, The Netherlands, 2012; ISBN 2194-3214. [Google Scholar]
- Kono, Y. Canal development and intensification of rice cultivation in the Mekong Delta: A case study in Cantho Province, Vietnam. Southeast Asian Studie 2001, 39, 70–85. [Google Scholar]
- Le Meur, P.-Y.; Hauswirth, D.; Leurent, T.; Lienhard, T. The Local Politics of Land and Water: Case Studies from the Mekong Delta; Groupe de Recherche et d’ Echanges Technologiques: Paris, France, 2005. [Google Scholar]
- Miller, F. Environmental Risk in Water Resources Management in the Mekong Delta: A Multiscale Analysis; I.B. Tauris: London, UK, 2006; Volume 1, ISBN 978-1-85043-445-0. [Google Scholar]
- Duc Tran, D.; van Halsema, G.; Hellegers, P.J.G.J.; Phi Hoang, L.; Quang Tran, T.; Kummu, M.; Ludwig, F. Assessing impacts of dike construction on the flood dynamics of the Mekong Delta. Hydrol. Earth Syst. Sci. 2018, 22, 1875–1896. [Google Scholar] [CrossRef]
- Center of Environmental Monitoring. Environmental Monitoring Report; Department of Natural Resources and Environment (DONRE): An Giang, Vietnam, 2016.
- Bambaradeniya, C.N.B.; Amarasinghe, F.P. Biodiversity Associated with the Rice Field Agroecosystem in Asian Countries: A Brief Review; International Water Management Institute: Battaramulla, Sri Lanka, 2003; p. 24. [Google Scholar]
- Berg, H.; Tam, N.T. Use of pesticides and attitude to pest management strategies among rice and rice-fish farmers intheMekong Delta, Vietnam. Int. J. Pest Manag. 2012, 58, 153–164. [Google Scholar] [CrossRef]
- Garschagen, M.; Diez, J.R.; Nhan, D.K.; Kraas, F. Socio-Economic Development in the Mekong Delta: Between the Prospects for Progress and the Realms of Reality. In The Mekong Delta System: Interdisciplinary Analyses of a River Delta; Renaud, F.G., Kuenzer, C., Eds.; Springer Netherlands: Dordrecht, The Netherlands, 2012; pp. 83–132. ISBN 978-94-007-3962-8. [Google Scholar]
- Pham, C.H. Planning and Implementation of the Dyke Systems in the Mekong Delta, Vietnam. Ph.D. Thesis, Bonn University, Bonn, Germany, 2011. [Google Scholar]
- Sakamoto, T.; Phung, V.C.; Nhan, V.N.; Kotera, A.; Yokozawa, M. Agro-ecological interpretation of rice cropping systems in flood-prone areas using MODIS imagery. Photogramm. Eng. Remote Sens. 2009, 75, 413–424. [Google Scholar] [CrossRef]
- Avtar, R.; Kumar, P.; Singh, C.K.; Sahu, N.; Verma, R.L.; Thakur, J.K.; Mukherjee, S. Hydrogeochemical Assessment of Groundwater Quality of Bundelkhand, India Using Statistical Approach. Water Qual. Expo. Health 2013, 5, 105–115. [Google Scholar] [CrossRef]
- Islam, M.A.; Rahman, M.M.; Bodrud-Doza, M.; Muhib, M.I.; Shammi, M.; Zahid, A.; Akter, Y.; Kurasaki, M. A study of groundwater irrigation water quality in south-central Bangladesh: A geo-statistical model approach using GIS and multivariate statistics. Acta Geochim. 2018, 37, 193–214. [Google Scholar] [CrossRef]
- Hung, P.; Rahman, M.M.; Nguyen, C.N.; Phu, L.V.; Trung, L.V.; Ngo, H.H. Assessment of Surface Water Quality Using the Water Quality Index and Multivariate Statistical Techniques—A Case Study: The Upper Part of Dong Nai River Basin, Vietnam. J. Water Sustain. 2017, 7, 225–245. [Google Scholar]
- Tuan, L.; Minh, H.V.; Tuan, D.D.A.; Thao, N.T.P. Baseline Study for Community Based Water Management Project; Mekong Water Governance Program Vietnam: Hanoi, Vietnam, 2015. [Google Scholar]
- Can Tho University (CTU); DANIDA. Flood Forecasting and Damage Reduction Study in the Mekong Delta; Can Tho University Vietnam: Cantho, Vietnam, 1996. [Google Scholar]
- Minh, H.V.T.; Avtar, R.; Mohan, G.; Misra, P.; Kurasaki, M. Monitoring and Mapping of Rice Cropping Pattern in Flooding Area in the Vietnamese Mekong Delta Using Sentinel-1A Data: A Case of An Giang Province. ISPRS Int. J. Geo-Inf. 2019, 8, 211. [Google Scholar] [CrossRef]
- Department of Agriculture and Natural Development (DARD). Annual Report 2003; Department of Agriculture and Natural Development (DARD): An Giang, Vietnam, 2003.
- Kontgis, C.; Schneider, A.; Ozdogan, M. Mapping rice paddy extent and intensification in the Vietnamese Mekong River Delta with dense time stacks of Landsat data. Remote Sens. Environ. 2015, 169, 255–269. [Google Scholar] [CrossRef]
- Sakamoto, T.; Van Nguyen, N.; Ohno, H.; Ishitsuka, N.; Yokozawa, M. Spatio–temporal distribution of rice phenology and cropping systems in the Mekong Delta with special reference to the seasonal water flow of the Mekong and Bassac rivers. Remote Sens. Environ. 2006, 100, 1–16. [Google Scholar] [CrossRef]
- Helena, B.; Pardo, R.; Vega, M.; Barrado, E.; Fernandez, J.M.; Fernandez, L. Temporal evolution of groundwater composition in an alluvial aquifer (Pisuerga River, Spain) by principal component analysis. Water Res. 2000, 34, 807–816. [Google Scholar] [CrossRef]
- Kido, M.; Yustiawati; Syawal, M.S.; Sulastri; Hosokawa, T.; Tanaka, S.; Saito, T.; Iwakuma, T.; Kurasaki, M. Comparison of general water quality of rivers in Indonesia and Japan. Environ. Monit. Assess. 2008, 156, 317. [Google Scholar] [CrossRef]
- Shammi, M.; Rahman, M.M.; Islam, M.A.; Bodrud-Doza, M.; Zahid, A.; Akter, Y.; Quaiyum, S.; Kurasaki, M. Spatio-temporal assessment and trend analysis of surface water salinity in the coastal region of Bangladesh. Environ. Sci. Pollut. Res. 2017, 24, 14273–14290. [Google Scholar] [CrossRef] [PubMed]
- Ogbozige, F.J.; Adie, D.B.; Abubakar, U.A. Water quality assessment and mapping using inverse distance weighted interpolation: A case of River Kaduna, Nigeria. Niger. J. Technol. 2018, 37, 249–261. [Google Scholar] [CrossRef]
- Ke, W.; Cheng, H.P.; Yan, D.; Lin, C. The Application of Cluster Analysis and Inverse Distance-Weighted Interpolation to Appraising the Water Quality of Three Forks Lake. Procedia Environ. Sci. 2011, 10, 2511–2517. [Google Scholar] [CrossRef][Green Version]
- Mirzaei, R.; Sakizadeh, M. Comparison of interpolation methods for the estimation of groundwater contamination in Andimeshk-Shush Plain, Southwest of Iran. Environ. Sci. Pollut. Res. 2016, 23, 2758–2769. [Google Scholar] [CrossRef]
- Alberto, W.D.; María del Pilar, D.; María Valeria, A.; Fabiana, P.S.; Cecilia, H.A.; María de los Ángeles, B. Pattern Recognition Techniques for the Evaluation of Spatial and Temporal Variations in Water Quality. A Case Study: Suquía River Basin (Córdoba–Argentina). Water Res. 2001, 35, 2881–2894. [Google Scholar] [CrossRef]
- Johnson, R.A.; Wichern, D.W. Applied Multivariate Statistical Analysis, 3rd ed.; Prentice-Hall: Englewood Cliffs, NJ, USA, 1992; ISBN 0-13-041807-2. [Google Scholar]
- Singh, K.P.; Malik, A.; Mohan, D.; Sinha, S. Multivariate statistical techniques for the evaluation of spatial and temporal variations in water quality of Gomti River (India)—A case study. Water Res. 2004, 38, 3980–3992. [Google Scholar] [CrossRef] [PubMed]
- Singh, K.P.; Malik, A.; Sinha, S. Water quality assessment and apportionment of pollution sources of Gomti river (India) using multivariate statistical techniques—A case study. Anal. Chim. Acta 2005, 538, 355–374. [Google Scholar] [CrossRef]
- Shrestha, S.; Kazama, F. Assessment of surface water quality using multivariate statistical techniques: A case study of the Fuji river basin, Japan. Environ. Model. Softw. 2007, 22, 464–475. [Google Scholar] [CrossRef]
- Duan, W.; He, B.; Nover, D.; Yang, G.; Chen, W.; Meng, H.; Zou, S.; Liu, C. Water Quality Assessment and Pollution Source Identification of the Eastern Poyang Lake Basin Using Multivariate Statistical Methods. Sustainability 2016, 8, 133. [Google Scholar] [CrossRef]
- Poulsen, J.; French, A. Discriminant Function Analysis; San Francisco State University: San Francisco, CA, USA, 2008. [Google Scholar]
- Chen, G.N. Assessment of environmental water with fuzzy cluster analysis and fuzzy recognition. Anal. Chim. Acta 1993, 271, 115–124. [Google Scholar] [CrossRef]
- Graça, M.A.S.; Coimbra, C.N. The elaboration of indices to assess biological water quality. A case study. Water Res. 1998, 32, 380–392. [Google Scholar] [CrossRef]
- Vega, M.; Pardo, R.; Barrado, E.; Debán, L. Assessment of seasonal and polluting effects on the quality of river water by exploratory data analysis. Water Res. 1998, 32, 3581–3592. [Google Scholar] [CrossRef]
- Adams, M.J. The Principles of Multivariate Data Analysis. In Analytical Methods of Food Authentication; Blackie Academic & Professional: London, UK, 1998. [Google Scholar]
- McKenna, J.E. An enhanced cluster analysis program with bootstrap significance testing for ecological community analysis. Environ. Model. Softw. 2003, 18, 205–220. [Google Scholar] [CrossRef]
- Simeonov, V.; Stratis, J.A.; Samara, C.; Zachariadis, G.; Voutsa, D.; Anthemidis, A.; Sofoniou, M.; Kouimtzis, T. Assessment of the surface water quality in Northern Greece. Water Res. 2003, 37, 4119–4124. [Google Scholar] [CrossRef]
- Sridhar Kuma, A.; Shnakaraiah, K.; Raoc, P.L.K.M.; Sathyanarayana, M. Assessment of water quality in hussainsagar lake and its inlet channels using multivariate statistical techniques. Int. J. Sci. Eng. Res. 2014, 5, 327–333. [Google Scholar]
- Massart, D.L.; Kaufman, L. The Interpretation of Analytical Chemical Data by the Use of Cluster Analysis; John Wiley & Sons: New York, NY, USA, 1983. [Google Scholar]
- Willett, P. Similarity and Clustering in Chemical Information Systems; Research Studies Press: New York, NY, USA, 1987; ISBN 0-86380-050-5. [Google Scholar]
- Bengraïne, K.; Marhaba, T.F. Using principal component analysis to monitor spatial and temporal changes in water quality. J. Hazard. Mater. 2003, 100, 179–195. [Google Scholar] [CrossRef]
- Ouyang, Y. Evaluation of river water quality monitoring stations by principal component analysis. Water Res. 2005, 39, 2621–2635. [Google Scholar] [CrossRef]
- Pop, H.F. Principal components analysis based on a fuzzy sets approach. Studia Univ. Babes Bolyai Inform. 2001, XLVI, 45–52. [Google Scholar]
- Sârbu, C.; Pop, H.F. Principal component analysis versus fuzzy principal component analysis: A case study: the quality of danube water (1985–1996). Talanta 2005, 65, 1215–1220. [Google Scholar] [CrossRef]
- Shine, J.P.; Ika, R.V.; Ford, T.E. Multivariate statistical examination of spatial and temporal patterns of heavy metal contamination in New Bedford Harbor marine sediments. Environ. Sci. Technol. 1995, 29, 1781–1788. [Google Scholar] [CrossRef]
- Tauler, R.; Barcelo, D.; Thurman, E.M. Multivariate Correlation between Concentrations of Selected Herbicides and Derivatives in Outflows from Selected U.S. Midwestern Reservoirs. Environ. Sci. Technol. 2000, 34, 3307–3314. [Google Scholar] [CrossRef][Green Version]
- Voutsa, D.; Manoli, E.; Samara, C.; Sofoniou, M.; Stratis, I. A Study of Surface Water Quality in Macedonia, Greece: Speciation of Nitrogen and Phosphorus. Water Air Soil Pollut. 2001, 129, 13–32. [Google Scholar] [CrossRef]
- Yu, C.-C.; Quinn, J.T.; Dufournaud, C.M.; Harrington, J.J.; Rogers, P.P.; Lohani, B.N. Effective dimensionality of environmental indicators: A principal component analysis with bootstrap confidence intervals. J. Environ. Manag. 1998, 53, 101–119. [Google Scholar] [CrossRef]
- Chea, R.; Grenouillet, G.; Lek, S. Evidence of Water Quality Degradation in Lower Mekong Basin Revealed by Self-Organizing Map. PLoS ONE 2016, 11, e0145527. [Google Scholar] [CrossRef]
- Mekong River Commission (MRC). Diagnostic Study of Water Quality in the Lower Mekong Basin; MRC Technical Paper No. 15; Mekong River Commission: Vientiane, Laos, 2007; p. 57. [Google Scholar]
- Campbell, I. Review of the MRC Water Quality Indices; Mekong River Commission: Vientiane, Laos, 2014. [Google Scholar]
- Yuan, L.; He, W.; Liao, Z.; Degefu, M.D.; An, M.; Zhang, Z.; Wu, X. Allocating Water in the Mekong River Basin during the Dry Season. Water 2019, 11, 400. [Google Scholar] [CrossRef]
- Sikder, M.; Tanaka, S.; Saito, T.; Hosokawa, T.; Gumiri, S.; Ardianor, A.; Uddin, M.; Tareq, S.; Shammi, M.; Kamal, A.; et al. Vulnerability assessment of surface water quality with an innovative integrated multi-parameter water quality index (IMWQI). Pollution 2015, 1, 333–346. [Google Scholar]
- Singh, C.K.; Shashtri, S.; Mukherjee, S.; Kumari, R.; Avatar, R.; Singh, A.; Singh, R.P. Application of GWQI to Assess Effect of Land Use Change on Groundwater Quality in Lower Shiwaliks of Punjab: Remote Sensing and GIS Based Approach. Water Resour. Manag. 2011, 25, 1881–1898. [Google Scholar] [CrossRef]
- Water Research Center. Available online: https://www.water-research.net/ (accessed on 30 April 2019).
- Hamza’s Reef. Available online: https://www.hamzasreef.com/ (accessed on 30 April 2019).
- Ministry of Natural Resources and Environment (MONRE). National Technical Regulation on Surface Water Quality; Ministry of Natural Resources and Environment (MONRE): Hanoi, Vietnam, 2015.
- Nguyen, H.T.L.; Nguyen, T.G. Surface water quality in canals in An Giang province, Viet Nam, from 2009 to 2016. J. Viet. Environ. 2018, 10, 113–119. [Google Scholar]
- Cattell, R.B.; Jaspers, J. A general plasmode (No. 30-15-5-2) for factor analytic excercises and research. Mult. Behave Res. Monogr. 1967, 67, 1–212. [Google Scholar]
- Kim, J.O.; Mueller, C.W. Factor Analysis: Statistical Methods and Practical Issues; SAGE Publications: Los Angeles, CA, USA, 1978. [Google Scholar]
- Wilbers, G.-J.; Sebesvari, Z.; Renaud, G.F. Piped-Water Supplies in Rural Areas of the Mekong Delta, Vietnam: Water Quality and Household Perceptions. Water 2014, 6, 2175–2194. [Google Scholar] [CrossRef]
- Al-Mukhtar, M.; Al-Yaseen, F. Modeling Water Quality Parameters Using Data-Driven Models, a Case Study Abu-Ziriq Marsh in South of Iraq. Hydrology 2019, 6, 24. [Google Scholar] [CrossRef]
- Firat, M.; Güngör, M. Monthly total sediment forecasting using adaptive neuro fuzzy inference system. Stoch. Environ. Res. Risk Assess. 2010, 24, 259–270. [Google Scholar] [CrossRef]
- Evtimova, V.V.; Donohue, I. Water-level fluctuations regulate the structure and functioning of natural lakes. Freshw. Biol. 2016, 61, 251–264. [Google Scholar] [CrossRef]
- Wu, Z.; Zhang, D.; Cai, Y.; Wang, X.; Zhang, L.; Chen, Y. Water quality assessment based on the water quality index method in Lake Poyang: The largest freshwater lake in China. Sci. Rep. 2017, 7, 17999. [Google Scholar] [CrossRef] [PubMed]
- Wright, J.; Worrall, F. The effects of river flow on water quality in estuarine impoundments. Phys. Chem. Earth Part B Hydrol. Oceans Atmos. 2001, 26, 741–746. [Google Scholar] [CrossRef]
- Ty, T.V. Scenario-based Impact Assessment of Land Use/Cover and Climate Changes on Water Resources and Demand: A Case Study in the Srepok River Basin, Vietnam—Cambodia. Water Resour. Manag. 2012, 26, 1387–1407. [Google Scholar] [CrossRef]
- Dise, N.B.; Ashmore, M.; Belyazid, S.; Bleeker, A.; Bobbink, R.; de Vries, W.; Erisman, J.W.; Spranger, T.; Stevens, C.; van den Berg, L. Nitrogen as a threat to European terrestrial biodiversity; Cambridge University Press: Cambridge, UK, 2011; pp. 463–494. [Google Scholar]


| No. | Parameters | Threshold Values |
|---|---|---|
| 1 | pH | 6–9 |
| 2 | EC (Scm−1) | <150 |
| 3 | NH3+(mgL−1) | 0.1 |
| 4 | NO2,3_N (mg L−1) | 5 |
| 5 | T_P (mg L−1) | 0.13 |
| 6 | DO (mg L−1) | >5 |
| Variables | DO | pH | EC | Turb | COD | NH4+ | NO2− | NO3− | PO43− | TC |
|---|---|---|---|---|---|---|---|---|---|---|
| DO | 1 | |||||||||
| pH | −0.001 | 1 | ||||||||
| EC | −0.108 | −0.664 * | 1 | |||||||
| Turb | −0.276 | −0.463 * | 0.657 * | 1 | ||||||
| COD | 0.076 | −0.068 | 0.310 | 0.394 | 1 | |||||
| NH4+ | −0.234 | −0.275 | 0.572 * | 0.495 * | 0.224 | 1 | ||||
| NO2− | 0.227 | 0.273 | 0.133 | 0.082 | 0.108 | 0.208 | 1 | |||
| NO3− | 0.139 | 0.505 * | −0.106 | −0.115 | 0.101 | 0.095 | 0.795 * | 1 | ||
| PO43− | −0.082 | −0.454 * | 0.504 * | 0.662 * | 0.396 | 0.298 | 0.054 | −0.030 | 1 | |
| TC | −0.004 | 0.112 | 0.177 | 0.013 | 0.123 | 0.101 | 0.109 | −0.012 | −0.225 | 1 |
| Variables | DO | pH | EC | Turb | COD | NH4+ | NO2− | NO3− | PO43− | TC |
|---|---|---|---|---|---|---|---|---|---|---|
| DO | 1 | |||||||||
| pH | 0.059 | 1 | ||||||||
| EC | −0.016 | −0.532 * | 1 | |||||||
| Turb | −0.193 | 0.261 | −0.174 | 1 | ||||||
| COD | 0.055 | −0.387 | 0.486 * | −0.098 | 1 | |||||
| NH4+ | −0.132 | −0.229 | 0.508 * | −0.176 | 0.380 | 1 | ||||
| NO2− | −0.145 | −0.139 | 0.223 | 0.168 | 0.237 | 0.371 | 1 | |||
| NO3− | −0.100 | −0.336 | 0.149 | 0.001 | 0.202 | 0.016 | 0.506 * | 1 | ||
| PO43− | 0.039 | −0.162 | 0.484 * | 0.021 | 0.284 | 0.382 | −0.013 | −0.244 | 1 | |
| TC | −0.122 | −0.117 | 0.045 | −0.473 | 0.073 | 0.111 | 0.262 | 0.182 | 0.011 | 1 |
| Variable | Standard Mode | Backward Stepwise | Forward Stepwise |
|---|---|---|---|
| DO | 0.808 *** | 0.808 *** | 0.808 *** |
| pH | 0.992 | ||
| EC | 0.812 *** | 0.812 *** | 0.812 *** |
| Turb | 0.790 *** | 0.790 *** | 0.790 *** |
| COD | 0.755 *** | 0.755 *** | 0.755 *** |
| NH4+ | 0.896 ** | 0.896 ** | 0.896 ** |
| NO2− | 1.000 | ||
| NO3− | 0.874 ** | 0.874 ** | 0.874 ** |
| PO43− | 0.975 | ||
| TC | 0.961 | ||
| Percent correct | 95.54% | 92.68% | 92.68% |
| Clusters | Cluster 1 | Cluster 2 | Cluster 3a | Cluster 3b |
|---|---|---|---|---|
| Dry season | 3.7 | 4.2 | 5.4 | 4.8 |
| Wet season | 4.7 | 6.2 | 7.1 | 6.4 |
© 2019 by the authors. Licensee MDPI, Basel, Switzerland. This article is an open access article distributed under the terms and conditions of the Creative Commons Attribution (CC BY) license (http://creativecommons.org/licenses/by/4.0/).
Share and Cite
Minh, H.V.T.; Kurasaki, M.; Ty, T.V.; Tran, D.Q.; Le, K.N.; Avtar, R.; Rahman, M.M.; Osaki, M. Effects of Multi-Dike Protection Systems on Surface Water Quality in the Vietnamese Mekong Delta. Water 2019, 11, 1010. https://doi.org/10.3390/w11051010
Minh HVT, Kurasaki M, Ty TV, Tran DQ, Le KN, Avtar R, Rahman MM, Osaki M. Effects of Multi-Dike Protection Systems on Surface Water Quality in the Vietnamese Mekong Delta. Water. 2019; 11(5):1010. https://doi.org/10.3390/w11051010
Chicago/Turabian StyleMinh, Huynh Vuong Thu, Masaaki Kurasaki, Tran Van Ty, Dat Quoc Tran, Kieu Ngoc Le, Ram Avtar, Md. Mostafizur Rahman, and Mitsuru Osaki. 2019. "Effects of Multi-Dike Protection Systems on Surface Water Quality in the Vietnamese Mekong Delta" Water 11, no. 5: 1010. https://doi.org/10.3390/w11051010
APA StyleMinh, H. V. T., Kurasaki, M., Ty, T. V., Tran, D. Q., Le, K. N., Avtar, R., Rahman, M. M., & Osaki, M. (2019). Effects of Multi-Dike Protection Systems on Surface Water Quality in the Vietnamese Mekong Delta. Water, 11(5), 1010. https://doi.org/10.3390/w11051010