A Conceptual Time-Varying Flood Resilience Index for Urban Areas: Munich City


Abstract
:1. Introduction
2. Study Area and Data
3. Methods
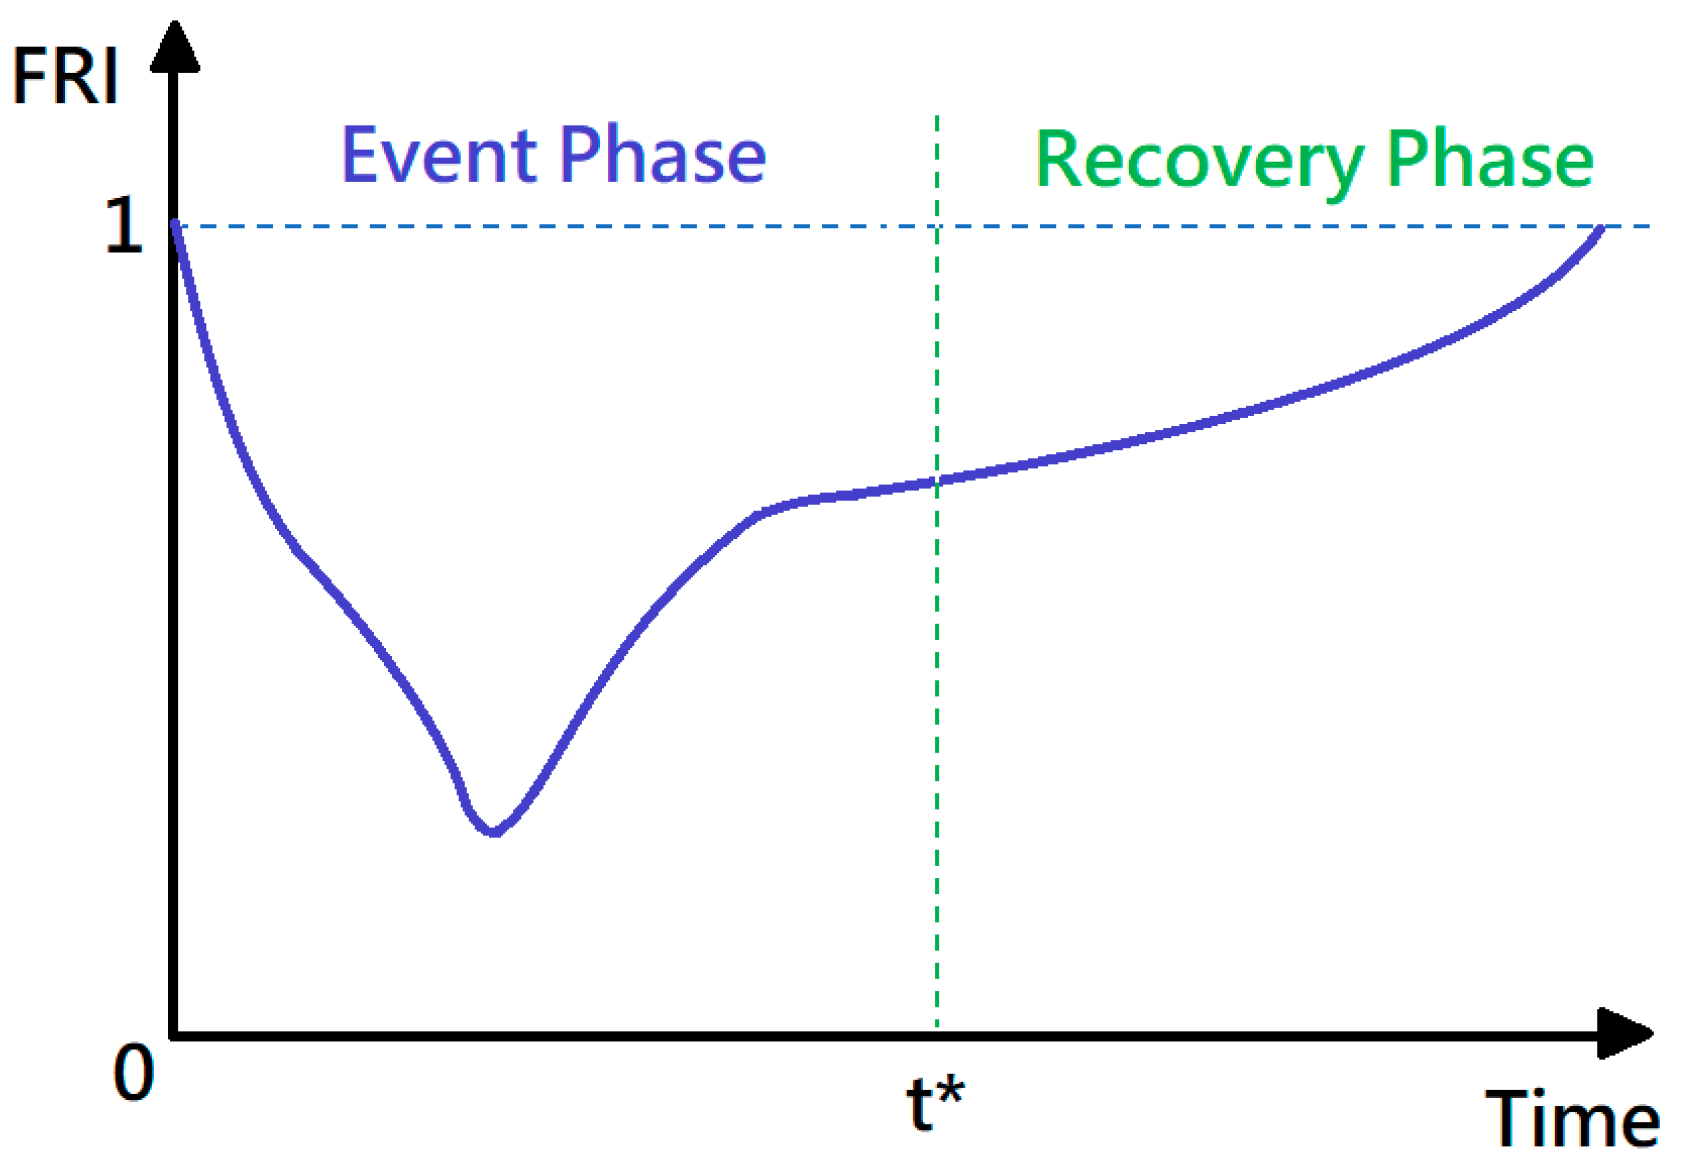
3.1. Time-Varying Flood Resilience Index: FRI
3.1.1. Structure of the Flood Resilience Index
3.1.2. Event Phase Indicators
3.1.3. Recovery Phase Indicators
3.1.4. Time Series of the Flood Resilience Index
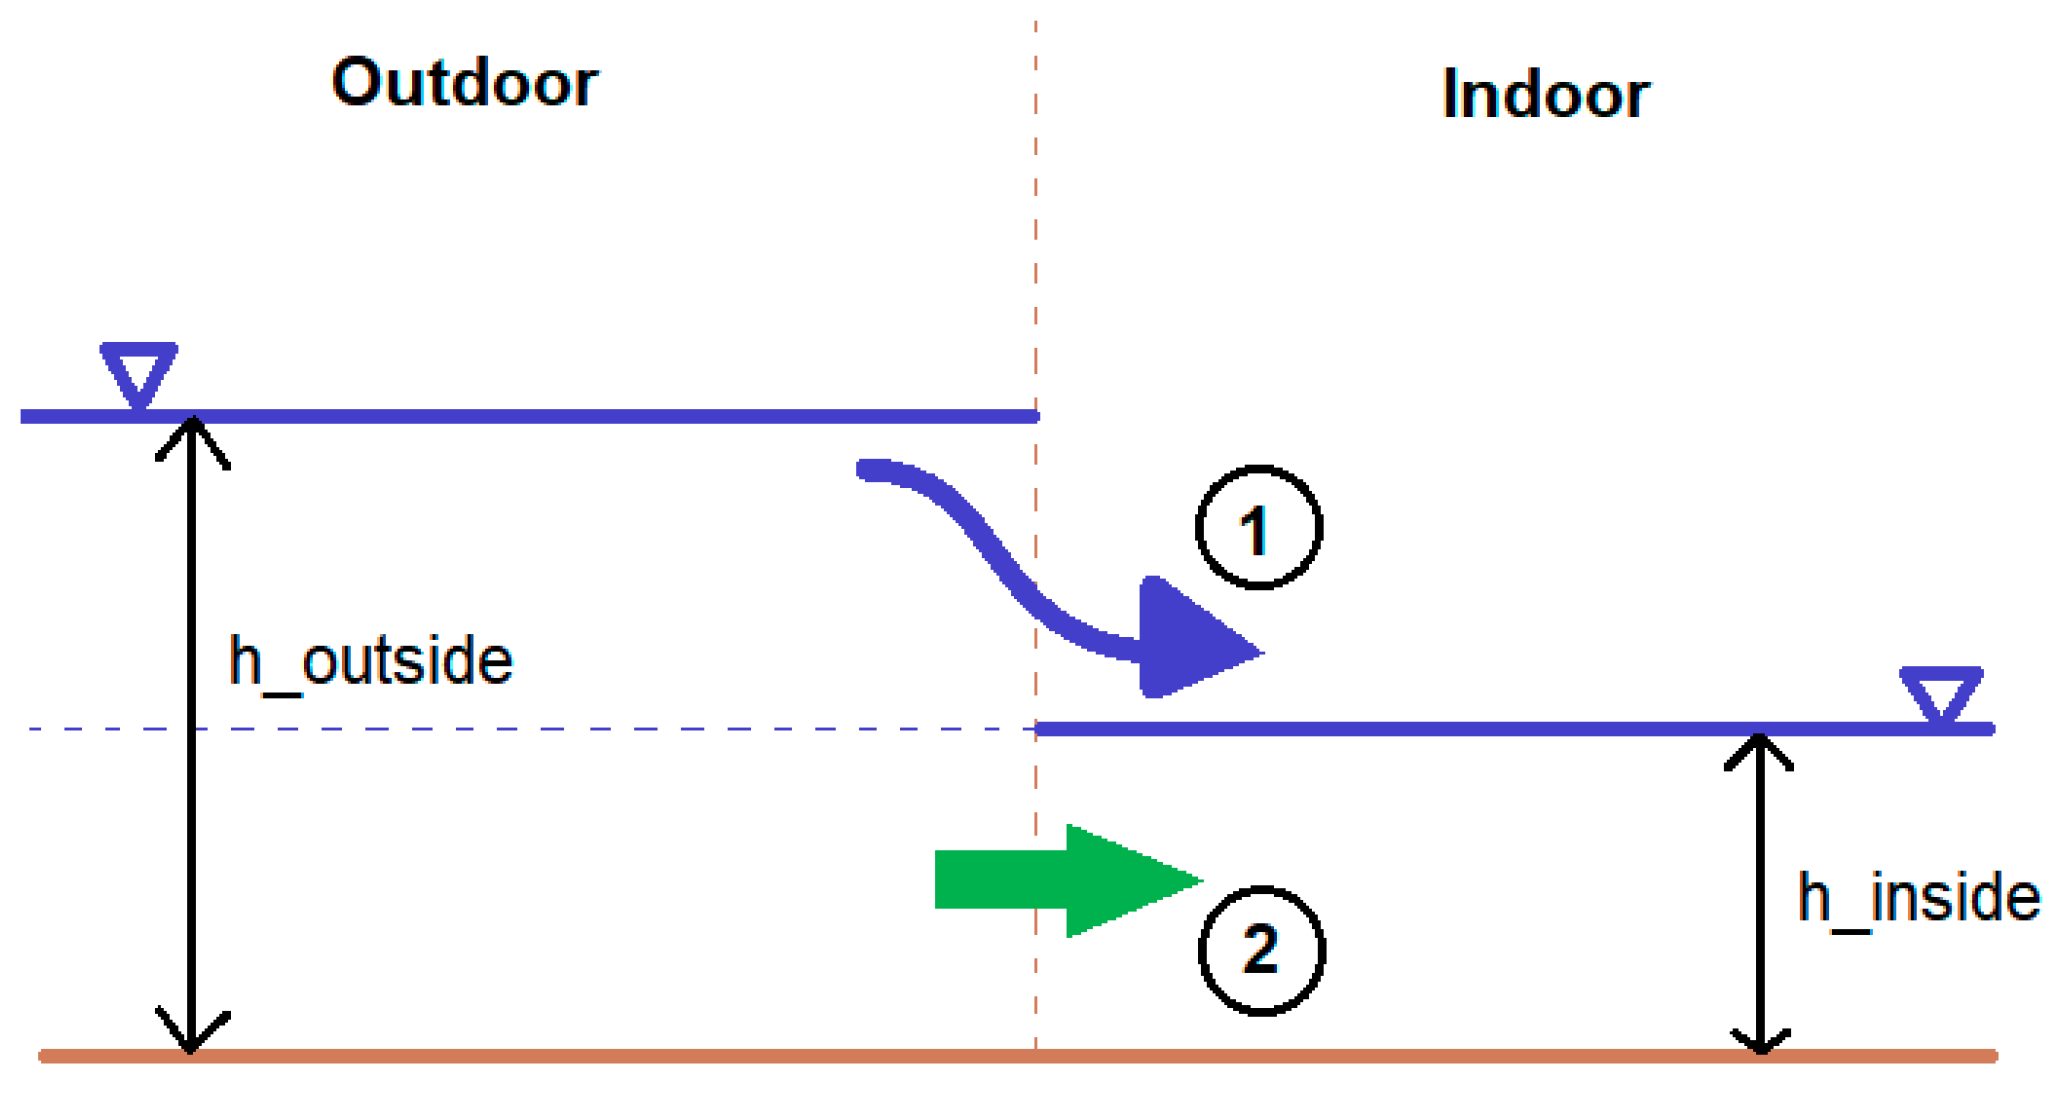
3.2. Indoor Water Depth Modelling
3.3. Parallel Diffusive Wave Model: P-DWave
4. Results
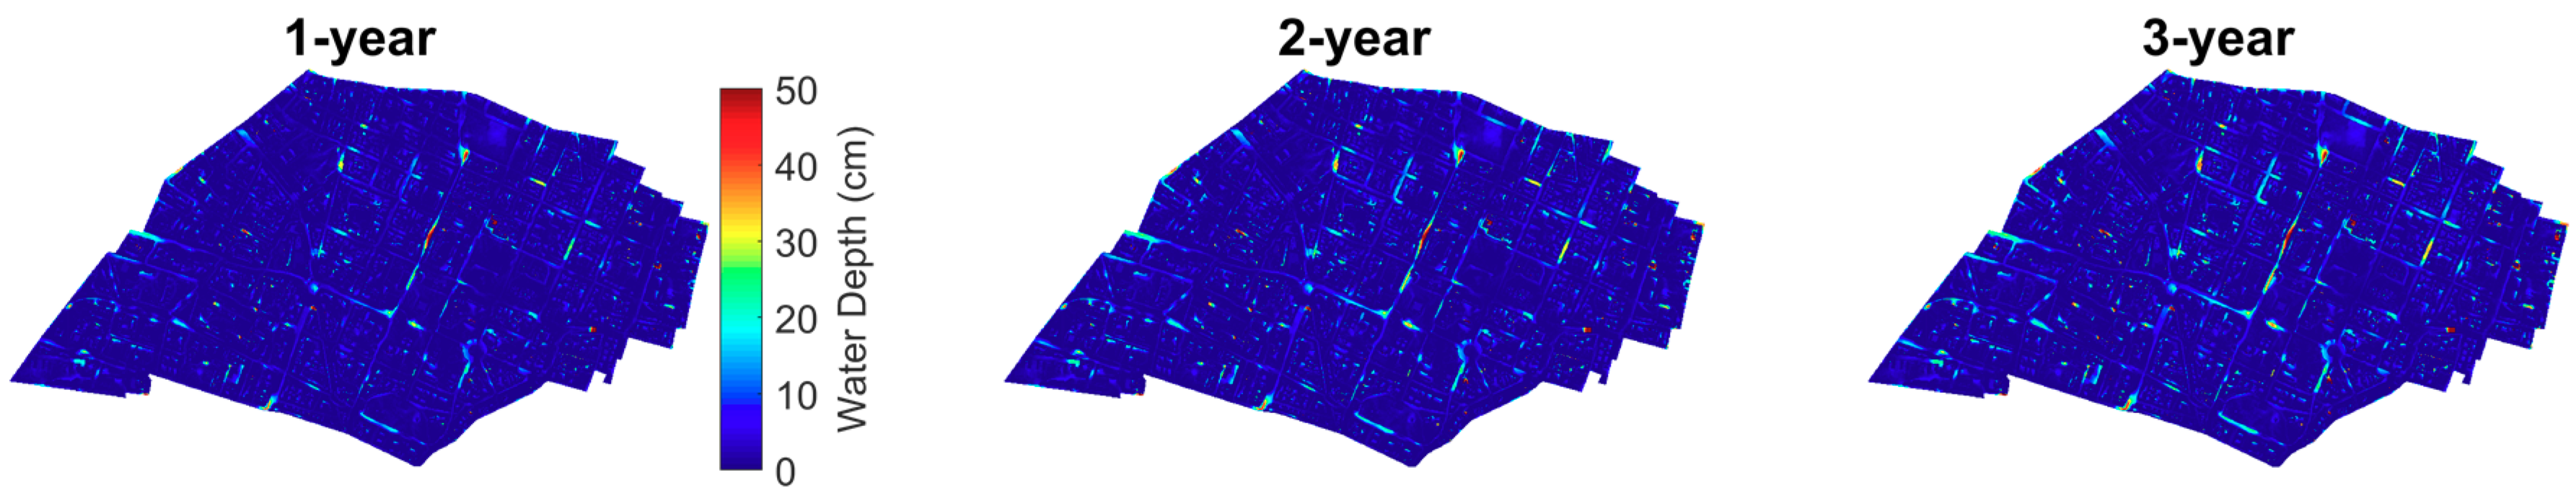
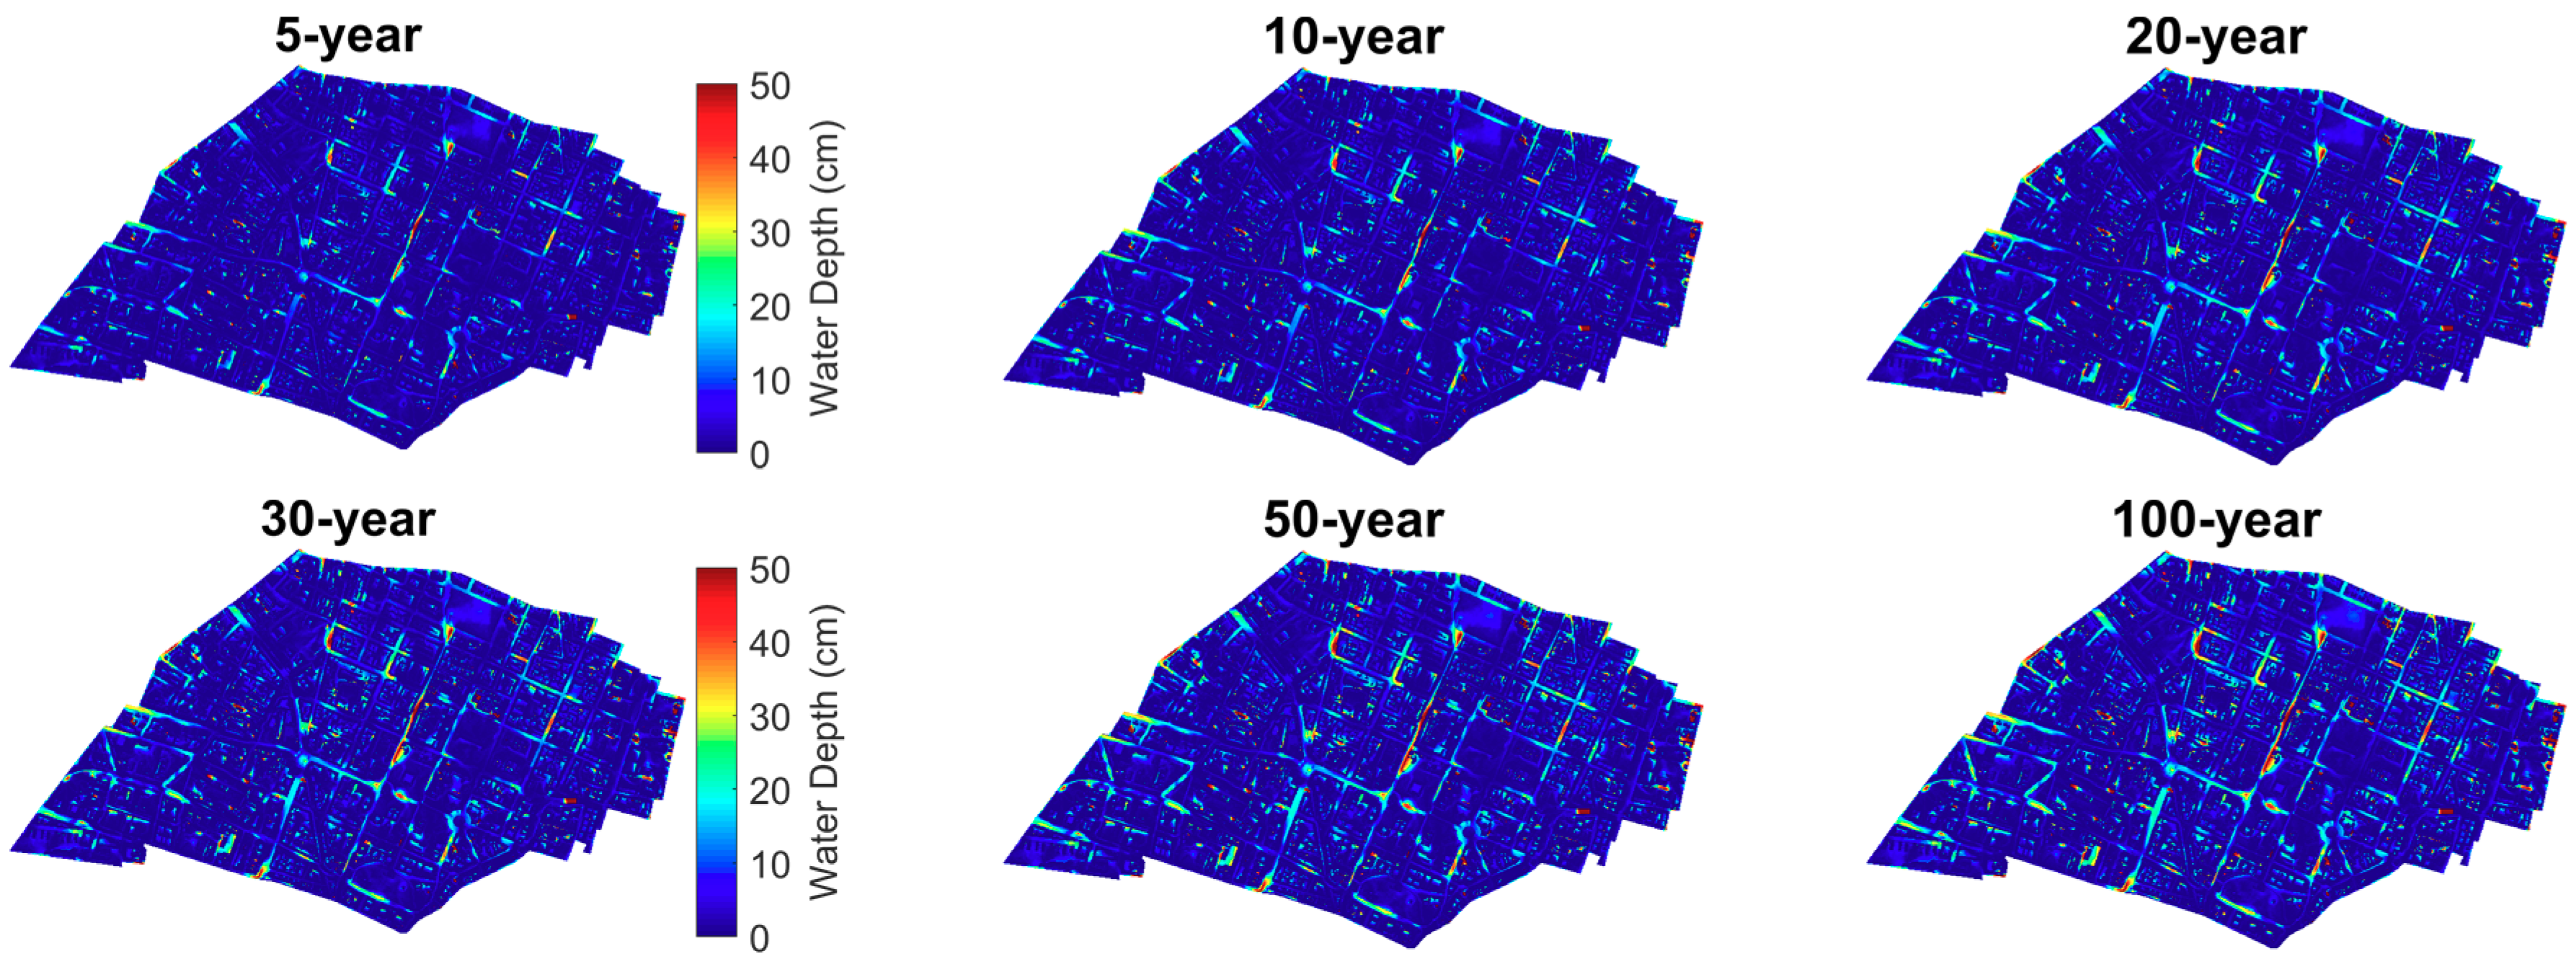
4.1. Flood Inundation Modelling
4.2. Parameter Sensitivity Analysis
4.3. Flood Resilience Index
5. Discussion
5.1. Flood Inundation Modelling
5.2. Parameter Sensitivity Analysis
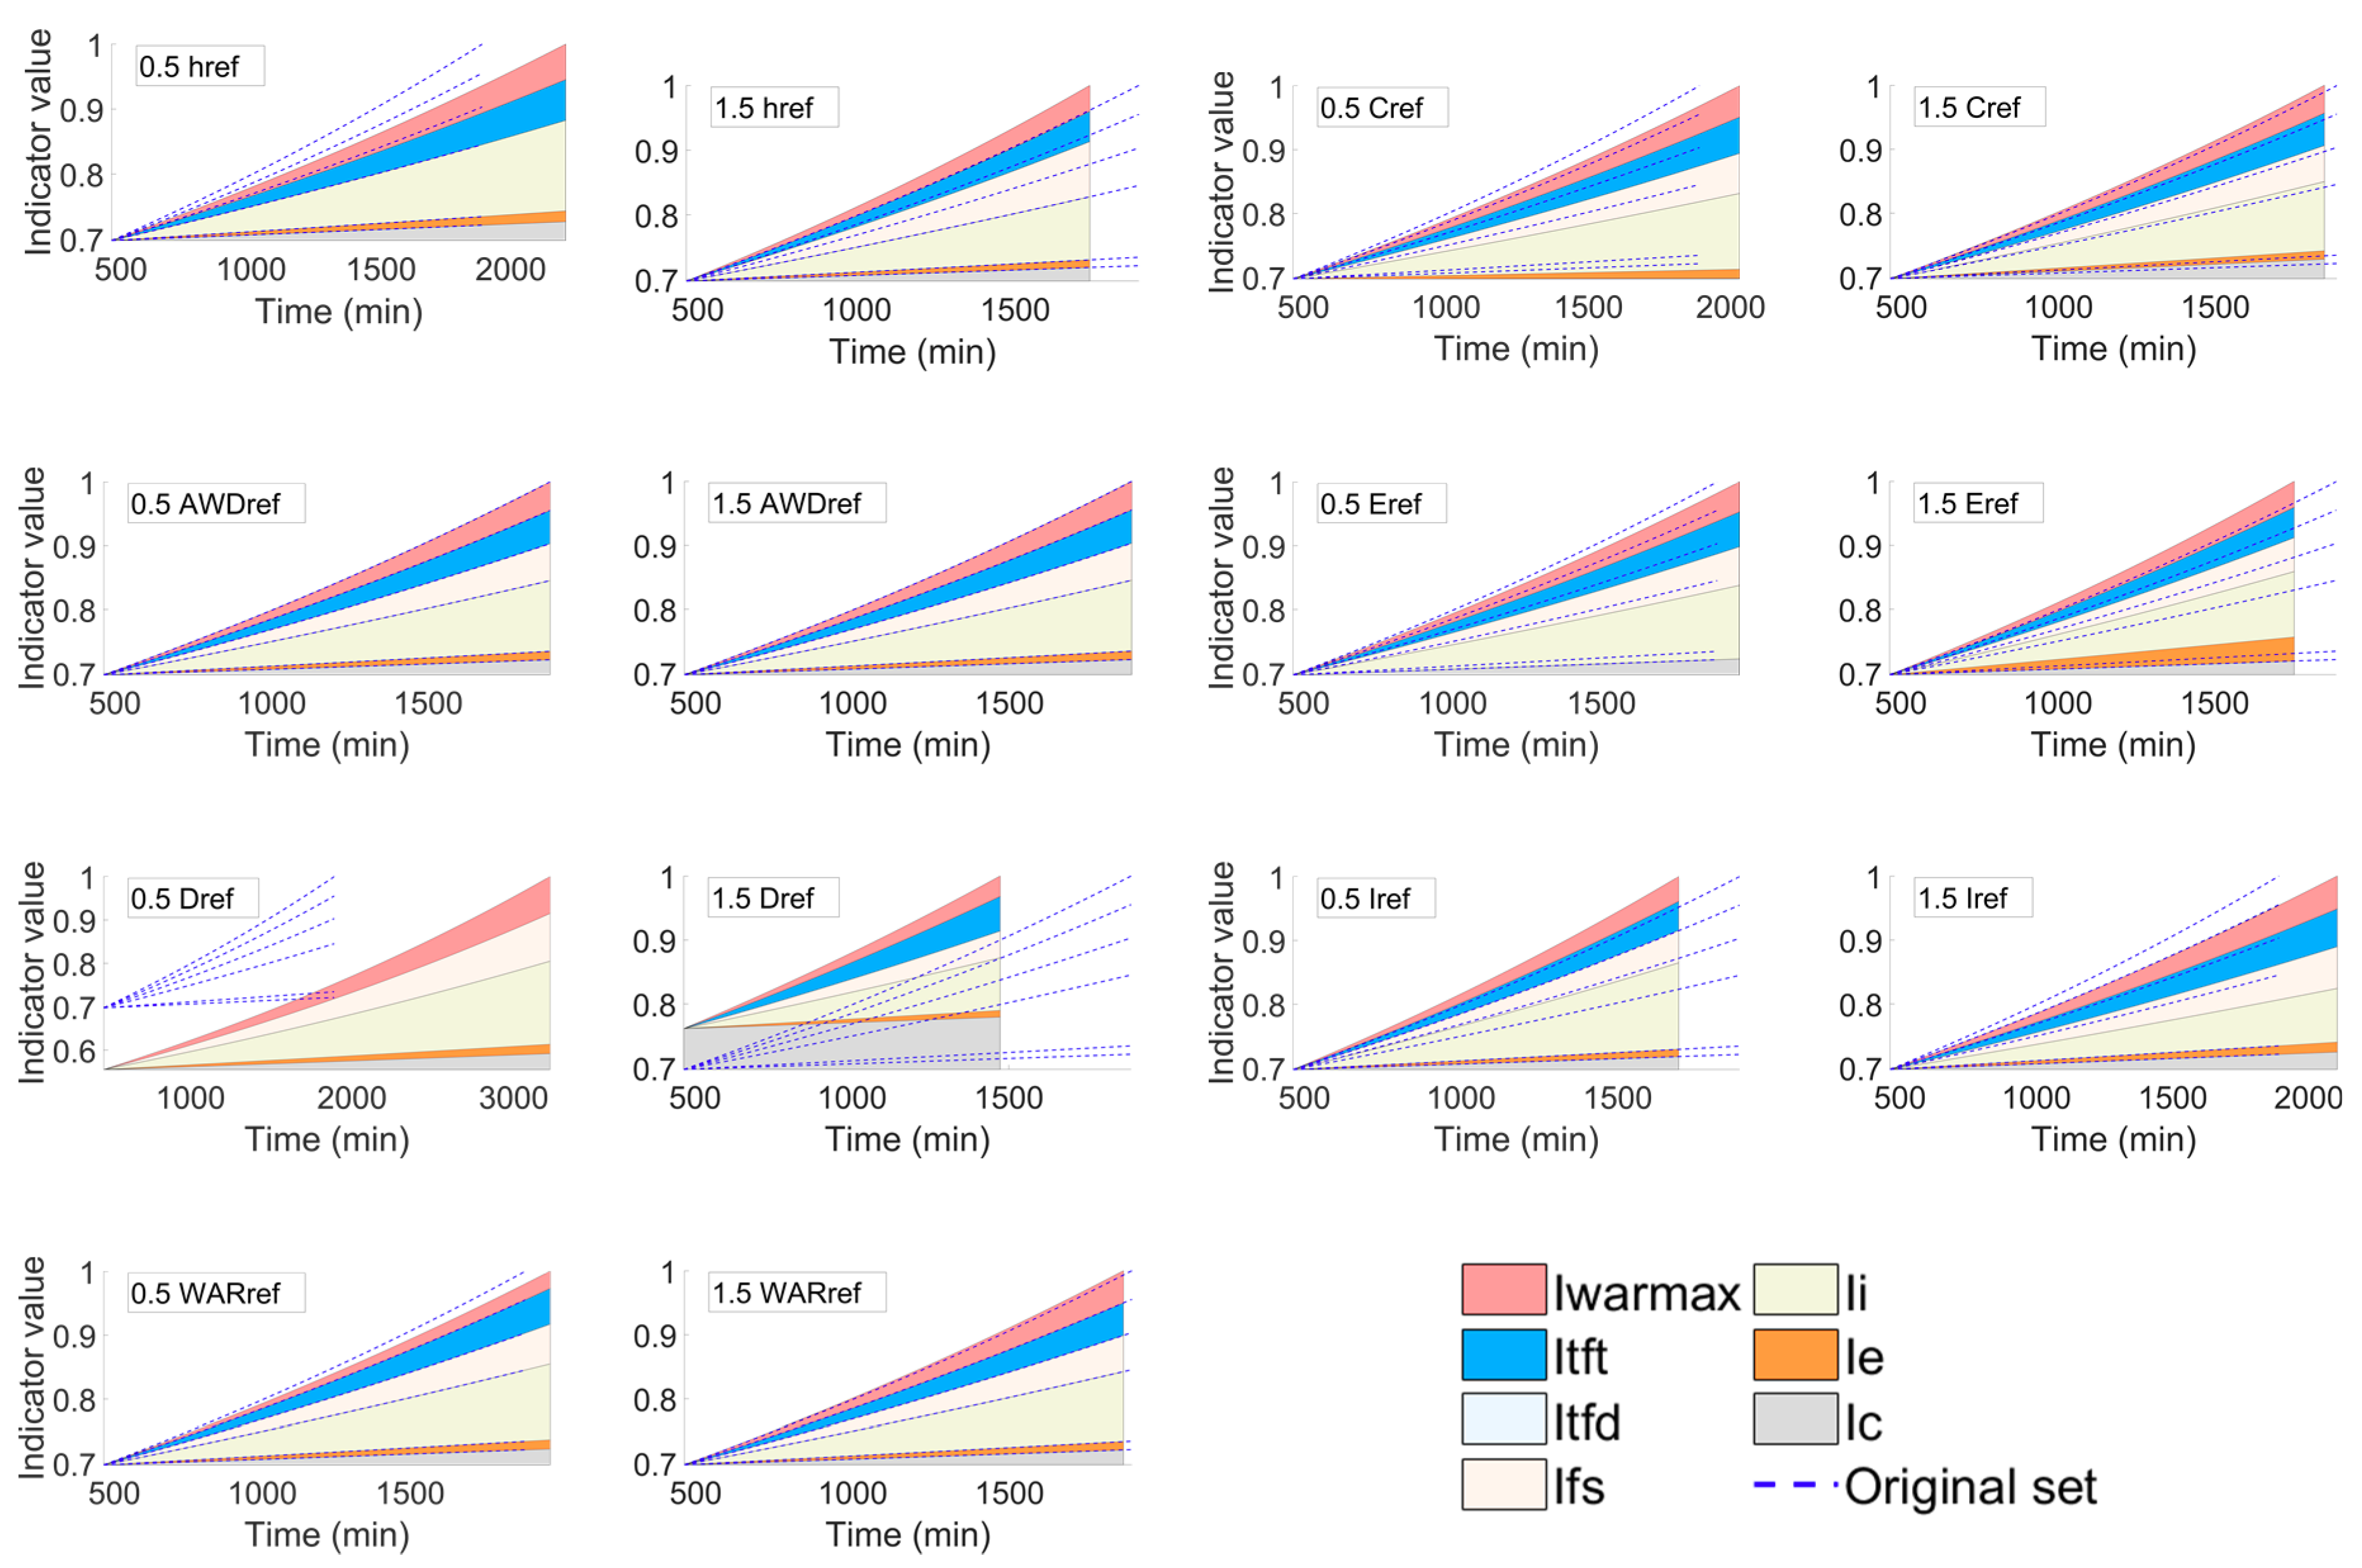
- Flood severity indicator—when its reference parameter decreases, the maximum water depth in the event phase becomes greater than its reference parameter, and thus the indicator is no longer contributive to the recovery factor and does not appear in the sensitivity analysis graph in the recovery phase. In this case, the system requires a longer recovery time (approximately 300 min longer) with the smaller recovery factor. On the contrary, when the reference parameter of flood severity increases, the indicator contribution to the recovery factor increases and the recovery of system is faster (200 min).
- Total flooding depth indicator—there is no difference between increasing and decreasing the reference parameter of total flooding depth as the indicator does not appear in both graphs. The reason is that the altered reference parameter remains in any case below the total water depth during the event phase, and thus the indicator has no contribution to the recovery factor.
- Total flooding time indicator—changes in the reference parameter of total flooding time show different starting points for the FRI curve at the beginning of the recovery phase. This is due to different endpoints in the event phase, as mentioned in the previous section. In this case, there will be a higher starting point in the recovery phase according to an increased reference parameter of total flooding time, and vice versa. When the reference parameter decreases, the total flooding time in the event phase exceeds the threshold, and thus the indicator is not contributive to the recovery factor and does not appear in the sensitivity analysis graph for the recovery phase. In contrast, when the reference parameter increases, not only the starting point of the recovery phase raises, but the system is able to bounce back to the original state of performance approximately 500 min faster.
- Maximum water accumulation rate indicator and households with children indicator—due to the low weighting factors assigned to both indicators, the differences between increasing or decreasing their reference parameters is relatively small. However, it can be seen that the degree of changing is larger when their reference parameters are decreased.
- Elderly population indicator—this indicator has a slightly higher impact than the two previous indicators. This is due to a larger weighting factor assigned for it. In addition, the effect of the indicator is larger when its reference parameter is increased.
- Income indicator—decreasing/increasing its reference parameter increases/decreases the indicator impact on the recovery factor. The reference parameter of income could be considered as the threshold that defines whether the income amount reaches the maximum recovery strength, at which the income indicator equals to e1. As a result, if the reference parameter decreases, the threshold decreases, and the household will either reach the maximum recovery strength or have a larger income indicator.
5.3. Flood Resilience Index
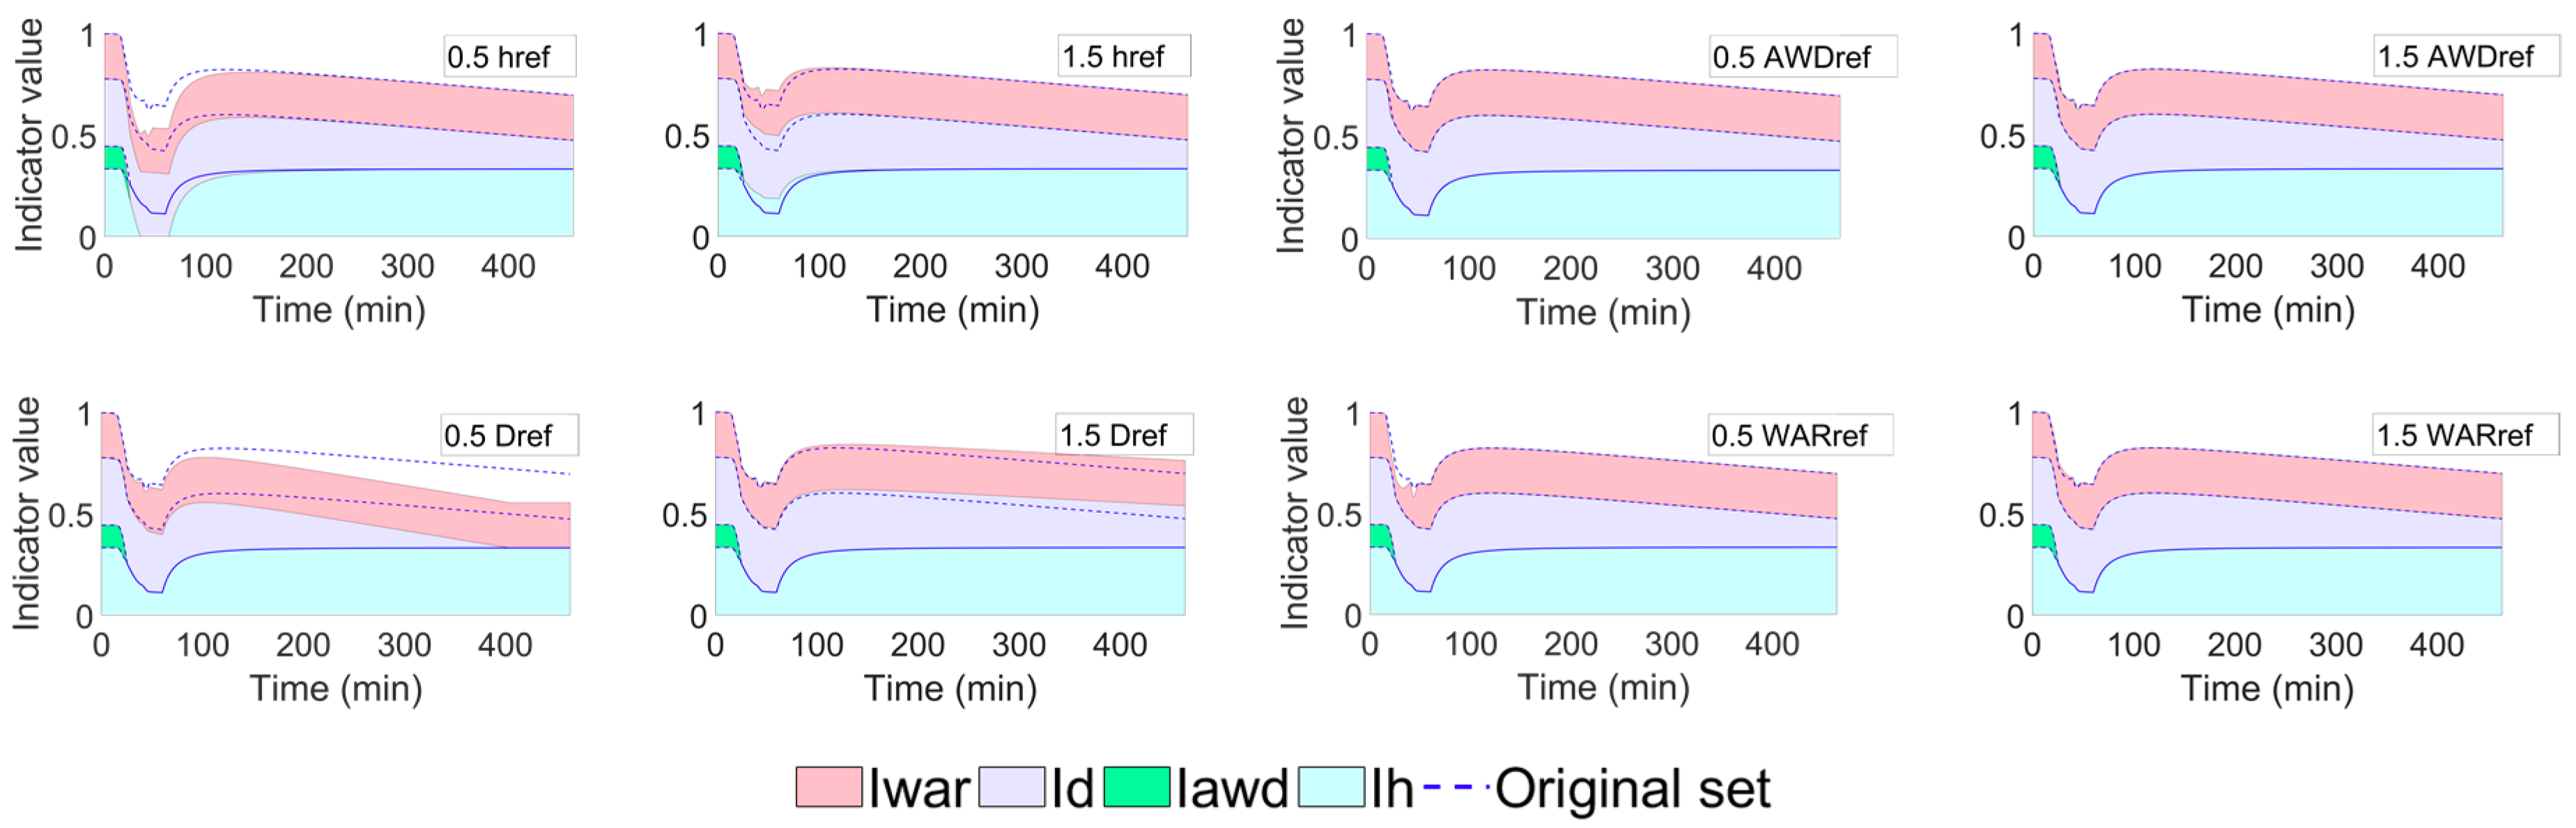
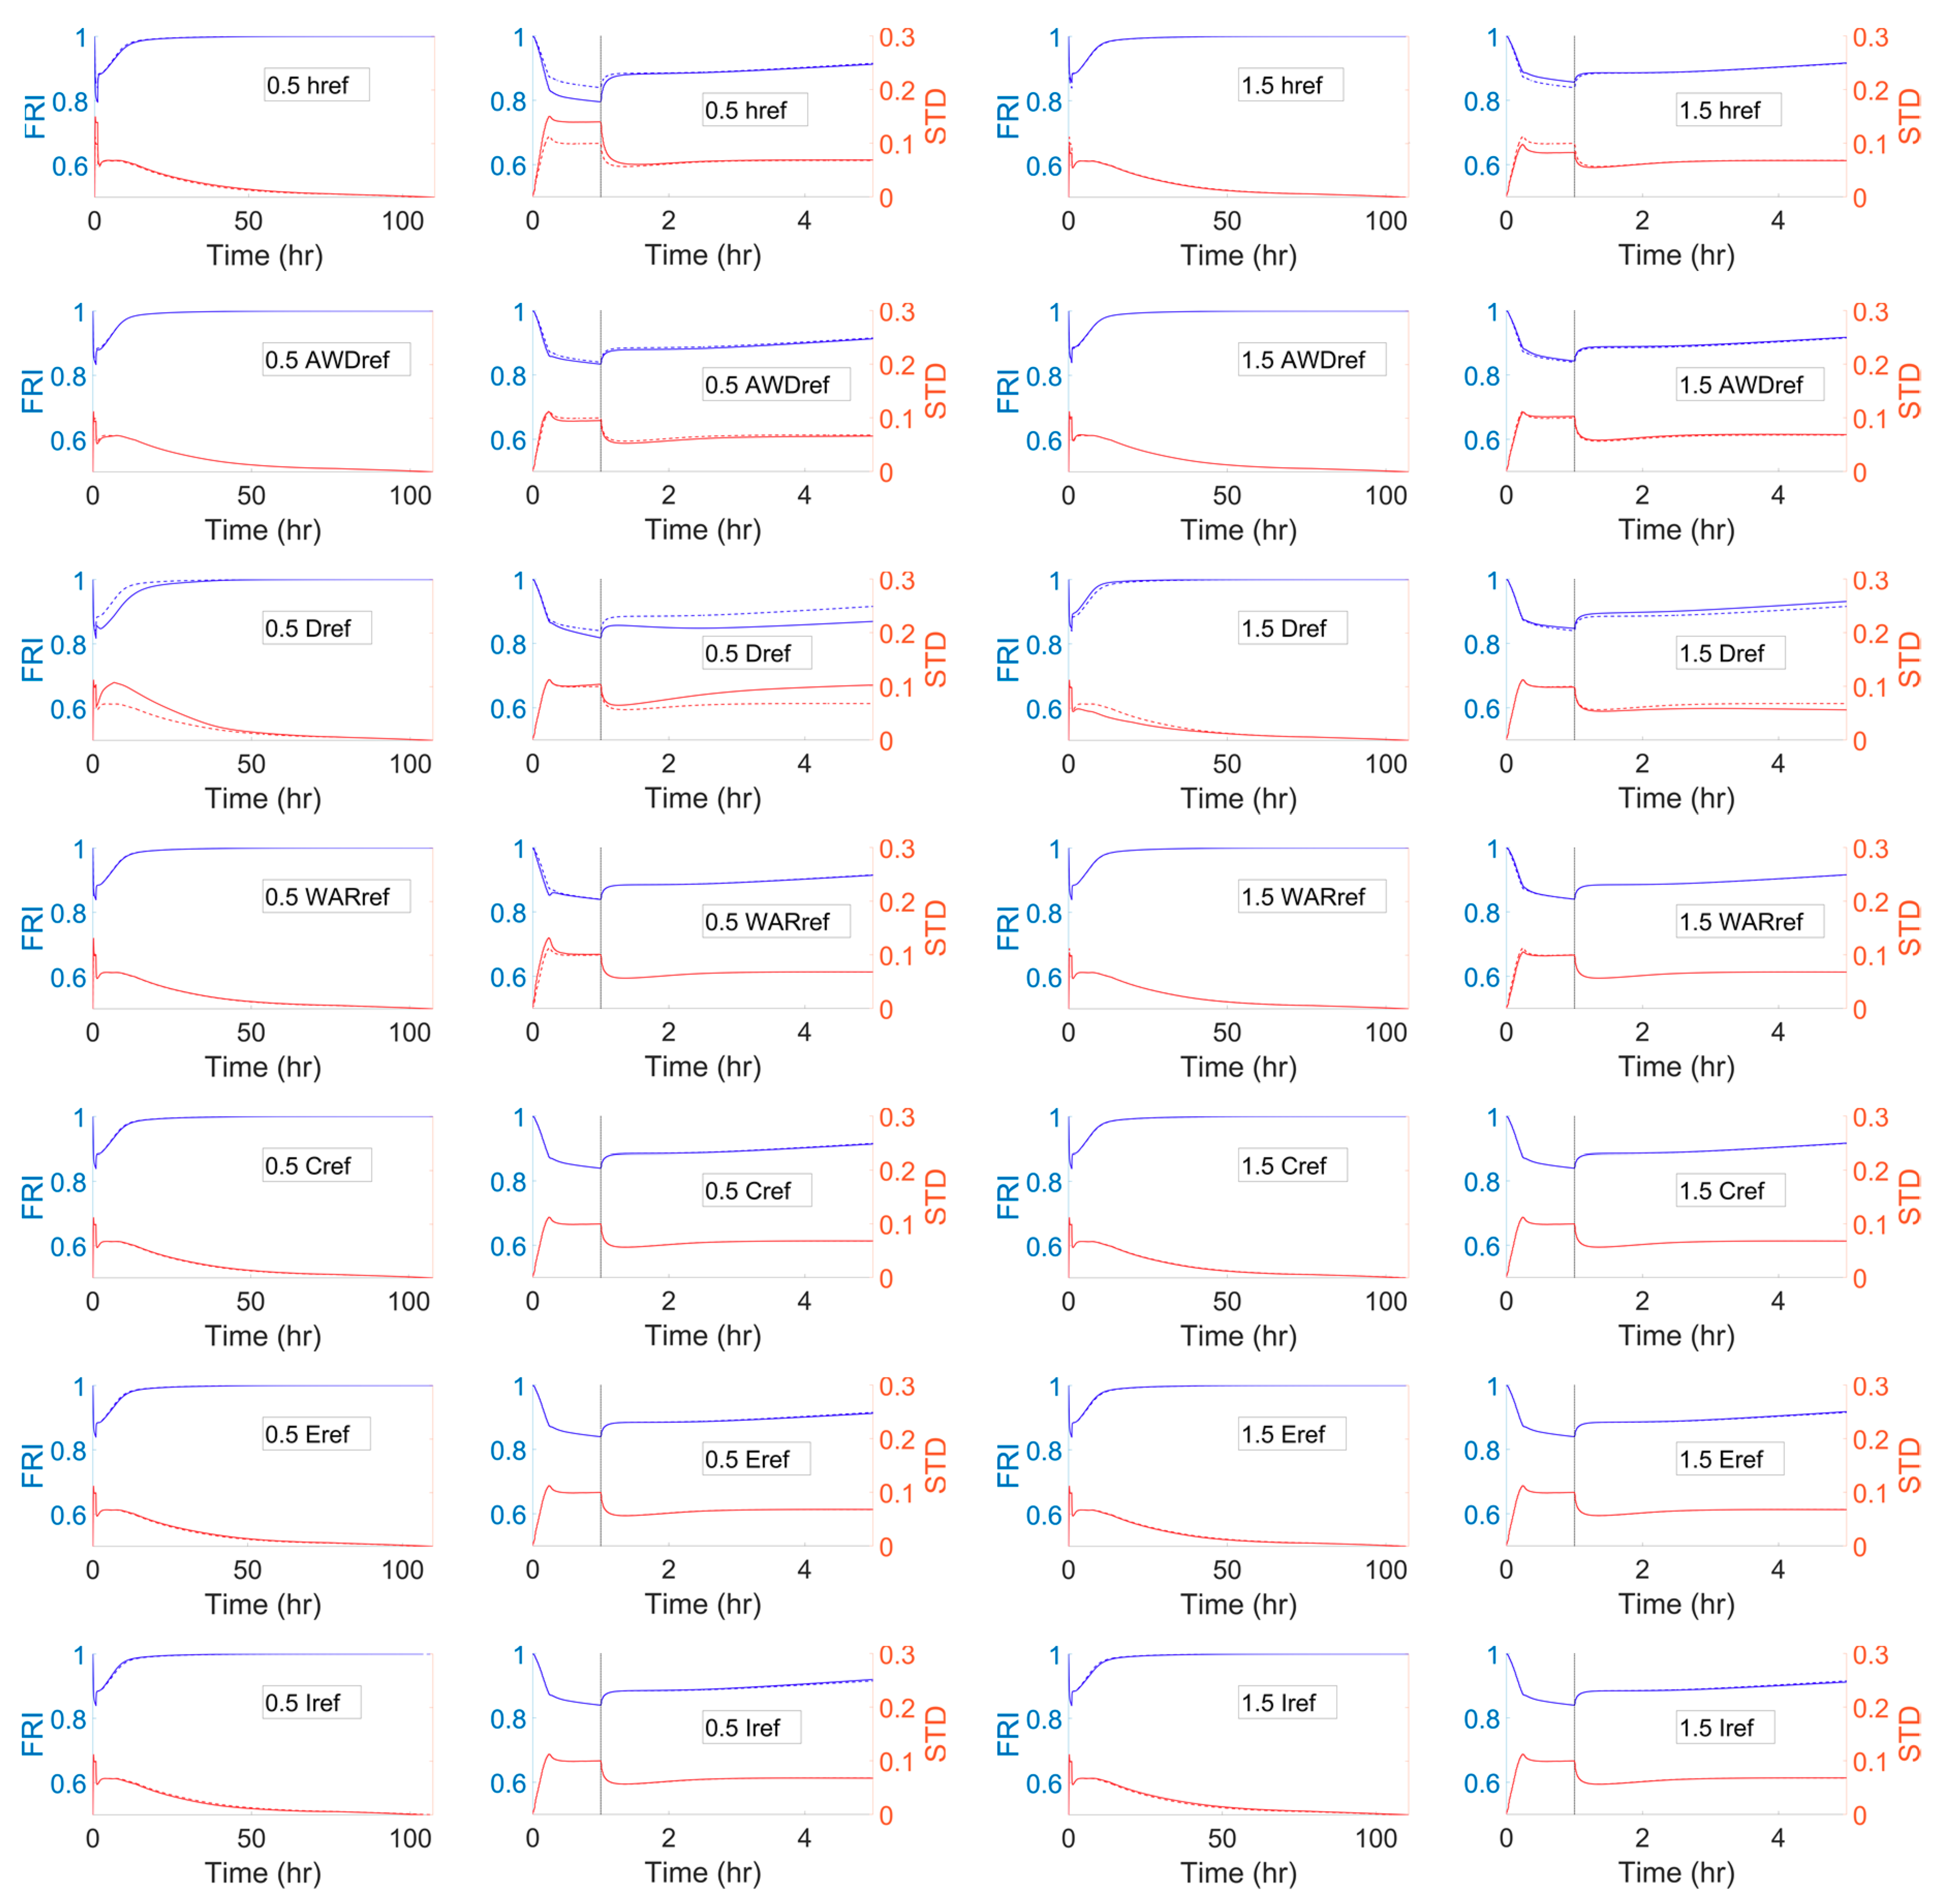
- Increasing/decreasing the reference parameter of water depth (event phase) and flood severity (recovery phase) increases/decreases the mean FRI curve along with a decreasing/increasing standard deviation curve.
- The altered reference parameter of accumulated water depth (event phase) and total flooding depth (recovery phase) slightly changes the mean FRI and standard deviation curve but only at the beginning of the simulation, at which the accumulated water depth does not exceed the reference parameter in the event phase.
- The altered reference parameter of flooding duration (event phase) and total flooding time (recovery phase) makes the most significant changes on the mean FRI and standard deviation curve among all considered reference parameters.
- The changes on the mean FRI and standard deviation curve due to the altered reference parameter of water accumulation rate (event phase) and maximum water accumulation rate (recovery phase) appear within the timestep at 1 h, which lies at the rising limb of all indoor hydrographs for every building. Aside from this, the effect of changing such a reference parameter is not significant.
- The altered reference parameters for the social and economic indicators can only affect the recovery phase, in which these indicators are taken into account. They are highly sensitive to the assigned weighting factors and the original set of reference parameters.
- Regarding the social and economic indicators, the altered reference parameter of income has the greatest impact on the mean FRI and standard deviation curve, while that of households with children has the least.
6. Conclusions
Author Contributions
Funding
Acknowledgments
Conflicts of Interest
References
- Barroca, B.; Bernardara, P.; Mouchel, J.M.; Hubert, G. Indicators for identification of urban flooding vulnerability. Nat. Hazards Earth Syst. Sci. 2006, 6, 553–561. [Google Scholar] [CrossRef]
- Campbell, J.; Douglas, I.; Mclean, L.; Mcdonnell, Y.; Alam, K.; Maghenda, M. Unjust waters: Climate change, flooding and the urban poor in Africa. Environ. Urban. 2008, 20, 187–205. [Google Scholar]
- Few, R. Flooding, vulnerability and coping strategies: Local responses to a global threat. Prog. Dev. Stud. 2003, 3, 43–58. [Google Scholar] [CrossRef]
- Adelekan, I.O. Vulnerability of poor urban coastal communities to flooding in Lagos, Nigeria. Environ. Urban. 2010, 22, 433–450. [Google Scholar] [CrossRef]
- Huong, H.; Pathirana, A. Urbanization and climate change impacts on future urban flooding in Can Tho city, Vietnam. Hydrol. Earth Syst. Sci. 2013, 17, 379–394. [Google Scholar] [CrossRef]
- Hallegatte, S. Strategies to adapt to an uncertain climate change. Glob. Environ. Chang. 2009, 19, 240–247. [Google Scholar] [CrossRef]
- Jones, H.P.; Hole, D.G.; Zavaleta, E.S. Harnessing nature to help people adapt to climate change. Nat. Clim. Chang. 2012, 2, 504–509. [Google Scholar] [CrossRef]
- Leandro, J. Title of Special Issue: Towards more Flood Resilient Cities. Urban Water J. 2015, 12, 1–2. [Google Scholar] [CrossRef]
- Robadue, D., Jr. Understanding resistance to resilience in coastal hazards and climate adaptation: Three approaches to visualizing structural and process obstacles, opportunities and adaptation responses. In Proceedings of the 52nd Hawaii International Conference on System Sciences, Maui, HI, USA, 8–11 January 2019. [Google Scholar]
- Messner, F.; Penning-Rowsell, E.; Green, C.; Meyer, V.; Tunstall, S.; van der Veen, A. Evaluating Flood Damages: Guidance and Recommendations on Principles and Methods; FLOODsite: Wallingford, UK, 2007. [Google Scholar]
- Schelfaut, K.; Pannemans, B.; van der Craats, I.; Krywkow, J.; Mysiak, J.; Cools, J. Bringing flood resilience into practice: The FREEMAN project. Environ. Sci. Policy 2011, 14, 825–833. [Google Scholar] [CrossRef]
- Jones, L. Resilience isn’t the same for all: Comparing subjective and objective approaches to resilience measurement. Wiley Interdiscip. Rev. Clim. Chang. 2019, 10, e552. [Google Scholar] [CrossRef]
- Allen, T.R.; Crawford, T.; Montz, B.; Whitehead, J.; Lovelace, S.; Hanks, A.D.; Christensen, A.R.; Kearney, G.D. Linking Water Infrastructure, Public Health, and Sea Level Rise: Integrated Assessment of Flood Resilience in Coastal Cities. Public Work. Manag. Policy 2019, 24, 110–139. [Google Scholar] [CrossRef]
- Moghadas, M.; Asadzadeh, A.; Vafeidis, A.; Fekete, A.; Kötter, T. A multi-criteria approach for assessing urban flood resilience in Tehran, Iran. Int. J. Disaster Risk Reduct. 2019, 35, 101069. [Google Scholar] [CrossRef]
- Zhang, Y.; Li, W.; Sun, G.; King, J.S. Coastal wetland resilience to climate variability: A hydrologic perspective. J. Hydrol. 2019, 568, 275–284. [Google Scholar] [CrossRef]
- Karamouz, M.; Taheri, M.; Khalili, P.; Chen, X. Building Infrastructure Resilience in Coastal Flood Risk Management. J. Water Resour. Plan. Manag. 2019, 145, 4019004. [Google Scholar] [CrossRef]
- Murdock, H.; de Bruijn, K.; Gersonius, B. Assessment of Critical Infrastructure Resilience to Flooding Using a Response Curve Approach. Sustainability 2018, 10, 3470. [Google Scholar] [CrossRef]
- Walsh, B.; Hallegatte, S. Measuring Natural Risks in the Philippines: Socioeconomic Resilience and Wellbeing Losses; World Bank Group: Washington, DC, USA, 2019. [Google Scholar]
- Driessen, P.; Hegger, D.; Kundzewicz, Z.; van Rijswick, H.; Crabbé, A.; Larrue, C.; Matczak, P.; Pettersson, M.; Priest, S.; Suykens, C.; et al. Governance Strategies for Improving Flood Resilience in the Face of Climate Change. Water 2018, 10, 1595. [Google Scholar] [CrossRef]
- Hammond, M.J.; Chen, A.S.; Djordjević, S.; Butler, D.; Mark, O. Urban flood impact assessment: A state-of-the-art review. Urban Water J. 2015, 12, 14–29. [Google Scholar] [CrossRef]
- Holling, C.S. Resilience and Stability of Ecological Systems. Annu. Rev. Ecol. Syst. 1973, 4, 1–23. [Google Scholar] [CrossRef]
- de Bruijn, K.M. Resilience and flood risk management. Water Policy 2004, 6, 53–66. [Google Scholar] [CrossRef]
- Tourbier, J. A Methodology to Define Flood Resilience. In Proceedings of the EGU General Assembly, Vienna, Austria, 22–27 April 2012. [Google Scholar]
- United Nations Office for Disaster Risk Reduction. Terminology on Disaster Risk Reduction. Available online: https://www.unisdr.org/we/inform/terminology#letter-r (accessed on 15 December 2018).
- Mugume, S.; Gomez, D.; Butler, D. Quantifying the resilience of urban drainage systems using a hydraulic performance assessment approach. In Proceedings of the 13th International Conference on Urban Drainage, Sarawak, Malaysia, 7–12 September 2014. [Google Scholar]
- Perfrement, T.; Lloyd, T. Identifying and Visaulising Resilience to Flooding via a Composite Flooding Disaster Resilience Index. In Proceedings of the 56th Floodplain Management Australia National Conference, Nowra, Australia, 17–20 May 2016. [Google Scholar]
- Keating, A.; Campbell, K.; Szoenyi, M.; McQuistan, C.; Nash, D.; Burer, M. Development and testing of a community flood resilience measurement tool. Nat. Hazards Earth Syst. Sci. 2017, 17, 77–101. [Google Scholar] [CrossRef]
- Bizzotto, M. Resilient Cities Report 2018. In Proceedings of the 9th Global Forum on Urban Resilience and Adaptation, Bonn, Germany, 26–28 April 2018. [Google Scholar]
- The Rockefeller Foundation and ARUP. City Resilience Index; ARUP: London, UK, 2014. [Google Scholar]
- Fischer, K.; Hiermaier, S.; Riedel, W.; Häring, I. Morphology Dependent Assessment of Resilience for Urban Areas. Sustainability 2018, 10, 1800. [Google Scholar] [CrossRef]
- Winderl, T. Disaster Resilience Measurements: Stocktaking of Ongoing Efforts in Developing Systems for Measuring Resilience; United Nations Development Programme: New York, NY, USA, 2014. [Google Scholar]
- de Bruijn, K.M. Resilience indicators for flood risk management systems of lowland rivers. Int. J. River Basin Manag. 2004, 2, 199–210. [Google Scholar] [CrossRef]
- Gourbesville, P.; Batica, J. Flood Resilience Index—Methodology and Application. In Proceedings of the 11th International Conference on Hydroinformatics, New York, NY, USA, 17–21 August 2014. [Google Scholar]
- Lee, E.H.; Kim, J.H. Development of Resilience Index Based on Flooding Damage in Urban Areas. Water 2017, 9, 428. [Google Scholar] [CrossRef]
- Bertilsson, L.; Wiklund, K.; de Moura Tebaldi, I.; Rezende, O.M.; Veról, A.P.; Miguez, M.G. Urban flood resilience—A multi-criteria index to integrate flood resilience into urban planning. J. Hydrol. 2018, in press. [Google Scholar] [CrossRef]
- Landeshauptstadt München. Statistisches Taschenbuch 2018—München und seine Stadtbezirke; Landeshauptstadt München: Munich, Germany, 2018.
- Landeshauptstadt Munchen. Munich Facts and Figures 2018; Landeshauptstadt Munchen: Munich, Germany, 2018.
- Junghänel, T.; Ertel, H.; Deutschländer, T. Bericht zur Revision der koordinierten Starkregenregionalisierung und -auswertung des Deutschen Wetterdienstes in der Version 2010; Deutscher Wetterdienst: Offenbach am Main, Germany, 2017.
- Young, G. From Chemical Exposure and Mold to Mosquitos, Problems Don’t Stop When the Rain Does. Available online: https://today.ttu.edu/posts/2015/06/flooding-long-term-impact-health-environment (accessed on 20 November 2018).
- Unterberger, C. How Flood Damages to Public Infrastructure Affect Municipal Budget Indicators. Econ. Disasters Clim. Chang. 2018, 2, 5–20. [Google Scholar] [CrossRef]
- Ten Brinke, W.; Knoop, J.; Muilwijk, H.; Ligtvoet, W. Social disruption by flooding, a European perspective. Int. J. Disaster Risk Reduct. 2017, 21, 312–322. [Google Scholar] [CrossRef]
- Milojevic, A.; Armstrong, B.; Wilkinson, P. Mental health impacts of flooding: A controlled interrupted time series analysis of prescribing data in England. J. Epidemiol. Community Heal. 2017, 71, 970–973. [Google Scholar] [CrossRef]
- Rufat, S.; Tate, E.; Burton, C.G.; Maroof, A.S. Social vulnerability to floods: Review of case studies and implications for measurement. Int. J. Disaster Risk Reduct. 2015, 14, 470–486. [Google Scholar] [CrossRef]
- Teo, M.; Goonetilleke, A.; Ziyath, A.M. An integrated framework for assessing community resilience in disaster management. In Proceedings of the 9th Annual International Conference of the International Institute for Infrastructure Renewal and Reconstruction, Risk-informed Disaster Management: Planning for Response, Recovery and Resilience, Brisbane, Australia, 7–10 July 2013. [Google Scholar]
- Saja, A.; Goonetilleke, A.; Teo, M.; Ziyath, A. A critical review of social resilience assessment frameworks in disaster management. Int. J. Disaster Risk Reduct. 2019, 35, 101096. [Google Scholar] [CrossRef]
- Leandro, J.; Chen, A.; Schumann, A. A 2D parallel diffusive wave model for floodplain inundation with variable time step (P-DWave). J. Hydrol. 2014, 517, 250–259. [Google Scholar] [CrossRef]


| District Name | N 2 | % of Total N | Area [ha] | % of Total Area | D 3 |
|---|---|---|---|---|---|
| Königsplatz | 417 | 7.48% | 62.43 | 16.83% | 6.68 |
| Augustenstraße | 1196 | 21.46% | 51.88 | 13.98% | 23.05 |
| St. Benno | 620 | 11.13% | 32.52 | 8.76% | 19.07 |
| Marsfeld | 630 | 11.30% | 75.96 | 20.47% | 8.29 |
| Josephsplatz | 787 | 14.12% | 31.30 | 8.44% | 25.14 |
| Am a- n- Friedhof 1 | 437 | 7.84% | 21.35 | 5.75% | 20.47 |
| Universität | 1195 | 21.44% | 64.84 | 17.48% | 18.43 |
| Schönfeldvorstadt | 168 | 3.01% | 13.91 | 3.75% | 12.08 |
| Maßmannbergl | 123 | 2.21% | 16.83 | 4.54% | 7.31 |
| Maxvorstadt | 5573 | 100% | 371.02 | 100% | 15.02 |
| Return Period (year) | 1 | 2 | 3 | 5 | 10 | 20 | 30 | 50 | 100 |
| Average Water Depth on Streets (cm) | 4.11 | 5.19 | 5.84 | 6.60 | 7.67 | 8.71 | 9.33 | 10.08 | 11.11 |
| Ref. 1 | Original Value | Multiplication Factor | FRI Duration 2 (h) | Lowest Mean FRI |
|---|---|---|---|---|
| href | 0.5 m | 0.5 | 110.4 | 0.79 |
| 1.5 | 106.2 | 0.85 | ||
| AWDref | 3 m | 0.5 | 107.2 | 0.83 |
| 1.5 | 107.2 | 0.84 | ||
| Dref | 800 min | 0.5 | 107.2 | 0.81 |
| 1.5 | 107.2 | 0.84 | ||
| WARref | 5 cm/min | 0.5 | 107.4 | 0.83 |
| 1.5 | 107.1 | 0.83 | ||
| Cref | 20 % | 0.5 | 107.7 | 0.83 |
| 1.5 | 105.9 | 0.83 | ||
| Eref | 12 % | 0.5 | 109.8 | 0.83 |
| 1.5 | 106.3 | 0.83 | ||
| Iref | 80,000 € | 0.5 | 103.8 | 0.83 |
| 1.5 | 110.6 | 0.83 | ||
| Original | - | 1 | 107.2 | 0.83 |
© 2019 by the authors. Licensee MDPI, Basel, Switzerland. This article is an open access article distributed under the terms and conditions of the Creative Commons Attribution (CC BY) license (http://creativecommons.org/licenses/by/4.0/).
Share and Cite
Chen, K.-F.; Leandro, J. A Conceptual Time-Varying Flood Resilience Index for Urban Areas: Munich City. Water 2019, 11, 830. https://doi.org/10.3390/w11040830
Chen K-F, Leandro J. A Conceptual Time-Varying Flood Resilience Index for Urban Areas: Munich City. Water. 2019; 11(4):830. https://doi.org/10.3390/w11040830
Chicago/Turabian StyleChen, Kai-Feng, and Jorge Leandro. 2019. "A Conceptual Time-Varying Flood Resilience Index for Urban Areas: Munich City" Water 11, no. 4: 830. https://doi.org/10.3390/w11040830
APA StyleChen, K.-F., & Leandro, J. (2019). A Conceptual Time-Varying Flood Resilience Index for Urban Areas: Munich City. Water, 11(4), 830. https://doi.org/10.3390/w11040830