1. Introduction
Since the 90s, computer simulation modelling has become increasingly important in the production of knowledge relied upon in the management of flood risks [
1,
2]. The simulation models, which are central to flood risk management, originate in hydrological and engineering sciences, where computer simulation have made it possible to explore complex natural systems [
3,
4]. In the management of flood risks, simulation models are used for various purposes, for example to build understanding about floods, to predict future floods or to explore the effect of adaptation or mitigation measures [
5]. Outputs of these simulations are usually communicated by using flood hazard maps that show the spatial pattern of floods including inundation depths or damages.
Several scholars have argued that the knowledge produced by model specialists (i.e., domain experts) is poorly used by decision-makers, policy analysts and other practitioners outside the domain of experts [
6,
7,
8]. It was found in these studies that the actual model outputs are often not usable in the decision-making context, despite the effort of competent authorities, local experts, practitioners, and model specialists in preparing and configuring advanced computer simulation models.
The interactions between domain experts and practitioners are often based on a one-way approach, with knowledge transfer largely originating from the domain experts, and involving the domain experts as the producers of knowledge and the practitioners as the users. This one-way approach may fail to match the expectations of practitioners of flood policy decision-making and it may be used differently than was expected or intended by experts. Moreover, the interaction between experts and practitioners is difficult due to differences in problem perceptions, time frames, reward structures, goals, process cycles, criteria for judging the quality of knowledge and discourse [
9,
10,
11,
12]. As a consequence, model outputs prepared by domain experts are often not part of the considerations and discussions among practitioners of flood policy decision-making and have little influence on the analysis of the situation at hand and the identification of possible measures [
7].
There is a growing recognition in the field of policy research that model outputs and other knowledge produced by domain experts (e.g., scientists, modellers, engineers) can be more effectively used when interactive ways of knowledge production are applied [
8,
13]. Instead of a one-way supply of information from the experts’ domain to the practitioners’ domain, knowledge is jointly produced by obtaining perspectives of domain experts, practitioners and other stakeholders involved in the complex problems that are being studied. This is also indicated in literature as the co-production of knowledge [
14,
15,
16]. Such interactive approaches are expected to result in a better inclusion of different knowledge sources, more socially robust knowledge (i.e., knowledge production that has taken place in its context of application) and increased ownership and accountability for decisions [
15,
17,
18,
19].
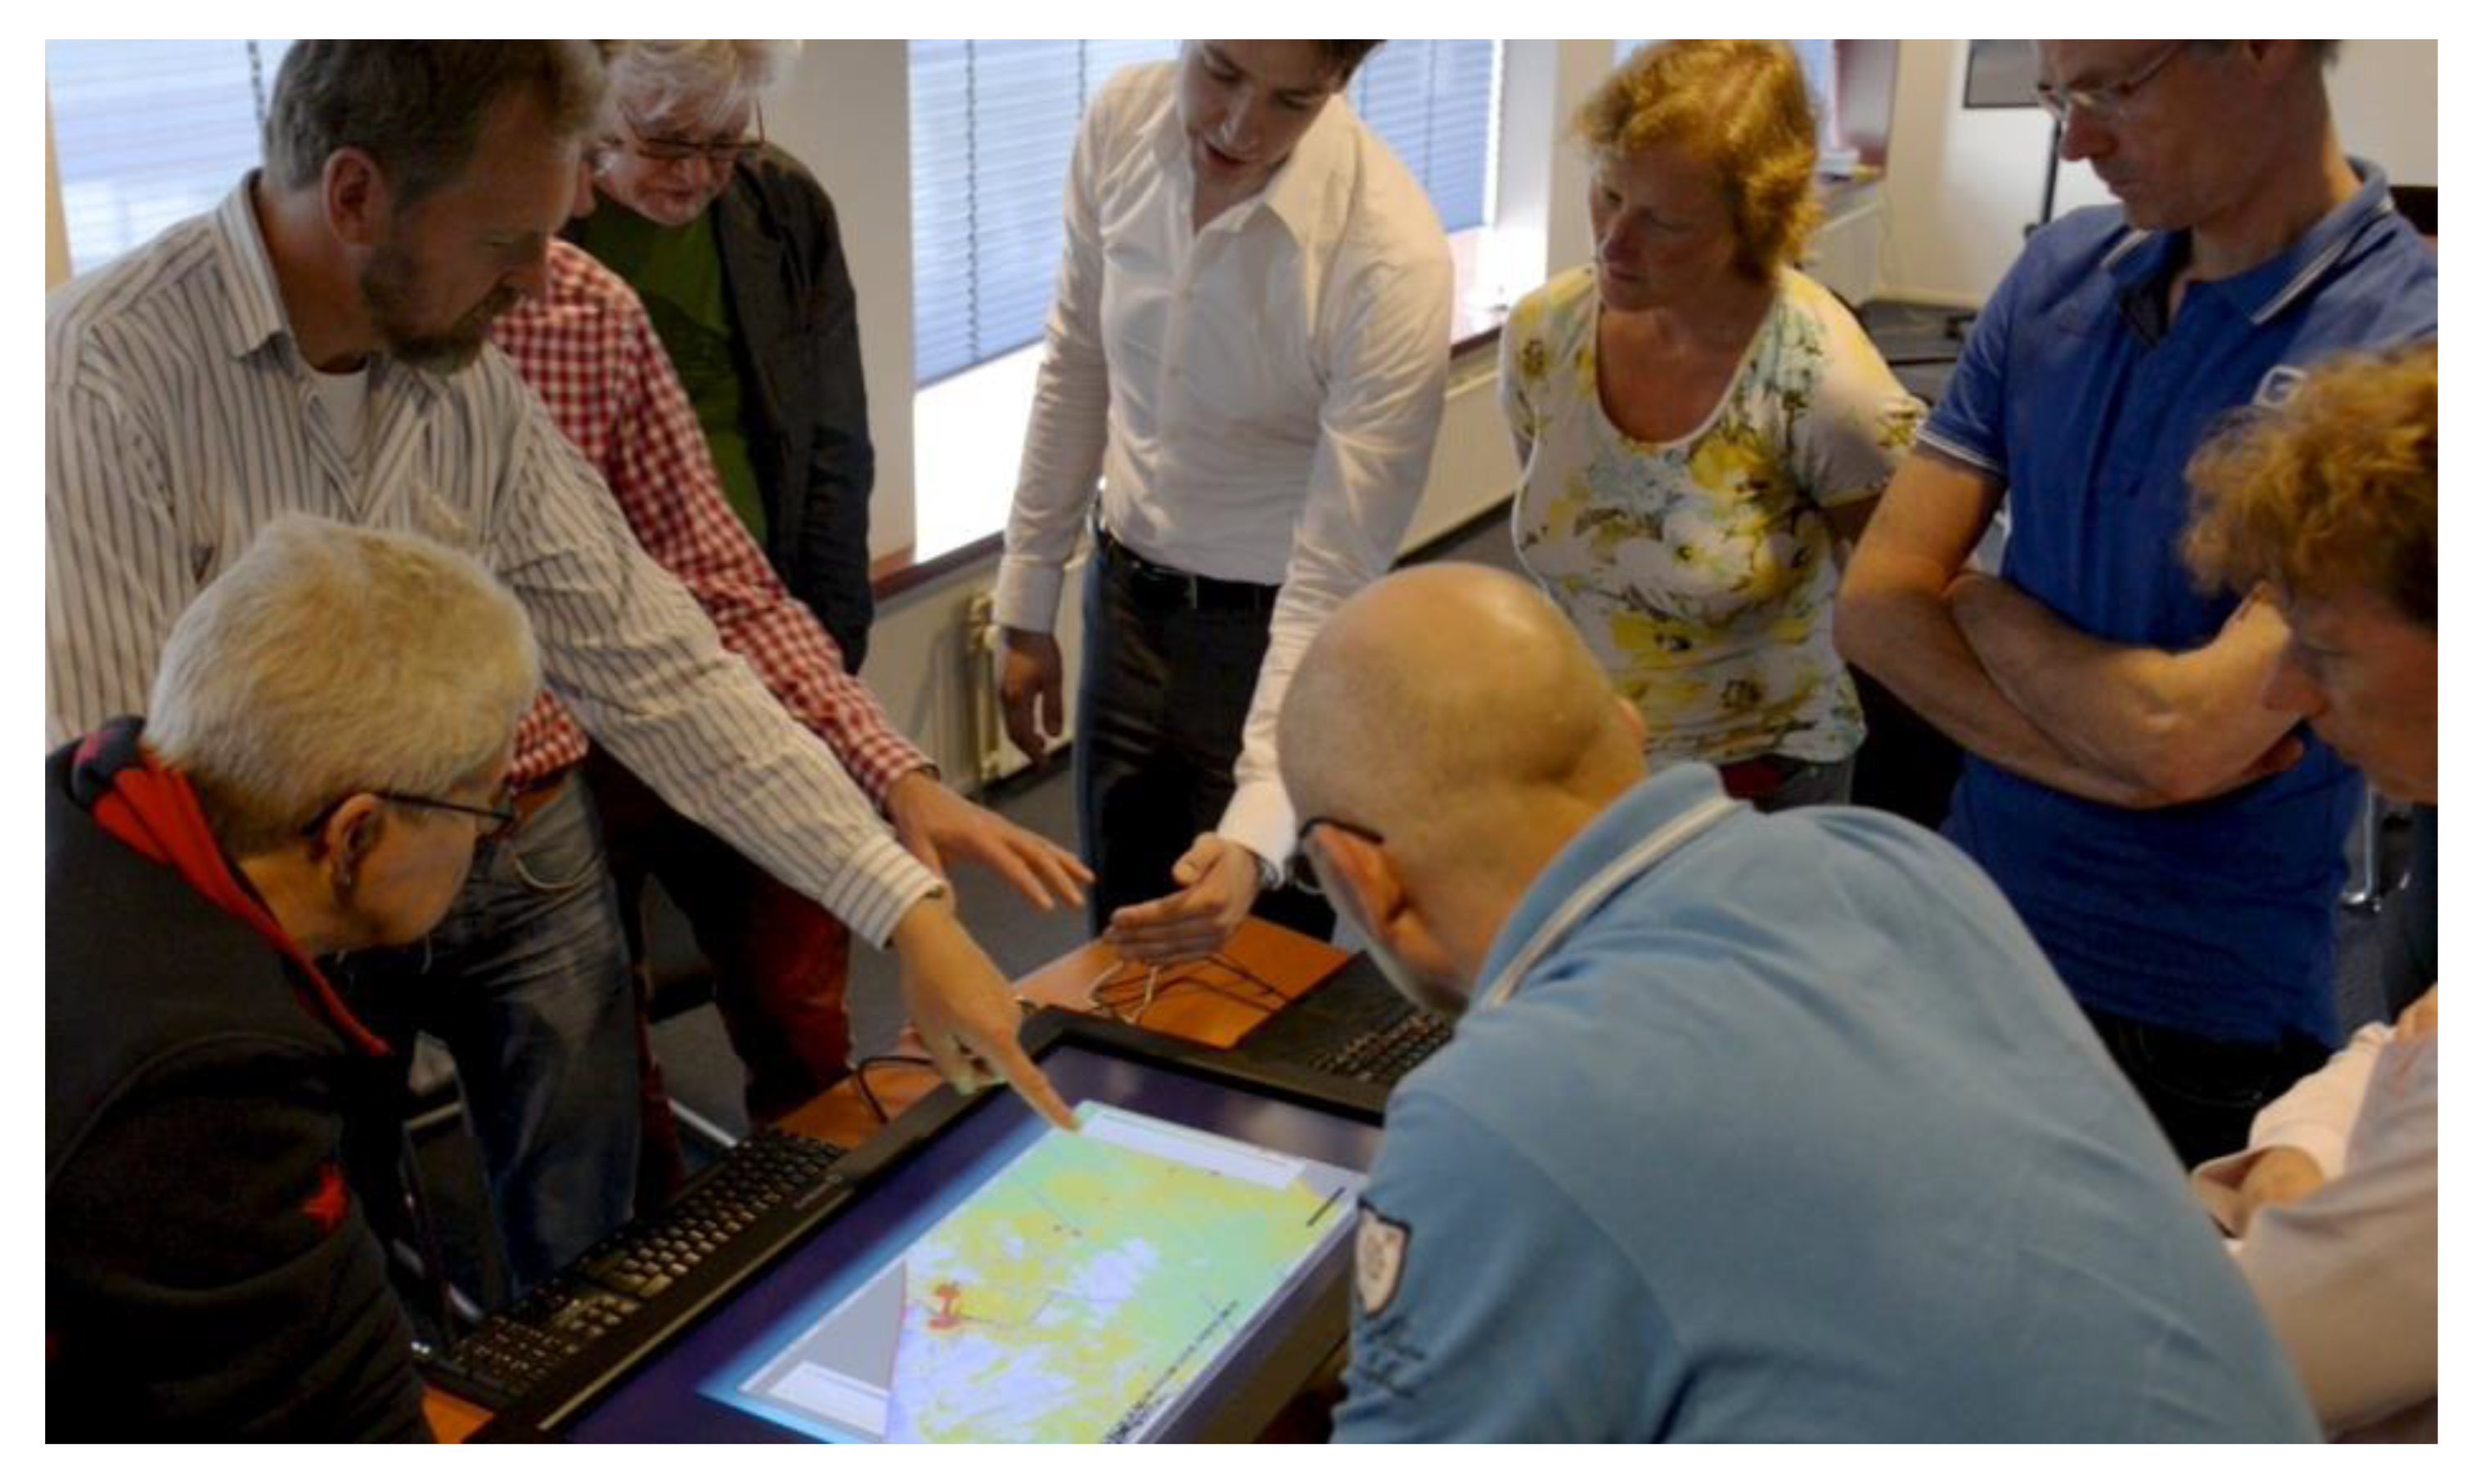
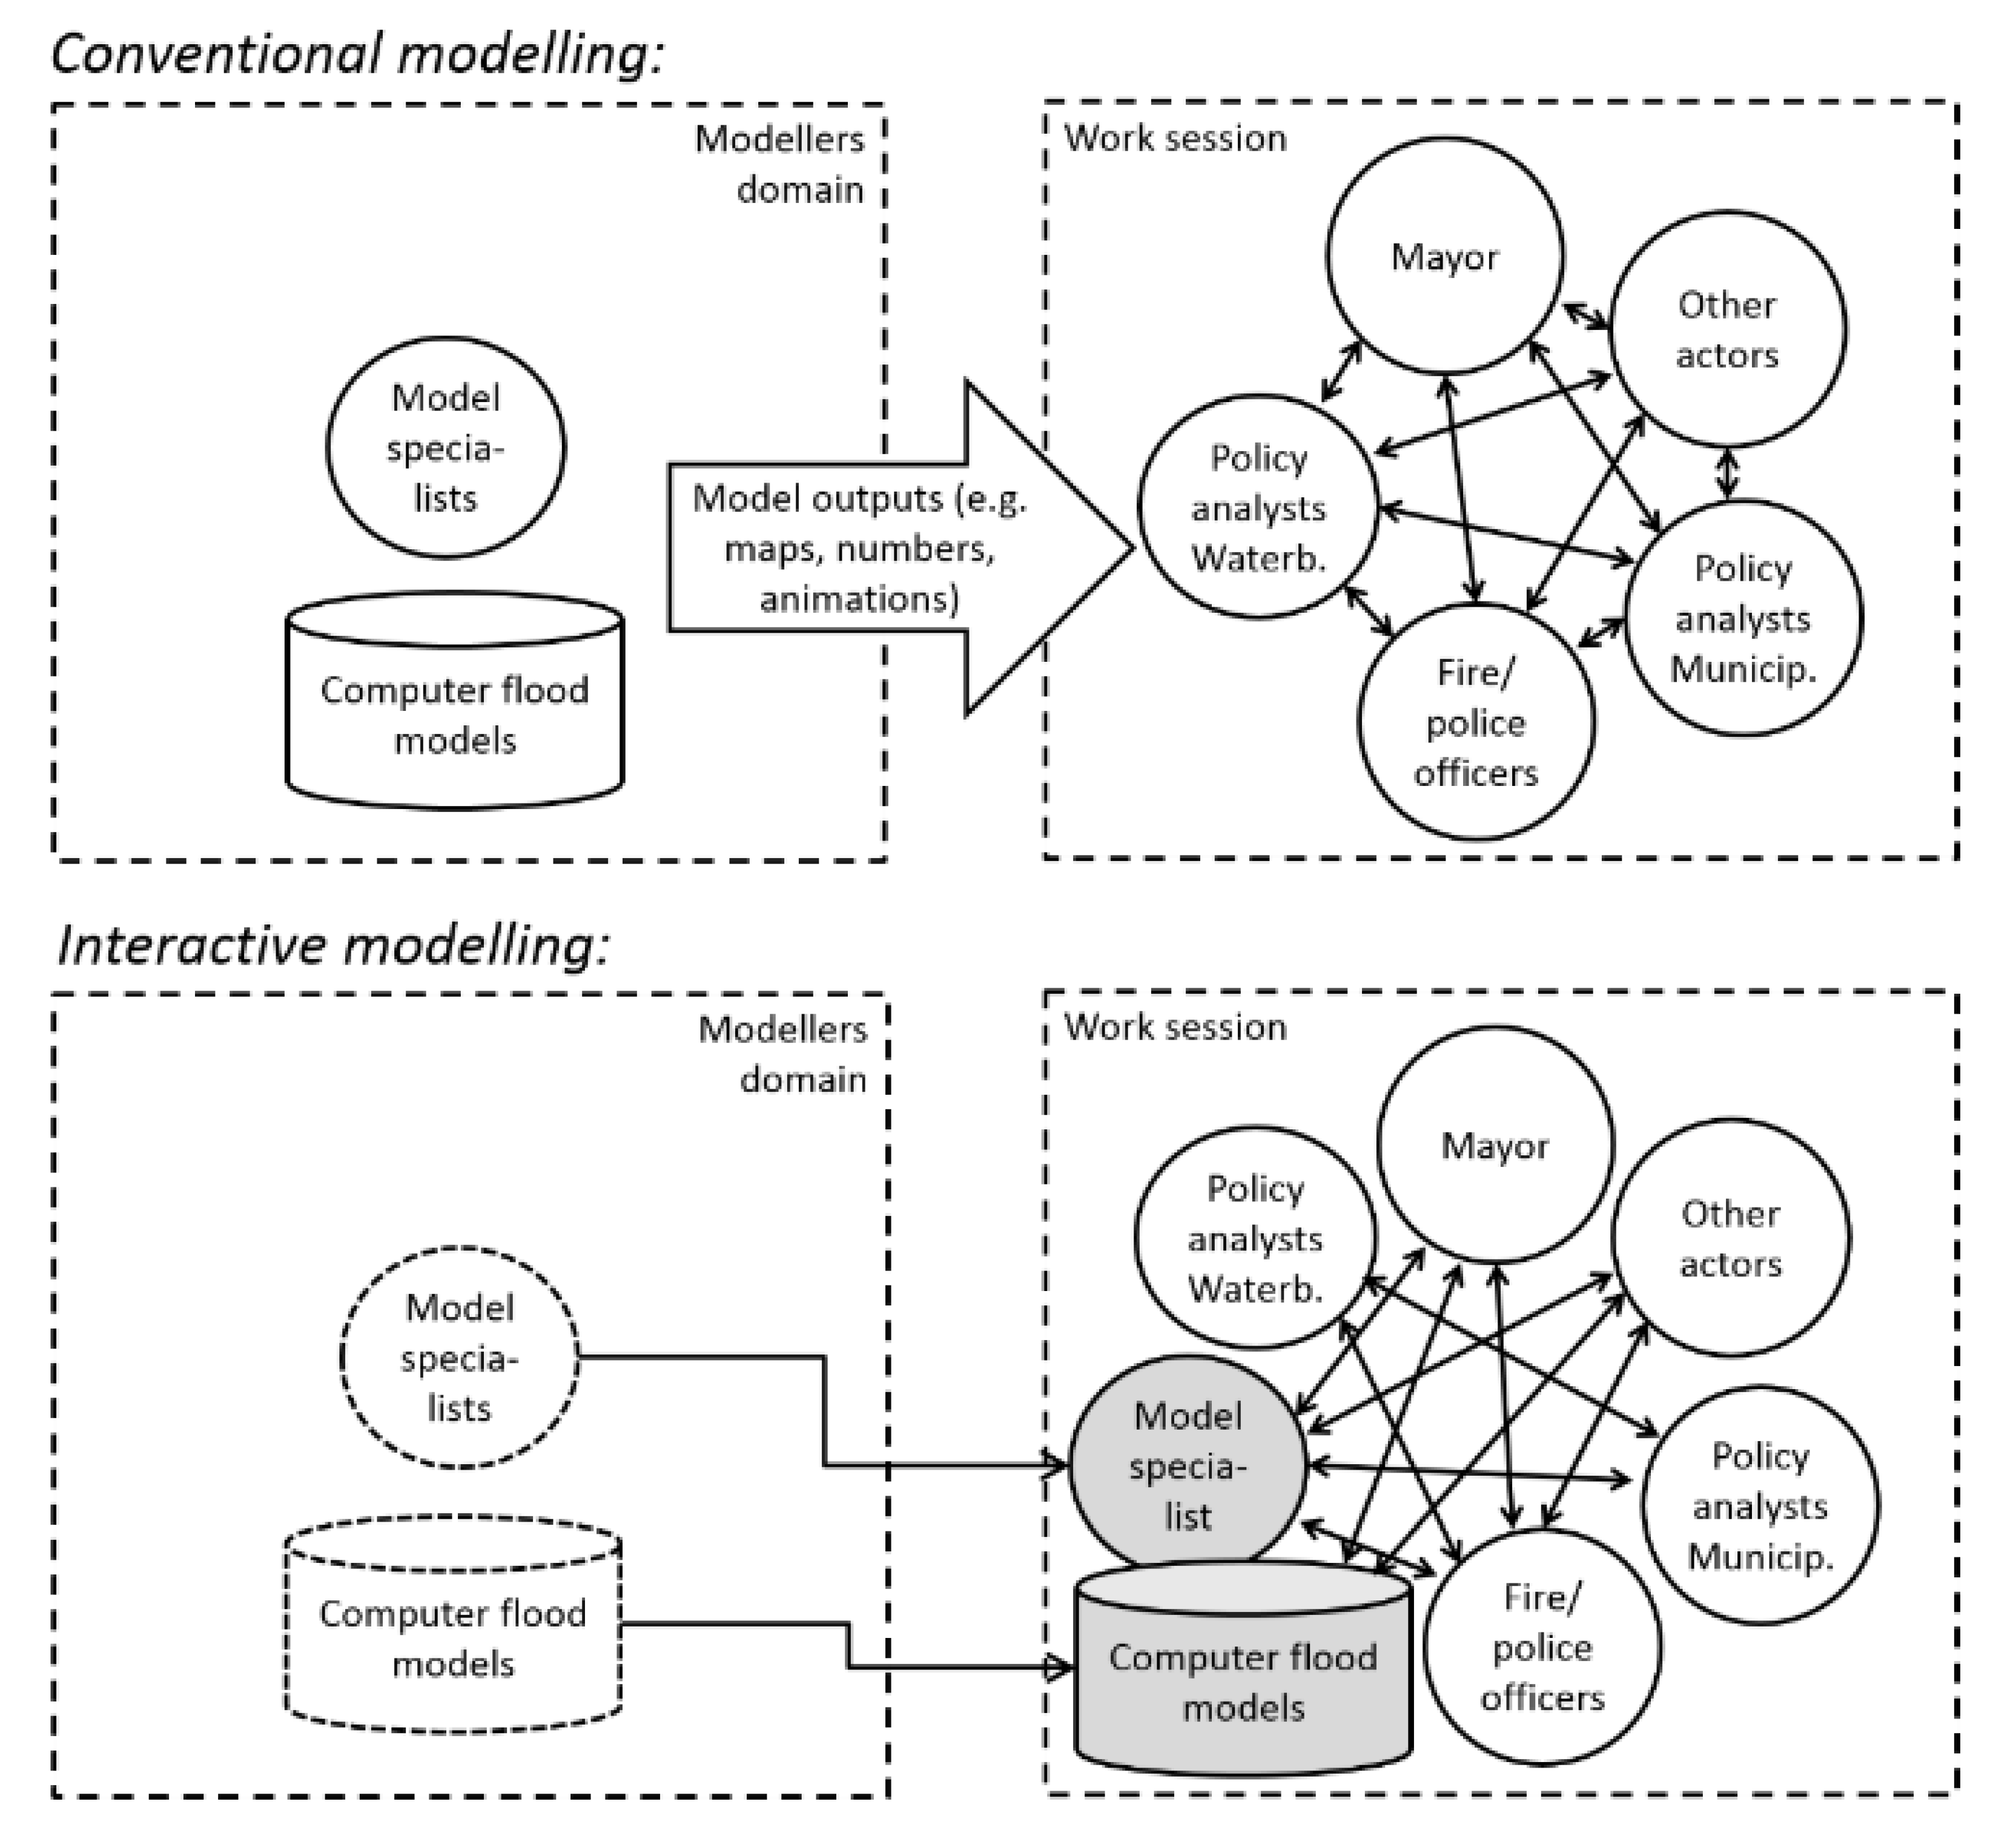
Following this development towards knowledge, which is jointly produced by domain experts and practitioners, flood simulation models have recently been developed that can be used during the work sessions in which practitioners and domain experts gather to collectively make decision choices (see
Figure 1). These so-called interactive models are expected to be more effective into the decision-making process than static maps from conventional simulation models. Interactive models rely on fast and flexible computation algorithms and realistic visualizations and are therefore accessible for practitioners so that they can carry out flood simulations together with domain experts in work sessions [
20] (see
Figure 2). Interactive models can, for example, be used during work sessions to assess the impact of storm surges or dam breaches or to analyze the effects of suggested measures, such as elevating levees by sandbags in conditions of flood disaster management or developing water storage basins in urban areas. Other than ‘participatory modelling’ [
16,
21,
22], where a model itself is created together with practitioners or other stakeholders, interactive models are largely prepared on beforehand. However, interactive models can, depending on its functionalities, be adapted during a work session, for example, to add missing data or to set the conditions for different scenarios. The technical feasibility of using an interactive model in multi-actor work sessions in flood management has already been demonstrated in various cases. Leskens et al. [
23] concluded in two case studies that the interactive use of a flood simulation model during multi-actor work sessions was appreciated by its participants and was seen as an improvement when compared to the use of static flood maps made in advance of a work session.
Although the first application of interactive models shows that their use can be helpful to provide useful model information to practitioners, these observations are based on the personal opinions of only a small number of users. Moreover, these models were set-up with specific interactive functionalities, so it is hard to conclude if and how these applications where successful. Therefore, there is a need for a more systematic evaluation method of what is in fact the influence of applying an interactive model on the process and outcome of a work session. Gaining more insight about this influence is necessary as multi-actor work sessions in which interactive model tools are used are increasingly applied, for example during flood disasters [
20], urban planning [
23] or in serious games in which participants can play the role of different stakeholders in a virtual environment [
24]. Better understanding of the influences of applying interactive models will help practitioners to discriminate between successful and non-successful modelling approaches and will help model experts to improve their interactive models.
2. Objective
Our goals here are to gain more insight in the influence of interactive modelling on decisions. To this end, we present a method that uses observations to monitor and evaluate decision-making processes in work sessions where interactive models are applied. We present a theoretical framework as a basis for this method and operationalize this into measurable metrics. Consequently, we demonstrate the method in two cases of flood disaster decision-making, discuss its usefulness and applicability and propose directions for further research. By introducing an assessment method, we want to set the agenda for a more systematic evaluation of the influence of interactive models and tools applied in current and future flood policy decision-making.
3. Collaborative Knowledge Construction
The concept of collaborative knowledge construction refers to the real-time process of how different participants in meetings or workshops exchange knowledge and use external information sources (e.g., from maps or models) to create shared knowledge when decisions are made [
25]. It emphasizes the ongoing learning process of participants at times disturbed, uncertain and high-tempo environments [
26]. The concept of collaborative knowledge construction is therefore very useful to understand the process of flood policy decision making in work sessions where interactive models are used.
Collaborative knowledge construction is to a large extent measurable through real-time observation, which helps us to understand the influence of interactive models on decision-making. These real-time observations are usually done by video analysis in which the conversations during the process are fragmented into individual statements that are expressed by the participants [
25,
27]. Following this, these individual statements can be characterized on different properties of collaborative knowledge construction, for example by the topics that are being mentioned, the rate of participation of different actors and the extent to which participants refer to each other’s statements. This is further elaborated in the method section.
Examples of real-time observation of collaborative knowledge construction processes in groups are not yet found in flood policy decision making. Earlier methods to assess the use of model information mostly consist of an evaluation afterwards in which the usability of model information that was provided on beforehand is evaluated in terms as usefulness and accuracy [
1,
28,
29]. However, useful examples of real-time observation of collaborative knowledge construction processes can be found in educational research, for example to investigate the process of collaborative knowledge construction in the context of classrooms, digital bulletin board systems or internet forums [
30,
31,
32].
Related to the concept of collaborative knowledge construction is the concept of social learning, here defined as the process in which individuals or groups learn and adapt to disturbances and uncertain social-ecological conditions [
14,
33]. The social learning process takes place on wider time and group scales than multi-actor work sessions, which have a time horizon of approximately two hours (i.e., our unit of analysis).
Social learning can be analyzed on at least three time and group scales [
34]: (1) on short to medium time scales at the level of processes between collaborating stakeholders in collaboration processes, (2) on medium to long time scales at the level of change in actor networks, and (3) on long time scales at the level of change in governance structure (formal and informal institutions and cultural values, norms, and paradigms). The first level best corresponds with the process of collaborative knowledge construction in work sessions we are focusing on in this article.
4. Monitoring and Evaluation Method
The process of collaborative knowledge construction is further elaborated here in measurable indicators. To this end, we adopt indicators that have often been used for the same purpose but in another context, namely educational settings in classrooms or forums. We adapt these indicators to the situation of multi-stakeholder processes in flood policy decision making. We have categorized the indicators in three groups: indicators that relate to:
4.1. Indicators Related to the Content of Available Knowledge
The collaborative knowledge construction process depends on the content that is available in the multi-stakeholder work sessions, brought in by prior knowledge and experiences of the various stakeholders or by external information sources available such as flood maps or models. More content means that more input is available to collaboratively construct shared knowledge.
One can assess this content with the following indicators:
The scope of prior knowledge and experiences among the participants, measured by a questionnaire with questions about what organization the participant represents, their task in this organization, prior experience and knowledge related to the topic of the work session, planned contribution in work session and expected results of work session.
The amount of relevant external information available, such as maps, factsheets or databases.
4.2. Indicators Related to the Process of Collaborative Knowledge Construction
Besides the available content in a group, collaborative knowledge construction depends on how this content is exchanged among the different participants and how this exchange of content leads to constructed knowledge of the group [
36]. Social interaction plays an important role in this [
37]. Weinberger and Fischer [
38] provide a framework to further analyze this process of social interaction in detail. This framework was applied in research about computer supported collaborative learning in educational settings. Regarding the process of collaborative knowledge construction, the framework focuses on the degree to which different participants of work sessions participate and on the level of social co-construction, measured by the extent to which participants refer to contributions (i.e., statements) of other participants [
25].
Four levels of social co-construction can be discriminated [
30,
39], from low to high:
- (a)
externalization of knowledge, in which participants bring individual prior knowledge into the situation;
- (b)
elicitation of knowledge, in which participants are causing each other to express knowledge;
- (c)
conflict-oriented knowledge construction, in which different interpretations are confronted and knowledge structures are modified; and
- (d)
integration-oriented knowledge construction, in which individual perspectives of participants are integrated in common knowledge.
The different levels of social co-construction can be recognized by the type of statements that participants make, such as questions, replies, clarifications, interpretations or reflections.
For example, asking for clarification about the statement by another participant can be considered as the second level of social co-construction (i.e., elicitation), whereas debating the statement of another participant refers to the third level (i.e., conflict-oriented knowledge construction). In
Table 1 we link different types of statements, as distinguished by Pena-Shaff and Nichols [
30], to the four levels of social co-construction.
Following the aforementioned literature, the process of collaborative knowledge construction can be assessed by the following indicators:
- 3.
The degree of participation, measured by the number of statements per participant [
25,
40]. To make sure that the statements are in fact part of a participation process, they are only counted if they are a response to earlier statements and have the full attention of the group.
- 4.
The degree to which the discussed topics were socially co-constructed. This is measured by the number of statements per topic, sorted out by the four different levels of social co-construction (
Table 1). To ensure that the statements are in fact part of a shared knowledge construction process, they are only counted again if they are a response to earlier statements and have the full attention of the group.
4.3. Indicators Related to the Outcomes of Collaborative Knowledge Construction
A third aspect to assess the process of collaborative knowledge construction is to focus at its outcomes. Outcomes are the follow-up actions of a work session, such as a redefinition of the issue, definition of further research, the involvement of other actors, an elaboration of selected solutions or, the selection of a certain solution [
41].
The outcomes are strongly related to the content and the process of collaborative knowledge construction. For example, when a lot of content (i.e., prior knowledge and experience of participants or external information sources) is available in a work session and the process has a high quality (i.e., a high participation rate and high levels of social co-construction), one can expect good outcomes, for example with high effectiveness, sustainability or efficiency. However, this will not always be the case. One can also imagine the case in which the responsive decision-makers neglect the outcomes of a high-quality collaborative knowledge construction process and implement other decisions. Therefore, the outcomes of a collaborative knowledge construction process can be assessed by the consistency between the intended follow-up actions of the participants in the work session and the implemented measures. Related to this, Bouwen and Taillieu [
37] consider the social relational qualities of outcomes, related to the level of ownership of solutions by the stakeholders. This will be mainly proved after a work session and can be measured by the extent to which outcomes are committed to in follow-up actions, the participation of the stakeholders in follow-up work sessions, and the degree to which the participants show ownership of and feel responsible for agreed actions.
One can assess outcomes by the following indicators:
- 5.
The degree of consistency of the implemented follow-up actions and the intended follow-up actions during a work session. We measure this in a qualitative way by comparing both.
- 6.
The degree of ownership of the follow-up actions by the participants and their feeling of responsibility to undertake actions. We measure this by the participation (i.e., number of statements) of the participants in the definition of the follow-up actions and by monitoring the engagement of participants after the work session, for example by their interest to participate in new work sessions.
5. Methodology of Cases Studies
5.1. Case Objectives
The objective of our case experiments was to test the applicability and usefulness of our method presented in the former section. To this end, we applied two different model applications as introduced in this paper:
- (1)
A conventional model providing static model outputs and;
- (2)
An interactive model allowing for demand driven model simulations. Consequentially we compared the outcomes on the different indicators and discussed whether our method was able to capture the differences in collaborative knowledge construction between both approaches.
5.2. General Set-up of Cases
We tested our assessment method for the two modelling approaches in a predefined flood disaster decision-making situation. In the conventional modelling approach, the participants had the availability of static flood maps, showing floods on several dam breach location, and a digital elevation map and a topographical map. In the interactive modelling approach, the participants had the availability of the same maps. Additionally, they could make use of an interactive flood simulation model. The static flood maps that were available in both cases were created by using the interactive flood simulation model on beforehand.
In both cases, a similar multi-stakeholder work session during a flood disaster was simulated, characterized by a content-driven, high tempo decision-making process [
7]. We chose the setting of flood disasters, as in this setting the information sources such as maps and models are only used when they are directly applicable, since there is little time to process complex information [
12]. In other settings, where more time is available and specialists have more room for explanation and answering questions, the usefulness of model information to feed the process of knowledge construction is less clear. Another reason to choose this setting was the great variety of involved stakeholders (e.g., water boards, municipalities, fire departments or police departments) all bringing in different content to the knowledge construction process. Most of these stakeholders are not familiar with model information.
5.3. Case Description
The area of concern was the town Hoorn (in North Holland), which was threatened by a flood due to a storm on the adjacent lake named Markermeer. Each case had eight participants. The decision task of the participants in both cases was to decide about which neighborhoods of the town Hoorn had to be evacuated due to the threatening flood. The experiment took 30 min. At the start of each round of 10 min, the participants were given new information about the impending flood. After each round they had to make a decision. The disaster script that was followed is shown in
Table 2 and was similar for both cases. On beforehand, the participants where thoroughly briefed about the general time planning, their roles, the maps and the interactive flood simulation model. Since this was an experimental setting, indicator 5 (i.e., the consistency of the intended follow-up actions and the implemented follow-up actions) was not measured.
5.4. Participants
The cases were carried out during a conference about water information systems called the ‘Lizard Experience’ on 19 November 2014. Seventeen people participated our experiment (14 male and 3 female, aged between 40 and 65). While they were not familiar with the experiment, they all knew the context of flood management organizations and had experience working with maps. The participants were randomly distributed over both cases. All individual statements during the experiment in both cases where recorded and scored according to the assessment method as described in the former section.
To simulate the different stakeholder perspectives, each participant was informed beforehand of the experiment about his/her role and prior preferences for solutions. However, it was emphasized that this preference was allowed to change during the experiment due to new insights. Indicator 1 (i.e., the scope of prior knowledge and experiences among the participants) was not measured, since it was prescribed. In real cases, this indicator can be measured by standard questionnaire methods.
The following four roles where identified and each role was represented by two participants:
Mayor: has the perspective of ‘better safe than sorry’ and wants to evacuate as much and as soon as possible
Water board director: Since the strength of the dikes are the responsibility of the water board director, he advocates that evacuation is not necessary
Fire department officer: Due to earlier experiences, the fire department advocates for vertical evacuation, which means that the people move to higher floors instead of leaving the area
Police department officer: Prefers to evacuate the neighborhoods that are feasible to evacuate in relation to available evacuation routes
5.5. Available Information
Each group had the availability of the following information:
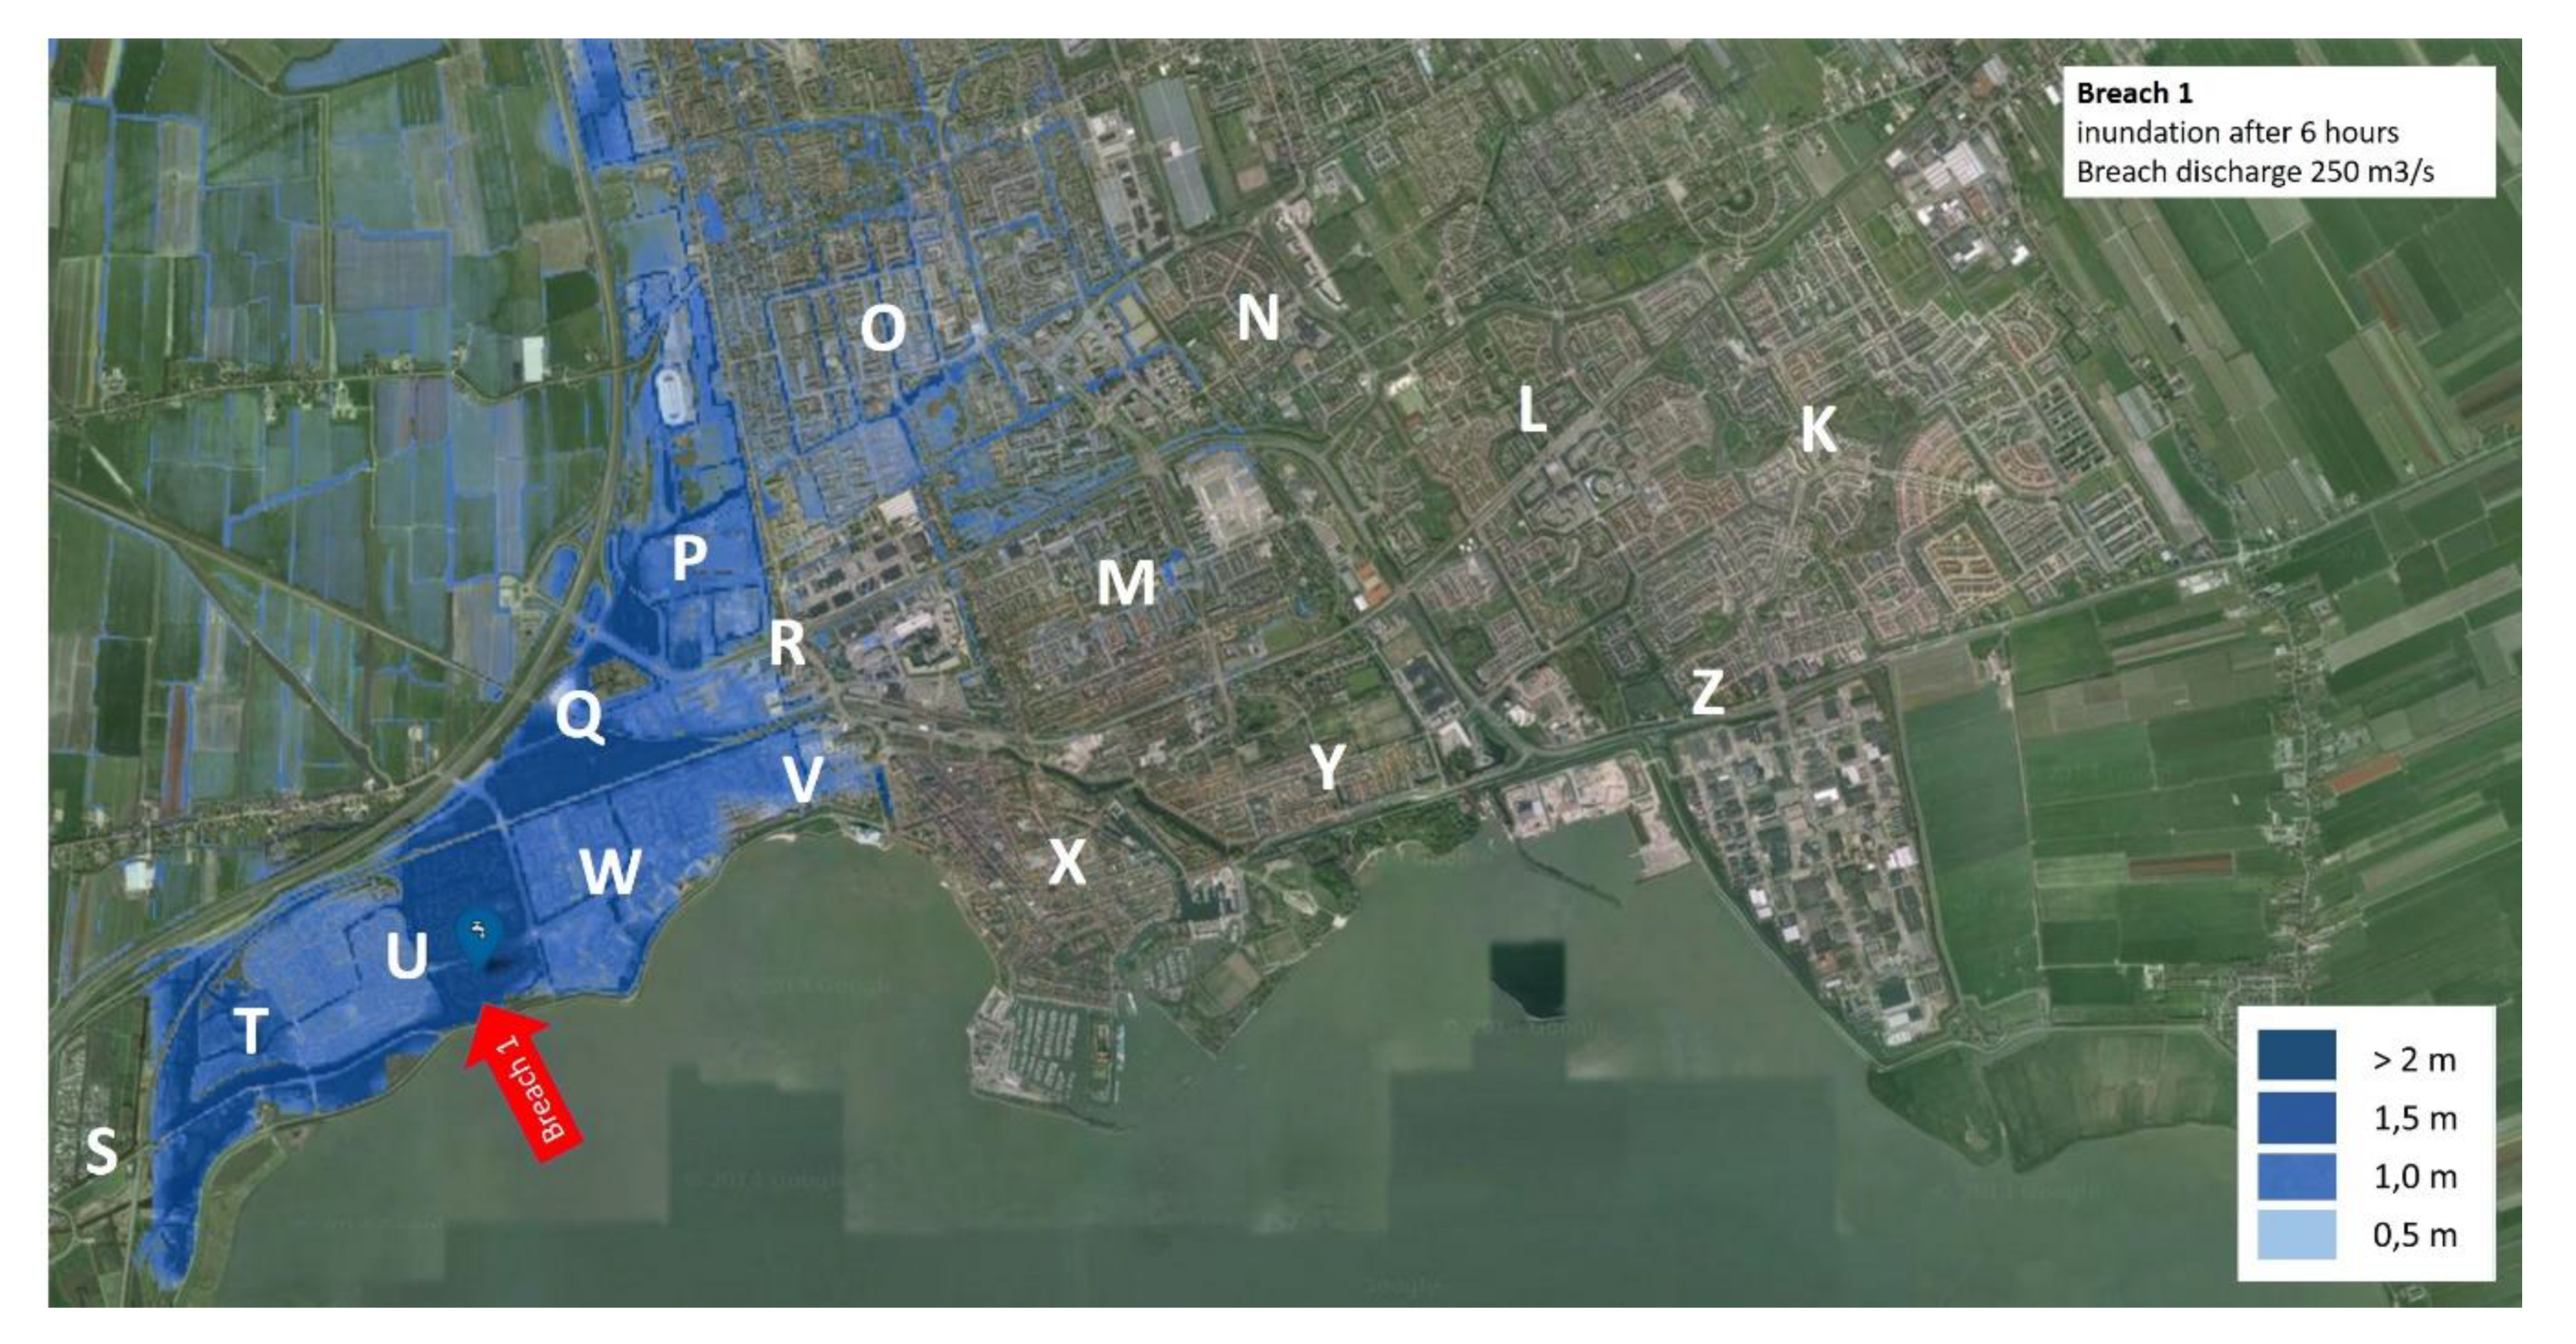
Six inundation maps, each showing the flooded area after six hours as the consequence of a certain dam breach (
Figure 3).
Digital elevation map of the area
Topographical map of the area, showing the main roads and the neighborhoods
5.6. Interactive Flood Simulation Model
The interactive flood simulation model that was applied in case 2 was the 3Di model [
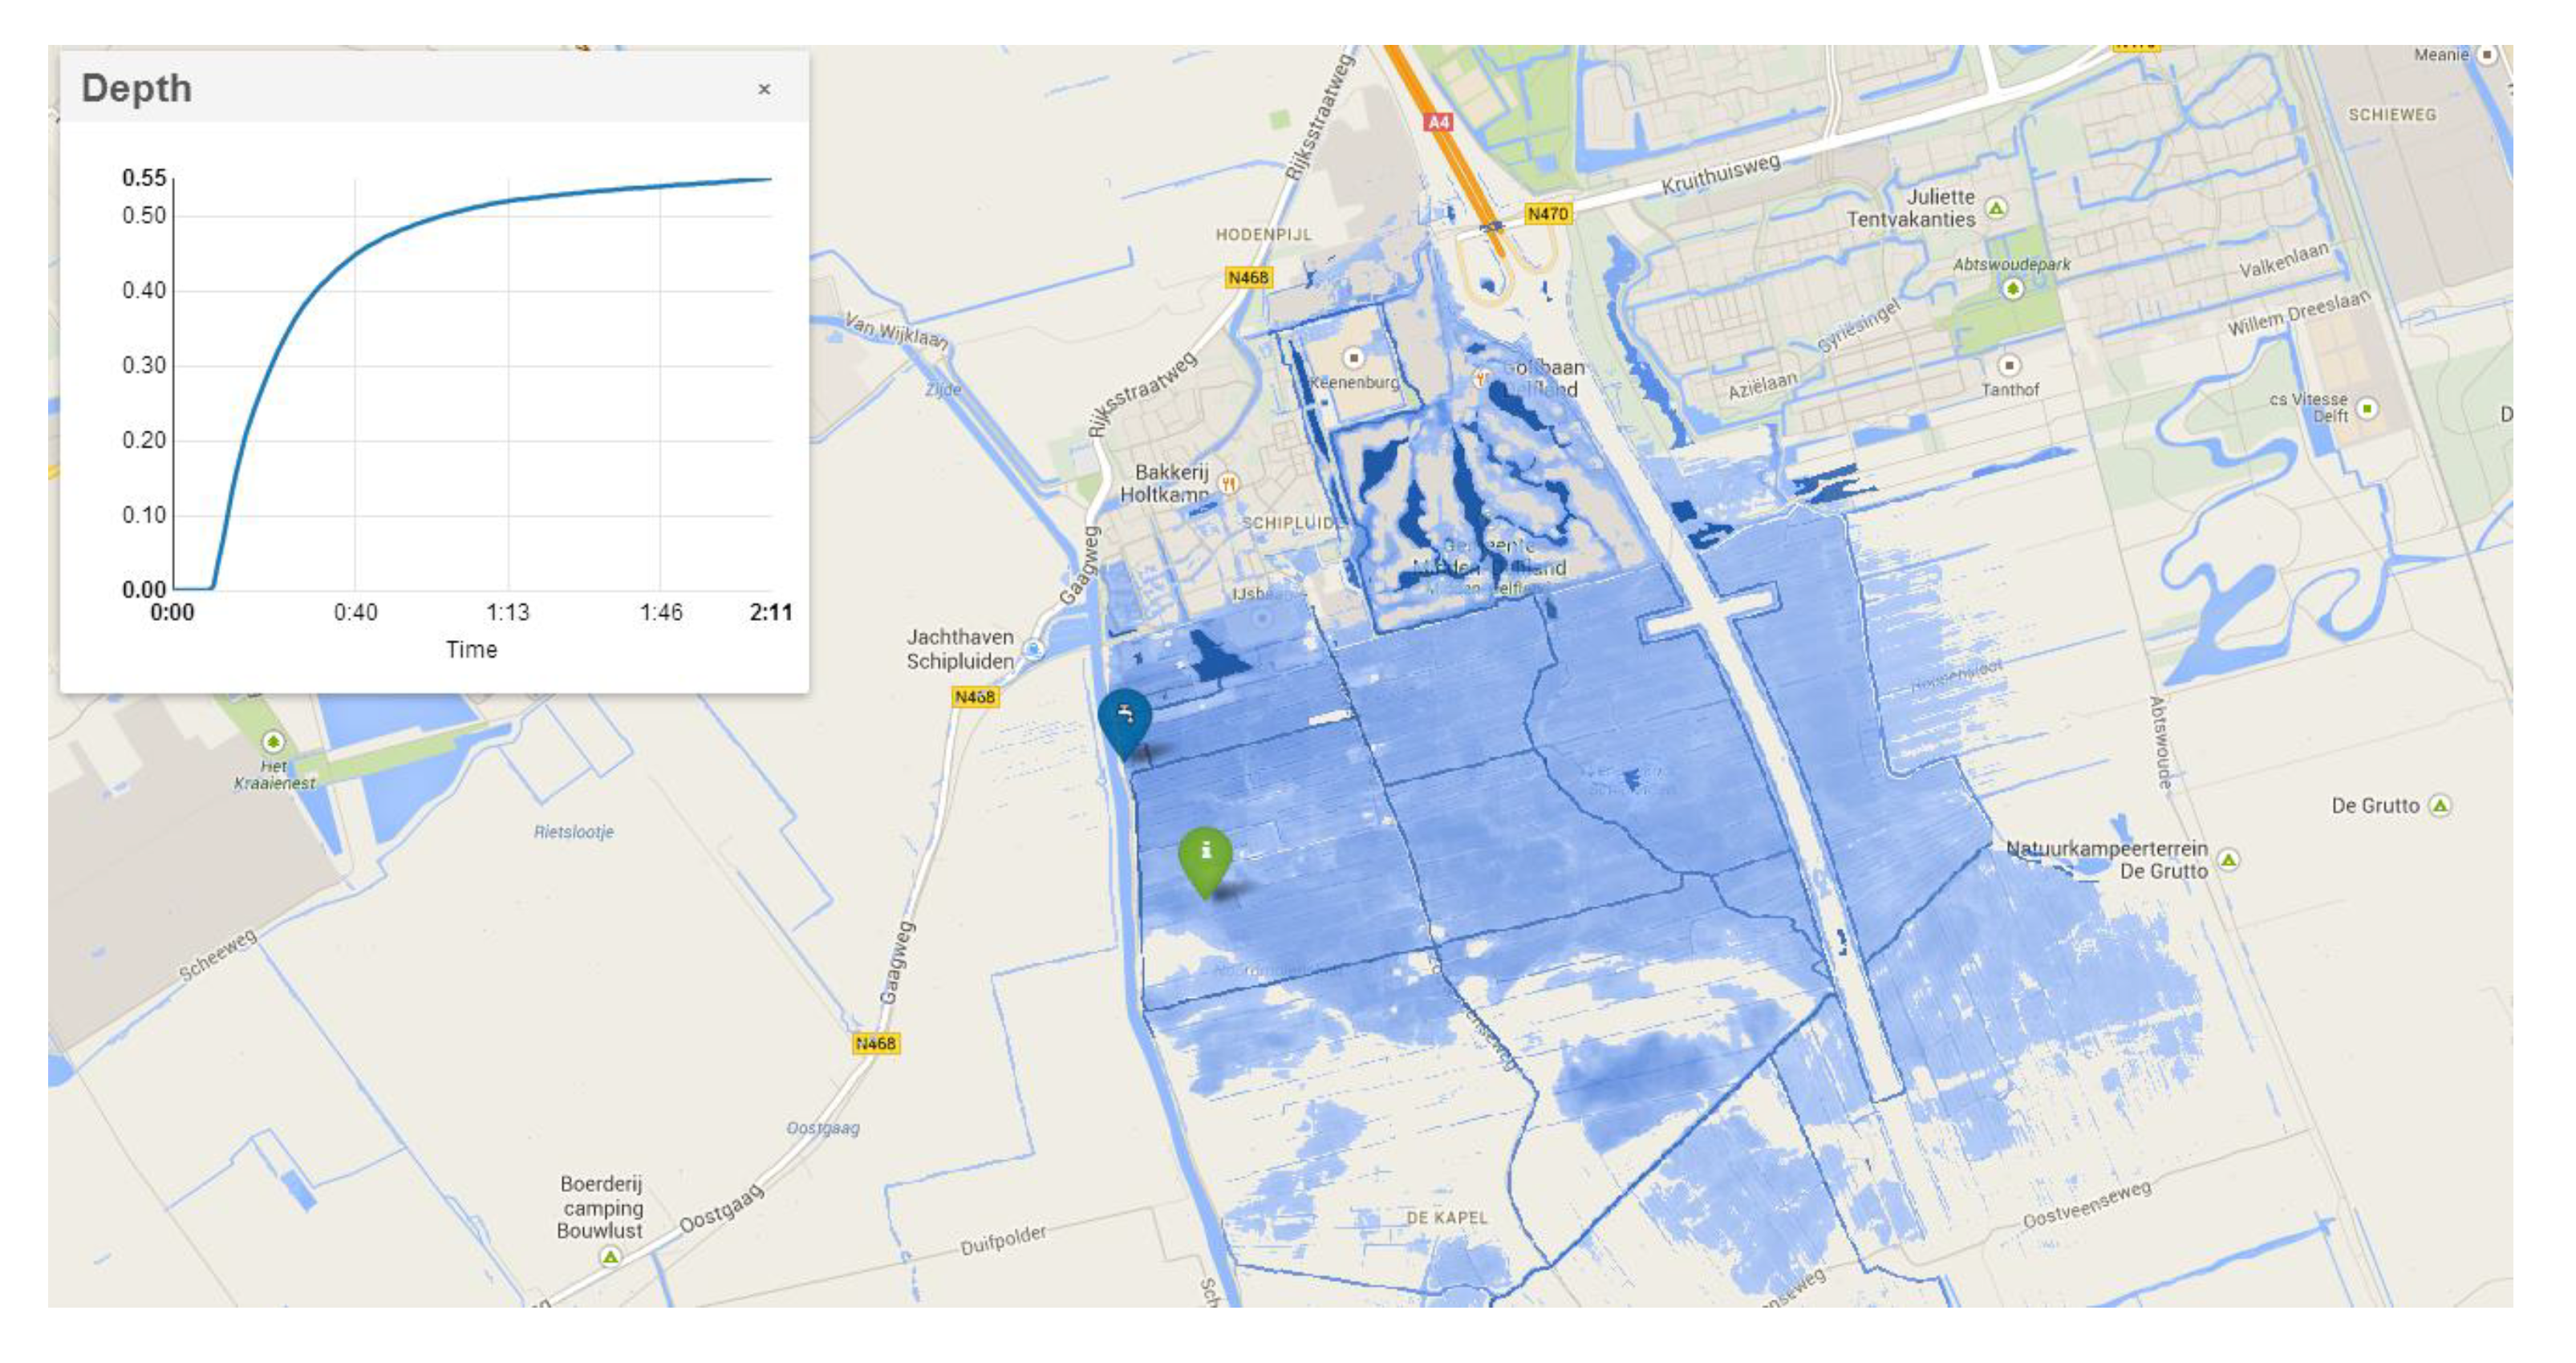
42]. The graphical user interface of 3Di consists of a digital topological map or satellite image of the area, projected on a touch table (
Figure 4). Dam breaches can be simulated by clicking on the screen. Either a fixed discharge or an initial width could be assigned to a dam breach location.
The speed and ease with which dam breaches could be simulated and the area could be adjusted without the help of model experts are the core innovative aspects of this interface. In conventional model interfaces adaptions can only be made by model specialists. Making adaptations in these conventional models, together with the accompanying computation time of an adapted model scenario, takes several hours and can therefore not be carried out during stakeholder meetings.
6. Results
6.1. Indicator 1: The Scope of Prior Knowledge and Experiences Among the Participants
Since an experimental setting was created, to compare the use of an interactive model with the conventional use of model information on maps, the prior knowledge and experiences of the participants in both cases were equal. In real-world applications this would be measured by a standard questionnaire. It would result in an inventory similar to the description in
Section 5.4.
6.2. Indicator 2: The Amount of Relevant External Information Available, such as Maps, Factsheets or Databases
Since an experimental setting was created, to compare the use of an interactive model with the conventional use of model information on maps, the content in both cases was equal, except from the interactive model that was used in one of the cases. In real world cases, indicator 2 would be measured by an inventory of the available external information as it is described in
Section 5.5.
6.3. Indicator 3: The Degree of Participation, Measured by the Number of Statements per Participant
The scores on indicator 3 (i.e., the degree of participation of the different participants) are shown in
Table 3. The scores show that the total number of statements per stakeholder in both cases is significant. Looking to the distribution of statements over the different stakeholders, we observe that in the case with the conventional model the water board expressed significantly less statements than the other stakeholders. However, as the total number of statements from the waterboard is still 26, we can conclude that all stakeholders contributed significantly to the process of knowledge construction with none of them withdrawing from the process of knowledge construction.
6.4. Indicator 4: The Degree to Which the Discussed Topics were Socially co-Constructed
The results on indicator 4 (i.e., the degree in which the discussed topics where socially co-constructed) are shown in
Table 4. The following conclusions can be drawn from this table:
More topics where discussed in the case without the use of an interactive model.
The participants in the case with the use of an interactive model have more focus on technical topics, represented by the type of topics (e.g., discussing the live model results, necessity of evacuation, the time to inundation and the routes of evacuation) and the intensity in which these topics were discussed.
The participants in the case without the use of an interactive model show a higher variety of topics discussed, such as different actions to decrease the consequences of floods and different options for evacuation (i.e., shelter on dike, improving self-reliance, evacuating cattle).
The distribution of the statements over the different levels of social co-construction are comparable in both cases (see the last row of the table).
6.5. Indicator 5: The Degree of Consistency of the Implemented Follow-up Actions and the Intended Follow-up Actions During a Work Session
After each round—which started with the provision of new information—the participants in both cases had to formulate follow-up actions. The follow-up actions after each round are listed in
Table 5, showing the following general points:
The participants in both cases (in round 1 and 2) focus on the same neighborhoods, whereas in round 3 the focus was different. Here, the participants in the case with the use of an interactive model could directly examine the consequences of a breach of the flood gate in the harbor of Hoorn. Since this dam breach location was not described on one of the six static flood maps, the participants in the case without the use of an interactive model had to estimate the potential flooded area.
The participants in the case with the use of an interactive model took the elements of depth and time to inundate more into consideration. This results in follow-up actions about vertical evacuation instead of evacuation out of the area, prioritizing neighborhoods that could be flooded early after a breach and providing inhabitants information about the time to inundation.
The participants in the case without the use of an interactive model covered a wider range of topics in their follow-up actions, such as concerns about invalid people, warning cattle farmers and leave evacuation routes open.
The results of indicator 6 (i.e., the degree of ownership of the follow-up actions by the participants) are shown in
Table 6. This ownership was measured by counting the number of statements per stakeholder regarding the formulation of follow-up actions. No clear differences between both cases can be observed. Notable is the high engagement of the municipality in both cases, which might be related to their preference of evacuating as many neighborhoods as possible. Since our experiment included a simulated environment, the real engagement afterwards could not be examined. In real-world applications, this would be an important indicator for the ownership of the follow-up actions [
37].
In summary, the collaborative knowledge construction process in the case with the use of an interactive model made it easier to integrate scientific knowledge, such as critical depths and time to inundation, into decision making. This resulted in follow-up actions about vertical evacuation instead of evacuation out of the area, prioritizing neighborhoods that could be flooded early after a breach and providing inhabitants information about the time to inundation. On the other hand, the case without the use of an interactive model ‘spent’ its collaborative learning capacity more on developing more integral follow-up actions, taking concerns about invalid people, warning cattle farmers and accessibility of evacuation routes into account. The outcomes on participation, social co-construction and ownership of the outcomes where comparable in both cases.
7. Discussion
Here, we discuss the limitations, restrictions and transferability of our method to other case studies. Given our experimental set-up, we were not able to test indicator 1 (conducting a questionnaire to measure the prior knowledge and experience of participants), indicator 2 (making an inventory of the amount of relevant external information available) and indicator 5 (comparing the follow-up actions and the implemented follow-up actions). Since these activities can be seen as common research activities, we did not find it necessary to test the usefulness and the practical applicability of these indicators. Moreover, it gave us the opportunity to focus on the other indicators (i.e., participation, co-construction and ownership), as they can be seen as more innovative indicators in the field of testing the use of models.
Improvements of the method that should be considered in future research are the inclusion of personal characteristics of participants that influence the collaborative knowledge construction process, such as leadership capacity and extroversion, and nonverbal communication [
43].
Situational aspects, such as relations among participants and shared history are expected to highly influence how participants interact and therefore influence the collaborative knowledge construction process. To understand how the use of models influences the process of collaborative knowledge construction, these situational aspects should therefore be carefully mapped. This is not necessary in contexts where situational aspects do not play an important role. An example of such a context is the context of flood disasters, as this is a content-driven, high tempo and temporal decision environment in which participants often do not know each other on beforehand.
In practice, our method can be applied to test the effect of different set-ups of multi-stakeholder work sessions in which interactive models are being used, for example by different guidance styles or different agendas. Further, the method can function as a benchmark in comparing different interactive models or other interactive analysis tools applied in flood management.
8. Conclusions
In this paper we investigated how the use of an interactive model influences the decision-making process in multi-actor work sessions in flood policy decision-making. Specifically, we focused on the properties of the collaborative knowledge construction process in the situation of flood disaster decision making. To make the influence of the use of an interactive model measurable, we presented a method including six indicators to monitor the content, process and outcomes of the collaborative knowledge construction process. We showed that a focus on the process of collaborative knowledge construction is a useful perspective to understand how model outputs become integrated with the knowledge of practitioners towards a shared understanding about the situation at hand. Our method therefore provides additional insights in the usefulness of models with respect to conventional methods that are mostly discriminating between ‘produced’ knowledge by domain experts and the use of this knowledge by practitioners.
The method helped us to understand how prior knowledge from participants merges with external knowledge from a model and how this results in shared knowledge of the group through a process of interaction. In the case with the interactive model we learned that, when technical knowledge about the situation at hand is directly available and understood, the shared knowledge base of the group was more enriched with technical knowledge. Consequently, this resulted in decisions that took more technical/physical properties of the expected flood into account, such as vertical evacuation instead of evacuation out of the area, prioritizing neighborhoods that could be flooded early after a breach and providing inhabitants information about the time to inundation.
Recording, fragmenting and classifying the conversations during the work sessions took around eight hours per case. Therefore, we succeeded in presenting a method that can be easily applied, focusses on measurability, but still captures important aspects of the process of collaborative knowledge construction when an interactive model is used.
Author Contributions
Conceptualization, J.G.L., M.B. and A.H.; methodology, J.G.L., M.B. and A.H.; software, J.G.L.; validation, J.G.L., M.B. and A.H.; formal analysis, J.G.L.; investigation, J.G.L.; resources, J.G.L., M.B. and A.H.; data curation, J.G.L.; writing—original draft preparation, J.G.L.; writing—review and editing, M.B. and A.H.; visualization, J.G.L.; supervision, M.B. and A.H.; project administration, J.G.L.; funding acquisition, J.G.L.
Funding
This research received no external funding.
Acknowledgments
Research was made possible by a grant from the research and development program 3Di Water Management. We gratefully acknowledge the various employees of the water boards that participated in case studies. This research is partly supported by the Spanish Government through María de Maeztu excellence accreditation 2018–2022 (Ref. MDM-2017-0714) of BC3.
Conflicts of Interest
The authors declare no conflict of interest.
References
- Demeritt, D.; Nobert, S.; Cloke, H.; Pappenberger, F. Challenges in communicating and using ensembles in operational flood forecasting. Meteorol. Appl. 2010, 17, 209–222. [Google Scholar] [CrossRef]
- Landström, C.; Whatmore, S.J. Virtually expert: Modes of environmental computer simulation modeling. Sci. Context 2014, 27, 579–603. [Google Scholar] [CrossRef] [PubMed]
- Hesselink, A.W.; Stelling, G.S.; Kwadijk, J.C.J.; Middelkoop, H. Inundation of a Dutch river polder, sensitivity analysis of a physically based inundation model using historic data. Water Resour. Res. 2003, 39. [Google Scholar] [CrossRef]
- Stelling, G.S. Quadtree flood simulations with sub-grid digital elevation models. Proc. Inst. Civ. Eng. Water Manag. 2012, 165, 567–580. [Google Scholar] [CrossRef]
- Brugnach, M.; Pahl-Wostl, C. A broadened view on the role for models in natural resource management: Implications for model development. In Adaptive and Integrated Water Management; Springer: Berlin/Heidelberg, Germany, 2008; pp. 187–203. ISBN 978-3-540-75940-9. [Google Scholar]
- Giebels, D.; van Buuren, A.; Edelenbos, J. Using knowledge in a complex decision-making process—Evidence and principles from the Danish Houting project’s ecosystem-based management approach. Environ. Sci. Policy 2015, 47, 53–67. [Google Scholar] [CrossRef]
- Leskens, J.G.; Brugnach, M.; Hoekstra, A.Y.; Schuurmans, W. Why are decisions in flood disaster management so poorly supported by information from flood models? Environ. Model. Softw. 2014, 53, 53–61. [Google Scholar] [CrossRef]
- Seijger, C.; Dewulf, G.; Otter, H.; Van Tatenhove, J. Understanding interactive knowledge development in coastal projects. Environ. Sci. Policy 2013, 29, 103–114. [Google Scholar] [CrossRef]
- Bouwen, R. Developing relational practices for knowledge intensive organizational contexts. Career. Dev. Int. 2001, 6, 361–369. [Google Scholar] [CrossRef]
- Brugnach, M.; Dewulf, A.; Henriksen, H.J.; van der Keur, P. More is not always better: Coping with ambiguity in natural resources management. J. Environ. Manag. 2011, 92, 78–84. [Google Scholar] [CrossRef]
- Hegger, D.; Lamers, M.; Van Zeijl-Rozema, A.; Dieperink, C. Conceptualising joint knowledge production in regional climate change adaptation projects: Success conditions and levers for action. Environ. Sci. Policy 2012, 18, 52–65. [Google Scholar] [CrossRef]
- Morss, R.E.; Wilhelmi, O.V.; Downton, M.W.; Gruntfest, E. Flood Risk, Uncertainty, and Scientific Information for Decision Making: Lessons from an Interdisciplinary Project. Bull. Am. Meteorol. Soc. 2005, 86, 1593–1602. [Google Scholar] [CrossRef]
- Brugnach, M.; Özerol, G. Knowledge co-production and transdisciplinarity: Opening Pandora’s box. Water 2019, 11, 1997. [Google Scholar] [CrossRef]
- Armitage, D.; Berkes, F.; Dale, A.; Kocho-Schellenberg, E.; Patton, E. Co-management and the co-production of knowledge: Learning to adapt in Canada’s Arctic. Glob. Environ. Chang. 2011, 21, 995–1004. [Google Scholar] [CrossRef]
- Mauser, W.; Klepper, G.; Rice, M.; Schmalzbauer, B.S.; Hackmann, H.; Leemans, R.; Moore, H. Transdisciplinary global change research: The co-creation of knowledge for sustainability. Curr. Opin. Environ. Sustain. 2013, 5, 420–431. [Google Scholar] [CrossRef]
- Voinov, A.; Bousquet, F. Modelling with stakeholders. Environ. Model. Softw. 2010, 25, 1268–1281. [Google Scholar] [CrossRef]
- Cash, D.W.; Clark, W.C.; Alcock, F.; Dickson, N.M.; Eckley, N.; Guston, D.H.; Jäger, J.; Mitchell, R.B. Knowledge systems for sustainable development. PNAS 2003, 100, 8086–8091. [Google Scholar] [CrossRef]
- Cornell, S.; Berkhout, F.; Tuinstra, W.; Tàbara, J.D.; Jäger, J.; Chabay, I.; de Wit, B.; Langlais, R.; Mills, D.; Moll, P.; et al. Opening up knowledge systems for better responses to global environmental change. Environ. Sci. Policy 2013, 28, 60–70. [Google Scholar] [CrossRef]
- Gibbons, M. Science’s new social contract with society. Nature 1999, 402, C81–C84. [Google Scholar] [CrossRef]
- Leskens, J.G.; Kehl, C.; Tutenel, T.; Kol, T.; de Haan, G.; Stelling, G.; Eisemann, E. An interactive simulation and visualization tool for flood analysis usable for practitioners. Mitig. Adapt. Strat. Glob. Chang. 2017, 22, 307–324. [Google Scholar] [CrossRef]
- Castelletti, A.; Soncini-Sessa, R. Bayesian Networks and participatory modelling in water resource management. Environ. Model. Softw. 2007, 22, 1075–1088. [Google Scholar] [CrossRef]
- Ward, N.; Whatmore, S.J.; Lane, S.N.; Odoni, N.A.; Bradley, S. Coproducing flood risk knowledge: Redistributing expertise in critical “participatory modelling”. Environ. Plan. A 2011, 43, 1617–1633. [Google Scholar]
- Leskens, J.G.; Brugnach, M.; Hoekstra, A.Y. Application of an interactive water simulation model in urban water management: A case study in Amsterdam. Water Sci. Technol. 2014, 70, 1729–1739. [Google Scholar] [CrossRef] [PubMed]
- Hummel, H.G.K.; van Houcke, J.; Nadolski, R.J.; van der Hiele, T.; Kurvers, H.; Löhr, A. Scripted collaboration in serious gaming for complex learning: Effects of multiple perspectives when acquiring water management skills. Br. J. Educ. Technol. 2011, 42, 1029–1041. [Google Scholar] [CrossRef]
- Fischer, F.; Bruhn, J.; Gräsel, C.; Mandl, H. Fostering collaborative knowledge construction with visualization tools. Learn. Instr. 2002, 12, 213–232. [Google Scholar] [CrossRef]
- Keller, A.C.; Ansell, C.K.; Reingold, A.L.; Bourrier, M.; Hunter, M.D.; Burrowes, S.; MacPhail, T.M. Improving Pandemic Response: A Sensemaking Perspective on the Spring 2009 H1N1 Pandemic. Riskhazards Crisis Public Policy 2012, 3, 1–37. [Google Scholar] [CrossRef]
- Derry, S.J.; Pea, R.D.; Barron, B.; Engle, R.A.; Erickson, F.; Goldman, R.; Hall, R.; Koschmann, T.; Lemke, J.L.; Sherin, M.G.; et al. Conducting Video Research in the Learning Sciences: Guidance on Selection, Analysis, Technology, and Ethics. J. Learn. Sci. 2010, 19, 3–53. [Google Scholar] [CrossRef]
- Faulkner, H.; Parker, D.; Green, C.; Beven, K. Developing a Translational Discourse to Communicate Uncertainty in Flood Risk between Science and the Practitioner. Ambio 2007, 36, 692–703. [Google Scholar] [CrossRef]
- Janssen, J.A.E.B.; Hoekstra, A.Y.; de Kok, J.-L.; Schielen, R.M.J. Delineating the Model-Stakeholder Gap: Framing Perceptions to Analyse the Information Requirement in River Management. Water Resour. Manag. 2009, 23, 1423. [Google Scholar] [CrossRef]
- Pena-Shaff, J.B.; Nicholls, C. Analyzing student interactions and meaning construction in computer bulletin board discussions. Comput. Educ. 2004, 42, 243–265. [Google Scholar] [CrossRef]
- Banks, J.A. The Canon Debate, Knowledge Construction, and Multicultural Education. Educ. Res. 1993, 22, 4–14. [Google Scholar] [CrossRef]
- Brandon, D.P.; Hollingshead, A.B. Collaborative learning and computer-supported groups. Commun. Educ. 1999, 48, 109–126. [Google Scholar] [CrossRef]
- Argyris, C.; Schon, D.A. Organizational Learning: A Theory of Action Perspective; Addison-Wesley Publishing Company Reading: Boston, MA, USA, 1978; ISBN 978-0-201-00174-7. [Google Scholar]
- Pahl-Wostl, C.; Craps, M.; Dewulf, A.; Mostert, E.; Tabara, D.; Taillieu, T. Social Learning and Water Resources Management. Ecol. Soc. 2007, 12. [Google Scholar] [CrossRef]
- Jensen, E. Sensemaking in military planning: A methodological study of command teams. Cogn. Tech. Work 2009, 11, 103–118. [Google Scholar] [CrossRef]
- Gergen, K.J.; Thatchenkery, T.J. Organization Science as Social Construction: Postmodern Potentials. J. Appl. Behav. Sci. 2004, 40, 228–249. [Google Scholar] [CrossRef]
- Bouwen, R.; Taillieu, T. Multi-party collaboration as social learning for interdependence: Developing relational knowing for sustainable natural resource management. J. Community Appl. Soc. 2004, 14, 137–153. [Google Scholar] [CrossRef]
- Weinberger, A.; Fischer, F. A framework to analyze argumentative knowledge construction in computer-supported collaborative learning. Comput. Educ. 2006, 46, 71–95. [Google Scholar] [CrossRef] [Green Version]
- Newman, D.R. A Content Analysis Method to Measure Critical Thinking in Face-to-Face and Computer Supported Group Learning. Interpers. Comput. Technol. J. 1995, 3, 56–77. [Google Scholar]
- Hiltz, S.R. Correlates of learning in a virtual classroom. Int. J. Man-Mach. Stud. 1993, 39, 71–98. [Google Scholar] [CrossRef]
- Hage, J. Theories of Organizations: Form, Process, and Transformation; Wiley: Hoboken, NJ, USA, 1980; ISBN 978-0-471-33859-8. [Google Scholar]
- Volp, N.; Stelling, G.; Van Schrojenstein, J. 3Di; Nelen & Schuurmans: Utrecht, The Netherlands, 2014. [Google Scholar]
- Kittleson, J.M.; Southerland, S.A. The role of discourse in group knowledge construction: A case study of engineering students. J. Res. Sci. Teach. 2004, 41, 267–293. [Google Scholar] [CrossRef]
© 2019 by the authors. Licensee MDPI, Basel, Switzerland. This article is an open access article distributed under the terms and conditions of the Creative Commons Attribution (CC BY) license (http://creativecommons.org/licenses/by/4.0/).


