Article

Experimental Investigation of Flow Characteristics in Porous Media at Low Reynolds Numbers (Re→0) under Different Constant Hydraulic Heads

1
College of Geosciences and Engineering, North China University of Water Resources and Electric Power, Zhengzhou 450046, China
2
Key Laboratory of Watershed Geographic Sciences, Nanjing Institute of Geography and Limnology, Chinese Academy of Sciences, Nanjing 210008, China
*
Authors to whom correspondence should be addressed.
Water 2019, 11(11), 2317; https://doi.org/10.3390/w11112317
Submission received: 25 September 2019 / Revised: 1 November 2019 / Accepted: 3 November 2019 / Published: 6 November 2019
(This article belongs to the Section Hydrology)

Abstract

:
Understanding natural flows in porous media with low Reynolds number (Re) has significant implications for both science and engineering. However, knowledge and experimental gaps remain regarding such natural flows. In this context, we designed a sand column-based laboratory filtration experiment to investigate flow characteristics in porous media with low Re. Four media were considered including two silts (silt-I and silt-II), one silty sand, and one medium sand. Results show that constant hydraulic head is presumed to be an important factor that affects flow regime in porous media. In general, the flow approaches Darcian at a constant hydraulic head of ~170 cm, whereas it becomes non-Darcian at a constant hydraulic head of ~230 cm. The type of media determines the Re range that delimitates between Darcy and non-Darcy flows. Specifically, the transition appears at 0.015 < Re < 0.020 for medium sand and 0.000027 < Re < 0.000029 for silt-II, respectively. In the condition of constant hydraulic heads, the breakdown of Darcy’s law may occur at very low Re values (Re→0). Media dependent Re ranges are probably needed to describe the beginning of non-Darcy flows, rather than 1 to 10 or other value for all media. Findings in this study can offer insights into calculation and simulation of flows in low-permeability reservoirs, pumping process of foundation pit excavation, and other non-Darcy flows in low-permeability media.

1. Introduction

Improving the understanding of natural flow in porous media is important for a range of science and engineering applications [1,2,3]. In the field of hydrological research, Darcy’s law is the most fundamental law of groundwater dynamics [4]. At present, the law has been widely used in solving hydrogeological problems such as groundwater seepage and pollutant migration. In most cases, the analytical solution and numerical solution assume that “groundwater seepage obeys Darcy’s law”. Such solutions include the basic differential equation of groundwater movement, the Dupuit stable well flow model, the Theis unsteady well flow model and the Boulton, Neumen unsteady submersible well flow model. The assumption is also used in research and development of groundwater numerical simulation software (e.g., MODFLOW, GMS, and FEFLOW) [5]. In its original form, Darcy’s law was published in 1856 by Henry Darcy explaining the linear relation between flow velocity and hydraulic gradient for water flow in sand filters [6,7]:
v   =   K   d H d L
where v is the flow velocity (cm/s), d H d L is the hydraulic gradient, and H is the total (or hydraulic) head consisting of pressure head h and elevation head z. L represents the length of the soil sample over water flows, and K is the hydraulic conductivity (cm/s). Darcy’s law has been extensively used in geophysical and engineering applications at Reynolds number (Re) values of up to 1 [8]. Due to energy losses as a result of increasing kinematic forces and inertia effects [9], deviations of fluid flow from Darcy’s law have been observed [10,11,12]. To this end, new equations have been developed by modifying the original Darcy’s law [11,13,14,15,16,17,18,19,20,21]. For high velocity flows in coarse-particle media, Forchheimer proposed an empirical relationship with a quadratic term:
d H d L   =   a v +   b v 2
where a and b are empirical parameters related to media and fluid. It is proven that the linear term represents the viscous effect and the quadratic term represents the inertial effect [22].
The laminar and non-laminar flow is generally demarcated by Re. To predict non-Darcy flow in porous media, Re is defined as
R e   =   ρ d 0 v μ
where v is the average flow velocity (cm·s−1), d0 is the mean grain diameter (cm), and μ is the kinematic viscosity coefficient (cm2·s−1).
To know the applicability of Darcy’s law, scientists first investigated the criteria to identify non-linear flows [23,24,25]. Generally, the critical Re values for non-Darcy flows varied among media and liquids. The critical values are 0.01–0.1 for disordered porous media [26], 0.4–3 for loosely consolidated sandstones, 10–1000 for unconsolidated sands and lead shot [23], 0.9–414 for gravel bed materials consisting of cobble, sand, and gravel [9], 1–100 for columns of packed particles [24], 22–27 and 52–104 for two quartz sand samples in diameters of 0.5–0.63 mm and 0.63–1.25 mm [27], and 30 for cubic arrays of spheres in diameters of 3–10 mm [25]. Based on varying Re values (0.16–700) for the average pore (particle) size and velocity, Dybbs and Edwards [28] identified four types of flow regimes, namely, Darcy or creeping flow, inertial flow, unsteady laminar flow, and highly unsteady and chaotic flow. It was found that most Re values in aforementioned studies are greater than 1 or even hundreds to thousands for non-Darcy flows [29].
There is a general consensus that Darcy’s law holds for an upper limit Re value between 1–10 (based on average grain size and velocity) [30]. Flows below this limit are dominated by viscous force and usually considered laminar, and Darcy’s law applies. Whereas flows above this limit become non-laminar or turbulent, and Darcy’s law no longer applies [28,30,31,32]. Nonetheless, the lower boundary of Re values for Darcy’s flow still remains unclear. In other words, few studies have been conducted to investigate flows with very low Re values (Re→0).
The type of media is an important influencing factor that affects flow regime. To the best of our knowledge, most media used in previous studies are coarse particles, such as rockfill [33], rocks, gravel, sandstones, plexiglass spheres, cylindrical tubes, or capillaries. These studies mainly focused on critical Re values, the inertial effect on flows in porous media [25,34,35,36], and the mechanism behind the transition from Darcy to Forchheimer flow [8,37]. Given the large variabilities in pore geometry at the macro-scale, media dependent functional forms are generally needed to represent non-Darcy flow for different porous media [37]. By contrast, the investigation of low-permeability media (e.g., silt and silty sand) had received little attention. Such investigation is generally time-consuming and technically difficult due to the inherent characteristics of low-permeability media.
Given the theoretical and hydrological importance of Re, the main objective of this study is to investigate flow regimes in typical porous media characterized by low Re values and the associated effects of changing constant hydraulic heads, using laboratory filtration experiments in combination with sand columns. In this paper the following questions are specifically addressed:
(1)
Do varying constant hydraulic heads affect flow regime and hydraulic conductivity?
(2)
What are the flow characteristics in low-permeability porous media with very low Re values?
(3)
What is the upper boundary of Re for Darcy’s law in porous media with very low Re values?

2. Materials and Methods

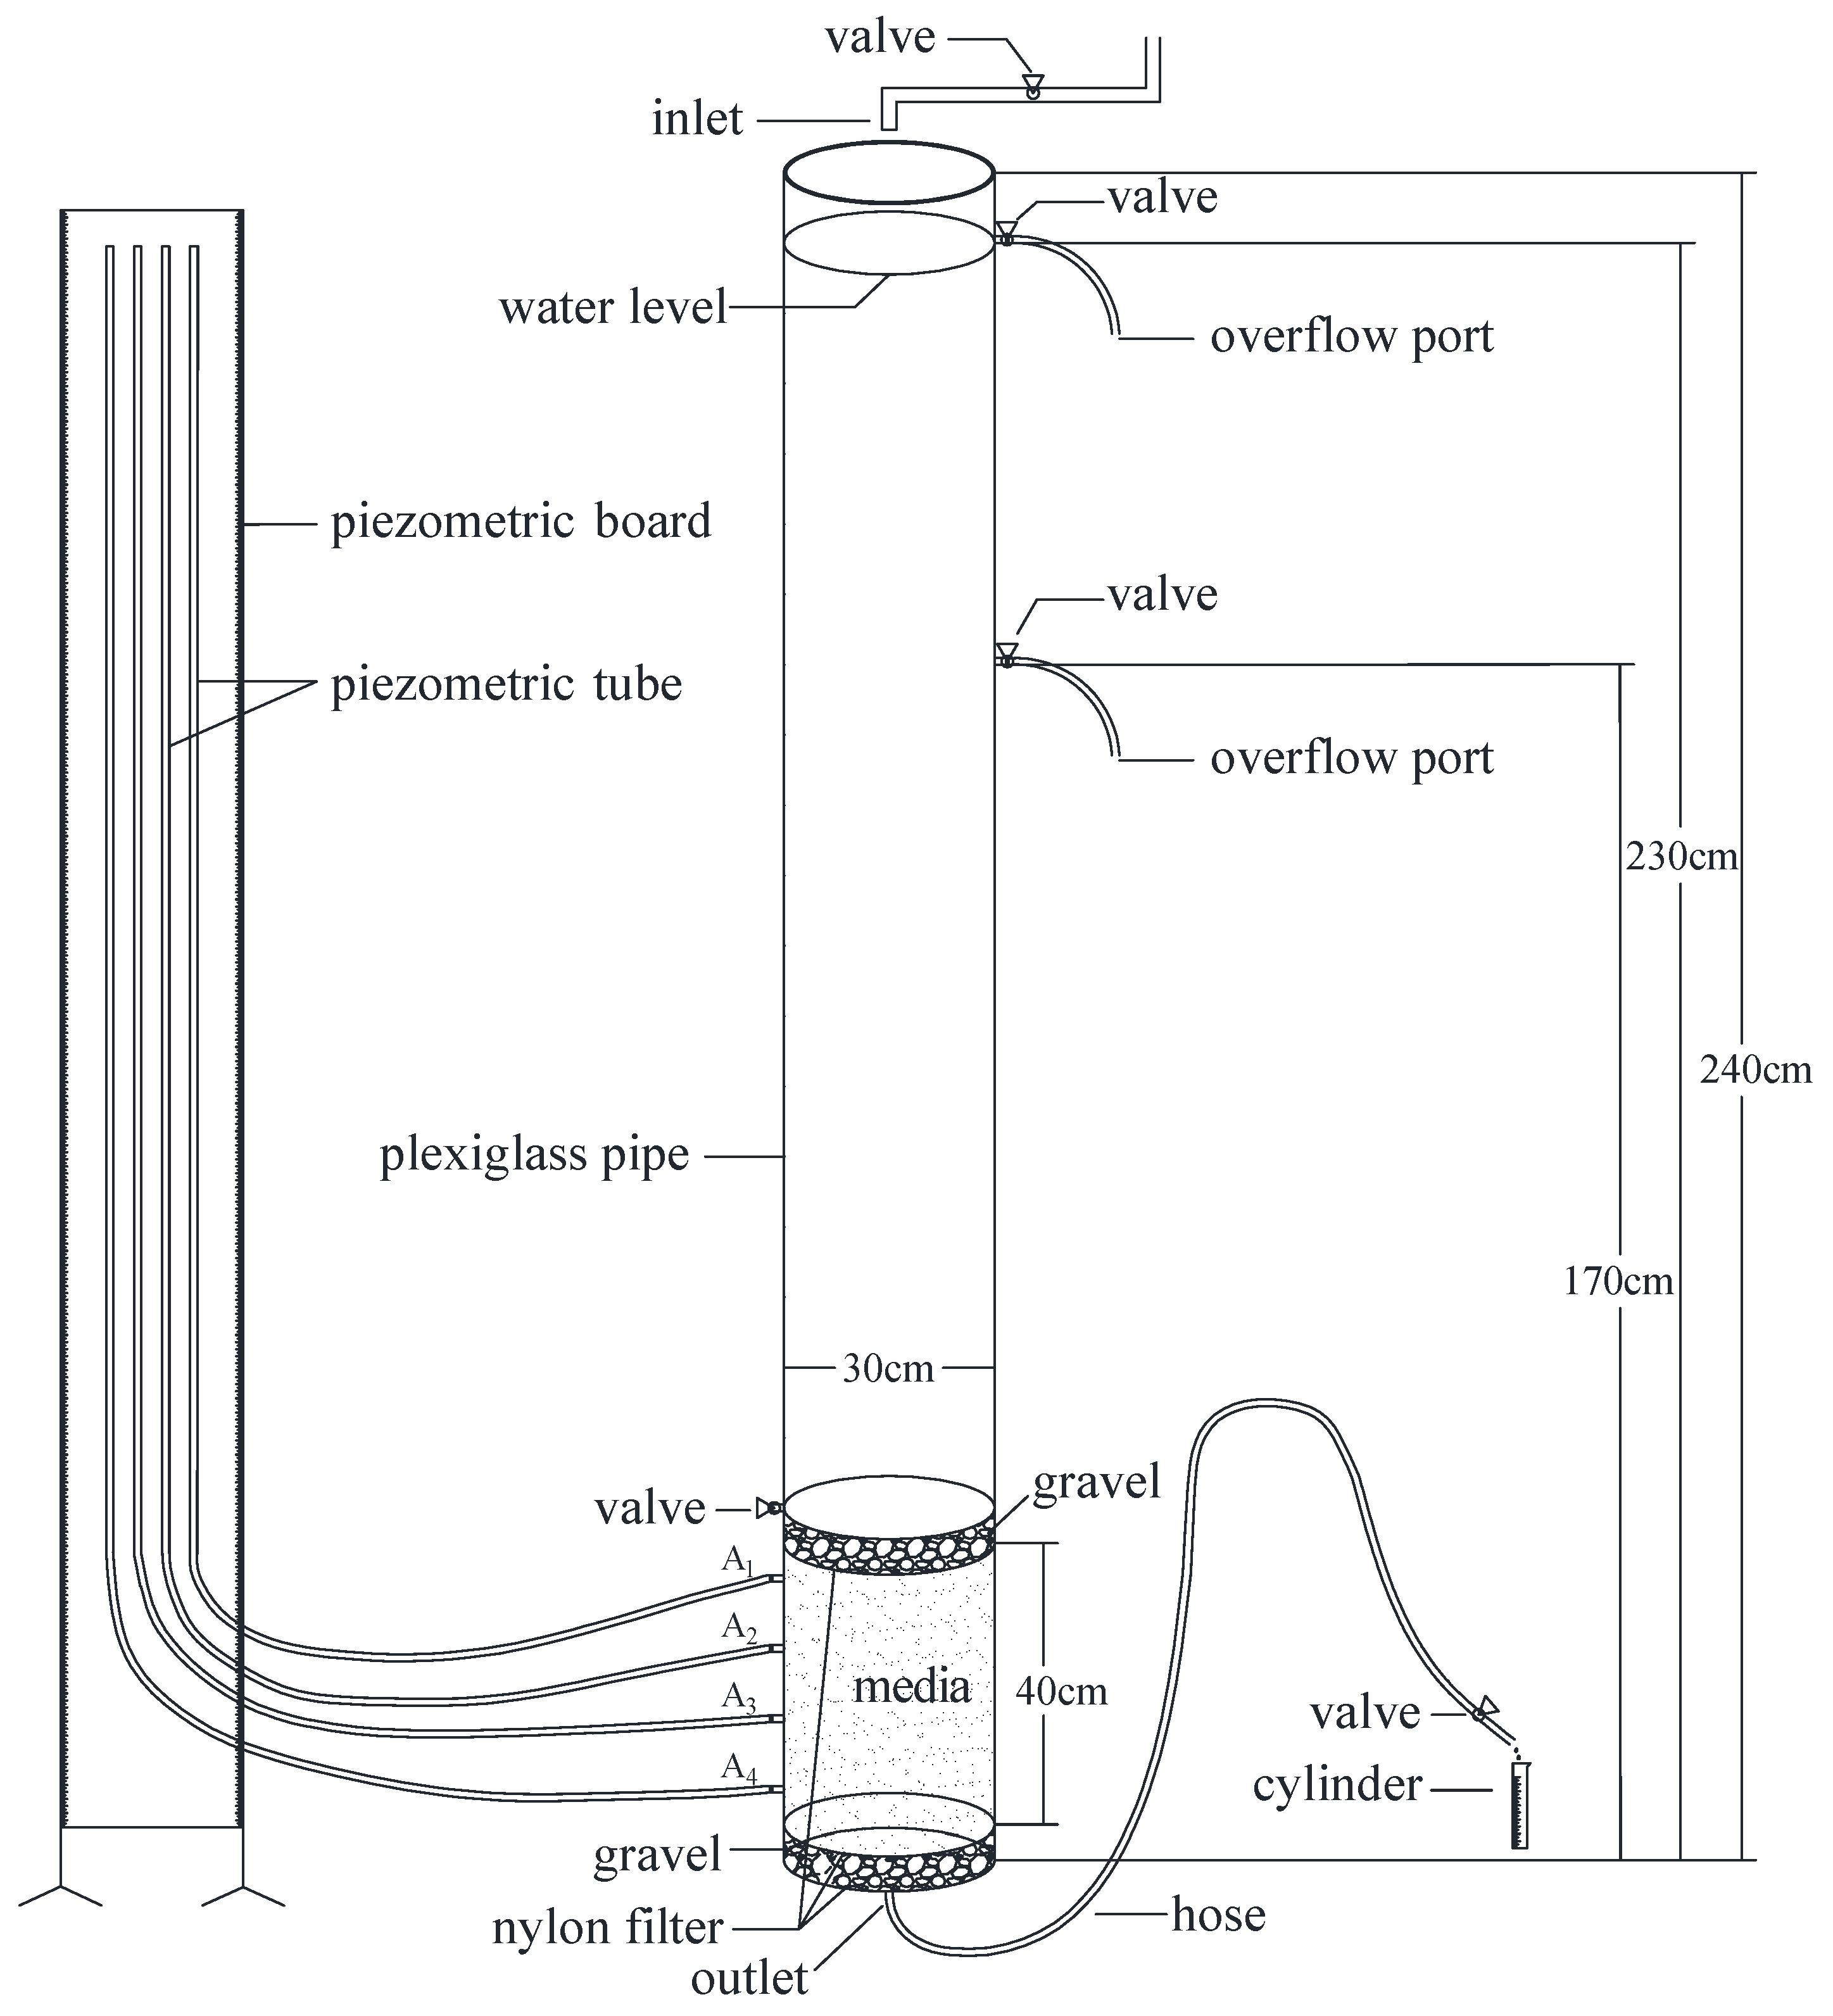
2.1. Experimental Setup

In this study, laboratory filtration experiments were performed based on a column (diameter: 30 cm and height: 240 cm). Figure 1 shows a schematic diagram of the experimental setup. The upper end of the column was open. At the bottom there was an outlet with a connected rubber hose. Four piezometric tubes at intervals of 10 cm were mounted on the side wall 10 cm from the bottom. The column was filled with sampled media to a height of approximately 40 cm, and with gravels 5 cm thick below and above the media. Nylon filters were placed between the media and gravels and at the bottom of column. Then, the medium was naturally compacted by water seeping at an extremely slow speed from the bottom hose. Then, water was injected into the column from the upper end and the excess water overflowed from the overflow port to maintain a constant water level. The difference in hydraulic head was adjusted by the hose. Water permeated through the media and flowed into the cylinder.
During the experiments, the steady-state flow rates and hydraulic heads in porous media were measured with different constant hydraulic heads from 170–230 cm. The steady-state flow rates were monitored using a cylinder with errors <2%. The water levels were measured with piezometric tubes with errors <0.5 mm.

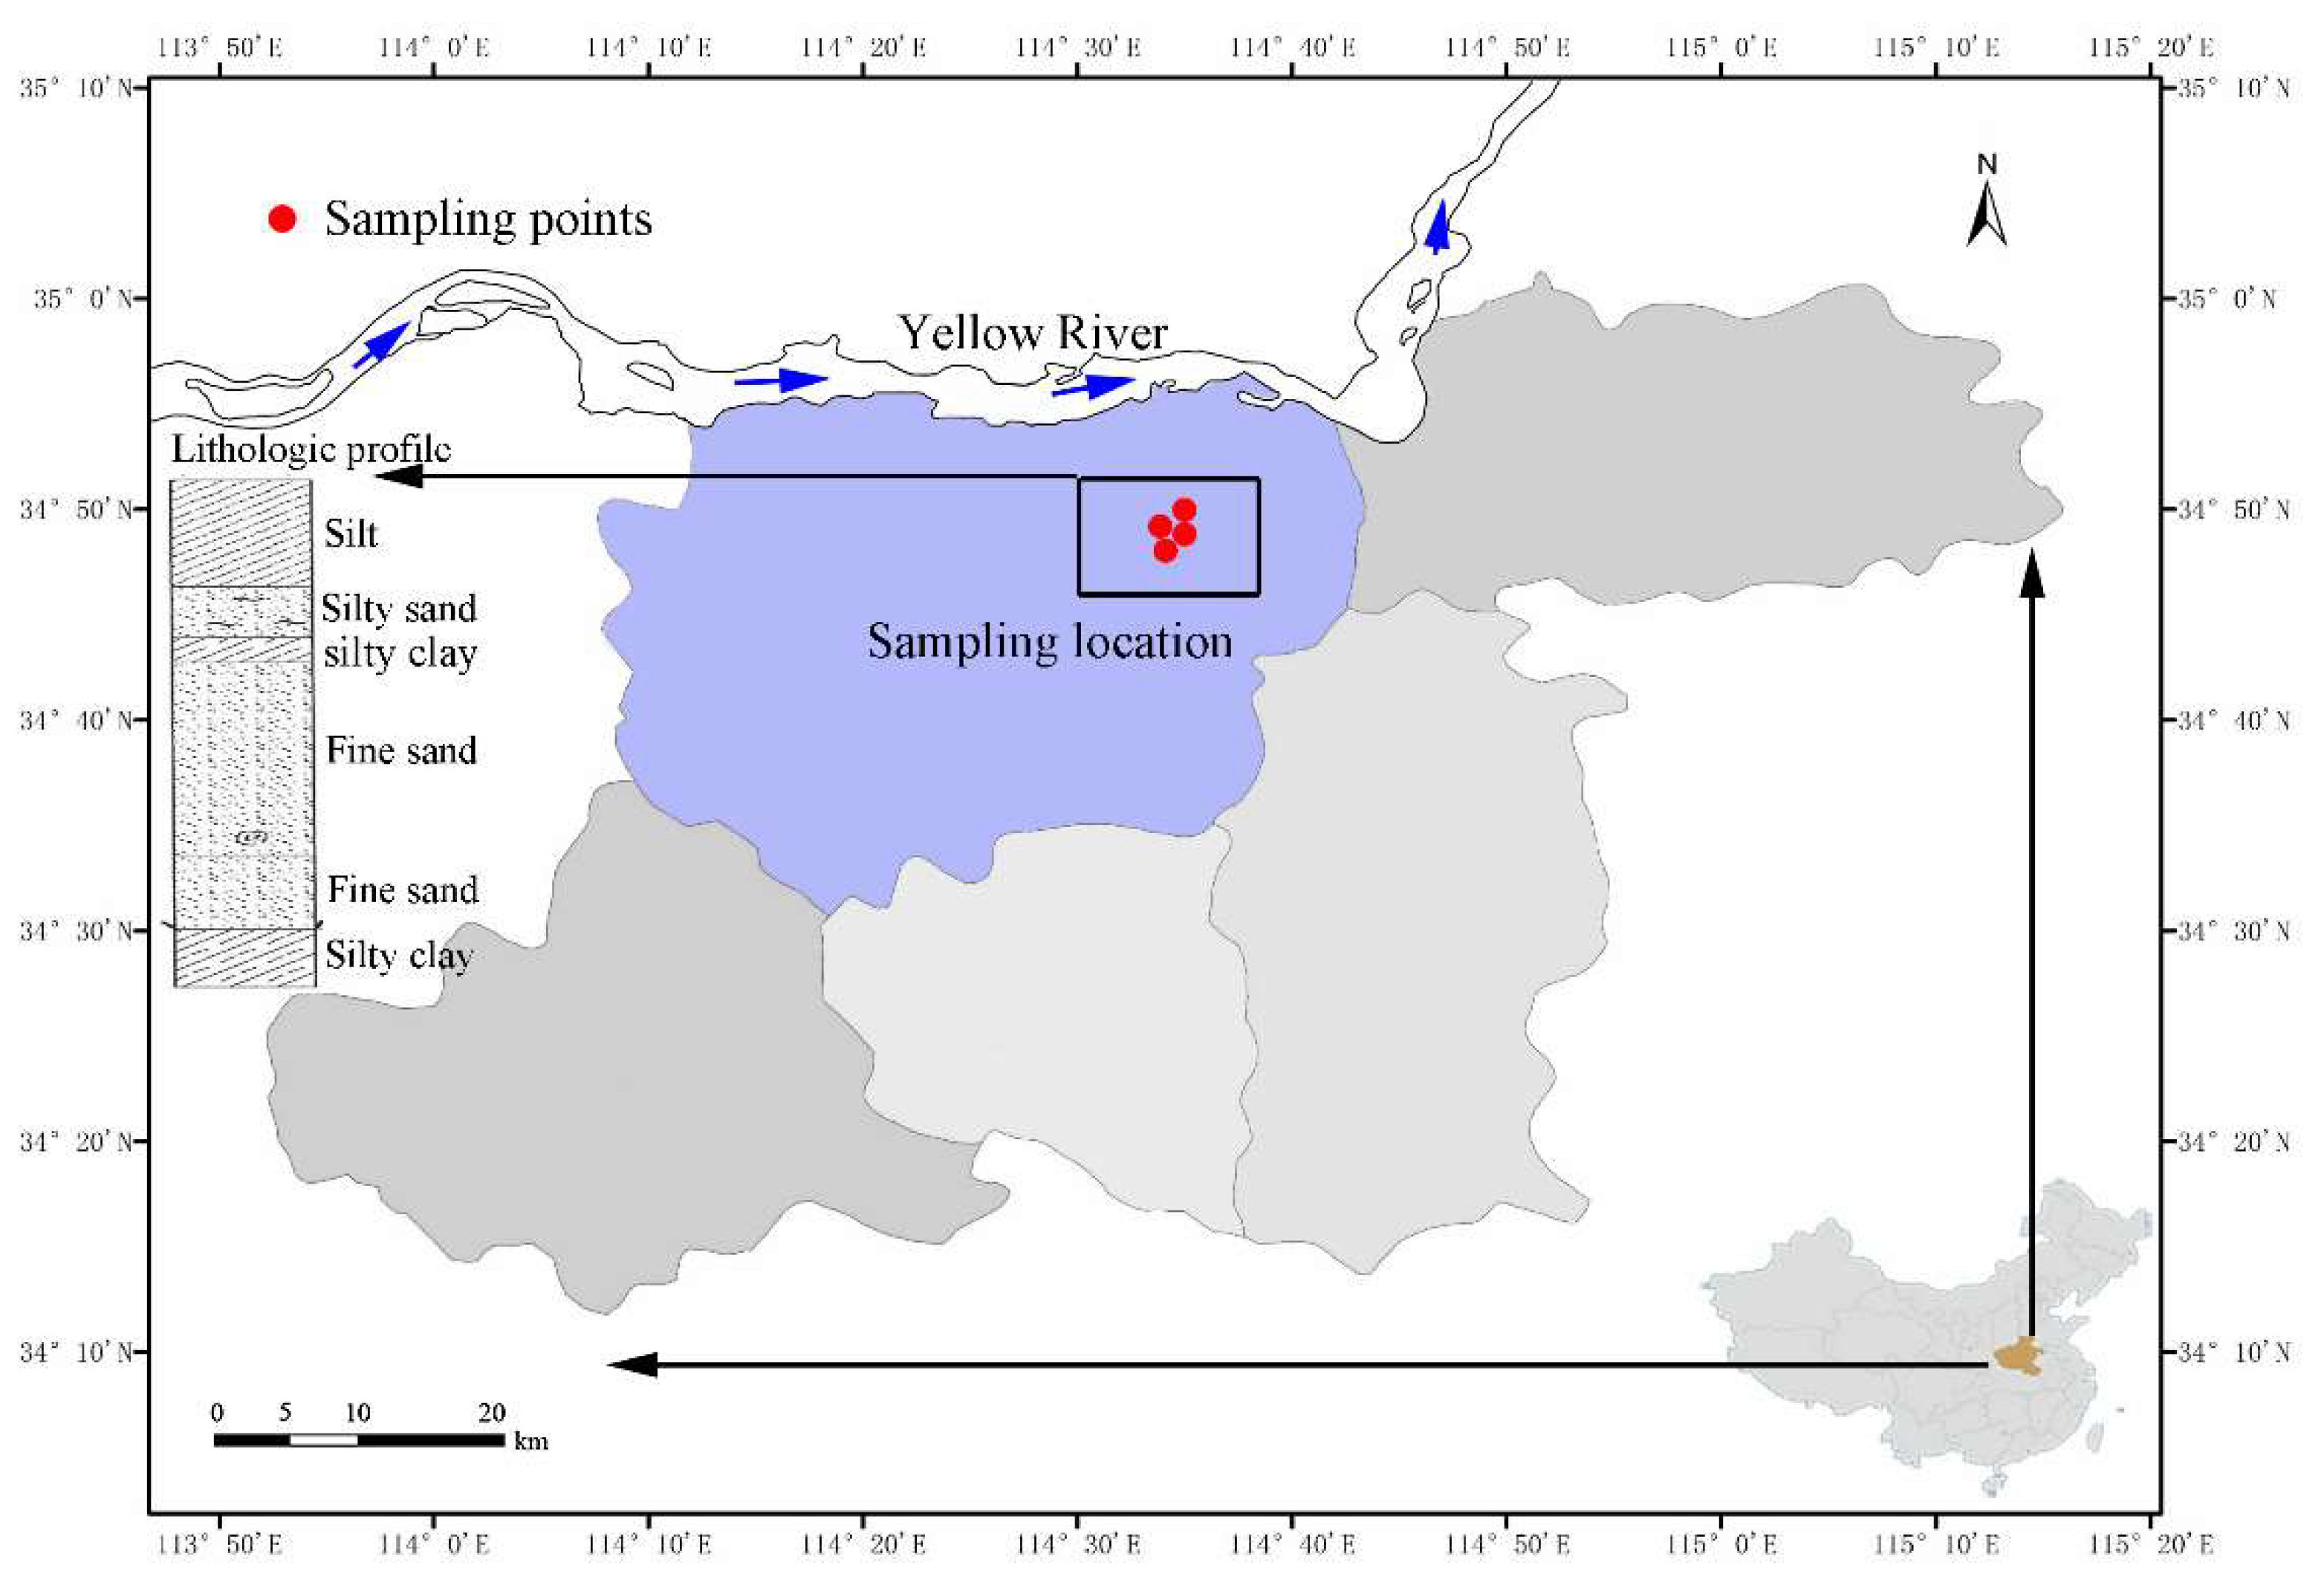
2.2. Experimental Media and Scheme

Four experimental media were selected and sampled in the field. All media were taken from the Yellow River alluvial plain in Henan province of China (Figure 2). Depending on lithology and sediment thickness, sampling depths ranged from 10–300 cm. During sampling, surface impurities were first removed, and a plexiglass pipe was inserted vertically into the soil layer. Special attentions should be paid to not destroy the sediment structure, and to pull out the pipe with a rubber plug in the high end. Subsequently, we used gauze mesh to wrap the lower end of the pipe and fixed it with an iron hoop. The geotechnical test result determined the four media (Table 1) as: (1) silty sand, (2) silt-I, (3) medium sand, and (4) silt-II (sample 2 is silt-I and sample 4 is silt-II).
Experiments were conducted in two groups with different constant hydraulic heads. Group A used the silty sand and silt-I, and the maximum hydraulic head difference was set as 170 cm. Group B used the medium sand and silt-II, and the maximum hydraulic head difference was set as 230 cm. Hydraulic head differences were adjusted and the corresponding discharge flow rates were measured by fixed volume (V) and fixed time (t). To avoid environmental effects, the laboratory temperature was kept near 25 °C during all experiments.

3. Results and Discussion

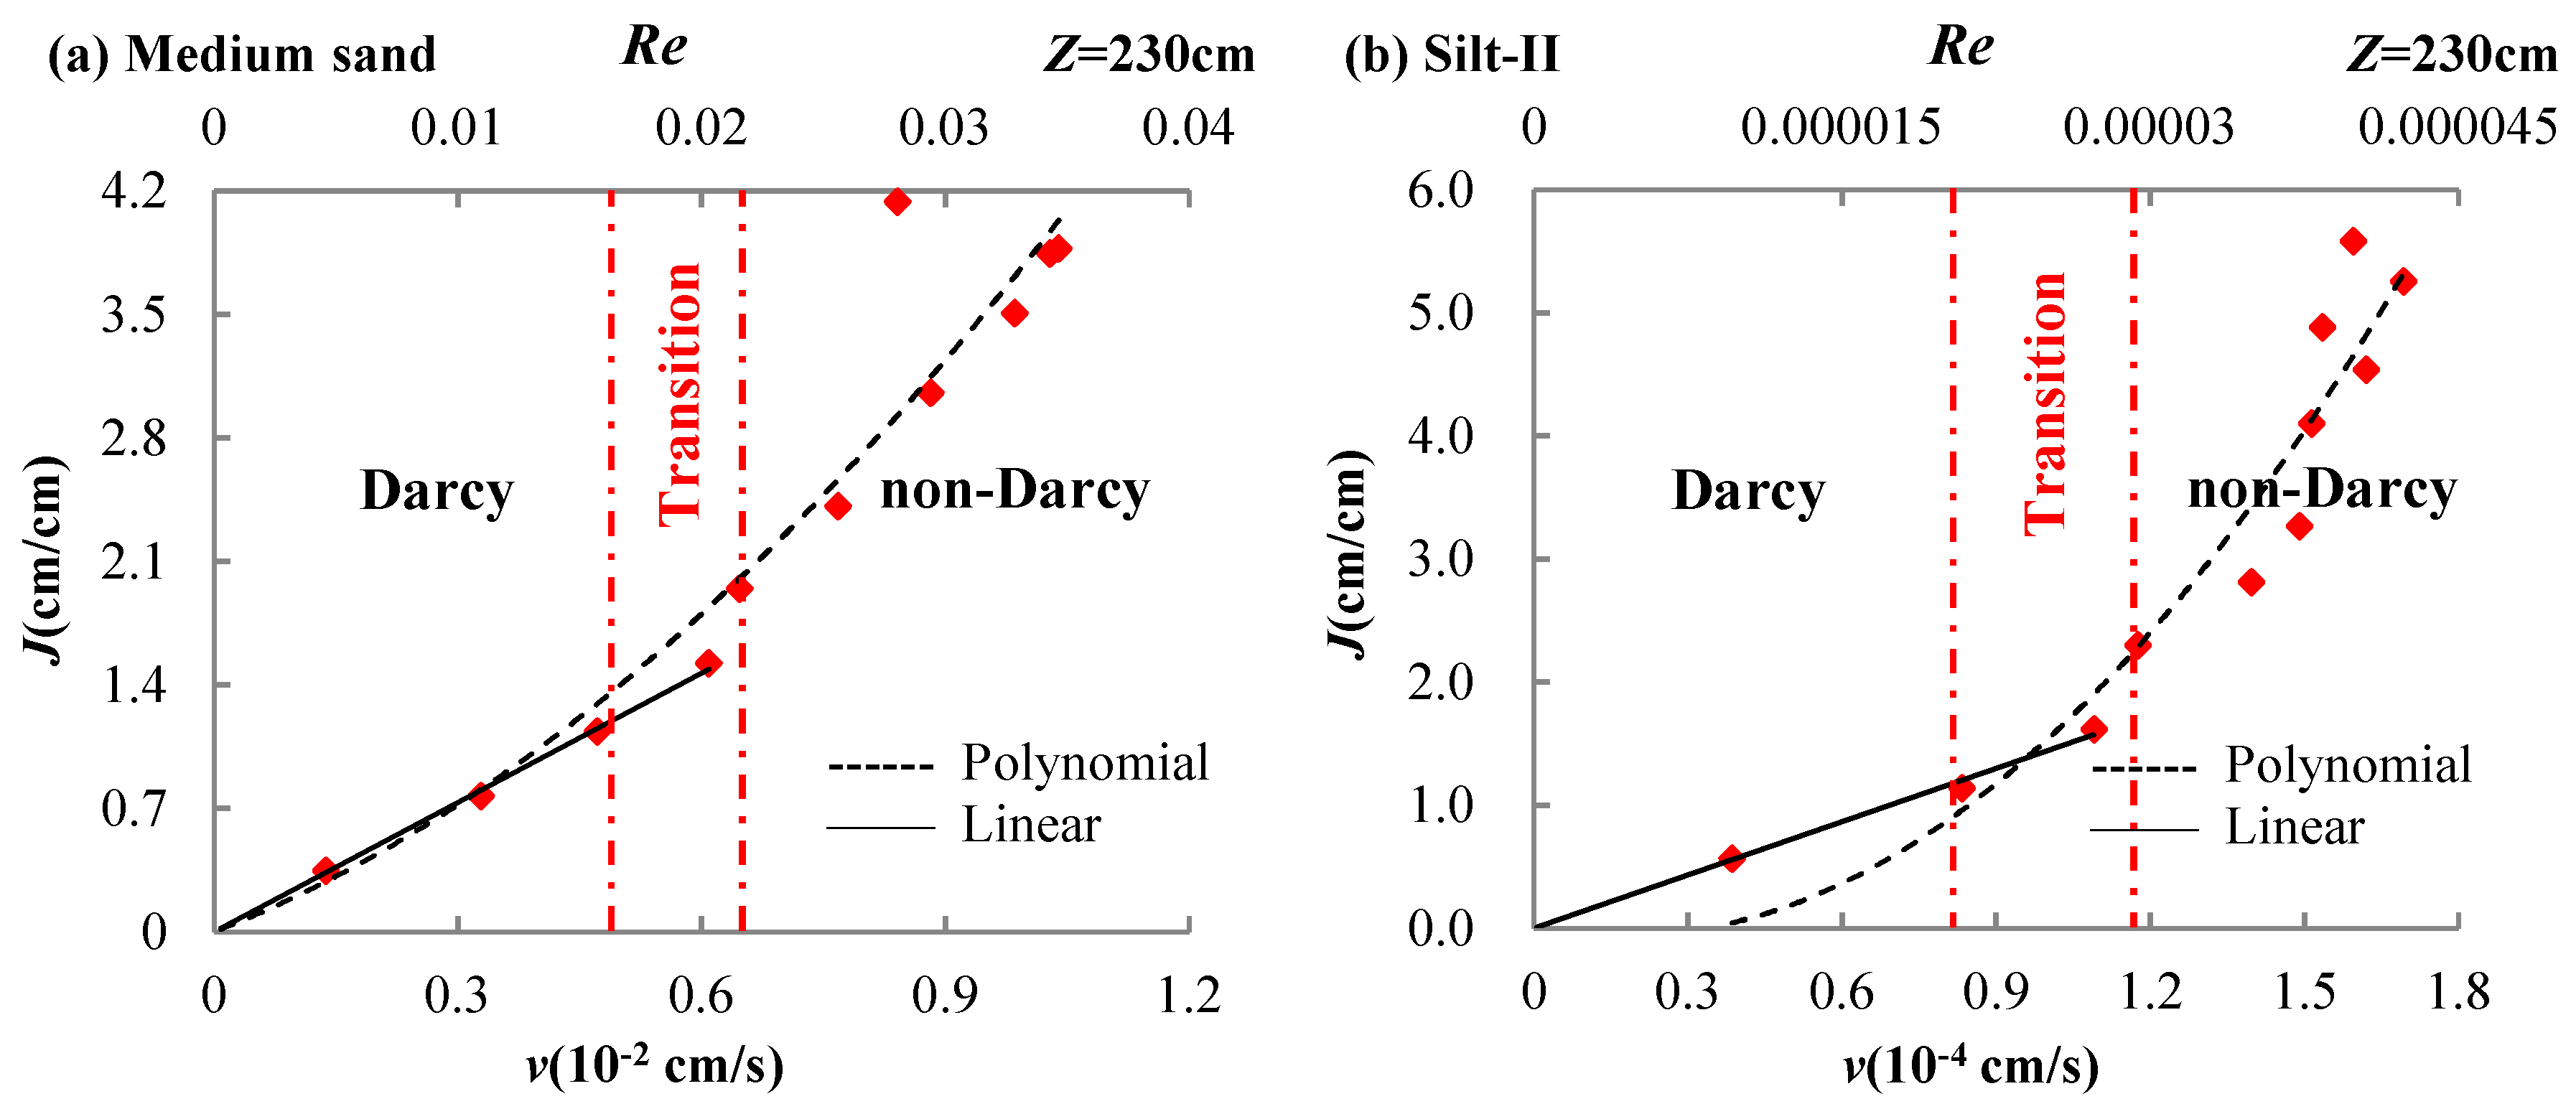
3.1. Reynolds Numbers of Experimental Media

Table 2 shows the average velocity (v) and hydraulic gradient (J, J = −dH/dL) obtained from the experiments. The average velocity increases monotonously with hydraulic gradient for silty sand and silt-I. As the hydraulic gradient increases to a certain value, however, the average velocity fluctuates or even decreases for medium sand and silt-II. In our experiment, the critical Re values mainly depended on particle size and average flow velocity. The hydraulic conductivity (K, K = v/J) values in this experiment are in the order of 10−3 cm/s, 10−4 cm/s, and 10−5–10−4 cm/s for the medium sand, silty sand, and silt (Kmedium sand > Ksilty sand > Ksilt), respectively. This result is in accordance with the empirical values of hydraulic conductivity for various soils. More importantly, Re values are less or much less than 1 (or close to 0) for the four media, with medium sand in the order of 10−2, silty sand in the order of 10−4, and silt in the order of 10−5–10−4.

3.2. Effect of Constant Hydraulic Head on Flow Regime and Hydraulic Conductivity

Reduction in apparent hydraulic conductivity is a key indicator for the deviation from Darcy’s law [8]. If the flow in porous media is linear at a low Re value, the ratio of the average velocity and hydraulic gradient (hereinafter referred to as v/J) should be a constant value according to Darcy’s law and should decrease gradually if the flow is nonlinear. At a constant hydraulic head of 170 cm, v/J is insensitive to J, which clearly delineates a hydraulic head at which Darcy’s law is valid (see Figure 3). When the constant hydraulic head is up to 230 cm, v/J begins to decrease with J, congruently marking the deviation from Darcy’s law. Since v/J changes with the constant hydraulic head, the constant hydraulic head is presumed to be an external factor that affects the transition from Darcy flow to non-Darcy flow. At the same time, it is also possible to preliminarily infer that the constant hydraulic head that affects the transition varies among the experimental media.
The flow regime changes from Darcy to non-Darcy as the constant hydraulic head changes from 170 cm to 230 cm, possibly due to the different hydrostatic pressures between the two groups (i.e., 60-cm hydraulic head difference). The experiment conducted by Yang et al. [39] has indicated that the permeability of media would be affected under the compaction of hydrostatic pressure. Moreover, as the constant hydraulic head increases, the internal inertial force would increase and gradually become dominant over the viscous force. The inertial force may result in the growth of pre-existing viscous eddies inside the pores and eventually lead to a characteristic reduction in the apparent hydraulic conductivity [8,37]. This conclusion may provide insights into recharge in the hydrothermal geothermal field.

3.3. Characteristics of the Flow in Porous Media with Weak Permeability at Low Reynolds Numbers (Re→0)

The relationships between velocity (v) and hydraulic gradient (J) are illustrated in Figure 4 for the four media. For the silty sand and silt-I, the average velocity shows a nearly perfect proportional relationship to J. For the medium sand, the experimental average velocity is smaller than the theoretical average velocity, which should linearly increase according to Darcy’s law. The R2 value of silt-II is 0.3130 (see Table 3), and most data points scattered far from the fitting line. In summary, as the flow rate increases, the flows in silty sand and silt-I appear to be Darcian, whereas flows in medium sand and silt-II tend to deviate from Darcy’s law.
In a porous medium, laminar, or turbulent flow is determined by the relationships between apparent velocity and hydraulic gradient as well as Re [9]. In this study, the Re values of silty sand, silt-I, medium sand, and silt-II are all less than or much less than 1, or close to 0 (Table 2). Bear concluded that the upper Re limit of Darcy’s law (based on average grainsize and velocity) varies between 1 and 10, and the breakdown of Darcy’s law occurs for flows with high Re values [30]. This conclusion is widely accepted in scientific research and engineering such as numerical simulation of groundwater and seepage of dykes and dams. However, based on our experiment the breakdown of Darcy’s law may also appear in low-permeability porous media at very low Re (Re→0), similar to numerical simulation results of a transition from linear Darcy flow at vanishing Re values and to a cubic transitional regime at low Re values [40]. Firdaouss et al. [41] analyzed data from experiments performed by other authors [42], who concluded that the deviation from Darcy’s law is in the range of vanishing Re values. Other investigators also showed the existence of non-linear states with the weak inertia regimes when 0 < Re < 1 [5,43].
Therefore, the relationship between the average velocity and hydraulic gradient may deviate from Darcy’s law in low-permeability porous media with very low Re values (Re→0). If Darcy’s flow is used in these cases for numerical simulation of groundwater and seepage of dykes and dams, errors may occur.

3.4. Upper Limit of the Validity of Darcy’s Law for Porous Media at Low Reynolds Numbers (Re→0)

By examining experiment of Jolls and Hanratty [44], Dybbs and Edwards [28] proposed that the observed gradual transition to unsteady flow did not yield any discontinuity in mass transfer. Chaudhary [37] once presented a figure in an article that the relationship curve for friction drag versus hydraulic gradient is smooth with no sharp limit between laminar flow and transition flow. It is currently well known that the transition from the Darcy flow regime to the Forchheimer regime is gradual and that no critical Re should exist [45].
From the fitting results of medium sand and silt-II (see Table 4 and Table 5), both flows are Darcy in the beginning and then turn to non-Darcy. During the gradual transition from Darcy to non-Darcy flow, Re values increase gradually and are all less than 1, with no abrupt turning points (Figure 5). On average, the flow is Darcy when Re < 0.015 for medium sand and Re < 0.000027 for silt-II. The flow is non-Darcy when Re > 0.020 for medium sand and Re > 0.000029 for silt-II. The transition regime is observed for medium sand at Re = 0.015–0.020 and for silt-II at Re = 0.000027–0.000029. This again verifies that the critical Re value does not exist.
As no clear demarcation exists, separation between flow regimes is represented by Re range [46]. The transition from Darcy to non-Darcy flow occurs at different Re ranges for medium sand (0.015–0.020) and silt-II (0.000027–0.000029). Our experiment shows that the upper Re limit of Darcy’s law is infinitely close to 0, which is inconsistent with Bear’s conclusion showing that flow regime changes at Re values between 1 and 10. Previous studies claimed that Darcy’s law might fail at Re values from 0.01 to 1000. However, we demonstrate that flows can deviate from Darcian at any Re values depending on the type of media. Fourar et al. [47] reported that the Forchheimer equation was a good approximation for describing flows with high Re values (i.e., non-Darcy flow regimes). Based on our study, it is also a good approximation for describing non-Darcy flows with very low Re values (Re→0).

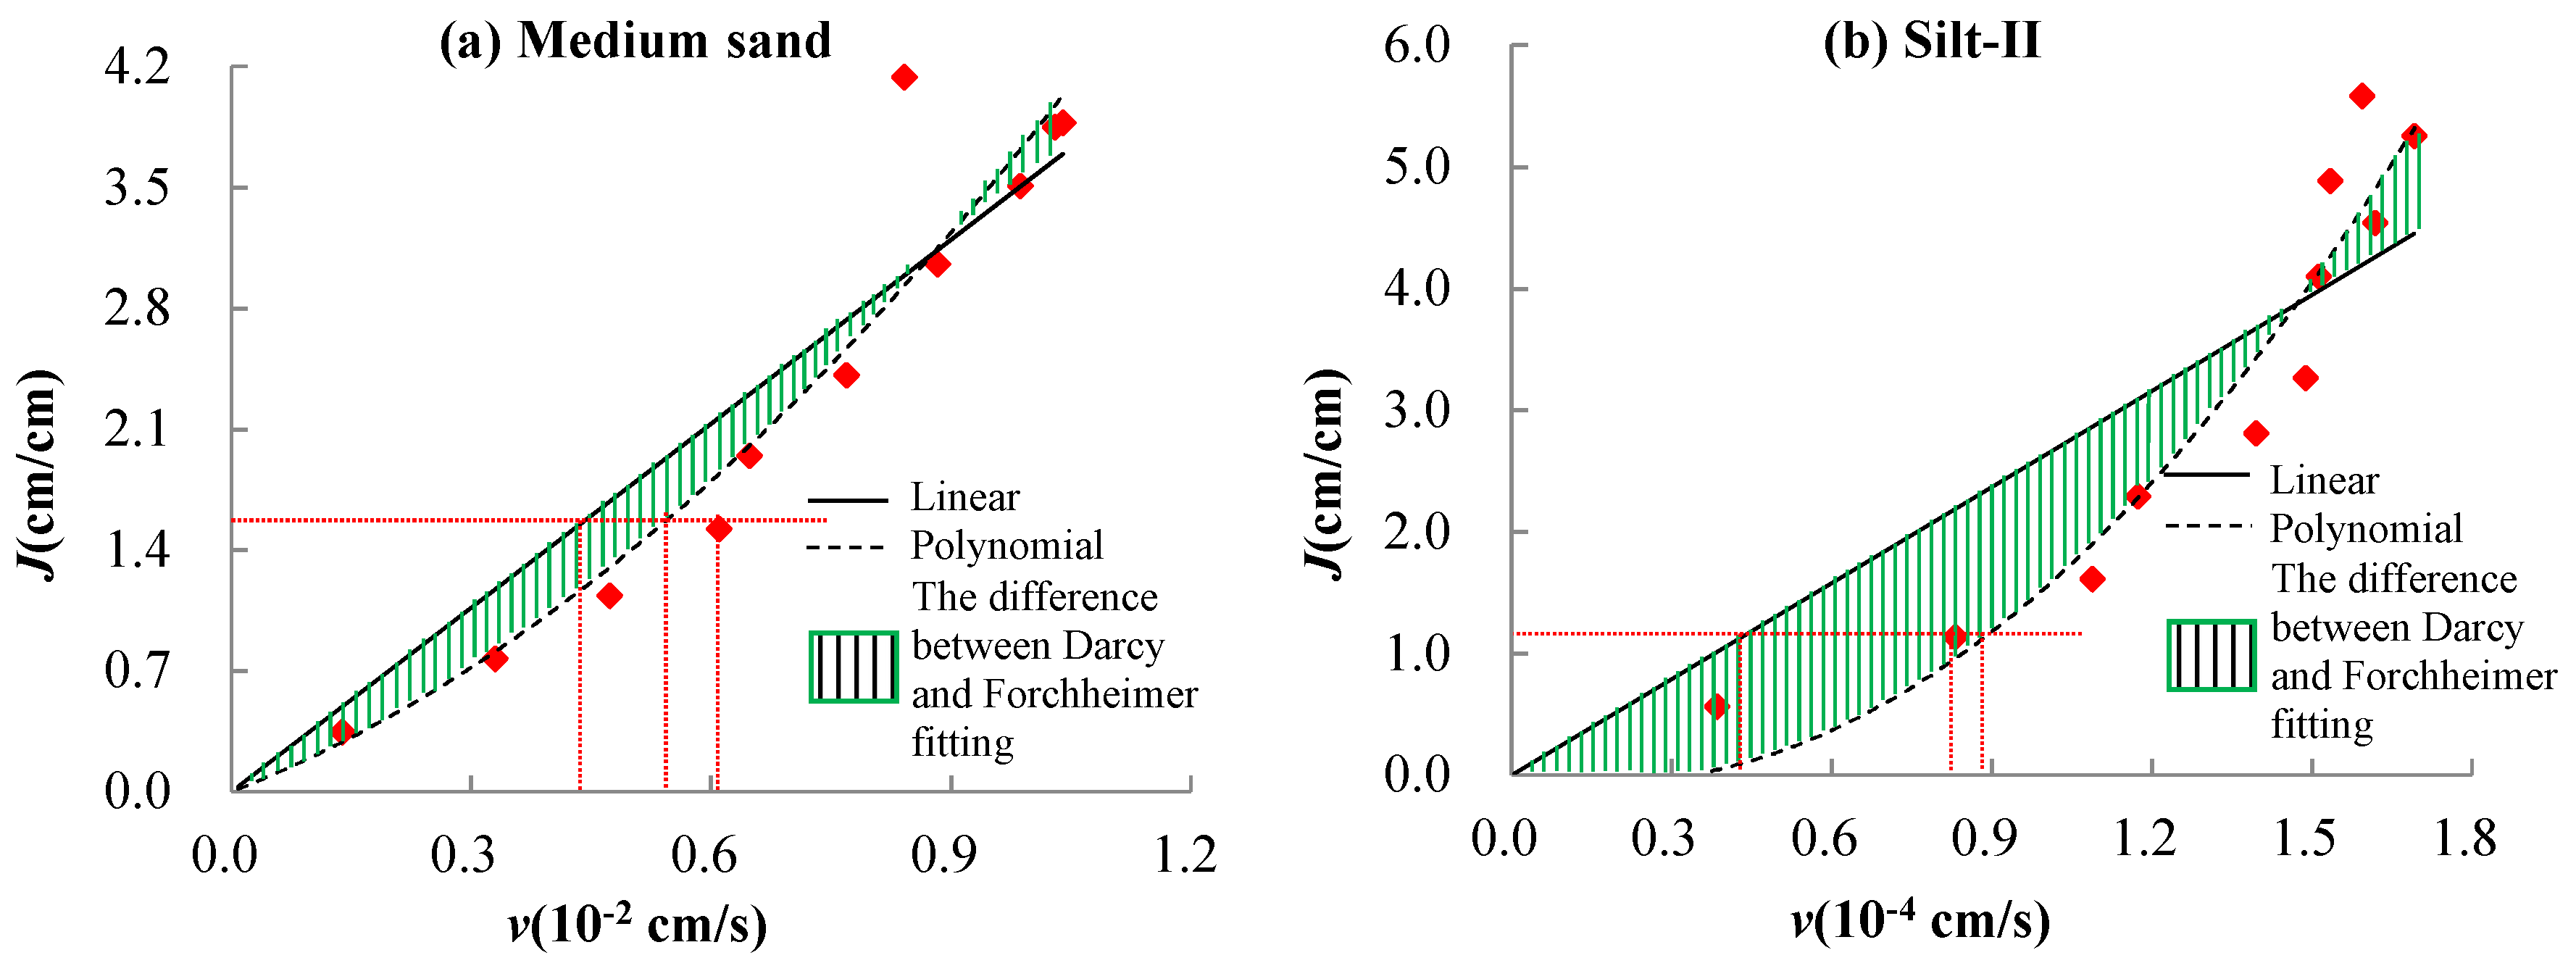
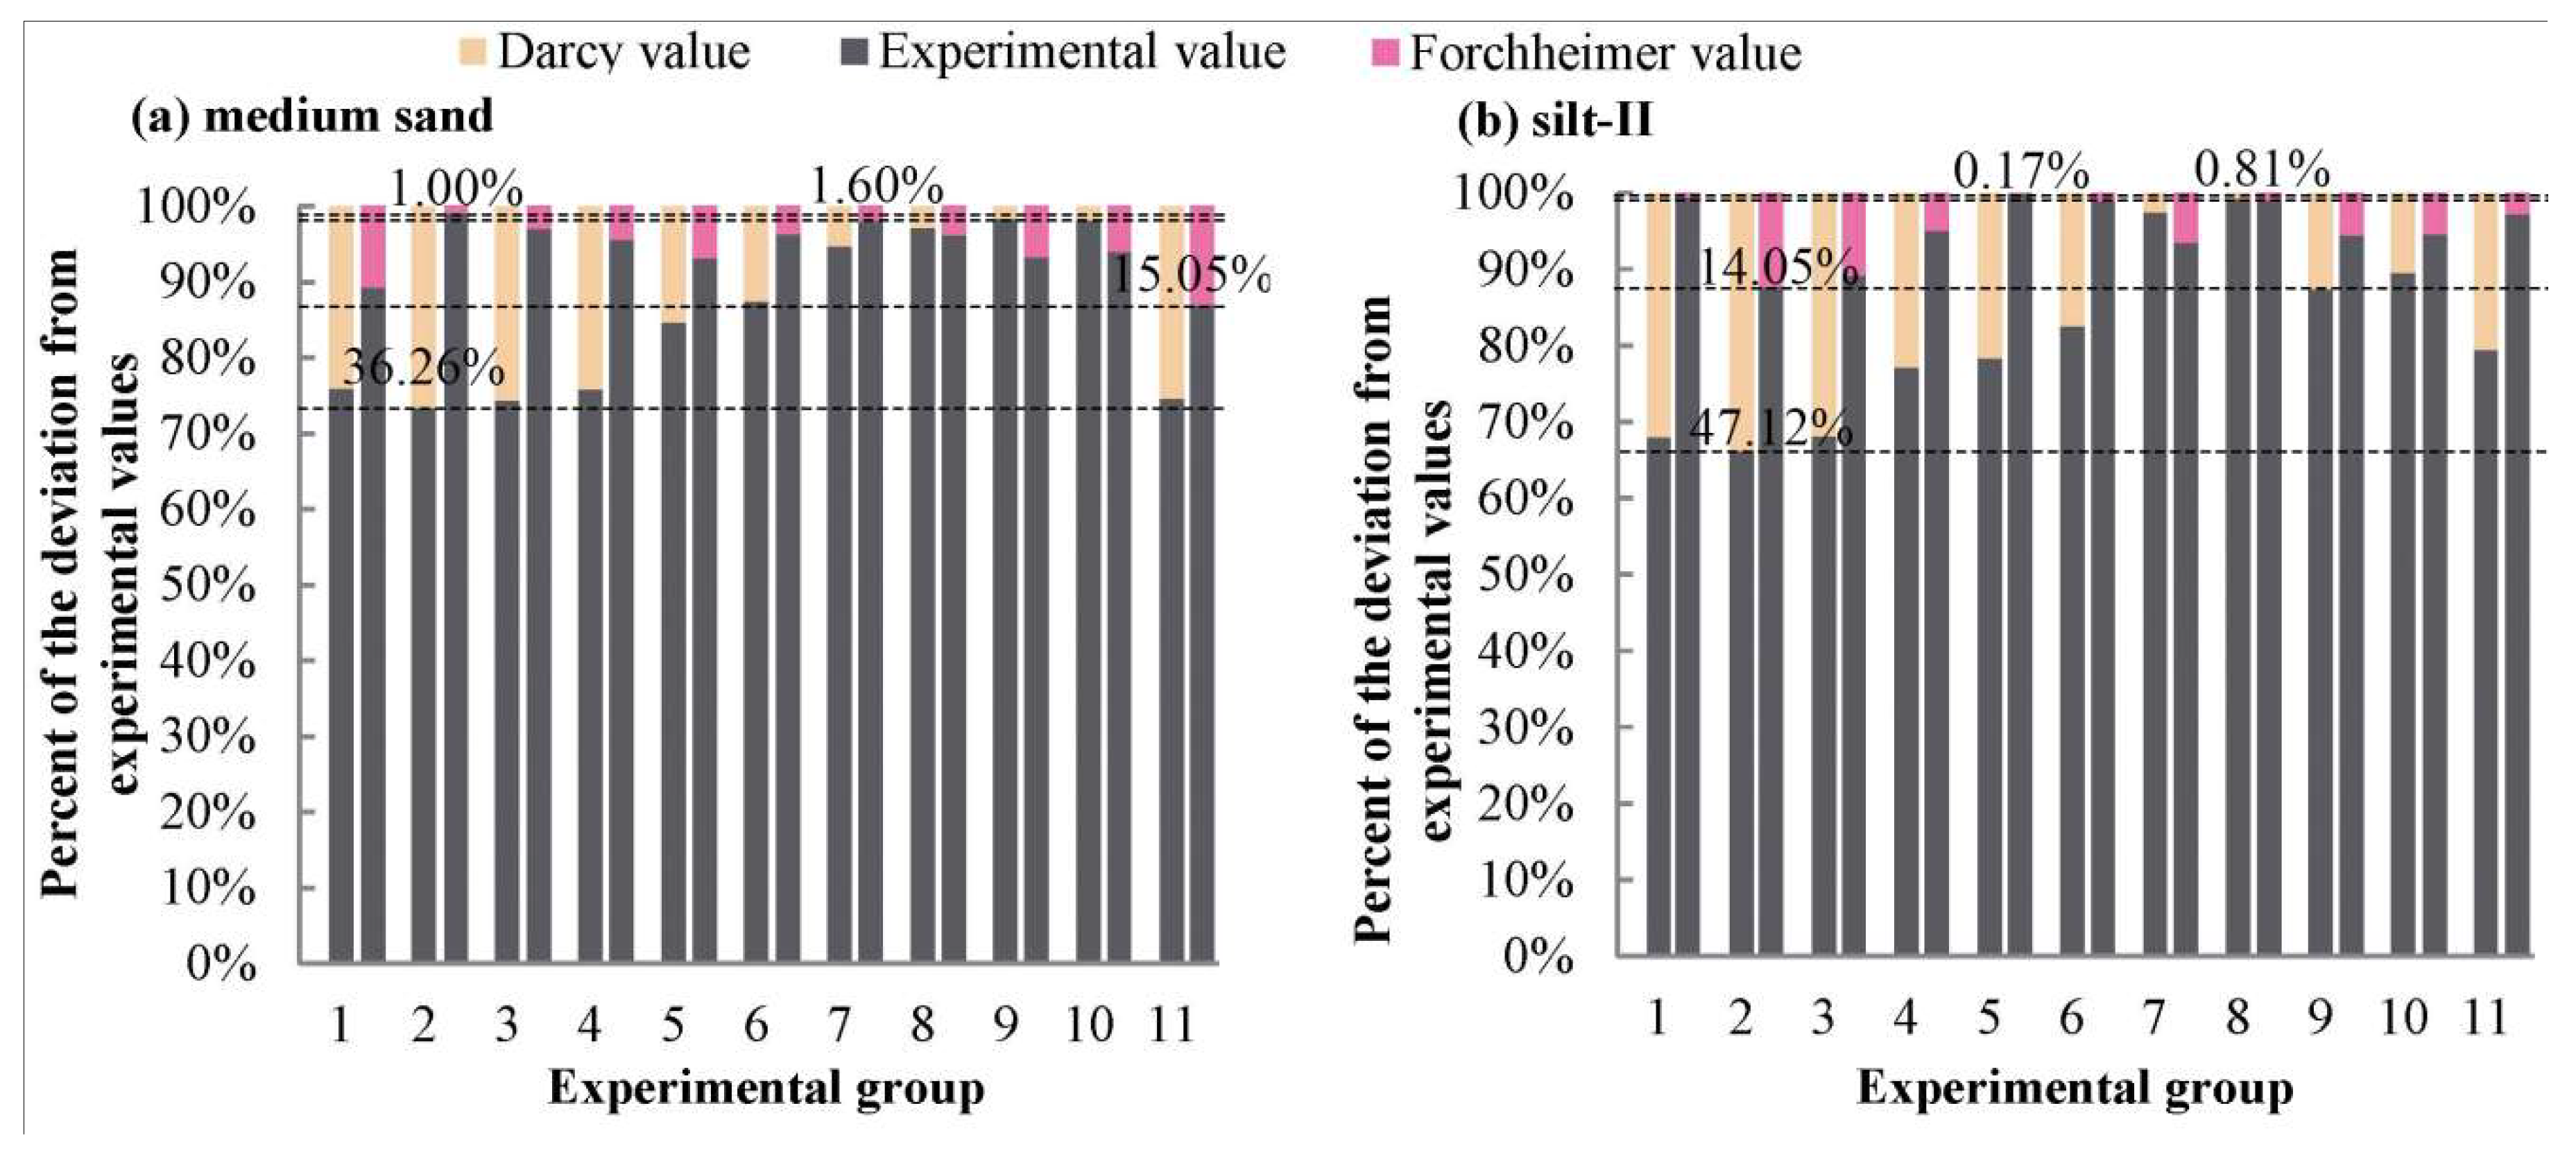
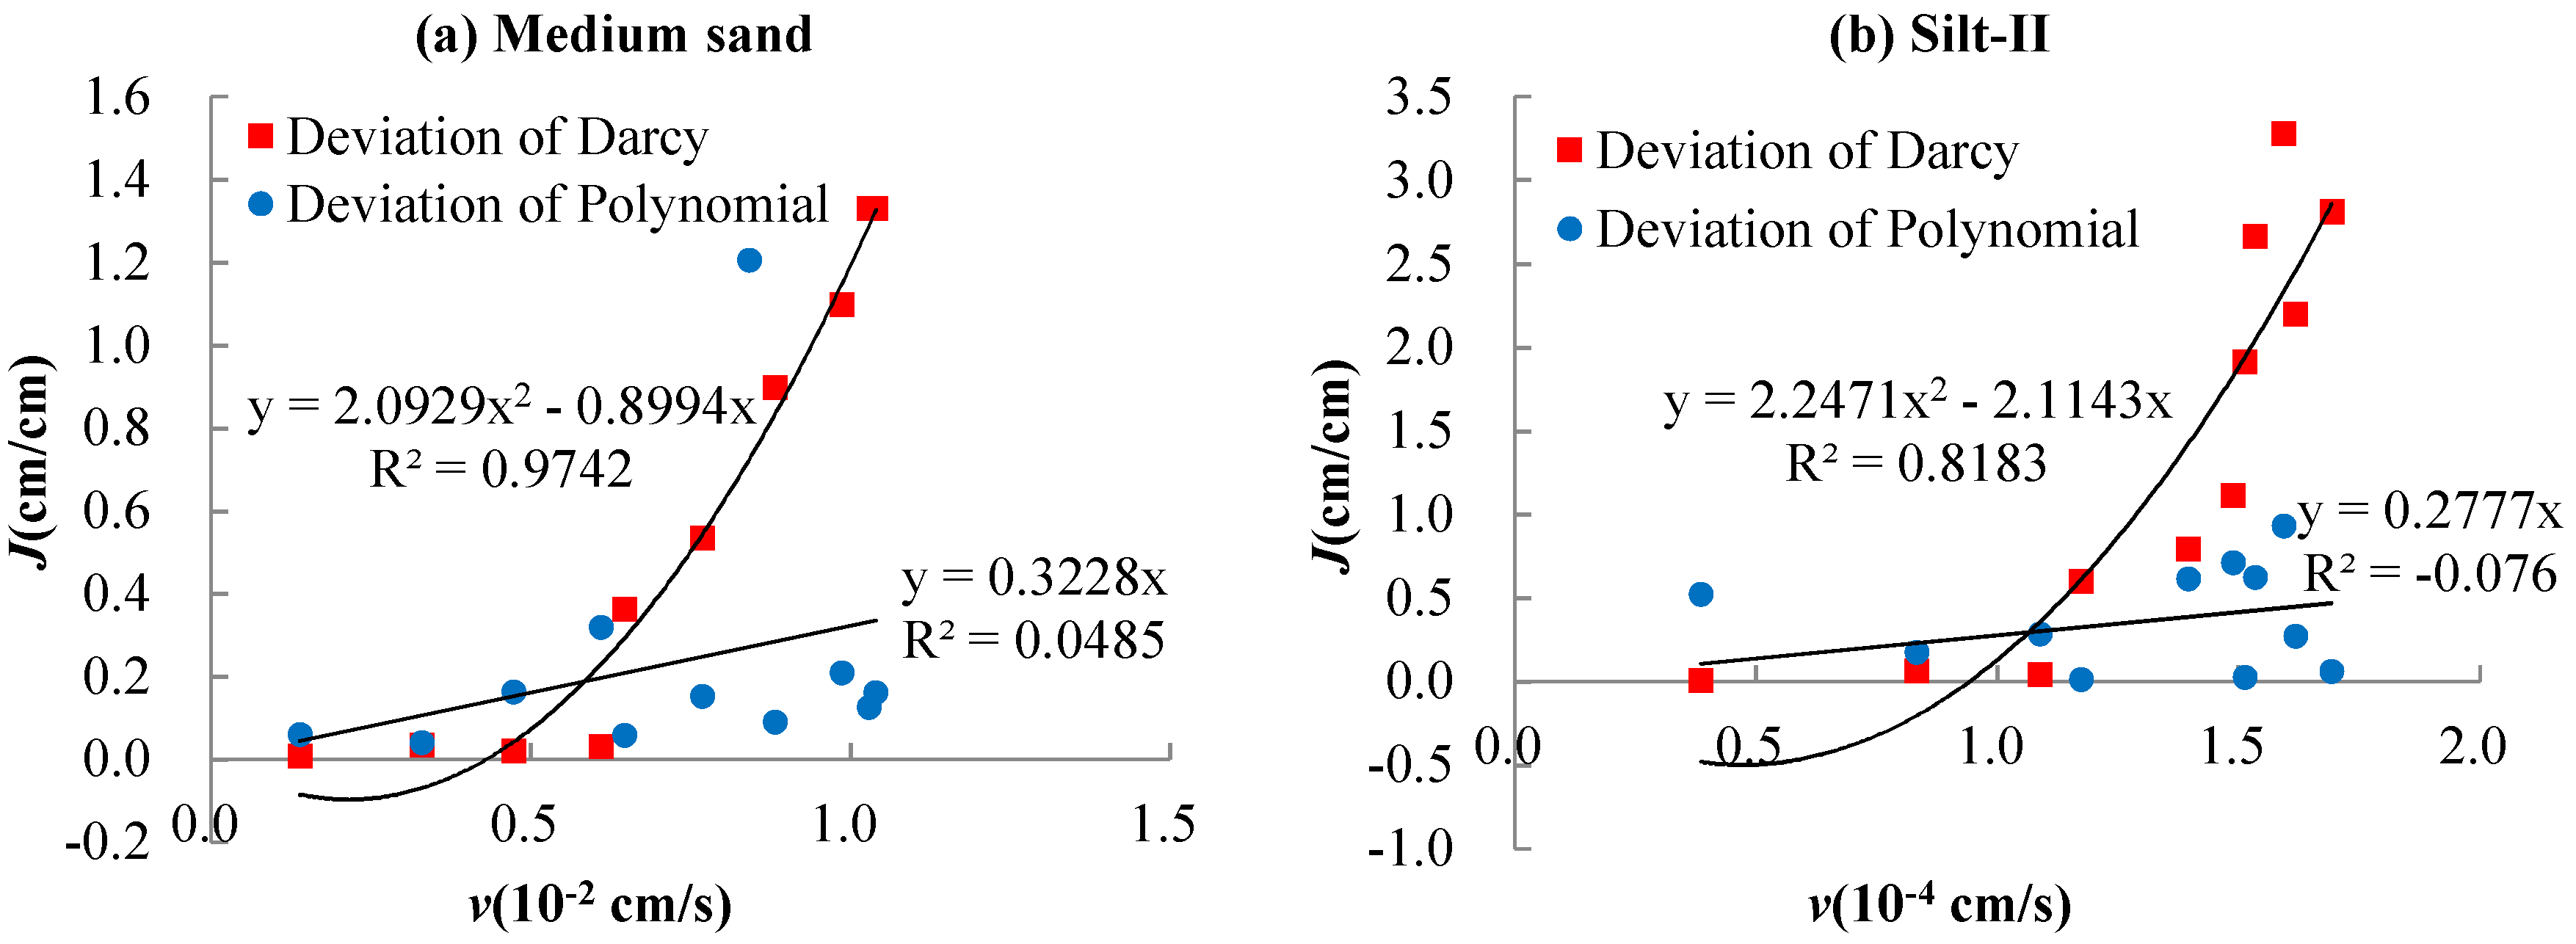
3.5. Error Analysis on Darcy’s Law and Forchheimer Equation in Non-Darcy Flow

As mentioned above, flows in both medium sand and silt-II are non-Darcy under the constant hydraulic head of 230 cm (Figure 5). Figure 6 further shows the schematic diagram of the difference between Darcy (linear) and Forchheimer (polynomial) fitting. As expected, results indicate that the Forchheimer fitting is distinctly close to the experimental values than the Darcy fitting. Considerable differences can be observed from the two fitting curves (i.e., the shadow area).
To analyze the error between Darcy’s law and non-Darcy flow (Figure 6), the deviation ratio of medium sand and silt-II is calculated, by using a deviation Δ v defined as follows:
Δ v = | v e x p e r i m e n t a l   v a l u e v f i t t i n g   v a l u e   |
With Equation (4), the relative deviation (i.e., Δ v / v experimental   value ) can be obtained.
Figure 7 shows the comparison of Darcy’s law fitting and Forchheimer fitting. The relative deviation values are 1.6%–36.3% (linear), higher than 1.0%–15.1% (nonlinear) for the medium sand. The relative deviation values are 0.8%–47.1% (linear), higher than 0.2%–14.1% (nonlinear) for the silt-II. It is therefore concluded that large differences exist between results fitted by Darcy’s law and the experimental values (Figure 7). Darcy’s law cannot be used to calculate non-Darcy’s flows, otherwise unpredictable errors may occur. It is noteworthy that although the linear fitting and the corresponding slope will change slightly with the increasing experiments (see Figure 6), they cannot produce large impacts on the current conclusions. This follows the fact that the current datasets are somewhat sufficient to represent the relationships between v and J.
Figure 8 shows the relationship between the average velocity and the error resulting from Darcy’s law fitting. For both medium sand and Silt-II, the relationships can be well fitted by quadratic polynomials. The R2 value is up to 0.97 for the medium sand and is up to 0.82 for the silt-II (Figure 8). However, there is no obvious correlation between the average velocity and the error resulting from polynomial fitting. The result presented here indicates that the correction of Darcy’s law should be a quadratic term related to the average velocity, which is consistent with previous results [41].

3.6. Limitations, Uncertainties, and Future Work

It must be kept in mind that the experimental media used in this experiment were all taken within 300 cm below surface ground of the Yellow River alluvial plain. Geotechnical test results show that the media contain more powder and sand particles and less clay, and the samples are uniform and loose. Although the samples are naturally compacted, they are different in pore structure and cementation degree from actual thermal reservoirs. In addition, there are also differences between the experimental flow and actual engineering flows. Therefore, we should be aware that conclusions drawn in this paper apply to typical shallow geological structures rather than other geologically complex regions. It is noted that Re values in this study are distinctly lower than that in other studies (Table 6). Therefore, the current study is an important attempt to extend previous studies regarding low Re values and associated relationship with the flow characteristics in low-permeability porous media (see Table 6). Different Re ranges are likely needed to explicitly describe the beginning of non-Darcy flow for different porous media, not only from 1 to 10 or other value for all media. This is similar to previous conclusions that media-dependent functional forms are needed to represent non-Darcy flows [37]. In the future, more samples will be selected to further validate our results
Findings from our experiments provide an important basis for the selection of parameters such as in the recharge process of hydrothermal geothermal field. For example, the velocity decreases gradually after reaching a certain extent due to high hydrostatic pressure compaction. Inferred from this point, hydrothermal geothermal fields should not blindly pursue large-flow recharge during the actual tailwater recharge process. A proper solution is to increase the number of recharge wells and recharge different wells in different time periods so as to ensure the long-term and effective utilization of wells. The main results also offer insights into flows in low-permeability reservoirs, pumping process of foundation pit excavation and other non-Darcy flows in low-permeability media [45,50,51,52]. Our future work will consider new methods in combination with more scenarios based on our current study.

4. Summary and Conclusions

Improving understanding of natural flows in porous media has significant implications for many science and engineering applications. The current study is expected to extend previous researches by providing more details regarding the flow characteristics in porous media at low Reynolds numbers. In this work, data from a laboratory column experiment was used to investigate the flow in typical porous media (two silts, silty sand, and medium sand). This paper presented the experimental results and provided some new insight into flows in low-permeability media.
Experimental results show that the flow regime changes from Darcy to non-Darcy flow with the increasing constant hydraulic head (i.e., from 170 cm to 230 cm). That is, the constant hydraulic head is likely to affect the flow regime in the selected media. It is expected that the experimental media may play a critical role in affecting the constant hydraulic head that affects the transition between Darcy and non-Darcy flow. The reason can be attributable to the high hydrostatic pressure that affects the compaction of the media and, consequently, influences the internal inertial force. In addition, we again verified that the critical Reynolds number does not exist, and the flow regimes are quantified by Reynolds number ranges. Under the condition of constant hydraulic heads, the transition from Darcy to non-Darcy flow is observed when Re = 0.015–0.020 for medium sand and Re = 0.000027–0.000029 for silt-II, demonstrating that the breakdown of Darcy’s law occurred in flows with low Reynolds numbers (Re→0). The results also show that the flow deviates from Darcian flow with the values of Re in different ranges, not only from 1 to 10 or other value for all media, mainly depending on the experimental media. The Forchheimer equation is a reasonable approximation for describing non-Darcy flow in porous media at low Reynolds numbers (Re→0); however, the second-order term cannot be neglected. These findings provide useful guidance for future water resource estimation, theoretical development, and model applications.

Author Contributions

Conceptualization, G.Z.; methodology, N.C.; data curation, Y.X.; writing—original draft preparation, L.W.; writing—review and editing, Y.L.

Funding

This research was funded by the National Natural Science Foundation of China (Grant no. 41372260, grant no. 41402224 and grant no. 41771037) and the Youth Innovation Promotion Association of the CAS (Y9CJH01001).

Conflicts of Interest

The authors declare no conflicts of interest.

References

  1. Childs, E.C.; Collis-George, N. The permeability of porous materials. Proc. R. Soc. Lond. Ser. A Math. Phys. Sci. 1950, 201, 392–405. [Google Scholar] [Green Version]
  2. Philip, J.R. The theory of infiltration: 1. The infiltration equation and its solution. Soil Sci. 1957, 83, 345–358. [Google Scholar] [CrossRef]
  3. Lin, H.Z.; Peng, J.B.; Yang, H.; Jia, S.L. A simple estimation approach for the saturated permeability of loess in field by a double-ring infiltrometer. Adv. Water Sci. 2017, 28, 523–533. [Google Scholar]
  4. Chen, C.X.; Lin, M. Groundwater Dynamics; China University of Geosciences Press: Wuhan, China, 1999; p. 3. [Google Scholar]
  5. Wan, J.W.; Huang, K.; Chen, C.X. Reassessing Darcy’s law on Water in Porous Media. Earth Sci. J. China Univ. Geosci. 2013, 38, 1327–1330. [Google Scholar]
  6. Darcy, H. Les Fontaines Publiques de la Ville de Dijon. Librairie des Corps Imperiaux des Ponts et Chaussees et des Mines, Paris. 1856. Available online: https://gallica.bnf.fr/ark:/12148/bpt6k624312.image (accessed on 5 November 2019).
  7. Brown, G.O. Henry Darcy and the making of a law. Water Resour. Res. 2002, 38, 11-1-11-12. [Google Scholar] [CrossRef]
  8. Chaudhary, K.; Cardenas, M.B.; Deng, W.; Bennett, P.C. The role of eddies inside pores in the transition from Darcy to Forchheimer flows. Geophys. Res. Lett. 2011, 38. [Google Scholar] [CrossRef]
  9. Yamada, H.; Nakamura, F.; Watanabe, Y.; Murakami, M.; Nogami, T. Measuring hydraulic permeability in a streambed using the packer test. Hydrol. Process. 2005, 19, 2507–2524. [Google Scholar] [CrossRef]
  10. Dupuit, J. Études théoriques et pratiques sur le mouvement des eaux; Dunod: Paris, France, 1863. [Google Scholar]
  11. Forchheimer, P. Wasserbewegung durch boden. Z. Ver. Dtsch. Ing. 1901, 45, 1782–1788. [Google Scholar]
  12. Muskat, M. The Flow of Homogeneous Fluids through Porous Media; No. 532.5 M88; The Mapple Press Company: York, PA, USA, 1946. [Google Scholar]
  13. Izbash, S.V. O Filtracii V Kropnozernstom Materiale; USSR: Leningrad, Russia, 1931. (In Russian) [Google Scholar]
  14. Brinkman, H.C. A calculation of the viscous force exerted by a flowing fluid on a dense swarm of particles. Flow Turbul. Combust. 1949, 1, 27. [Google Scholar] [CrossRef]
  15. Ergun, S. Fluid flow through packed columns. Chem. Eng. Prog. 1952, 48, 89–94. [Google Scholar]
  16. Schneebeli, G. Expériences sur la limite de validité de la loi de Darcy et l’apparition de la turbulence dans un écoulement de filtration. La Houille Blanche 1955, 2, 141–149. [Google Scholar] [CrossRef]
  17. Irmay, S. On the theoretical derivation of Darcy and Forchheimer equations. Eos Trans. Am. Geophys. Union 1958, 39, 702–707. [Google Scholar] [CrossRef]
  18. Bachmat, Y. Basic transport coefficients as aquifer characteristics. In Proceedings of the IASH Symposium Hydrology of Fractured Rocks, Paris, France, 20 August 1965. [Google Scholar]
  19. Scheidegger, A. The Physics of Flow through Porous Media; University of Toronto Press: London, UK, 1958. [Google Scholar]
  20. Berkowitz, B. Boundary conditions along permeable fracture walls: Influence on flow and conductivity. Water Resour. Res. 1989, 25, 1919–1922. [Google Scholar] [CrossRef]
  21. Lee, S.L.; Yang, J.H. Modeling of Darcy—Forchheimer drag for fluid flow across a bank of circular cylinders. Int. J. Heat Mass Transf. 1997, 40, 3149–3155. [Google Scholar] [CrossRef]
  22. Comiti, J.; Renaud, M. A new model for determining mean structure parameters of fixed beds from pressure drop measurements: Application to packed beds with parallepipedal particles. Chem. Eng. Sci. 1989, 44, 1539–1545. [Google Scholar] [CrossRef]
  23. Fancher, G.H.; Lewis, J.A. Flow of simple fluids through porous materials. Ind. Eng. Chem. 1933, 25, 1139–1147. [Google Scholar] [CrossRef]
  24. Zeng, Z.; Grigg, R. A criterion for non-Darcy flow in porous media. Transp. Porous Media 2006, 63, 57–69. [Google Scholar] [CrossRef]
  25. Huang, K.; Wan, J.W.; Chen, C.X.; He, L.Q.; Mei, W.B.; Zhang, M.Y. Experimental investigation on water flow in cubic arrays of spheres. J. Hydrol. 2013, 492, 61–68. [Google Scholar] [CrossRef]
  26. Andrade, J.S.; Costa, U.M.S.; Almeida, M.P.; Makse, H.A.; Stanley, H.E. Inertial effects on fluid flow through disordered porous media. Phys. Rev. Lett. 1999, 82, 5249. [Google Scholar] [CrossRef]
  27. Li, J.; Huang, G.H.; Wen, Z.; Zhan, H.B. Experimental study on non-Darcian flow in two kinds of media with different diameters. Chin. J. Hydraul. Eng. 2008, 39, 726–732. [Google Scholar]
  28. Dybbs, A.; Edwards, R.V. A New Look at Porous Media Fluid Mechanics—Darcy to Turbulent. In Fundamentals of Transport Phenomena in Porous Media; Springer: Dordrecht, The ‎Netherlands, 1984; pp. 199–256. [Google Scholar]
  29. Sedghi-Asl, M.; Rahimi, H.; Salehi, R. Non-Darcy flow of water through a packed column test. Transp. Porous Media 2014, 101, 215–227. [Google Scholar] [CrossRef]
  30. Bear, J. Dynamics of Fluids in Porous Media; American Elsevier: New York, NY, USA, 1972; pp. 125–129. [Google Scholar]
  31. Leonalds, G. Foundation Engineering; McGraw-Hill: New York, NY, USA, 1962; pp. 124–127. [Google Scholar]
  32. Schneebeli, G. Hydraulique Souterraine; No. BOOK; Eyrolles: Paris, France, 1966. [Google Scholar]
  33. Xu, K.; Lei, X.; Meng, Q.; Liang, P. Study of non-Darcy seepage fields of rockfill dams. Chin. Rock Soil Mech. 2011, 32, 562–567. [Google Scholar]
  34. Reynolds, A.M.; Reavell, S.V.; Harral, B.B. Flow and dispersion through a close-packed fixed bed of spheres. Phys. Rev. E 2000, 62, 3632. [Google Scholar] [CrossRef] [PubMed]
  35. Hill, R.J.; Koch, D.L.; Ladd, A.J. The first effects of fluid inertia on flows in ordered and random arrays of spheres. J. Fluid Mech. 2001, 448, 213–241. [Google Scholar] [CrossRef]
  36. Hill, R.J.; Koch, D.L.; Ladd, A.J. Moderate-Reynolds-number flows in ordered and random arrays of spheres. J. Fluid Mech. 2001, 448, 243–278. [Google Scholar] [CrossRef]
  37. Chaudhary, K.; Cardenas, M.B.; Deng, W.; Bennett, P.C. Pore geometry effects on intrapore viscous to inertial flows and on effective hydraulic parameters. Water Resour. Res. 2013, 49, 1149–1162. [Google Scholar] [CrossRef]
  38. Zhang, Z.S.; Cui, G.X. Fluid Dynamics, 3rd ed.; Tsinghua University Press: Beijing, China, 2015. [Google Scholar]
  39. Yang, F.J.; Hu, D.W.; Tian, Z.B.; Zhou, H. Evolution and Mechanism of Permeability of Unconsolidated Sandstone under the Compaction of a High Hydrostatic Pressure. Rock Soil Mech. 2020, 41, 1–12. [Google Scholar]
  40. Rojas, S.; Koplik, J. Nonlinear flow in porous media. Phys. Rev. E 1998, 58, 4776–4782. [Google Scholar] [CrossRef]
  41. Firdaouss, M.; Guermond, J.L.; Le Quéré, P. Nonlinear corrections to Darcy’s law at low Reynolds numbers. J. Fluid Mech. 1997, 343, 331–350. [Google Scholar] [CrossRef]
  42. Hazen, A. The Filtration of Public Water-Supplies; John Wiley & Sons: Hoboken, NJ, USA, 1895. [Google Scholar]
  43. Panfilov, M.; Fourar, M. Physical splitting of nonlinear effects in high-velocity stable flow through porous media. Adv. Water Resour. 2006, 29, 30–41. [Google Scholar] [CrossRef]
  44. Jolls, K.R.; Hanratty, T.J. Transition to turbulence for flow through a dumped bed of spheres. Chem. Eng. Sci. 1966, 21, 1185–1190. [Google Scholar] [CrossRef]
  45. Huang, H.; Ayoub, J. Applicability of the Forchheimer Equation for Non-Darcy Flow in Porous Media. In SPE Annual Technical Conference and Exhibition; Society of Petroleum Engineers: Houston, TX, USA, 2006. [Google Scholar]
  46. Burcharth, H.F.; Andersen, O.K. On the one-dimensional steady and unsteady porous flow equations. Coast. Eng. 1995, 24, 233–257. [Google Scholar] [CrossRef]
  47. Fourar, M.; Radilla, G.; Lenormand, R.; Moyne, C. On the non-linear behavior of a laminar single-phase flow through two and three-dimensional porous media. Adv. Water Resour. 2004, 26, 669–677. [Google Scholar] [CrossRef]
  48. Green, L.; Duwez, P. Fluid flow through porous metals. J. Appl. Mech. 1951, 18, 39–45. [Google Scholar]
  49. Du Plessis, J.P.; Masliyah, J.H. Mathematical modeling of flow through consolidated isotropic porous media. Transp. Porous Media 1988, 3, 145–161. [Google Scholar] [CrossRef]
  50. Chen, S.Q.; Xu, L.X.; Zhang, D.C. Typical curve matching of well test data for non-Darcy flow velocity. Pet. Explor. Dev. 1996, 23, 50–53. [Google Scholar]
  51. Zhu, W.; Cheng, N.J.; Chen, X.D.; Chiu, C.F. Some fundamental problems of unsaturated seepage. Chin. J. Geotech. Eng. 2006, 28, 235–240. [Google Scholar]
  52. Liu, K.; Wen, Z.; Liang, X.; Pan, H.Y.; Liu, J.G. One-dimensional column test for non-Darcy flow in low permeability media. Chin. J. Hydrodyn. 2013, 1, 81–87. [Google Scholar]
Figure 1. Schematic diagram of experimental setup used in this study.
Water 11 02317 g001
Figure 2. Sampling information of this study and Quaternary Holocene profile of the Yellow River alluvial plain.
Water 11 02317 g002
Figure 3. Variation of the ratio v/J with Reynolds number Re for four experimental media: (a) silty sand, (b) silt-I, (c) medium sand, and (d) silt-II. Note that the silty sand and silt-I were used under the constant hydraulic head of 170 cm, while the medium sand and silt-II were used under the constant hydraulic head of 230 cm. The black line represents a linear fitting curve.
Water 11 02317 g003
Figure 4. Linear fitting diagrams of average velocity (v) versus hydraulic gradient (J) of four media: (a) silty sand, (b) silt-I, (c) medium sand, and (d) silt-II. Note that the silty sand and silt-I were used under the constant hydraulic head of 170 cm, while the medium sand and silt-II were used under the constant hydraulic head of 230 cm. The black line represents a linear fitting curve.
Water 11 02317 g004
Figure 5. Polynomial (Forchheimer) fitting (in black dotted line) and linear (Darcy) fitting (in black solid line) of the initial data for (a) medium sand and (b) silt-II under the constant hydraulic head of 230 cm. Note that the red dotted lines represent the transition from Darcy flow to non-Darcy flow.
Water 11 02317 g005
Figure 6. Schematic diagram of the difference between Darcy and Forchheimer fitting for (a) medium sand and (b) silt-II.
Water 11 02317 g006
Figure 7. Histogram of the deviation from the experimental values (in black). Note that the Darcy values are shown in yellow and the Forchheimer values are shown in pink.
Water 11 02317 g007
Figure 8. Relationship between average velocity of experimental results and error from Darcy’s law.
Water 11 02317 g008
Table 1. Geotechnical test results of experimental media.
Field Sample NumberParticle Size Analysis (mm)Coefficient of Uniformity
Cu
Effective Grain Size
d10
Average Grain Size
d50
Classification of Soil Naming Standards (GB50021-2001) *
SandPowderClay
2–0.50.5–0.250.25–0.0750.075–0.005<0.005
%%%%%-mmmm
13.330.723.638.20.53.100.0620.124Silty sand
2 16.080.43.63.500.0180.059Silt
318.349.016.715.60.45.330.0690.319Medium sand
4 4.380.814.911.670.0030.025Silt
* (GB50021-2001) is code for investigation of geotechnical engineering of State Standard of the People’s Republic of China.
Table 2. Results of the four experimental media.
Group A (170 cm)Group B (230 cm)
Silty Sand (d0 = 0.124 mm)Silt-I (d0 = 0.059 mm)Medium Sand (d0 = 0.319 mm)Silt-II (d0 = 0.025 mm)
v (cm/s)J (cm/cm)Rev (cm/s)J (cm/cm)Rev (cm/s)J (cm/cm)Rev (cm/s)J (cm/cm)Re
4.45 × 10−50.100.0000558.30 × 10−50.230.0000481.39 × 10−30.350.0043783.86 × 10−50.570.0000095
1.06 × 10−40.220.0001301.63 × 10−40.440.0000953.30 × 10−30.770.0104098.33 × 10−51.140.000021
1.43 × 10−40.300.0001752.83 × 10−40.750.0001654.73 × 10−31.140.0149331.09 × 10−41.620.000027
1.85 × 10−40.390.0002284.12 × 10−41.020.0002416.10 × 10−31.520.0192531.17 × 10−42.300.000029
2.57 × 10−40.590.0003166.20 × 10−41.510.0003626.47 × 10−31.950.0204421.40 × 10−42.810.000035
3.12 × 10−40.840.0003837.45 × 10−42.010.0004357.69 × 10−32.420.0242871.49 × 10−43.270.000037
4.17 × 10−40.970.0005128.98 × 10−42.460.0005258.83 × 10−33.060.0278801.51 × 10−44.100.000037
4.94 × 10−41.170.0006071.13 × 10−32.830.0006629.86 × 10−33.510.0311471.62 × 10−44.540.000040
5.64 × 10−41.380.0006931.29 × 10−33.260.0007551.04 × 10−23.870.0328391.53 × 10−44.880.000038
6.33 × 10−41.630.0007771.25 × 10−33.510.0007291.03 × 10−23.850.0325211.69 × 10−45.260.000042
8.42 × 10−34.140.0265861.59 × 10−45.580.000039
The kinematic viscosity coefficient of water at 20 °C is 0.0101 (cm2/s) (empirical formula μ = 0.01775 / ( 1 + 0.0337 t +   0.000221 t 2 ) [38].
Table 3. Linear fitting equations and correlation coefficients of experimental media.
Experimental MediaConstant Hydraulic Head Regression EquationCorrelation Coefficient
Silty sandZ = 170 cmv = 0.408 JR2 = 0.9890
Silt-Iv = 0.3802 JR2 = 0.9901
Medium sandZ = 230 cmv = 0.5456 JR2 = 0.7810
Silt-IIv = 0.3594 JR2 = 0.3130
Table 4. Polynomial equations and correlation coefficients for medium sand and silt-II.
Experimental MediaConstant Hydraulic HeadRegression EquationCorrelation Coefficient
Medium sandZ = 230 cmJ = 1.9973 v2 + 1.8024 vR2 = 0.9072
Silt-IIJ = 2.3171 v2 − 0.7785 vR2 = 0.9129
Table 5. Linear equations and correlation coefficients of initial data of Medium sand and Silt-II.
Experimental MediaConstant Hydraulic Head Regression EquationCorrelation Coefficient
Medium sandZ = 230 cmv = 0.409 J R2 = 0.9961
Silt-IIv = 0.6923 JR2 = 0.9878
Table 6. Compared to previous relevant studies.
IDMethodExperimental MediaReReference
1field surveygravel0.9–414[4]
2laboratory experimentloosely consolidated sandstones0.4–3[18]
unconsolidated sands and lead shot10–1000
3overviewpacked particles1–100[19]
4simulation experimentcubic arrays of spheres in diameter from 3 mm–10 mm30[20]
5numerical simulationdisordered porous media0.01–0.1[21]
6sand columns experiment quartz sands with different diameters22–2752–104[22]
7physical model plexiglass spheres0.16–700[23]
8flow experimentporous metal samples0.1–0.2[48]
9mathematical modelingunit cell3–17[49]
10laboratory filtration experimentsilt, silty sand (0.025–0.319 mm) <0.03this study

