Evaluation of Extreme Cold and Drought over the Mongolian Plateau


Abstract
1. Introduction
2. Materials and Methods
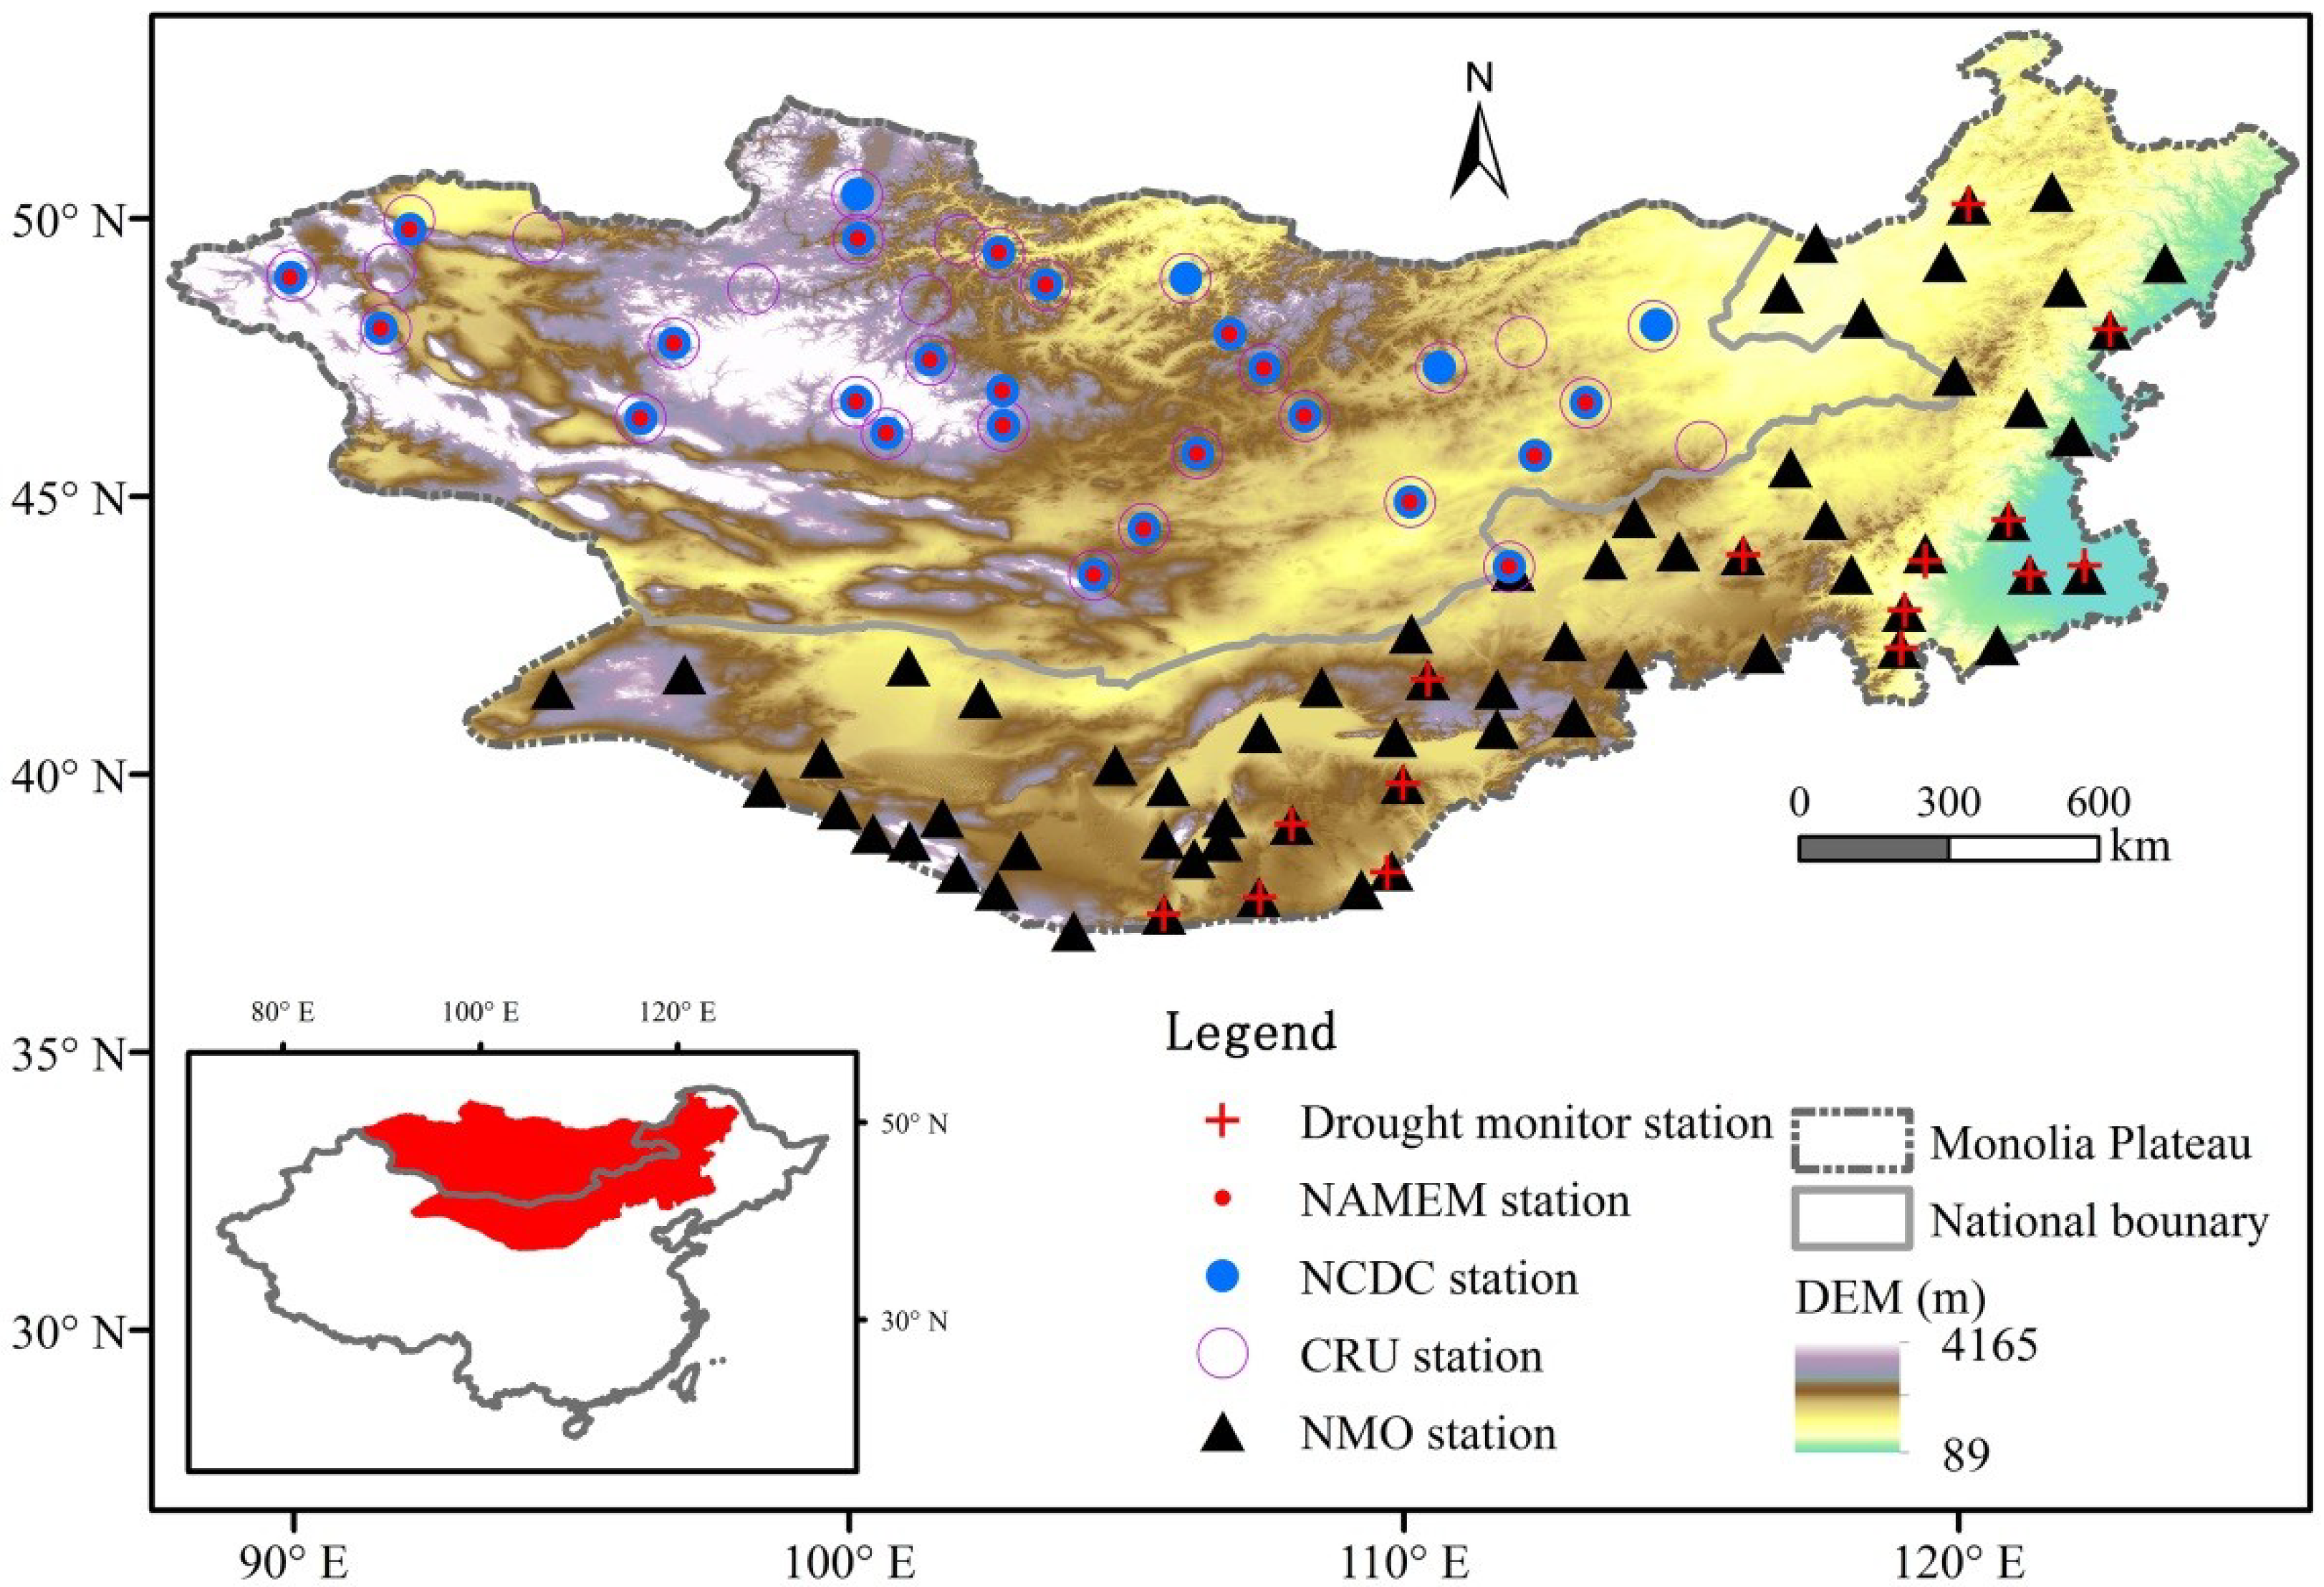
2.1. Study Area Description
2.2. Data Description
2.2.1. Meteorological Observed Station Data
2.2.2. Recorded Historical Drought Data
2.3. Methodology Description
2.3.1. Extreme Cold Indices
2.3.2. Drought Indices
- ET0—reference crop evapotranspiration [mm/day],
- Rn—net radiation at the crop surface [MJ/m2 day],
- G—soil heat flux density [MJ/m2 day],
- T—mean daily air temperature at 2-m height [°C],
- u2—wind speed at 2-m height [m/s],
- es—saturation vapor pressure [kPa],
- ea—actual vapor pressure [kPa],
- es − ea—saturation vapor pressure deficit [kPa],
- Δ—slope vapor pressure curve [kPa/°C],
- γ—psychrometric constant [kPa/°C].
2.3.3. Evaluation of Drought Indices
2.3.4. Drought Analyses
2.3.5. Trends Detection for Extreme Cold and Drought
3. Results and Discussion
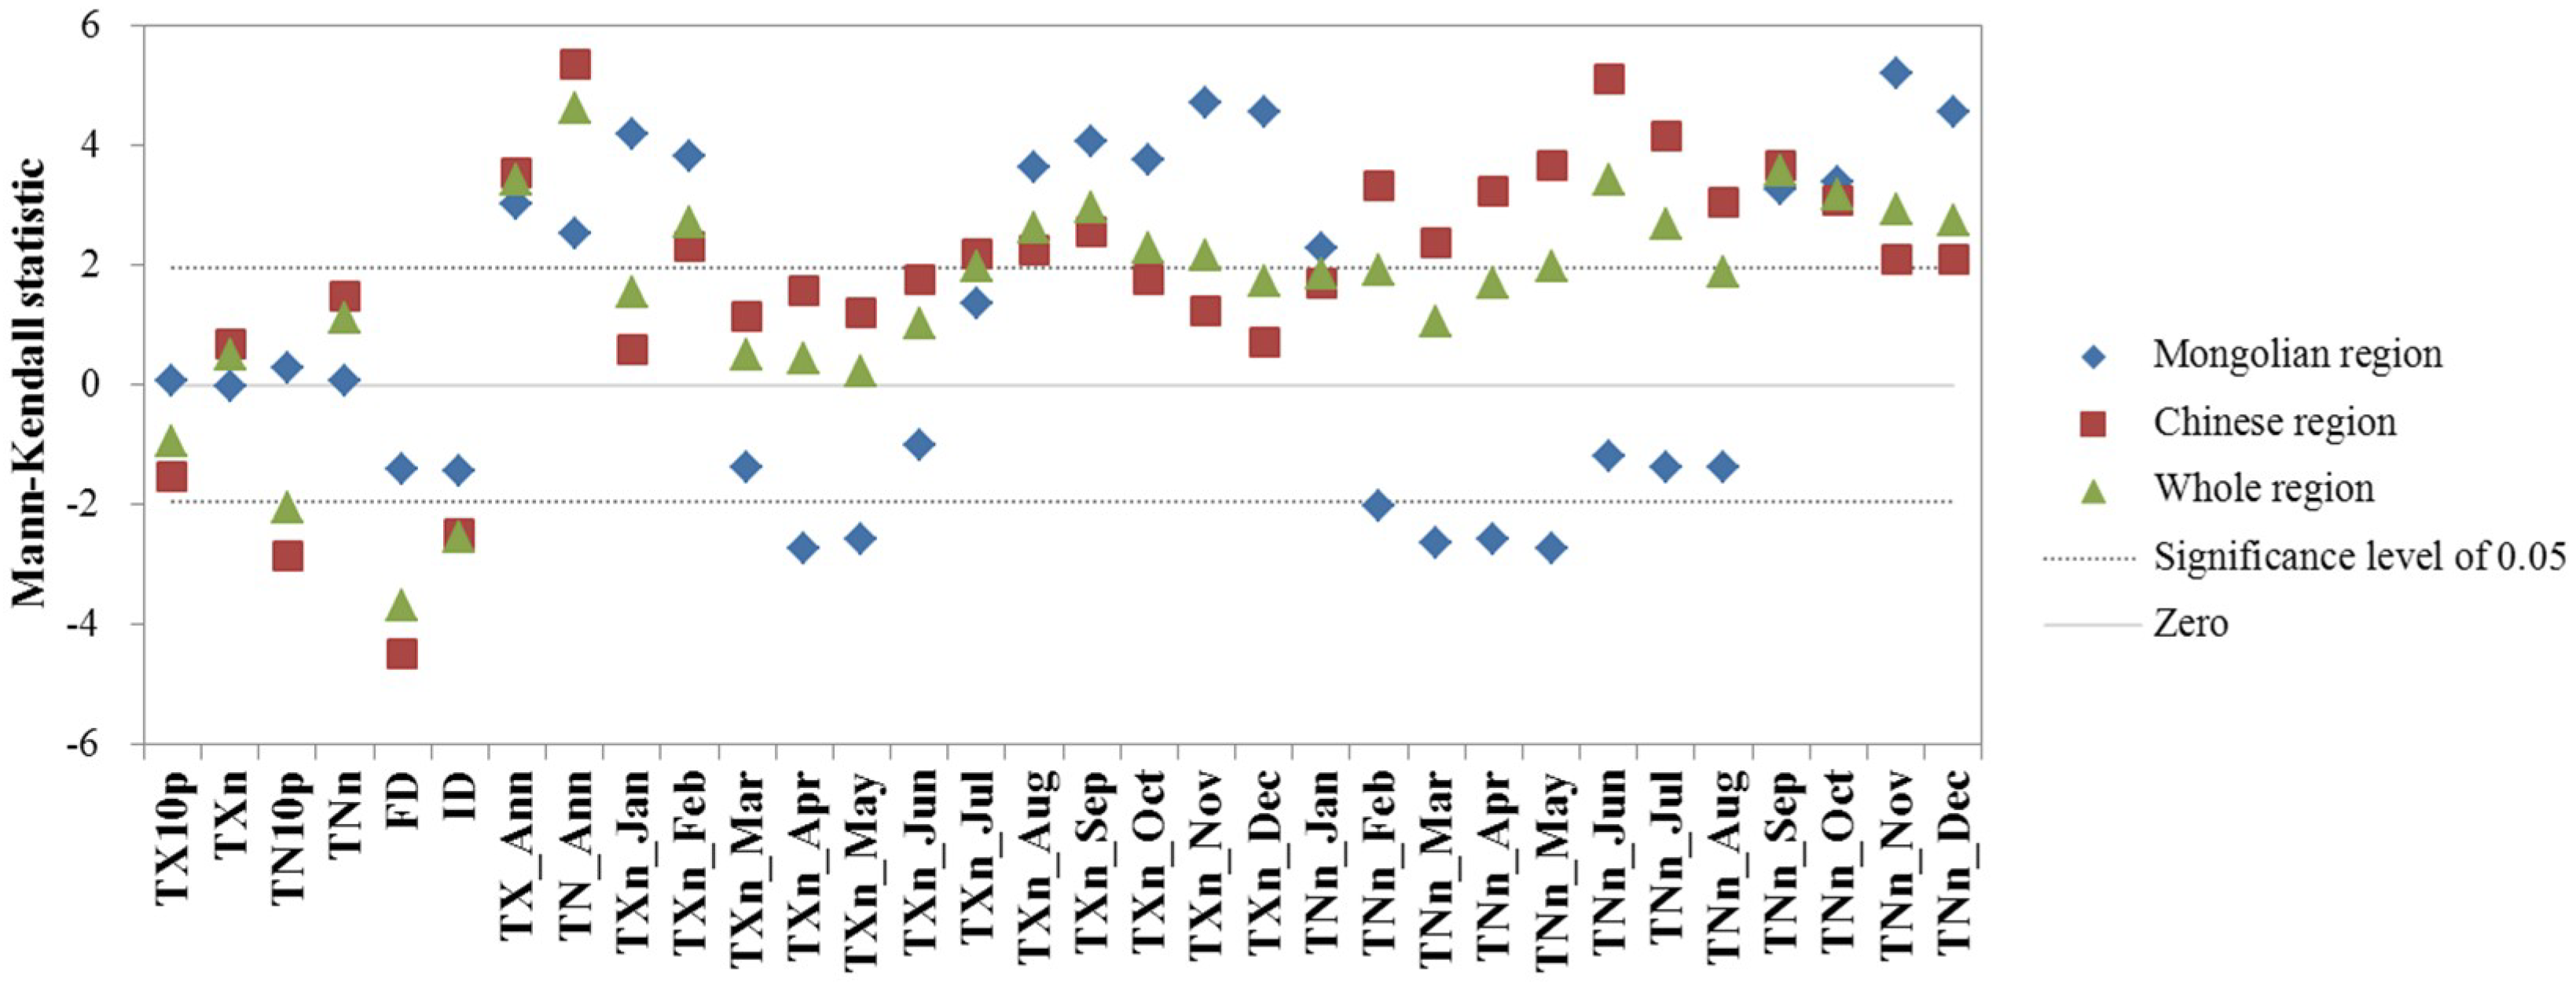
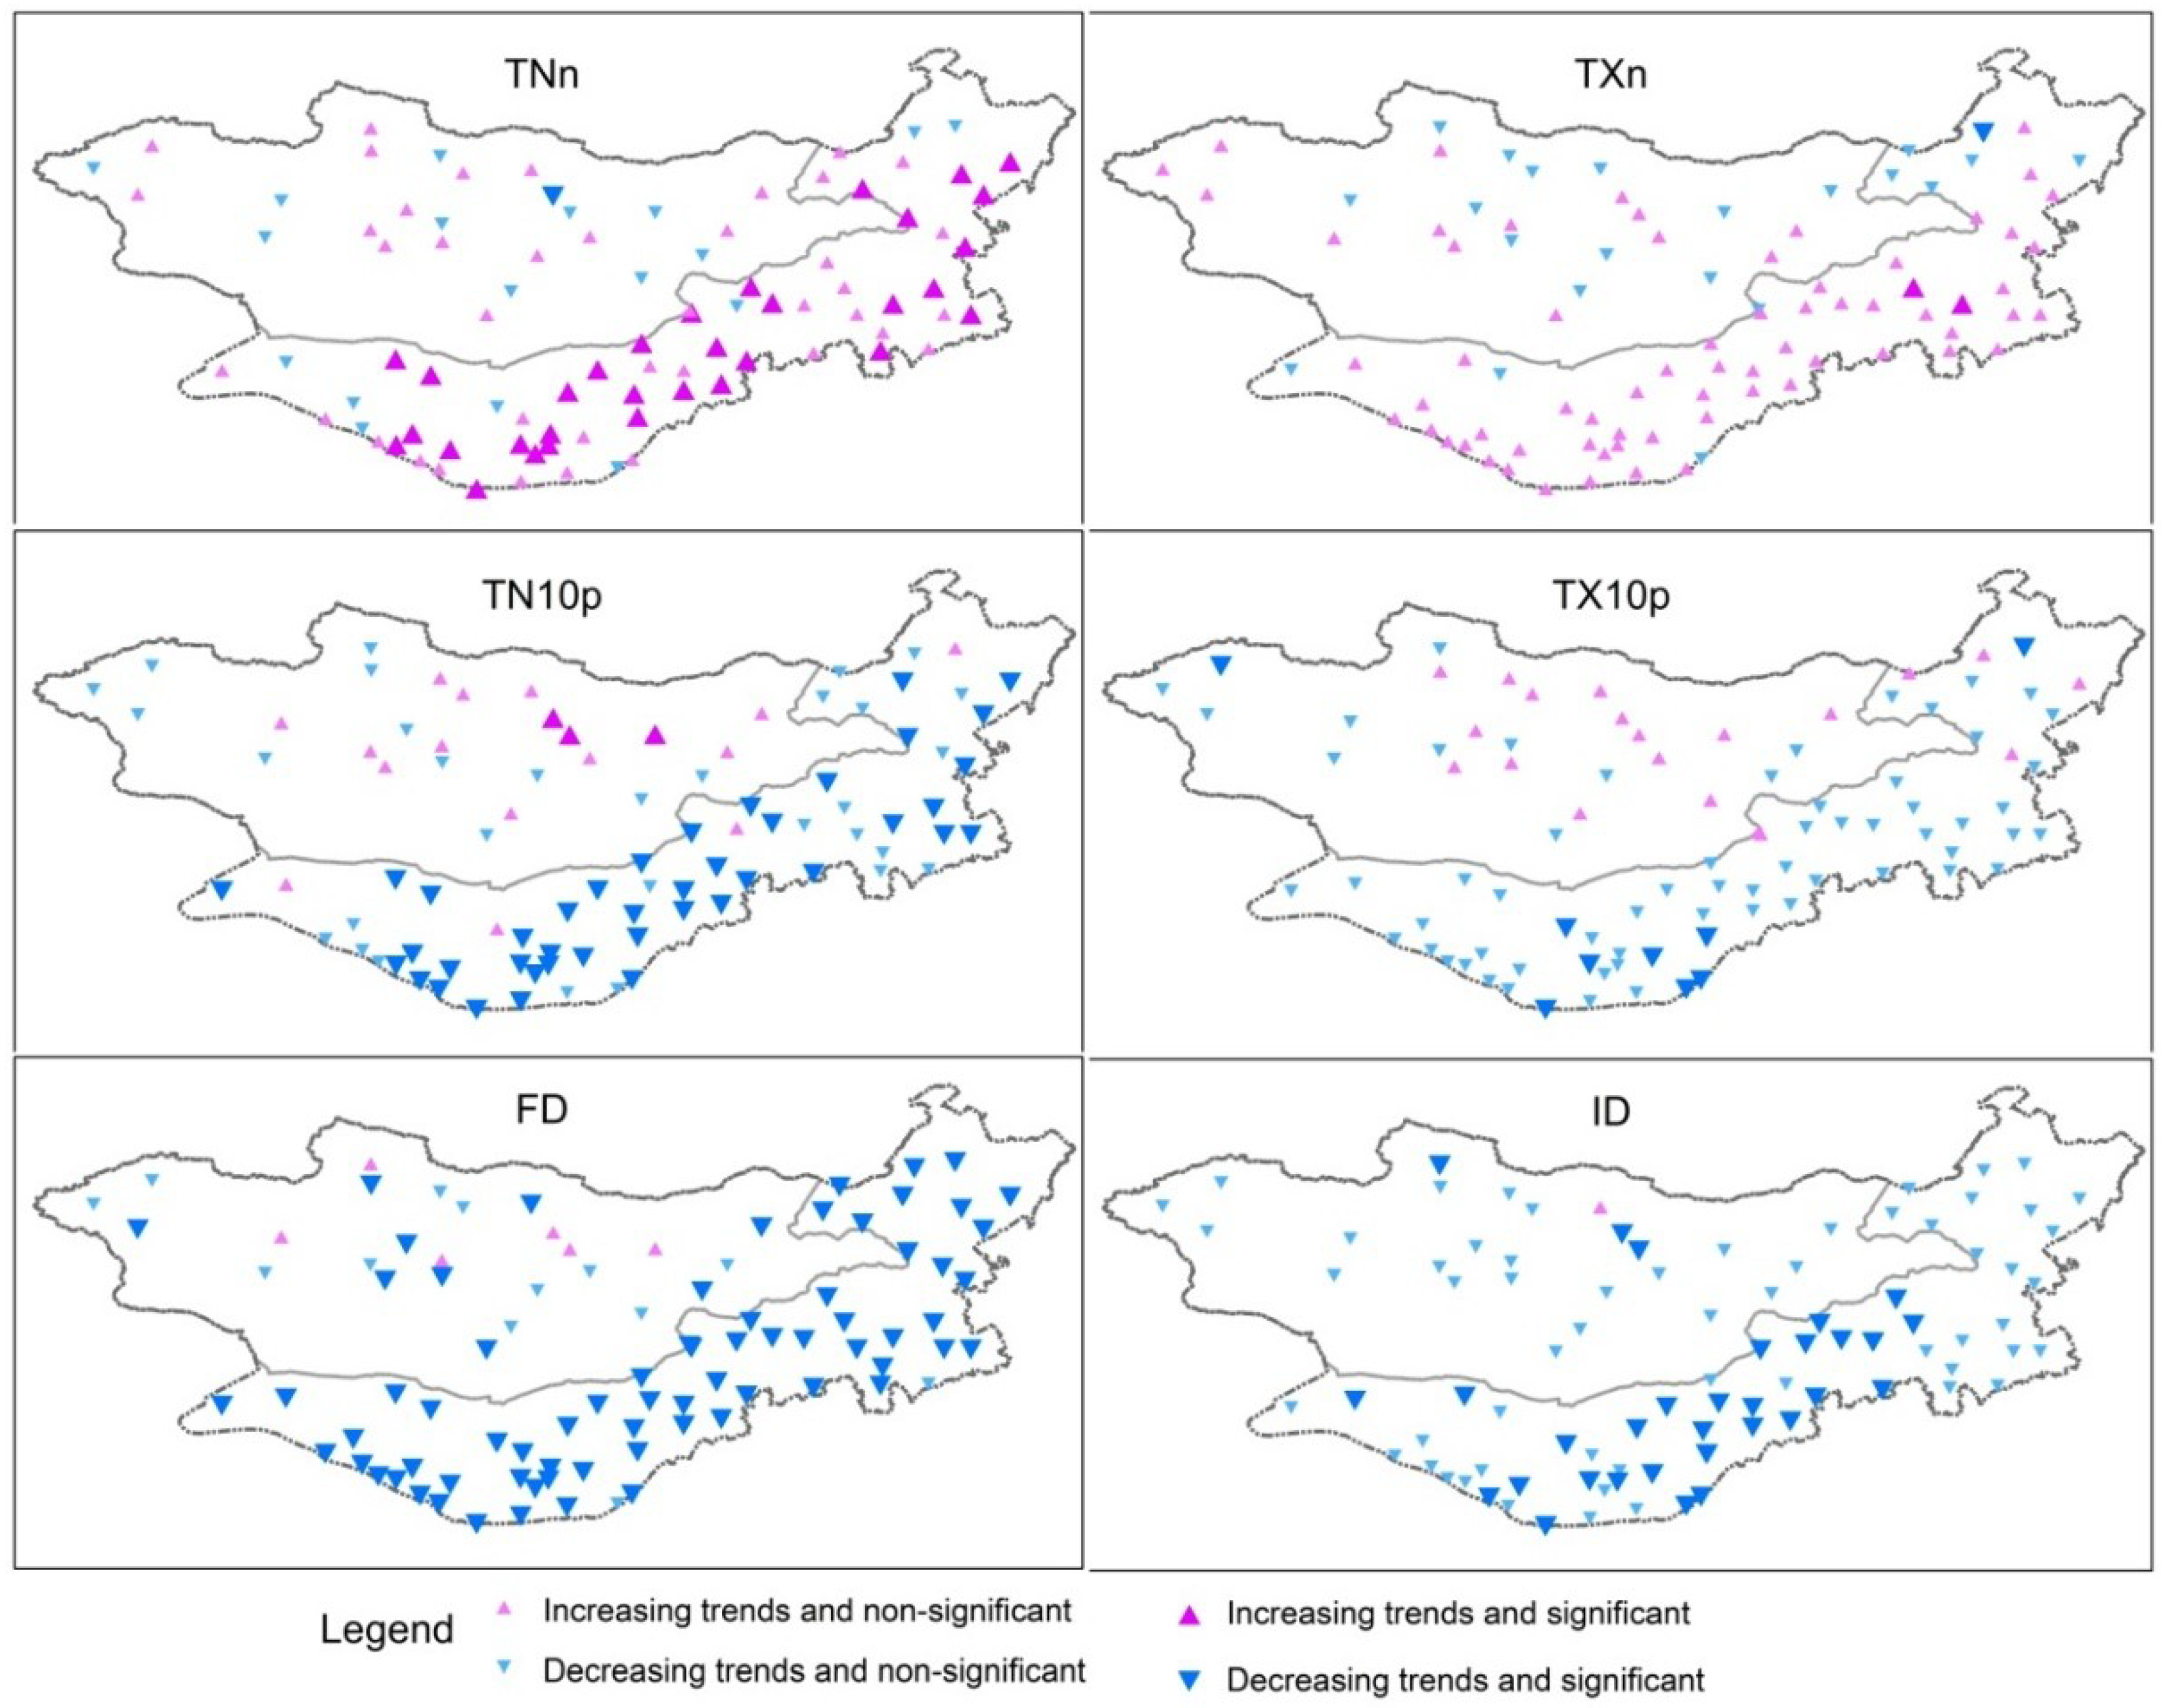
3.1. Trends of Extreme Cold Indices in the MP
3.2. Droughts
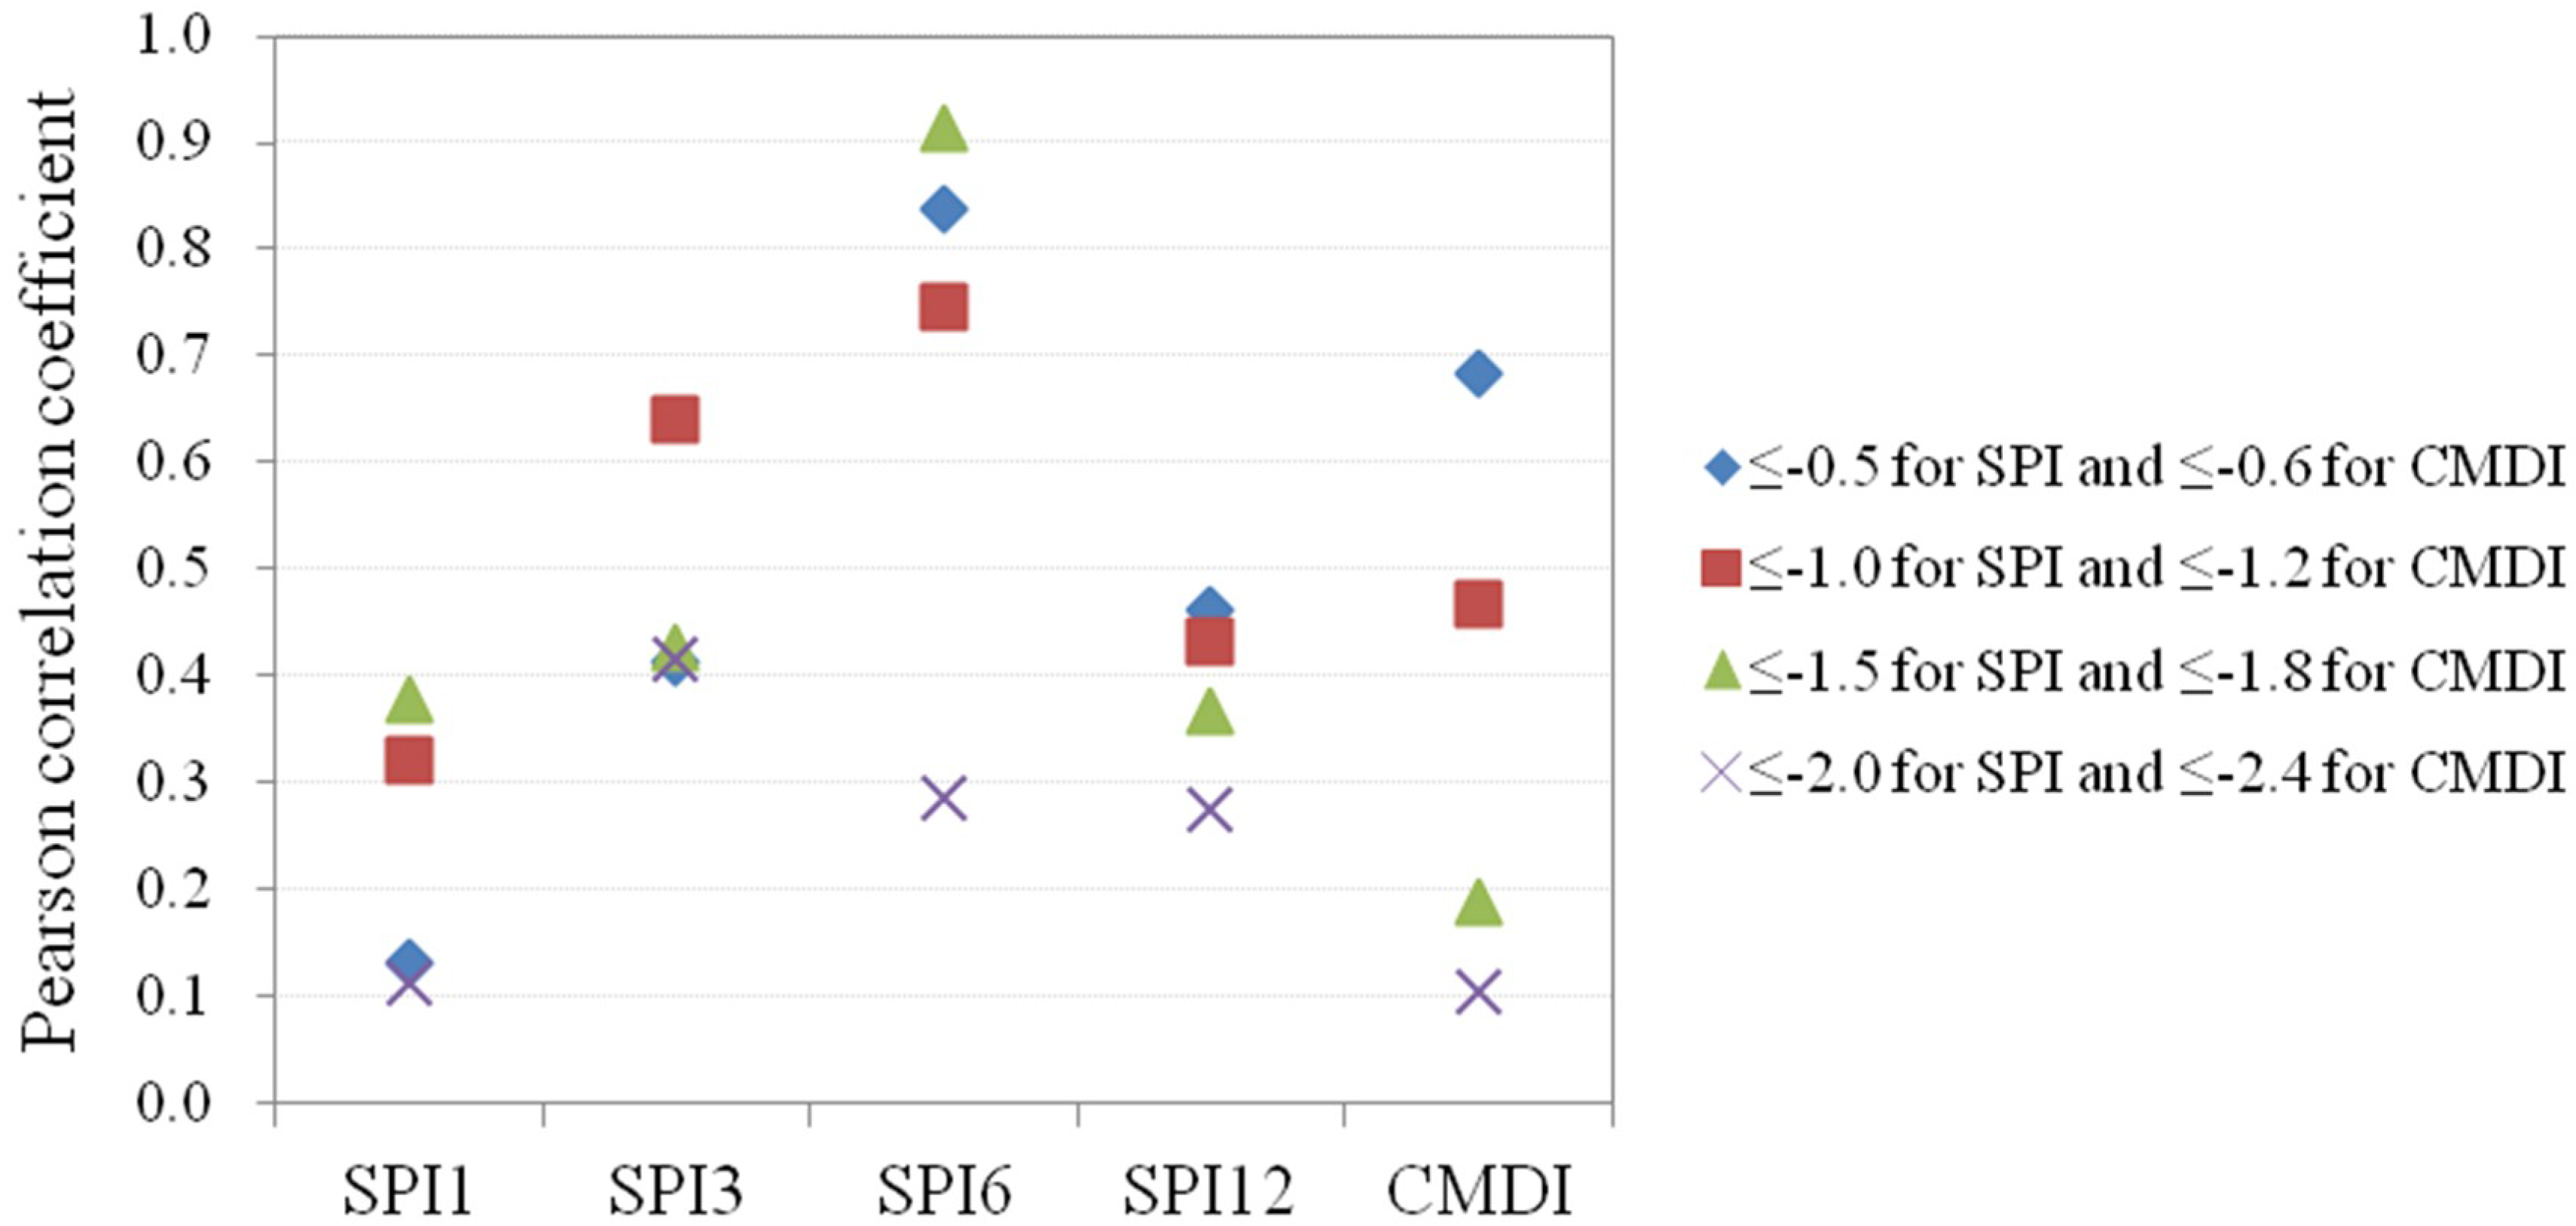
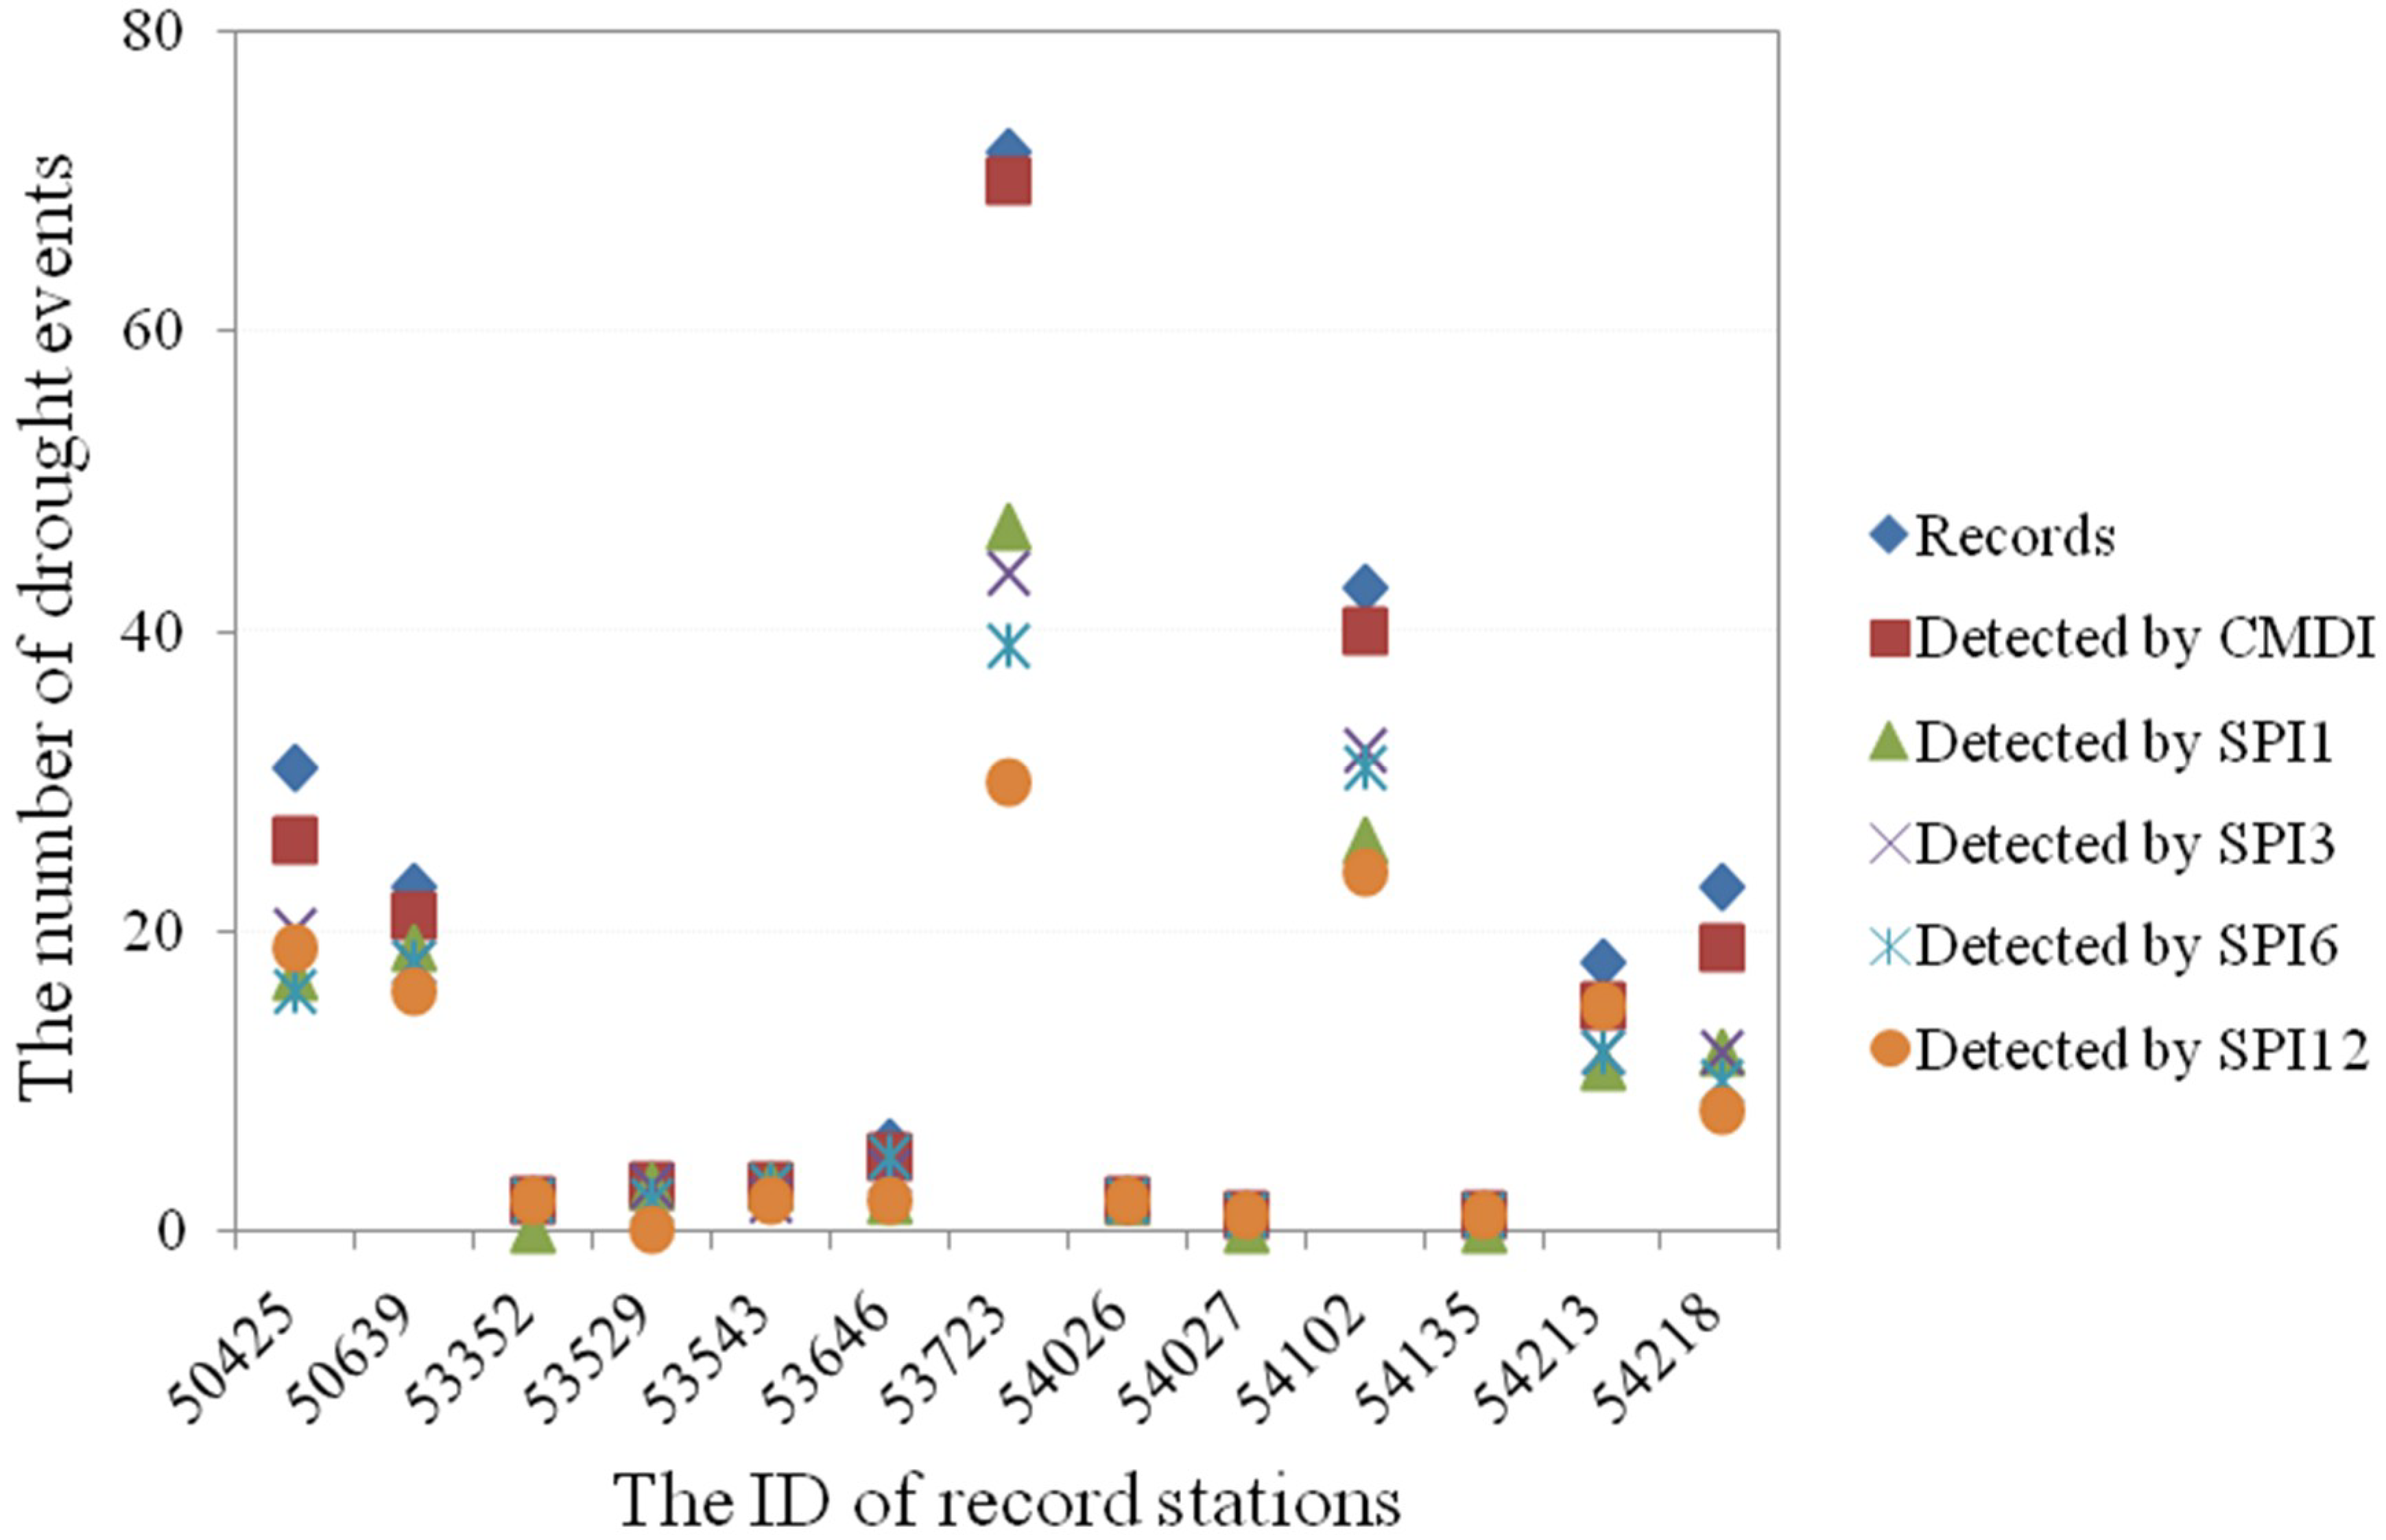
3.2.1. Evaluation of Drought Indices by Using Recorded Historical Drought Data in the Chinese Region
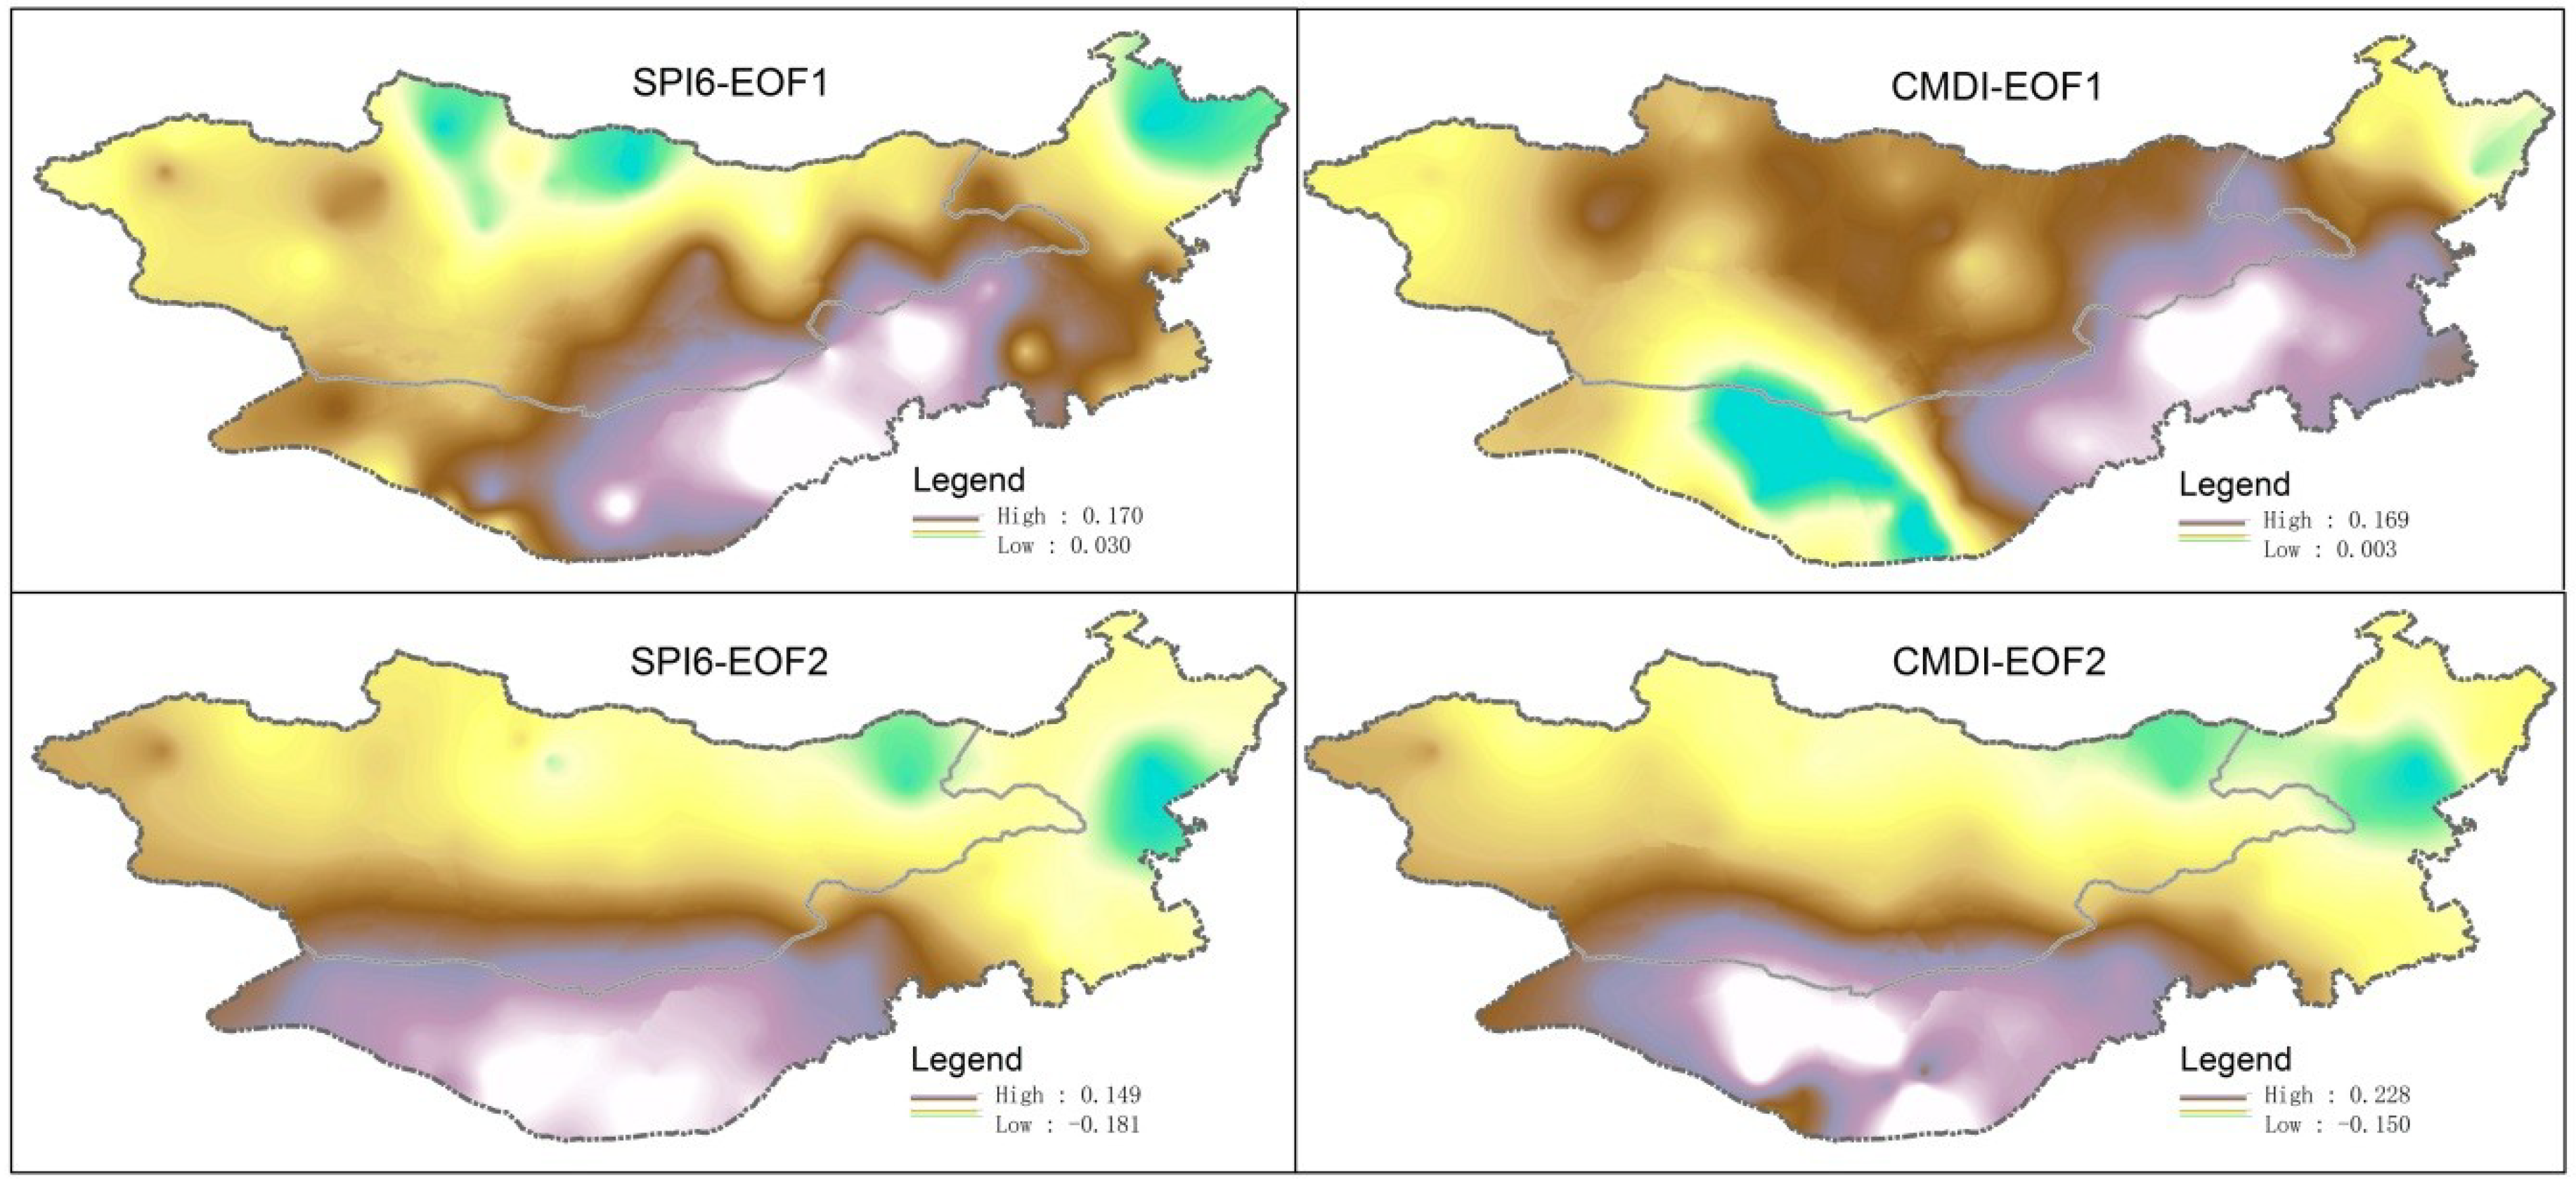
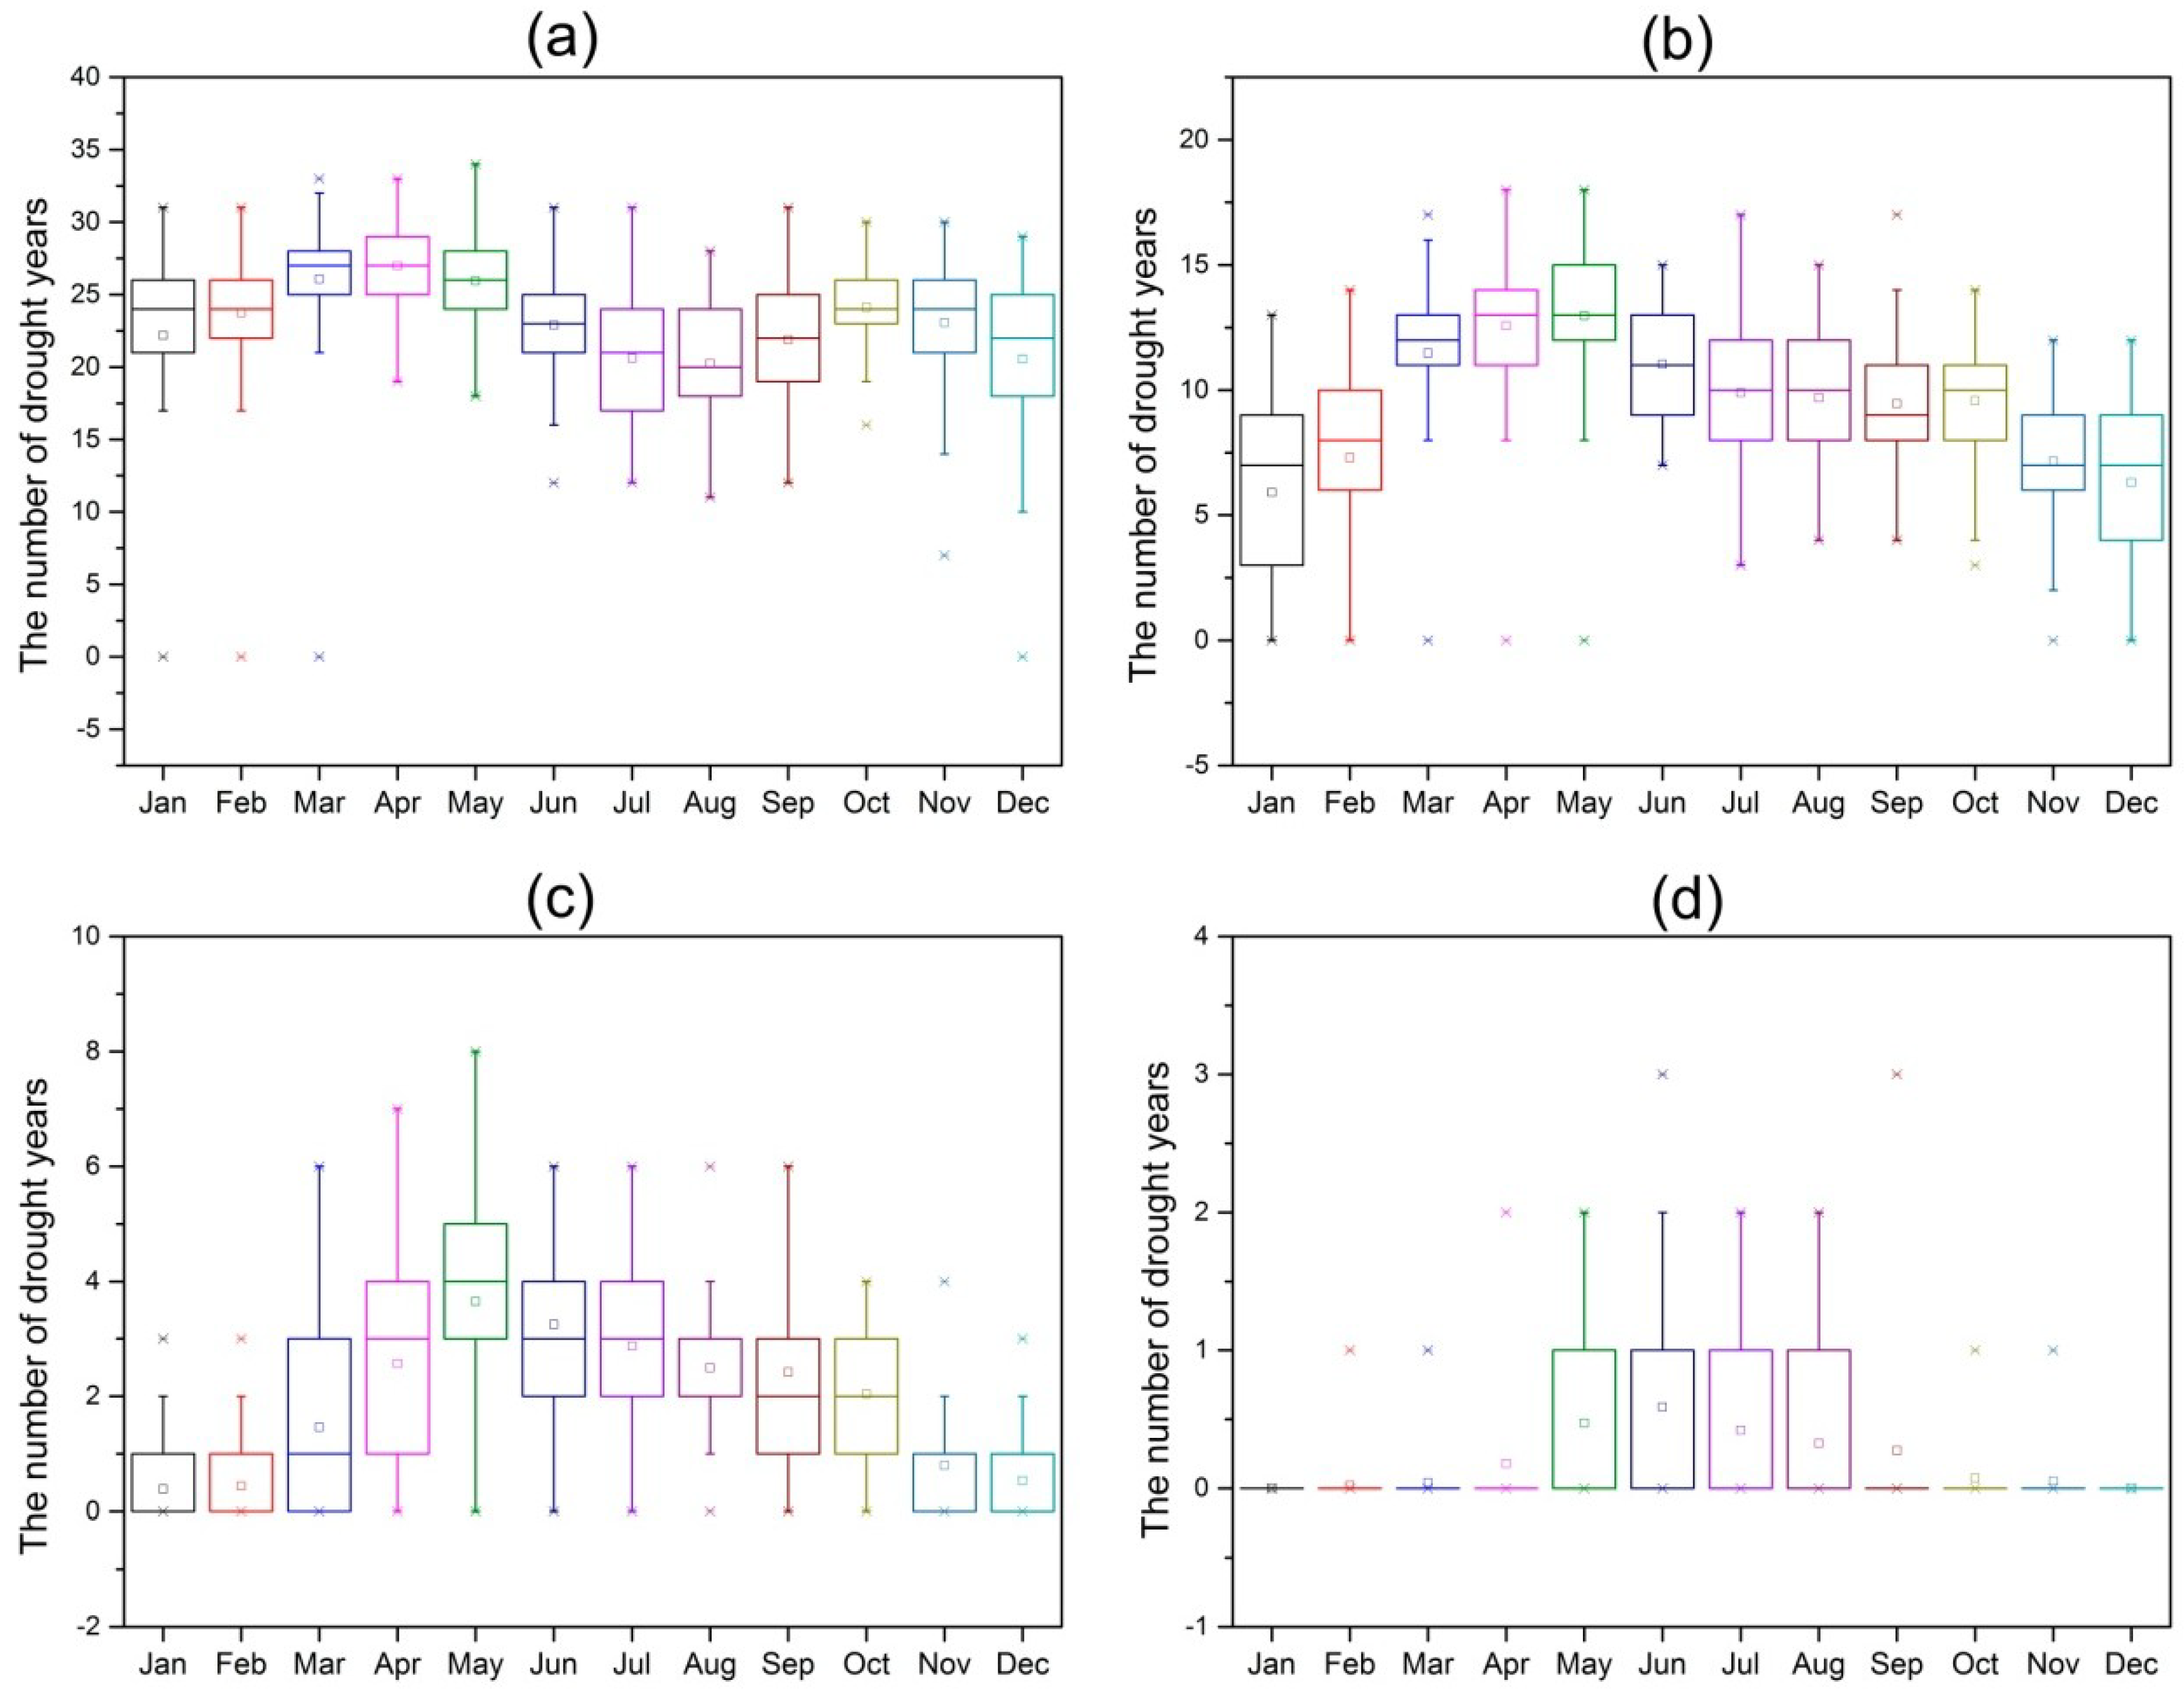
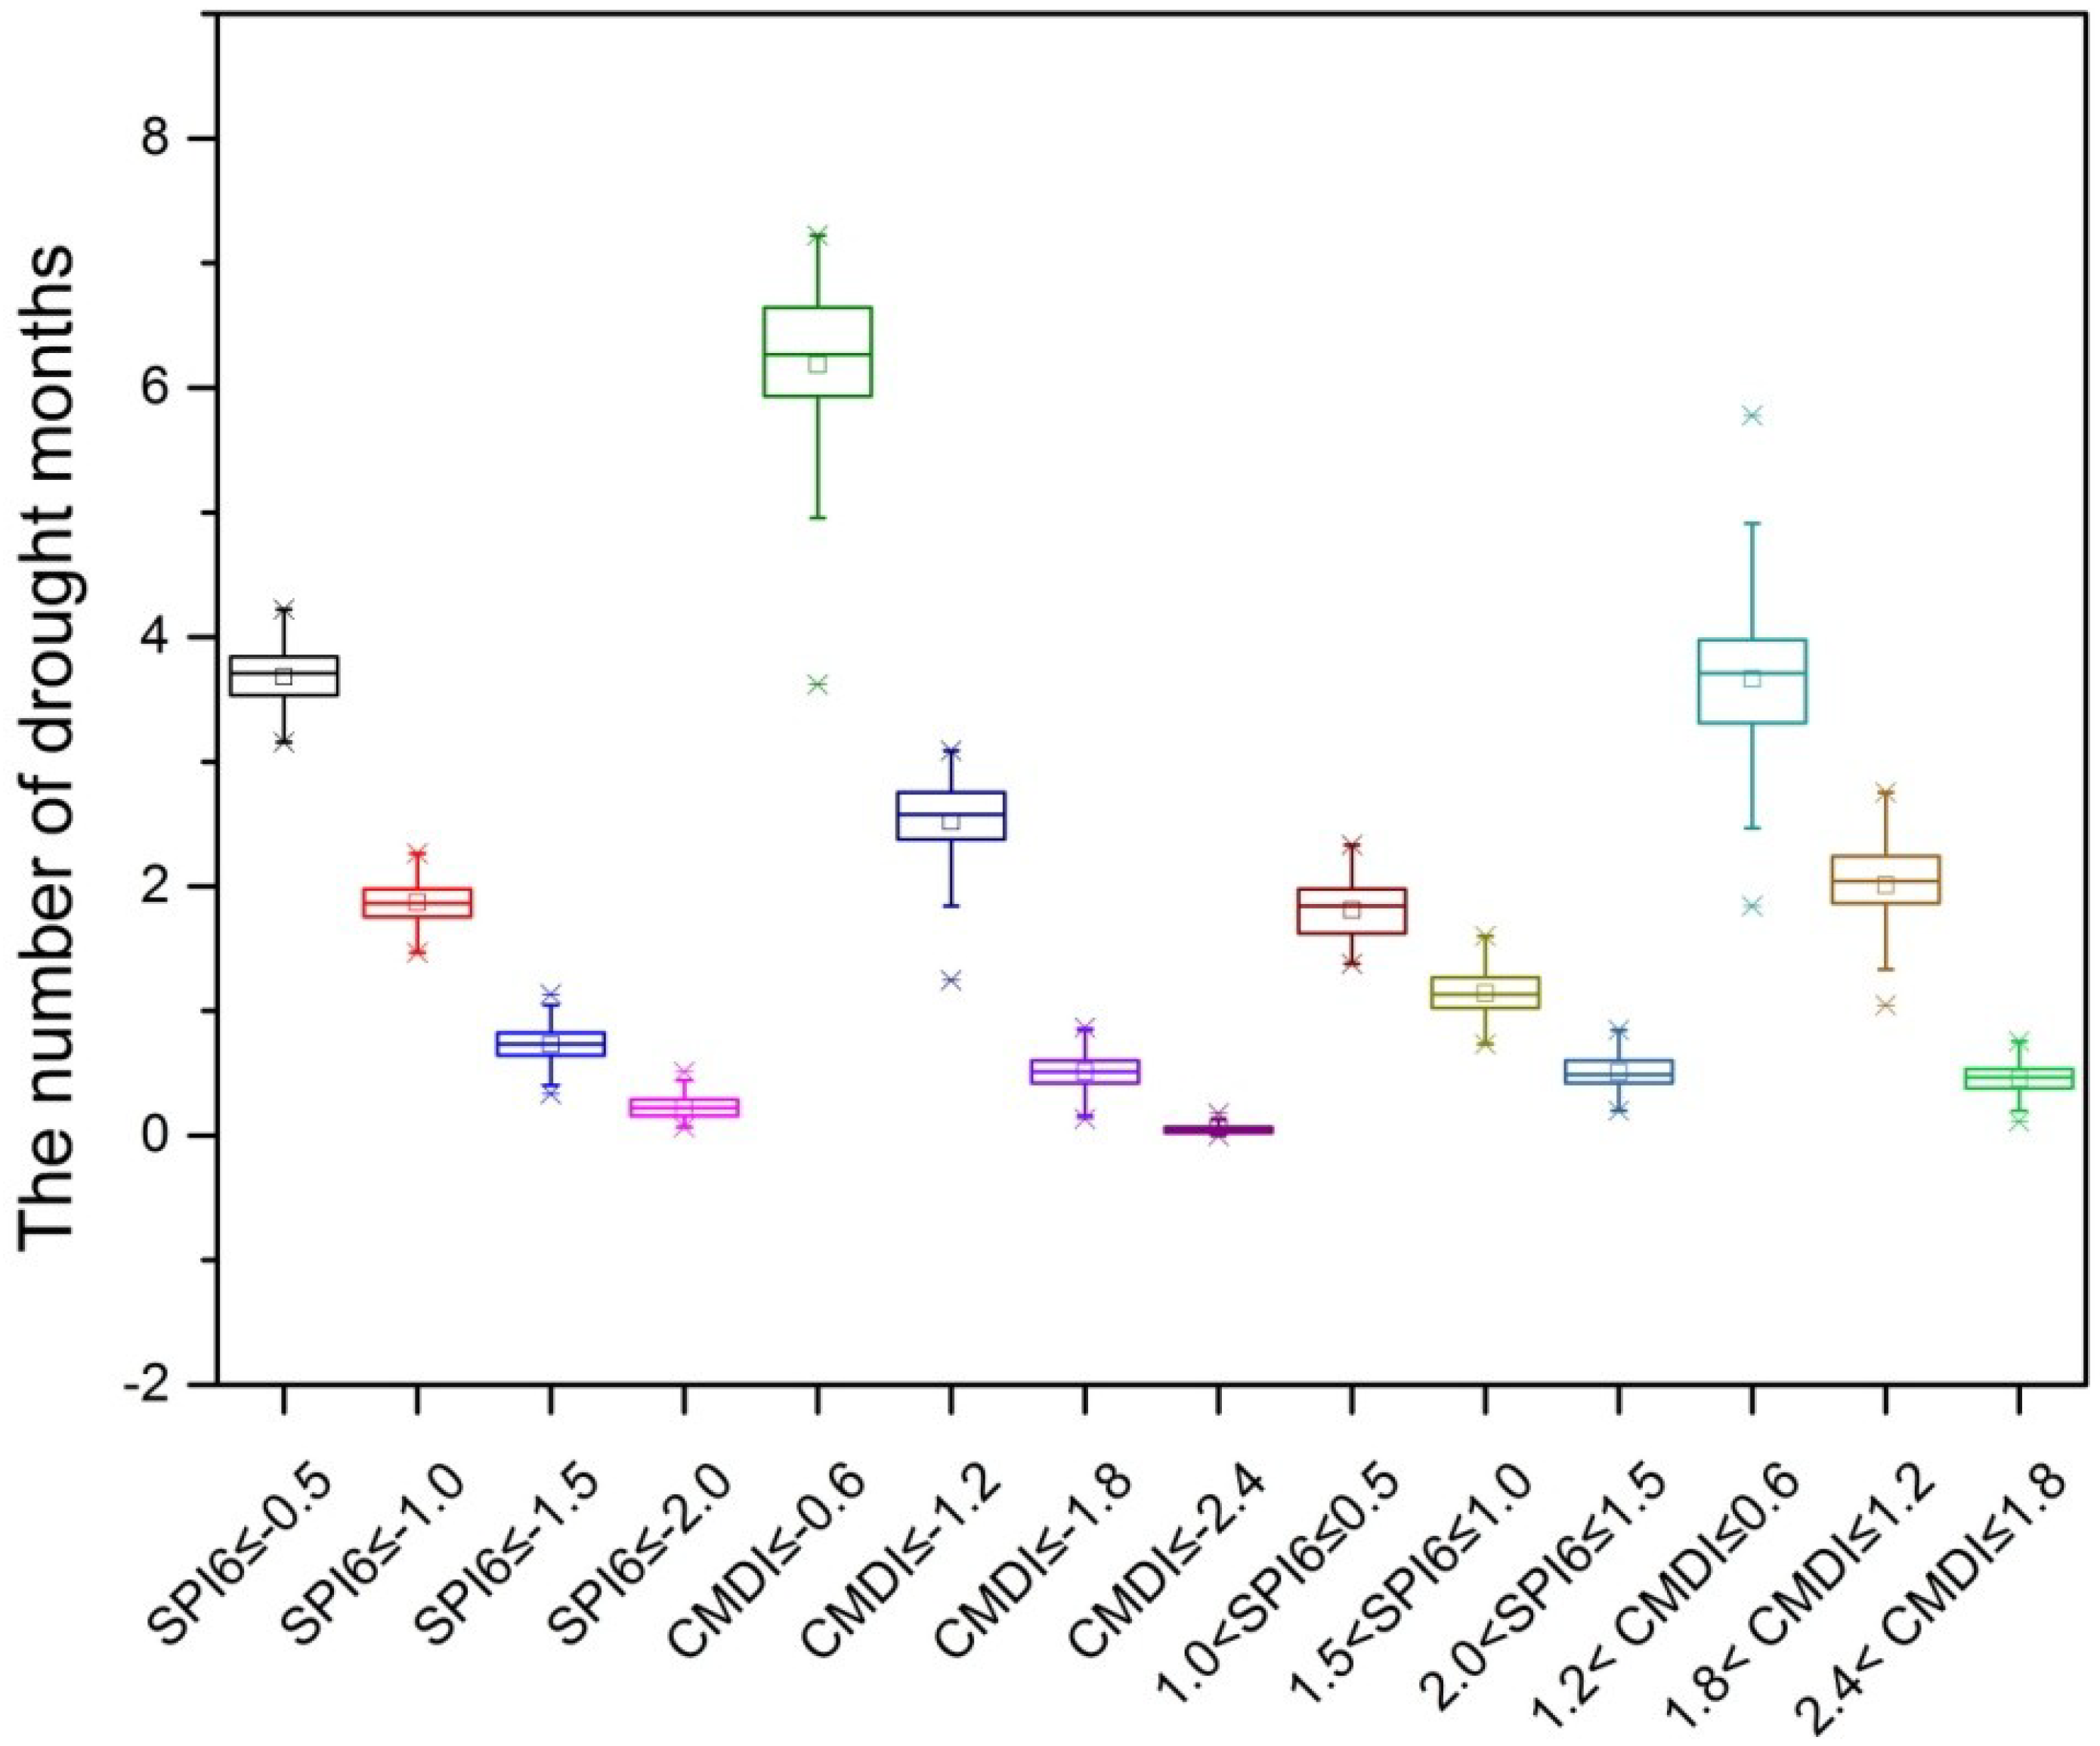
3.2.2. Detecting Spatial and Temporal Characteristics of Drought by Using the Evaluated Drought Indices (CMDI and SPI6) in the MP
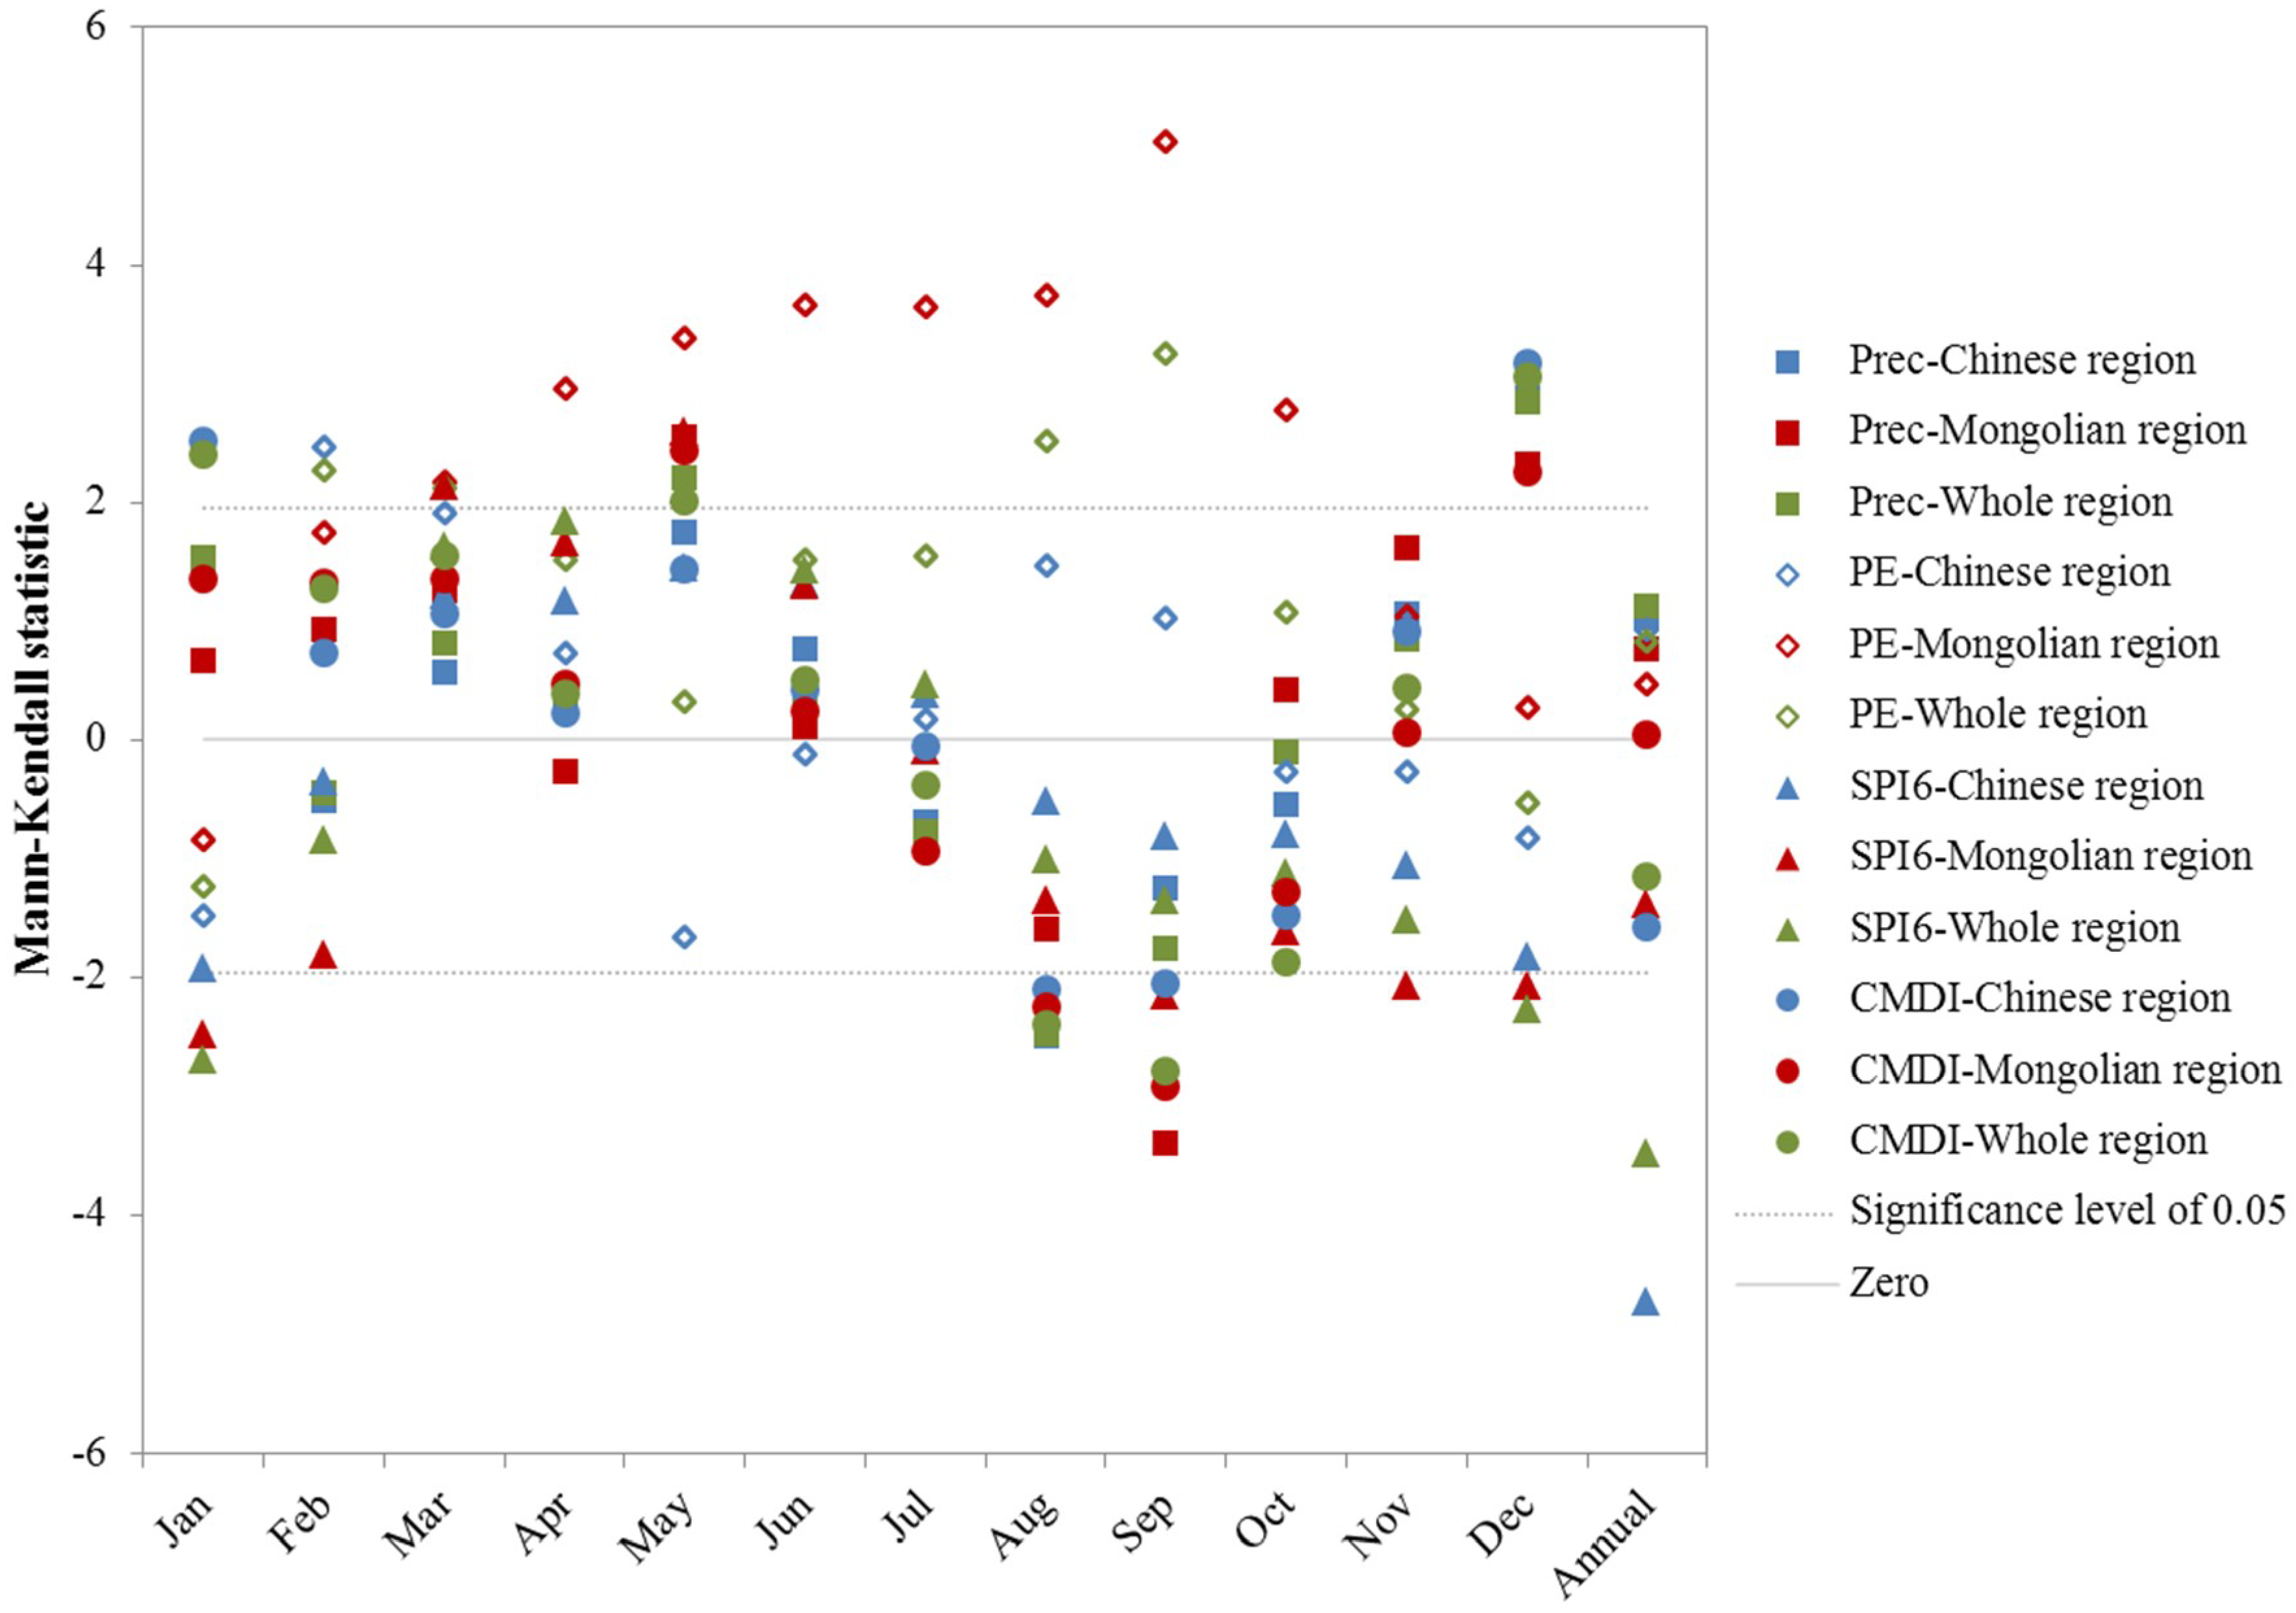
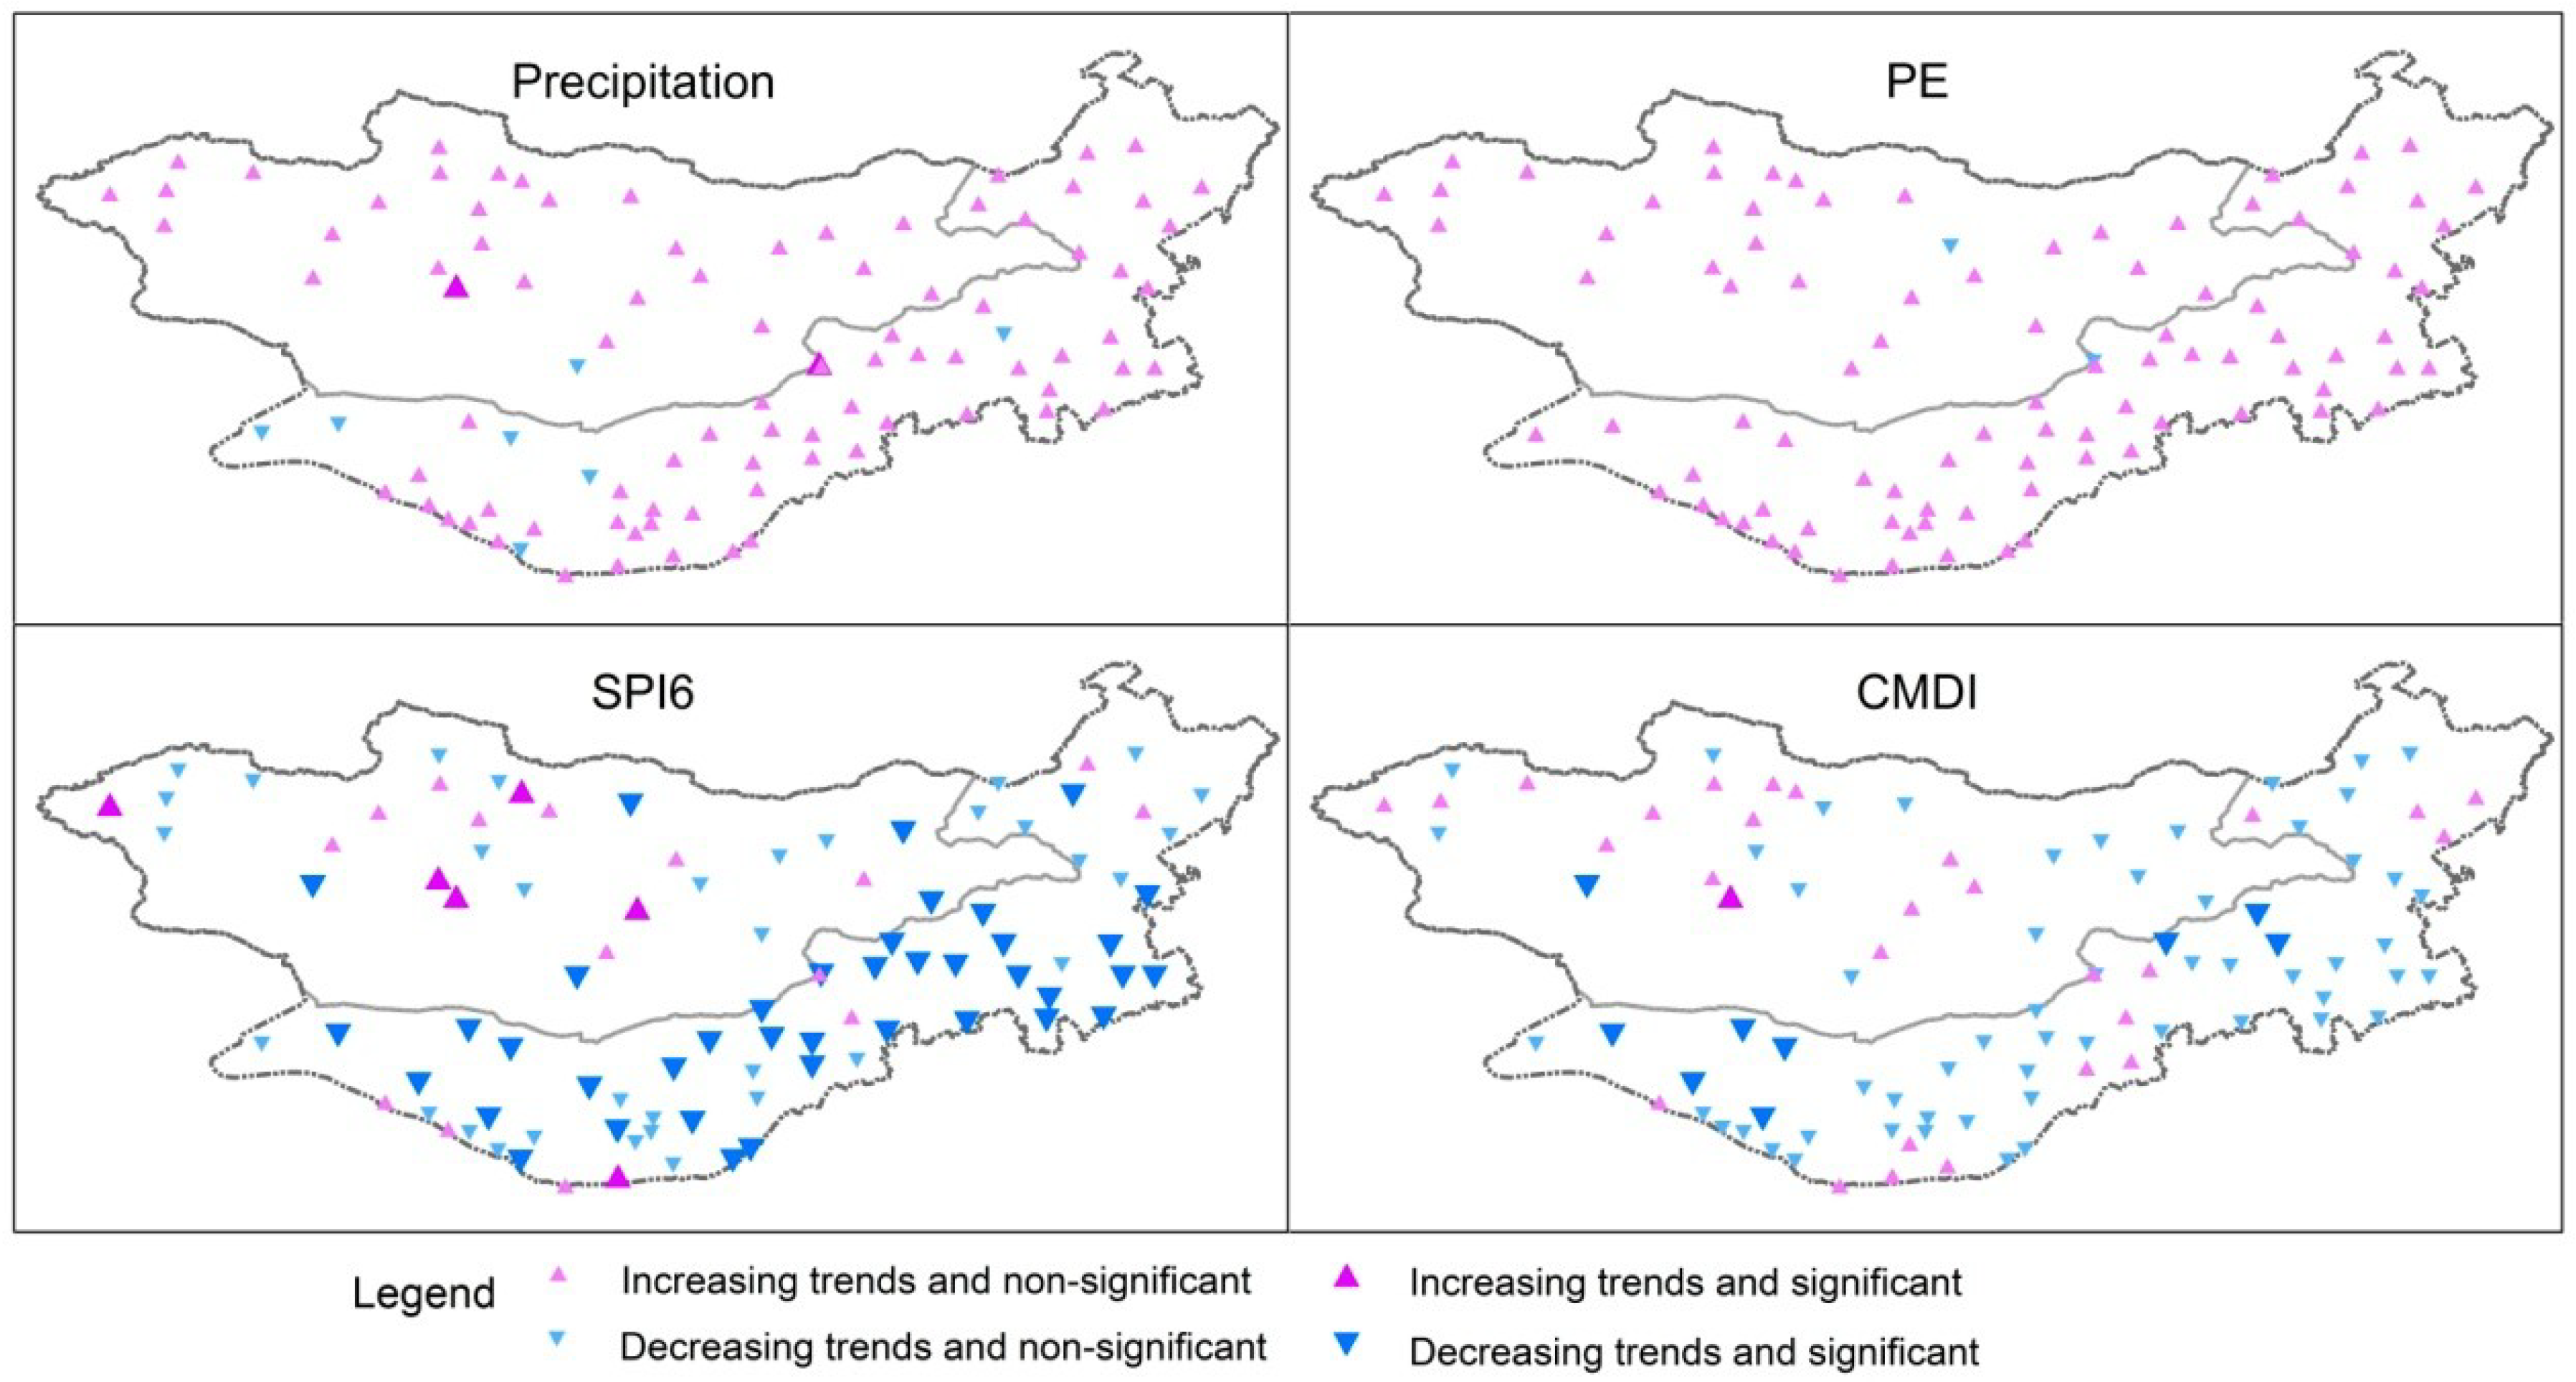
3.2.3. Trends of Meteorological Drought in the MP
3.3. Discussion
4. Conclusions
Author Contributions
Funding
Acknowledgments
Conflicts of Interest
References
- Easterling, D.R.; Meehl, G.A.; Parmesan, C.; Changnon, S.A.; Karl, T.R.; Mearns, L.O. Climate extremes: Observations, modeling, and impacts. Science 2000, 289, 2068–2074. [Google Scholar] [CrossRef] [PubMed]
- Katz, R.; Brush, G.; Parlange, M. Statistics of extremes: Modeling ecological disturbances. Ecology 2005, 86, 1124–1134. [Google Scholar] [CrossRef]
- Awal, R.; Bayabil, H.K.; Fares, A. Analysis of potential future climate and climate extremes in the Brazos headwaters basin, Texas. Water 2016, 8, 603. [Google Scholar] [CrossRef]
- Beniston, M.; Stephenson, D.B.; Christensen, O.; Ferro, C.; Frei, C.; Goyette, S.; Halsneas, K.; Holt, T.; Jylhä, K.; Koffi, B.; et al. Future extreme events in European climate: An exploration of regional climate model projections. Clim. Chang. 2007, 81, 71–95. [Google Scholar] [CrossRef]
- Karl, T.R.; Nicholls, N.; Ghazi, A. CLIVAR/GCOS/WMO workshop on indices and indicators for climate extremes: Workshop summary. Clim. Chang. 1999, 42, 3–7. [Google Scholar] [CrossRef]
- Kunkel, K.E.; Pielke, J.R.A.; Changnon, S.A. Temporal fluctuations in weather and climate extremes that cause economic and human health impacts: A review. Bull. Am. Meteorol. Soc. 1999, 80, 1077–1098. [Google Scholar] [CrossRef]
- Sternberg, T.; Thomas, D.; Middleton, N. Drought dynamics on the Mongolian steppe, 1970–2006. Int. J. Climatol. 2011, 31, 1823–1830. [Google Scholar] [CrossRef]
- Tong, S.; Lai, Q.; Zhang, J.; Bao, Y.; Lusi, A.; Ma, Q.; Li, X.; Zhang, F. Spatiotemporal drought variability on the Mongolian Plateau from 1980–2014 based on the SPEI-PM, intensity analysis and Hurst exponent. Sci. Total Environ. 2018, 615, 1557–1565. [Google Scholar] [CrossRef] [PubMed]
- Tachiiri, K.; Shinoda, M.; Klinkenberg, B.; Morinaga, Y. Assessing Mongolian snow disaster risk using livestock and satellite data. J. Arid. Environ. 2008, 72, 2251–2263. [Google Scholar] [CrossRef]
- Fernández-Giménez, M.E.; Batkhishig, B.; Batbuyan, B. Cross-boundary and cross-level dynamics increase vulnerability to severe winter disasters (dzud) in Mongolia. Glob. Environ. Chang. 2012, 22, 836–851. [Google Scholar] [CrossRef]
- John, R.; Chen, J.Q.; Ou-Yang, Z.T.; Xiao, J.F.; Becker, R.; Samanta, A.; Ganguly, S.; Yuan, W.P.; Batkhishig, O. Vegetation response to extreme climate events on the Mongolian Plateau from 2000 to 2010. Environ. Res. Lett. 2013, 8, 035033. [Google Scholar] [CrossRef]
- Frich, P.; Alexander, L.V.; Della-Marta, P.; Gleason, B.; Haylock, M.; Klein-Tank, A.M.G.; Peterson, T. Observed coherent changes in climatic extremes during the second half of the twentieth century. Clim. Res. 2002, 19, 193–212. [Google Scholar] [CrossRef]
- Van den Besselaar, E.J.M.; Klein Tank, A.M.G.; van der Schrier, G. Influence of circulation types on temperature extremes in Europe. Theor. Appl. Climatol. 2010, 99, 431–439. [Google Scholar] [CrossRef]
- Kostopoulou, E.; Jones, P.D. Assessment of climate extremes in the Eastern Mediterranean. Meteorol. Atmos. Phys. 2005, 89, 69–85. [Google Scholar] [CrossRef]
- Keyantash, J.; Dracup, J.A. The quantification of drought: An evaluation of drought indices. Bull. Am. Meteorol. Soc. 2002, 83, 1167–1180. [Google Scholar] [CrossRef]
- Mishra, A.K.; Singh, V.P. A review of drought concepts. J. Hydrol. 2010, 391, 202–216. [Google Scholar] [CrossRef]
- Hayes, M.J.; Svoboda, M.D.; Wilhite, D.A.; Vanyarkho, O.V. Monitoring the 1996 drought using the standardized precipitation index. Bull. Am. Meteorol. Soc. 1999, 80, 429–438. [Google Scholar] [CrossRef]
- Sheffield, J.; Wood, E.F.; Roderick, M.L. Little change in global drought over the past 60 years. Nature 2012, 491, 435–438. [Google Scholar] [CrossRef]
- Guttman, N.B. Accepting the standardized precipitation index: A calculating algorithm. J. Am. Water Resour. Assoc. 1999, 35, 311–323. [Google Scholar] [CrossRef]
- Santos, J.F.; Pulido-Calvo, I.; Portela, M.M. Spatial and temporal variability of droughts in Portugal. Water Resour. Res. 2010, 46, W03503. [Google Scholar] [CrossRef]
- McKee, T.B.; Doeskin, N.J.; Kleist, J. The relationship of drought frequency and duration to time scales. In Proceedings of the 8th Conference on Applied Climatology, Anaheim, CA, USA, 17–22 January 1993. [Google Scholar]
- Livada, I.; Assimakopoulos, V.D. Spatial and temporal analysis of drought in Greece using the Standardized Precipitation Index (SPI). Theor. Appl. Climatol. 2007, 89, 143–153. [Google Scholar] [CrossRef]
- Zhang, Q.; Zou, X.K.; Xiao, F.J.; Lv, H.Q.; Liu, H.B.; Zhu, C.H.; An, S.Q. National Standard of the People’s Republic of China: Classification of Meteorological Drought (GB/T 20481-2006); China Standard Press: Beijing, China, 2006; pp. 3–6. [Google Scholar]
- Song, X.Y.; Li, L.J.; Fu, G.B.; Li, J.Y.; Zhang, A.J.; Liu, W.B.; Zhang, K. Spatial–temporal variations of spring drought based on spring-composite index values for the Songnen Plain, Northeast China. Theor. Appl. Climatol. 2014, 116, 371–384. [Google Scholar] [CrossRef]
- Allen, R.G.; Pereira, L.S.; Raes, D.; Smith, M. Crop Evapotranspiration: Guidelines for Computing Crop Water Requirements, FAO Irrigation and Drainage Paper 56; U.N. Food and Agriculture Organization (FAO): Rome, Italy, 1998; pp. 7–9. [Google Scholar]
- Mu, Q.Z.; Jackson, C.S.; Stoffa, P.L. A multivariate empirical–orthogonal–function–based measure of climate model performance. J. Geophys. Res. 2004, 109, D15101. [Google Scholar] [CrossRef]
- Hirsch, R.M.; Slack, J.R.; Smith, R.A. Techniques of trend analysis for monthly water quality data. Water Resour. Res. 1982, 18, 107–121. [Google Scholar] [CrossRef]
- Fu, G.B.; Charles, S.P.; Liu, C.M.; Yu, J.J. Decadal climatic variability, trends and future scenarios for the North China Plain. J. Clim. 2009, 22, 2111–2123. [Google Scholar] [CrossRef]
- Xu, Z.X.; Liu, Z.F.; Fu, G.B.; Chen, Y.N. Hydro-Climate Trends of the Tarim River Basin for the Last 50 Years. J. Arid. Environ. 2010, 74, 256–267. [Google Scholar] [CrossRef]
- Cruz, R.V.; Harasawa, H.; Lal, M.; Wu, S.; Anokhin, Y.; Punsalmaa, B.; Honda, Y.; Jafari, M.; Li, C.; Ninh, N.H. Asia. In Climate Change 2007: Impacts, adaptation and vulnerability; Working Group II to the Fourth Assessment Report of the Intergovernmental Panel on Climate Change, Ed.; Cambridge University Press: Cambridge, UK, 2007; pp. 469–506. [Google Scholar]
- Nandintsetseg, B.; Greene, J.; Goulden, C. Trends in extreme daily precipitation and temperature near Lake Hovsgol, Mongolia. Int. J. Climatol. 2007, 27, 341–347. [Google Scholar] [CrossRef]
- Sternberg, T.; Middleton, N.; Thomas, D. Pressurised pastoralism in South Gobi, Mongolia: What is the role of drought? Trans. Inst. Br. Geogr. 2009, 34, 364–377. [Google Scholar] [CrossRef]
- Lu, N.; Wilske, B.; Ni, J.; John, R.; Chen, J. Climate change in Inner Mongolia from 1955 to 2005—Trends at regional, biome and local scales. Environ. Res. Lett. 2009, 4, 1–6. [Google Scholar] [CrossRef]
- Pederson, N.; Hessl, A.E.; Nachin, B.; Anchukaitis, K.J.; Cosmo, N.D. Pluvials, droughts, the Mongol Empire, and modern Mongolia. Proc. Natl. Acad. Sci. USA 2014, 111, 4375–4379. [Google Scholar] [CrossRef]
- Nandintsetseg, B.; Shinoda, M. Assessment of drought frequency, duration, and severity and its impact on pasture production in Mongolia. Nat. Hazards 2013, 66, 995–1008. [Google Scholar] [CrossRef]
- Jeong, J.H.; Ou, T.; Linderholm, H.W.; Kim, B.M.; Kim, S.J.; Kug, J.S.; Chen, D. Recent recovery of the Siberian high intensity. J. Geophys. Res. 2011, 116, D23102. [Google Scholar] [CrossRef]
- Hasanean, H.M.; Almazroui, M.; Jones, P.D.; Alamoudi, A.A. Siberian high variability and its teleconnections with tropical circulations and surface air temperature over Saudi Arabia. Clim. Dyn. 2013, 41, 2003–2018. [Google Scholar] [CrossRef]
- Mazzarella, A.; Tranfaglia, G. Fractal characterisation of geophysical measuring networks and its implications for an optimal location of additive stations: An application to a rain-gauge network. Theor. Appl. Climatol. 2000, 65, 157–163. [Google Scholar] [CrossRef]
- Loukas, A.; Vasiliades, L. Probabilistic analysis of drought spatiotemporal characteristics in Thessaly region, Greece. Nat. Hazards Earth Syst. Sci. 2004, 4, 719–731. [Google Scholar] [CrossRef]


| Index | Descriptive Name | Definition | Unit |
|---|---|---|---|
| TXn | Coldest day | Minimum value of daily maximum temperature | °C |
| TNn | Coldest night | Minimum value of daily minimum temperature | °C |
| TX10p | Cold day frequency | Percentage of days when TX < 10th percentile | % |
| TN10p | Cold night frequency | Percentage of days when TN < 10th percentile | % |
| FD | Frost days | Annual count of days when TN (daily minimum temperature) < 0 °C | days |
| ID | Icing days | Annual count of days when TX (daily maximum temperature) < 0 °C | days |
| Drought Classification | SPI | CMDI |
|---|---|---|
| Non-drought | −0.5 < SPI | −0.6 < CMDI |
| Mild drought | −1.0 < SPI ≤ −0.5 | −1.2< CMDI ≤ −0.6 |
| Moderate drought | −1.5 < SPI ≤ −1.0 | −1.8< CMDI ≤ −1.2 |
| Severe drought | −2.0 < SPI ≤ −1.5 | −2.4< CMDI ≤ −1.8 |
| Extreme drought | SPI ≤ −2.0 | CMDI ≤ −2.4 |
| Slope | Mongolian Region | Chinese Region | Whole Region | Unit |
|---|---|---|---|---|
| TXn | −0.004 | 0.170 | 0.124 | °C/10 years |
| TNn | 0.018 | 0.375 | 0.280 | |
| TX_Ann | 0.387 | 0.270 | 0.301 | |
| TN_Ann | 0.288 | 0.471 | 0.422 | |
| TX10p | 0.014 | −0.505 | −0.332 | %/10 years |
| TN10p | 0.134 | −1.064 | −0.733 | |
| FD | −1.156 | −3.601 | −2.953 | days/10 years |
| ID | −1.832 | −2.656 | −2.478 |
© 2019 by the authors. Licensee MDPI, Basel, Switzerland. This article is an open access article distributed under the terms and conditions of the Creative Commons Attribution (CC BY) license (http://creativecommons.org/licenses/by/4.0/).
Share and Cite
Liu, Z.; Yao, Z.; Huang, H.; Batjav, B.; Wang, R. Evaluation of Extreme Cold and Drought over the Mongolian Plateau. Water 2019, 11, 74. https://doi.org/10.3390/w11010074
Liu Z, Yao Z, Huang H, Batjav B, Wang R. Evaluation of Extreme Cold and Drought over the Mongolian Plateau. Water. 2019; 11(1):74. https://doi.org/10.3390/w11010074
Chicago/Turabian StyleLiu, Zhaofei, Zhijun Yao, Heqing Huang, Batbuyan Batjav, and Rui Wang. 2019. "Evaluation of Extreme Cold and Drought over the Mongolian Plateau" Water 11, no. 1: 74. https://doi.org/10.3390/w11010074
APA StyleLiu, Z., Yao, Z., Huang, H., Batjav, B., & Wang, R. (2019). Evaluation of Extreme Cold and Drought over the Mongolian Plateau. Water, 11(1), 74. https://doi.org/10.3390/w11010074